")
Back to Journals » Diabetes, Metabolic Syndrome and Obesity » Volume 11
Alterations in the gene expression of drug and arachidonic acid-metabolizing Cyp450 in the livers of controlled and uncontrolled insulin-dependent diabetic mice
Authors Jarrar YB , Al-Essa L, Kilani A, Hasan M, Al-Qerem W
Received 30 April 2018
Accepted for publication 6 July 2018
Published 25 September 2018 Volume 2018:11 Pages 483—492
DOI https://doi.org/10.2147/DMSO.S172664
Checked for plagiarism Yes
Review by Single anonymous peer review
Peer reviewer comments 2
Editor who approved publication: Professor Ming-Hui Zou
Yazun Bashir Jarrar, Luay Al-Essa, Abdulhasib Kilani, Mariam Hasan, Walid Al-Qerem
Department of Pharmacy, College of Pharmacy, Al-Zaytoonah University of Jordan, Airport street, Amman, Jordan
Background: Diabetic patients have lower capacity to metabolize drugs in comparison to normal people. Therefore, the present study aimed to investigate the alterations in gene expression of drug and arachidonic acid metabolizing cytochrome p450s (cyp450s) in the livers of controlled (CDM) and uncontrolled (UDM) insulin-dependent diabetic mice.
Methods: Balb/c mice were treated with single dose of streptozocin (240 mg/kg) to induce diabetes and compared with control group, which was treated with citric buffer (pH =4.5). After 3 days, the blood glucose level was measured to confirm the induction of diabetes. Normalization of blood glucose level in diabetic mice was achieved after 0.1 mL/kg Mixtard® insulin therapy for more 5 days. Then, the mice livers were isolated to extract RNA and convert it to cDNA. The gene expression of 14 genes, which play a major role in drug and arachidonic acid metabolism, were measured using quantitative real-time polymerase chain reaction technique.
Results: It was found that the gene expression was downregulated (ANOVA test, P-value <0.05) in the livers of UDM mice. The most downregulated genes were cyp4a12, cyp1a2, and slc22a1 with more than 10-fold reduction. The livers of CDM mice showed significantly (P-value <0.05) higher levels of mRNA than UDM mice, but still lower than the non-diabetic mice.
Conclusion: This study concluded that hepatic gene expression of drug metabolizing and arachidonic acid- cyp450 enzymes is reduced in insulin-dependent diabetic mice, which can explain, at least in part, the variation in drug and fatty acid metabolism between normal and diabetic patients.
Keywords: drug metabolism, gene expression, diabetes, insulin, arachidonic acid, CYP450s, UGTs
Introduction
Diabetes mellitus (DM) is an endocrine disorder, which elevates blood glucose level.1 The prevalence of DM worldwide is high, including Middle Eastern countries. It is found that the prevalence of diabetes in Jordan and Syria is 17.1% and 15.6%, respectively.2,3
Diabetes may lead to micro- and macrovascular damage to several organs if it is uncontrolled.4 It affects heart, kidney, eyes, nerves, blood vessels, immune, and liver, which is the main site of drug metabolism.5–7
Diabetic patients are at high risk of developing liver failure, steatosis, and cancer.8,9 In addition, DM was reported to alter the hepatic capacity toward drug metabolism. Irshaid et al, found that insulin-dependent diabetic patients have lower capacity to metabolize the antibiotic dapsone than non-insulin-dependent diabetic and healthy volunteers.10 In addition, the amount of hepatic mRNA, protein, and enzymatic activity of human CYP/CYP450 (CYP450) 3A4 and UDP- glucuronosyltransferase (UGT) 2B7 were reduced in diabetic patients.11,12
In diabetic rat models using streptozotocin and alloxan, it has been observed that the metabolism of aminopyrine and CYP450 content were suppressed and insulin therapy could normalize the hepatic drug metabolism.13
The role of arachidonic acid-CYP450 metabolizing enzymes, in the liver, is not fully understood.14 However, it is found that accumulation of fats in the liver is associated with reduction of hepatic CYP4A expression, which indicated a protective role of CYP4A enzyme through metabolism of different fatty acids, such as arachidonic and lauric acid.15 Although the gene expression and enzyme activity of arachidonic acid metabolizing hydroxylase and epoxygenase were altered in different organs among cardiovascular disease patients,16 there is limited information regarding arachidonic acid-cyp450 pathway in the liver of diabetic patients. It is reported that CYP4A gene expression was upregulated in the liver of high-fat feed type II diabetic mice model.17
The gene expression profile of Phase I and II drug- and arachidonic acid-metabolizing enzymes were not fully investigated in the livers of insulin-dependent diabetic patients. Alterations in the gene expression of these enzymes may influence the pharmacokinetics and hence the drug response and hepatotoxicity among diabetic patients.18 Therefore, the present study aimed to analyze the gene expression of Phase I and II drug- and arachidonic acid-metabolizing enzymes in controlled and uncontrolled insulin-dependent diabetic mice models.
Methods
Chemicals
Streptozocin, citric acid, sodium citrate, isopropyl alcohol, and 75% ethanol were obtained from Sigma-Aldrich (St. Louis, MO, USA). Human insulin Mixtard®, which contained 30% of soluble insulin and 70% of isophane insulin, was purchased from Novo Nordisk (Bagsvaerd, Denmark). The Trizol solution and cDNA synthesis kit were bought from Thermo Fisher Scientific (Waltham, MA, USA). The polymerase chain reaction (PCR) primers were bought from Integrated DNA technologies (Coralville, IA, USA). The Taq polymerase buffer, deoxynucleotide triphosphates (dNTPs), nuclease-free water, DNA ladder, and MgCl2 were earned from (Promega, Madison, WI, USA). Agarose gel and gel electrophoresis buffer were bought from (Bio-basic, Markham, ON, Canada). Finally, the Redsafe dye was bought from (iNtRON Biotechnology, Seoul, South Korea).
Experimental animals
Twenty eight Balb/c mice (Mus musculus), weighing 24–28 g and of similar age were purchased from the animal house of Applied Science Private University (Amman, Jordan). The mice were cared in accordance with the guide of Canadian Council on Animal Care,19 and the study protocol was approved by the ethical committee at Al-Zaytoonah University of Jordan (2017–2016/22/40). The mice were housed at 23°C ± 1°C, and 12 hours light–12 hours dark cycle. All animals were separately caged and maintained on standard laboratory animal diet pellets ad libitum.
Experimental protocol
Following a period of stabilization (7 days), the mice were divided into 4 groups of, 7 mice each, as follows:
- Control group, which was treated with the vehicle 0.1 M citric acid buffer (0.1 citric acid monohydrate and 0.1 M trisodium citrate and adjusted to pH =4.5) by intraperitoneal route.
- Uncontrolled DM (UDM) insulin-dependent group, which was treated with single intraperitoneal 240 mg/kg streptozocin, solubilized in cold and freshly prepared citric buffer.
- Controlled DM (CDM) insulin-dependent group, which was treated with single intraperitoneal 240 mg/kg streptozocin. Then after 3 days, the diabetic mice were treated with 1 unit/kg/day of Mixtard® insulin for 5 continuous days. The dose of insulin used in this study was equivalent to the dose used in human and it was used previously on the experimental mice.20
- Insulin-treated hypoglycemic group, which received no streptozocin but exposed to 1 unit/kg/day of Mixtard® insulin for 5 continuous days.
Physical observation
Daily observation throughout the study was made for mortality and general well-being in the diabetic and non-diabetic groups. The mice body weight was monitored at the beginning of treatment and after 8 days of treatment. The consumption of water and food was monitored by weighting the average amount of food (in g) and water (in mL) consumed per mouse, respectively.
Analysis of blood glucose level
The blood glucose level was measured using Accu-Chek Performa® (Roche, Basel, Switzerland). The blood drops obtained from the tail of the experimental mice. The blood glucose analyses were done before streptozocin treatment, after 3 days of streptozocin treatment and after 5 days of insulin treatment. The mouse was considered as diabetic when the fasting blood glucose was >200 mg/dL.21
RNA extraction and cDNA synthesis
Around 100 mg of the liver samples were isolated from the mice. Then, total RNA was extracted and purified using Trizol RNA extraction solution (Thermo Fisher Scientific), isopropyl alcohol, and 75% ethanol, according to the manufacturer’s instructions. After that, RNA was converted to cDNA using cDNA Synthesis Kit® (Thermo Fisher Scientific). Briefly, 3 mg of total RNA was added to a reaction mixture containing 100 pmol oligo deoxythymine, 2.5 mM dNTP, 0.1 M DTT, 1X reverse transcriptase buffer, and 100 unit of Moloney murine leukemia virus reverse transcriptase and incubated at 42°C for 1 hour. The RNA and cDNA concentrations were measured using the Nanodrop instrument Quawell DNA/Protein Analyzer (Quawell, Sunnyvale, CA, USA).
Gene expression analysis
Quantitative real-time PCR was performed using Bio-Rad CFX96 machine (Bio-Rad, Berkeley, CA,, USA). Briefly, 1 ng of cDNA was added to a reaction mixture containing SYBR™ Green PCR Master Mix (Thermo Fisher Scientific) and selective primers (Table 1) for cDNA sequence of drug- and arachidonic acid-metabolizing enzymes. The PCR condition used was as follows: denaturation at 95°C for 3 minutes followed by 40 cycles of denaturation at 95°C for 10 seconds and annealing at 53°C for 30 seconds. The gene expression of the targeted genes was normalized to the expression of the house keeping gene gapdh, as described previously,22 using the following formula: ΔCT = CT (metabolizing gene)−CT (gapdh gene), where Ct is the PCR threshold cycle at which the fluorescence level rises above a baseline. Then, the relative gene expression was calculated as 2−ΔΔCT. The ΔΔCT is the difference of ΔCT between the treated and control group.
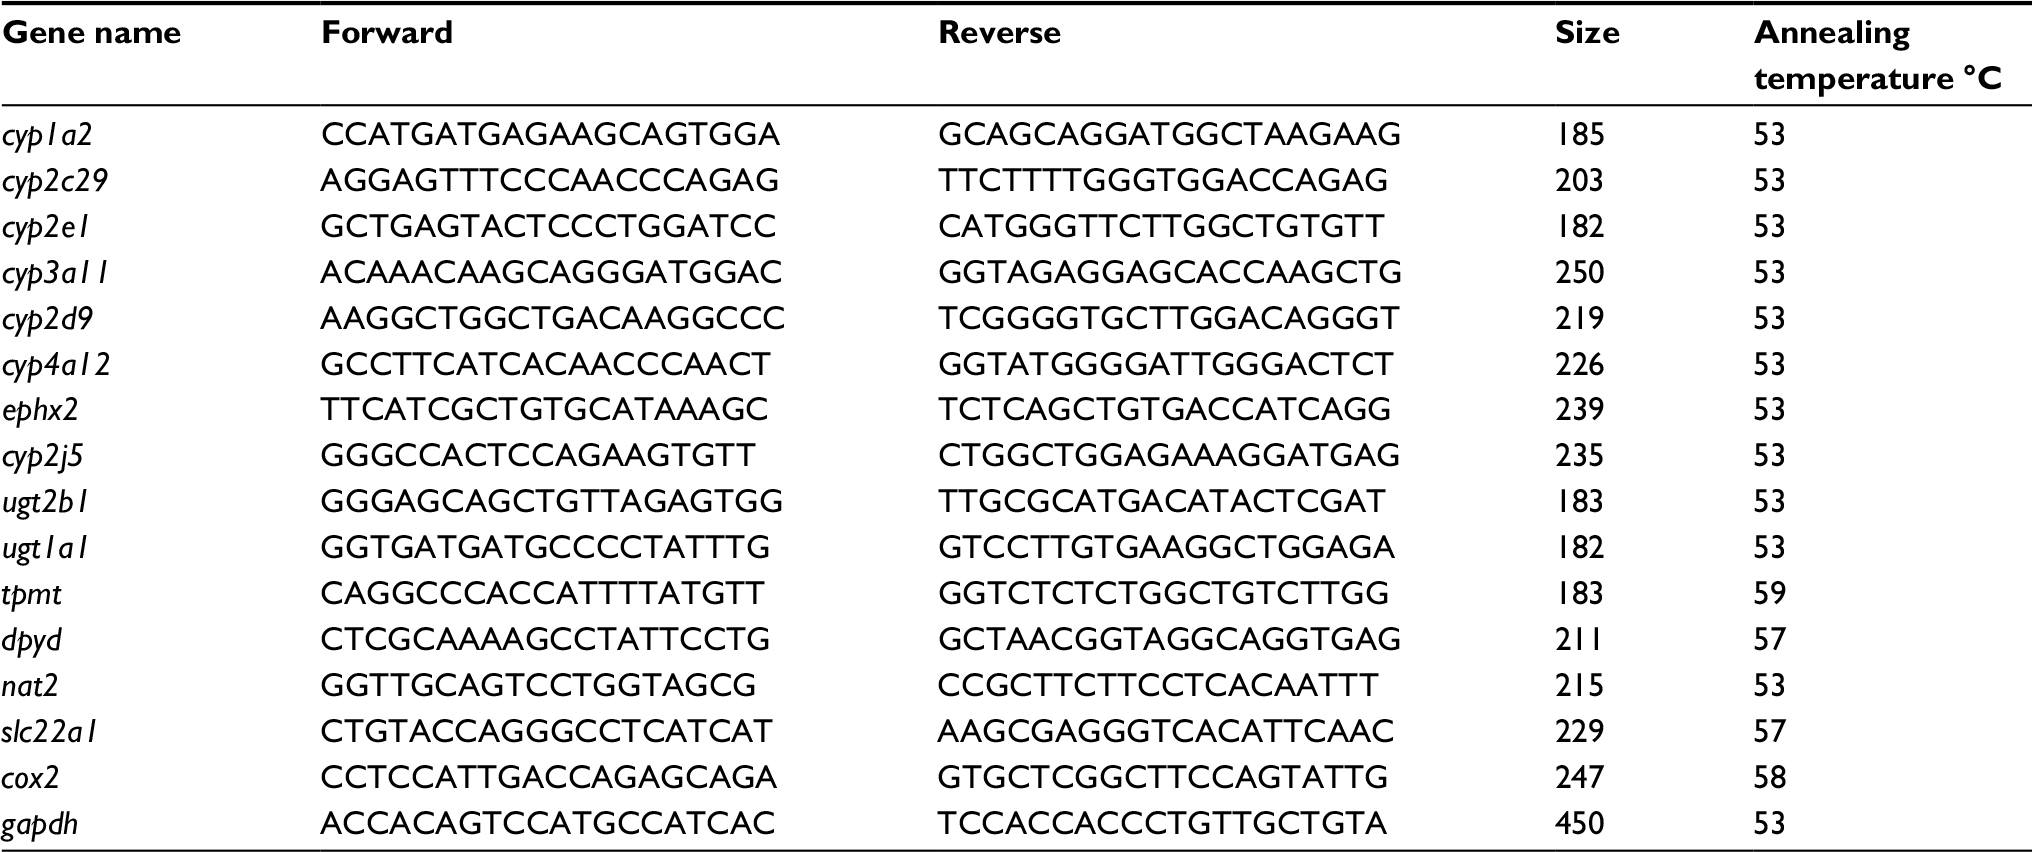 | Table 1 Primers names, sequence, applicant size, and annealing temperature used in real-time PCR |
Conventional PCR
The PCR was done as prescribed previously.23,24 Briefly, synthesized cDNA (330 ng) underwent 35 cycles of PCR amplification in a 20 µL reaction volume containing 10 mM dNTPs, 25 mM MgCl2, 10 pmol from each of the forward and reverse primers of cyp4a12, nat2, slc22a1, and gapdh genes (Table 1), and 1.5 unit of Go-Taq DNA polymerase.
Gel electrophoresis
The products of conventional reverse-transcriptase PCR were separated on 1.5% agarose gel after applying electrical current of 125 Ampere. The gel was stained using Redsafe dye. Comparison of the size was done between the PCR products and the standard size 100 bp DNA loading ladder. The DNA was seen by UV transilluminator (Bio Doc-ITTM, Cambridge, UK).
Statistical analysis
The results in this study were expressed by the average ± SD. ANOVA test was used as a statistical tool for comparison between the tested groups. Statistically significant changes compared with the control groups were indicated as *P<0.05.
Results
Streptozocin was used to induce diabetes in mice. After 3 days of 240 mg/kg streptozocin injection, the blood glucose levels of the streptozocin-treated animals were elevated significantly >400 mg/dL, while the blood glucose levels of the control group were within the normal levels <125 mg/dL. Figure 1 shows that 5 days treatment of 1 unit/kg/day Mixtard® insulin normalized the blood glucose level (<125) in the CDM group. The last group was treated with only 1 unit/kg/day Mixtard® insulin, which exhibited hypoglycemic effect and reduced the blood glucose level below 59 mg/dL. This hypoglycemia was associated with the death of 40% of the treated mice and finally, this group contained 4 mice for gene expression analysis.
 | Figure 1 Blood glucose levels of the experimental animals. Notes: The blood was obtained from the tail of the experimental mice, and glucose level was analyzed using Accu-Chek Performa® (Roche, Basel, Switzerland). The glucose levels were presented as mean ± SD. “*” refers to significant difference (P-value<0.05) of blood glucose levels, compared with the levels at day 1. Abbreviations: CDM, controlled diabetes mellitus; UDM, uncontrolled diabetes mellitus. |
As shown in Table 2, the water consumption was increased >5-fold in the UDM group, which is a symptom of polydipsia among the diabetic mice. The polydipsia was less observed in the CDM group, where the water consumption was just 2-fold more than the control mice. The insulin-treated group showed higher water (3-fold) and food consumption (2-fold) than the control group (Table 2).
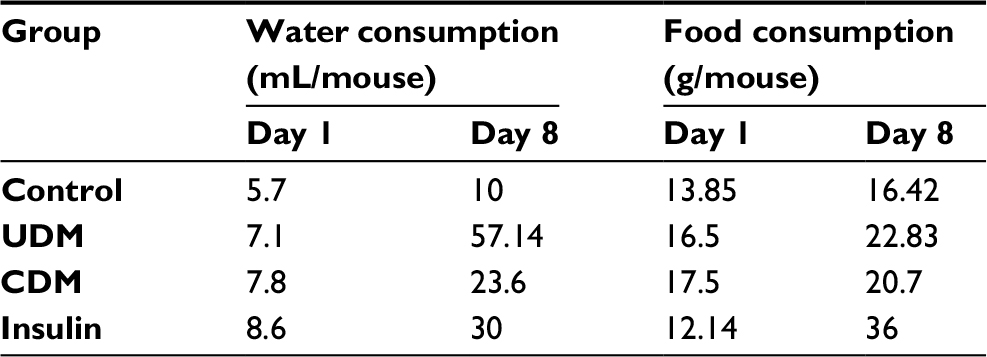 | Table 2 Food and water consumption in the treated mice Notes: UDM refers to uncontrolled diabetic mice while CDM is an abbreviation for controlled diabetic mice. Abbreviations: CDM controlled diabetes mellitus; UDM, uncontrolled diabetes mellitus. |
The weight of UDM group was reduced significantly (P-value <0.05) from 26±5 g at the first day of the experiment to 20.3±3 g at day 8 of this study (Figure 2). The insulin treatment prevented the sharp decline in the body weight of the CDM, where the body weight was 26±3 g at day 8 of this experiment (Figure 2).
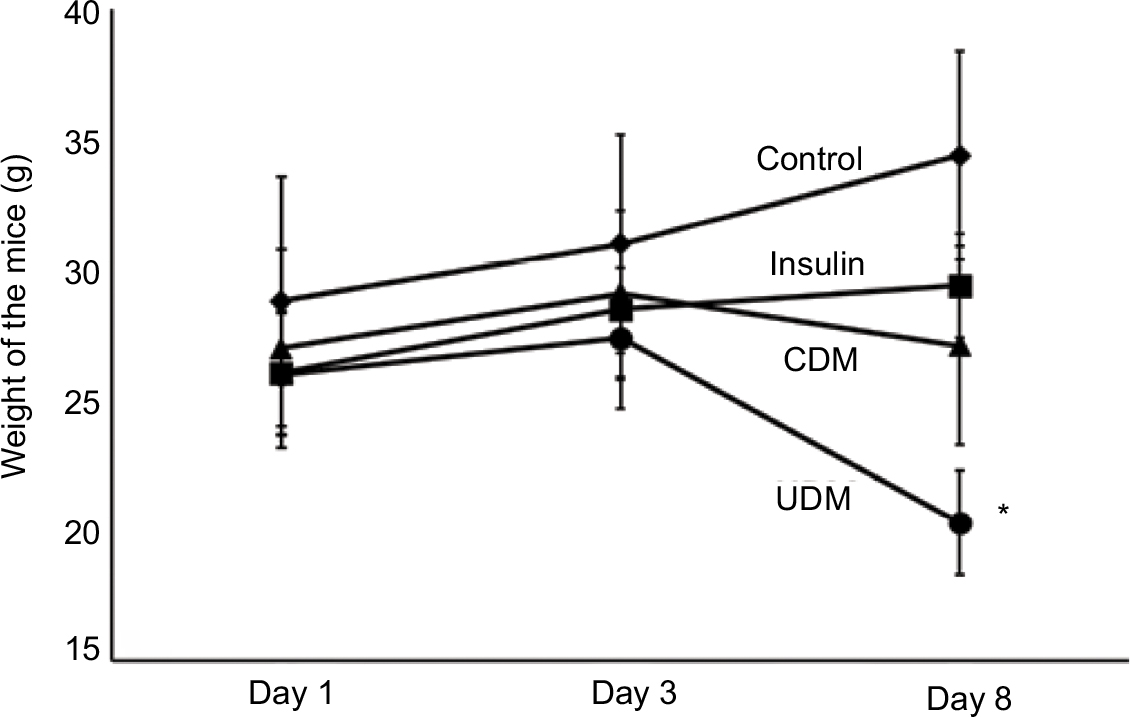 | Figure 2 The changes in body weight of the experimental mice. Notes: The body weights of the mice were measured 3 times: at day 1, 3, and 8. The weights were presented as mean ± SD. “*” refers to significant difference (P-value<0.05), compared with the control group weight at day 8. Abbreviations: CDM, controlled diabetes mellitus; UDM, uncontrolled diabetes mellitus. |
As diabetic animals showed polydipsia and reduction in body weight, these data indicated that the diabetic model induced in this study was insulin-dependent type I diabetes.25
Regarding gene expression, the mRNA levels of arachidonic acid- and drug-metabolizing-cyp450s were significantly reduced in livers of diabetic mice (Figures 3–5). The most affected genes among arachidonic and drug-metabolizing cyp450 genes were cyp1a2 and cyp4a12 with down-regulation in gene expression by 16.9- and 10.7-fold, respectively. The gene expression of cyp2e1 and cyp2c29 was reduced by only 4.3- and 4.2-fold, respectively, which showed the lowest influence by DM compared with other cyp450s (Figure 3B, C). However, 5 days of insulin treatment attenuated significantly (P-value <0.05) the effect of DM on cyp450 gene expression (Figures 3 and 5). The livers of hypoglycemic insulin-treated mice did not show significant difference compared with the control group, except that cyp3a11 was induced significantly (P-value <0.05) to >2-fold (Figure 3E).
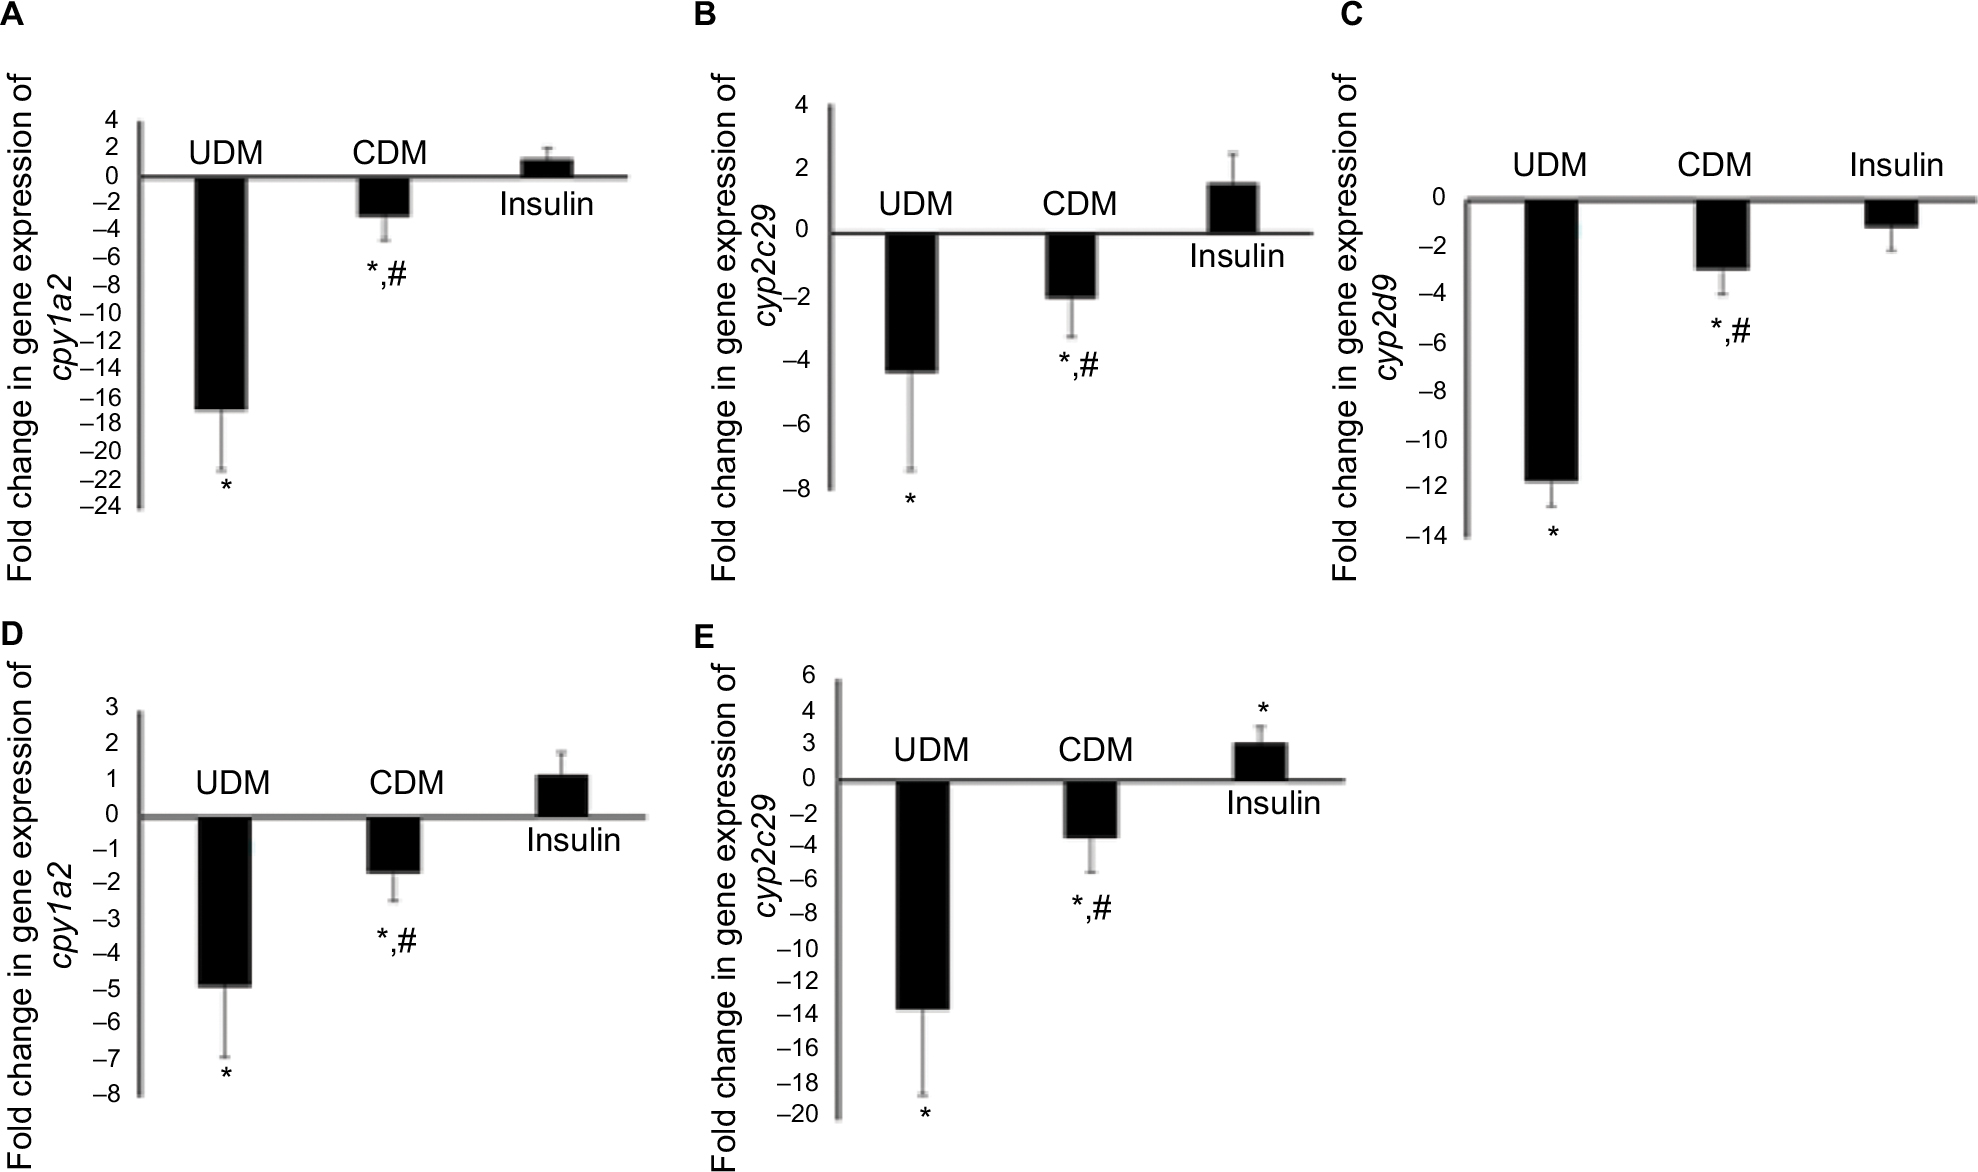 | Figure 3 Gene expression of Phase I drug-metabolizing (A–E) enzymes in the liver of the tested mice. Notes: Total RNA was isolated from the livers then converted to cDNA. The gene expression was analyzed using real-time PCR with SYPER green die. Further details are provided in the Methods section. “*” refers to significant difference (P-value<0.05) compared with the control group, while “#” means significant difference (P-value<0.05) compared with the UDM. Abbreviations: CDM, controlled diabetes mellitus; PCR, polymerase chain reaction; UDM, uncontrolled diabetes mellitus. |
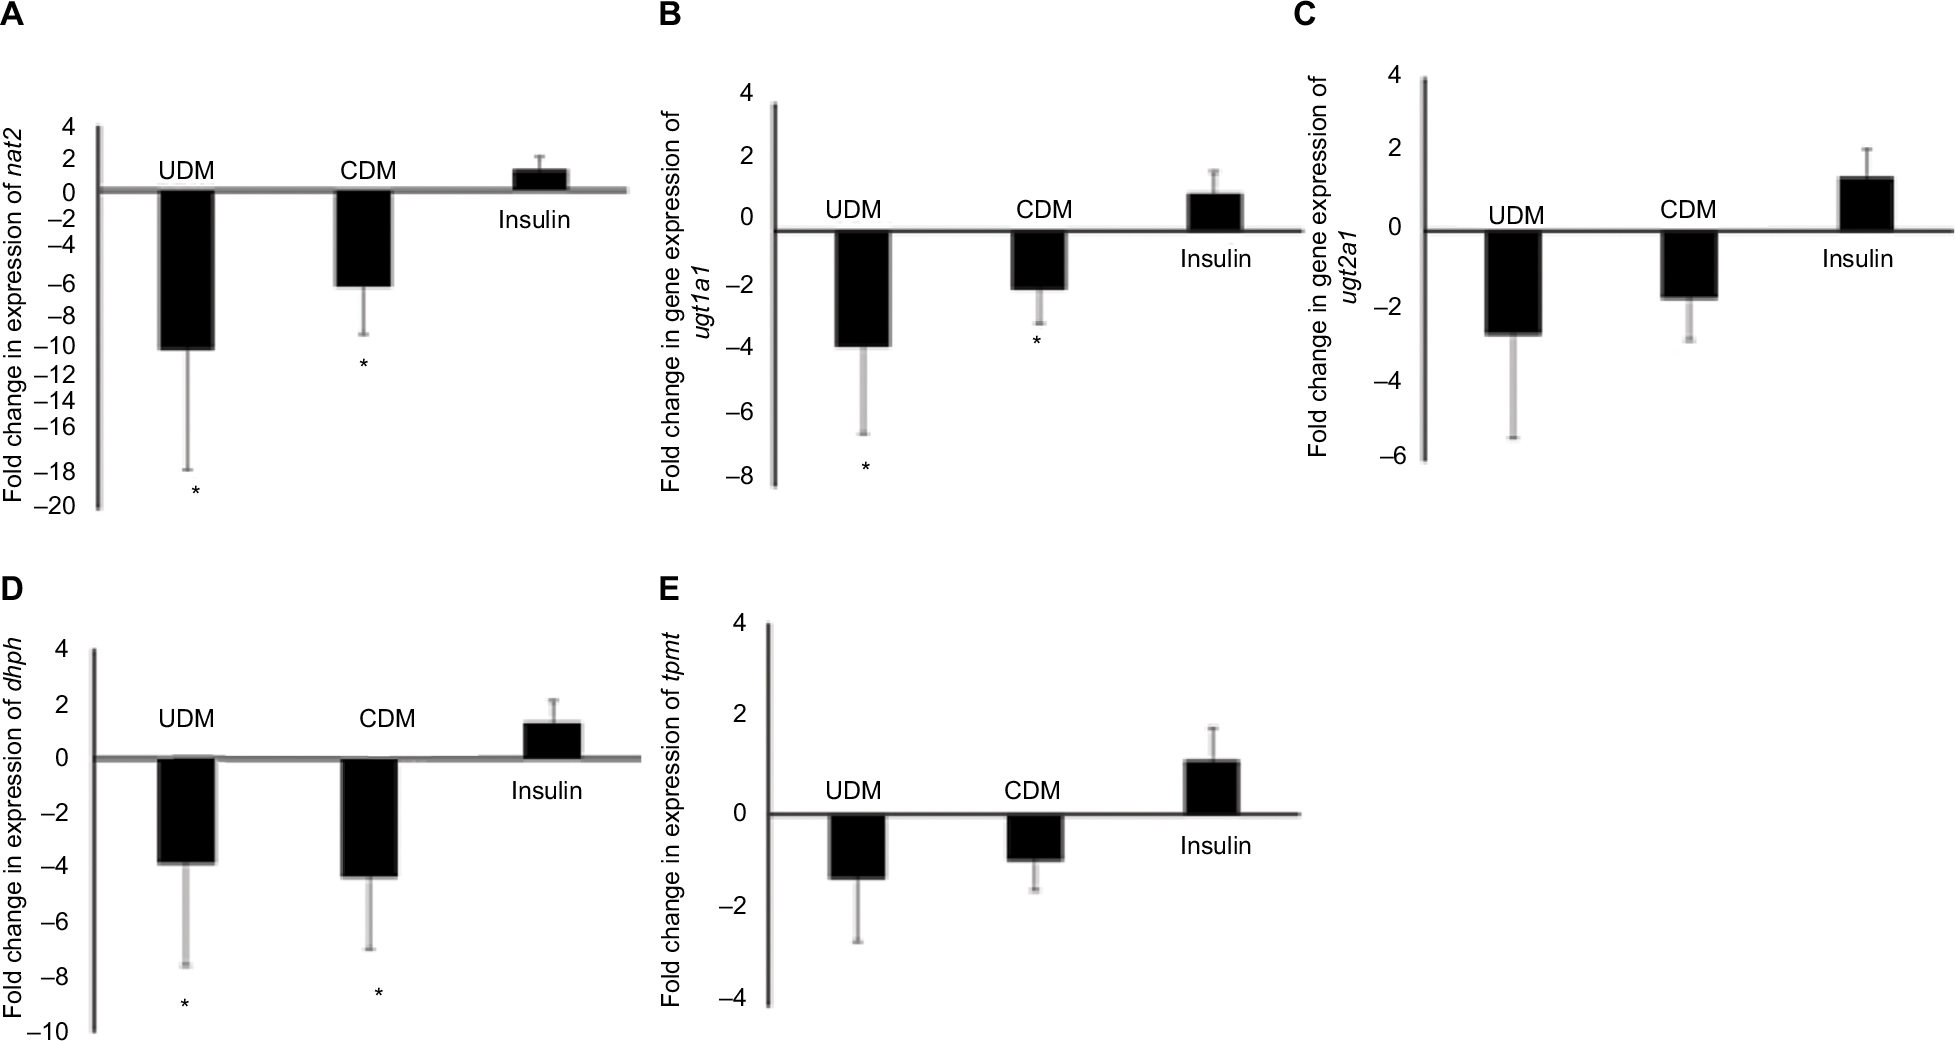 | Figure 4 Gene expression of Phase II drug-metabolizing enzymes (A–E) in the liver of the tested mice. Notes: Total RNA was isolated from the livers then converted to cDNA. The gene expression was analyzed using real-time PCR with SYPER green die. Further details are provided in the Methods section. “*” refers to significant difference (P-value<0.05) compared with the control group, while “#” means significant difference (P-value<0.05) compared with the UDM. Abbreviations: CDM, controlled diabetes mellitus; PCR, polymerase chain reaction; UDM, uncontrolled diabetes mellitus. |
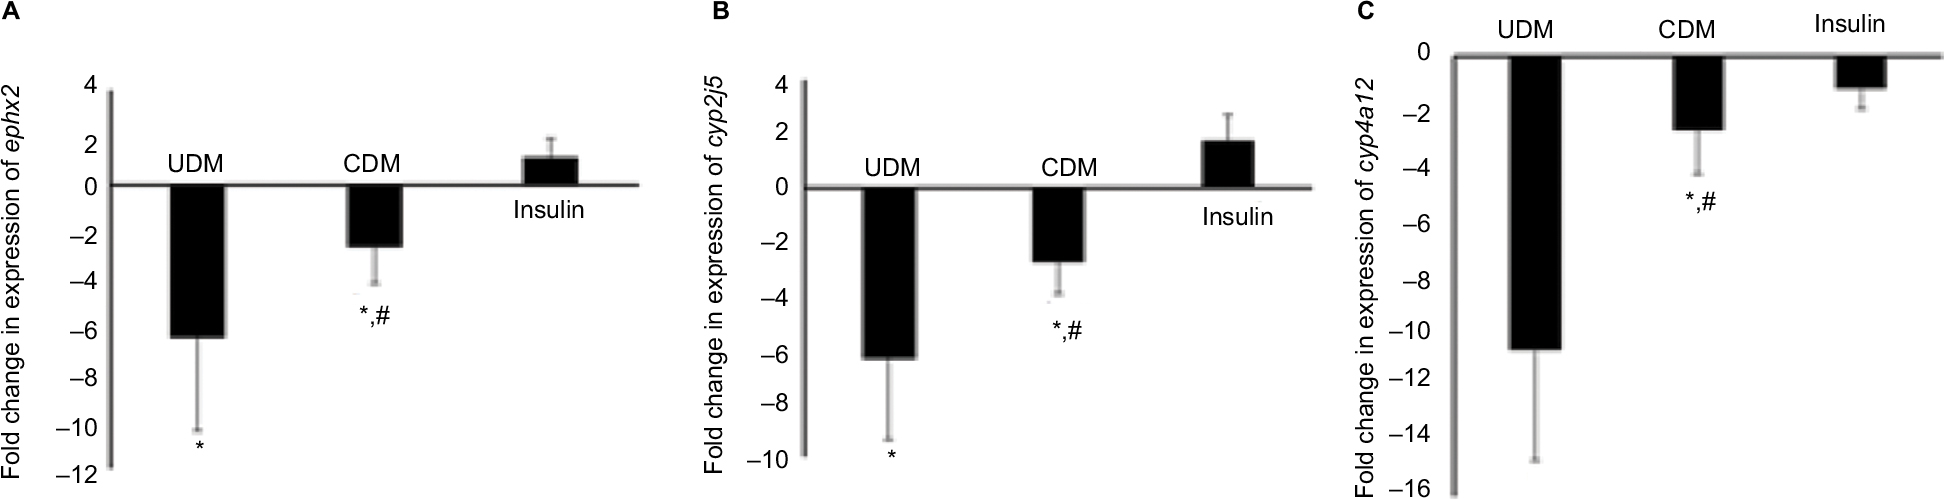 | Figure 5 Gene expression of arachidonic acid-cyp450s (A–C) in the liver of the tested mice. Notes: Total RNA was isolated from the livers then converted to cDNA. The gene expression was analyzed using real-time PCR with SYPER green die. Further details are provided in the Methods section. “*” refers to significant difference (P-value <0.05) compared with the control group, while “#” means significant difference (P-value <0.05) compared with the UDM. Abbreviations: CDM, controlled diabetes mellitus; PCR, polymerase chain reaction; UDM, uncontrolled diabetes mellitus. |
Phase II drug-metabolizing enzymes were also reduced in the livers of the UDM mice (Figure 4). Although, Phase II drug-metabolizing enzymes were less influenced by DM than Phase I enzymes, the most influenced gene among Phase II metabolizing enzymes were nat2, where it was reduced by >10-fold in UDM (Figure 4A). The gene expression of ugt1a1, 2b1, and dhpd were reduced by 3.6-, 2.7-, and 3.8-fold, respectively (Figure 4B–D). In addition, insulin treatment failed to attenuate significantly (P-value >0.05) the effect of DM on nat2, ugt2b5, and dhpd genes (Figure 4A, C, D). The mRNA levels of tpmt gene did not differ significantly in all treated groups (Figure 4E).
Furthermore, the gene expression of drug transporter gene slc22a1 was reduced significantly to 7-fold in UDM but attenuated significantly by insulin treatment (Figure 6).
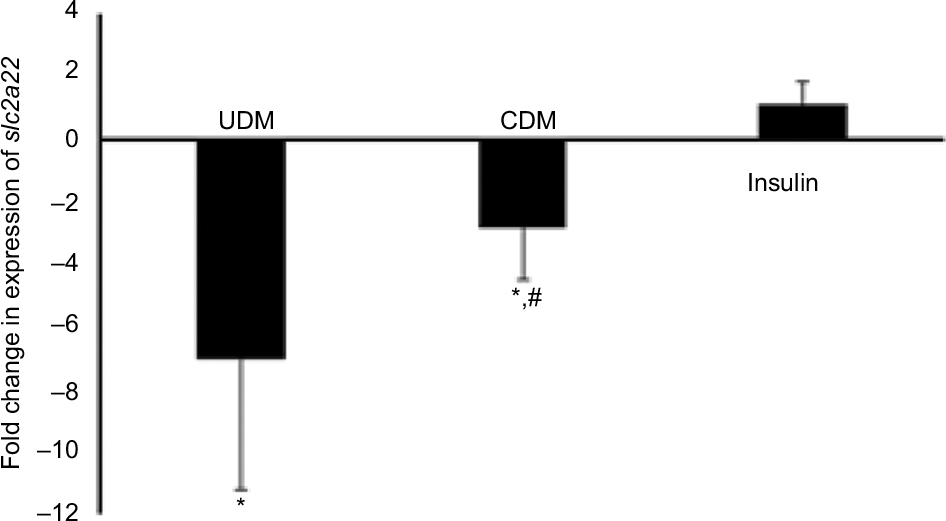 | Figure 6 Gene expression of drug transporter gene slc22a1 in the liver of the tested mice. Notes: Total RNA was isolated from the livers then converted to cDNA. The gene expression was analyzed using real-time PCR with SYPER green die. Further details are provided in the Methods section. “*” refers to significant difference (P-value <0.05) compared with the control group, while “#” means significant difference (P-value <0.05) compared with the UDM. Abbreviations: CDM, controlled diabetes mellitus; PCR, polymerase chain reaction; UDM, uncontrolled diabetes mellitus. |
In addition, we confirmed the reduction in the gene expression of cyp4a12, nat2, and slc22a1 genes, which were highly influenced drug- and arachidonic acid-metabolizing enzyme genes, using reverse transcriptase PCR. As it is shown on Figure 7, the intensity of the PCR bands of cyp4a12, nat2, and slc22a1 genes, obtained from the livers of control mice, was higher than of the PCR bands obtained from the UDM group.
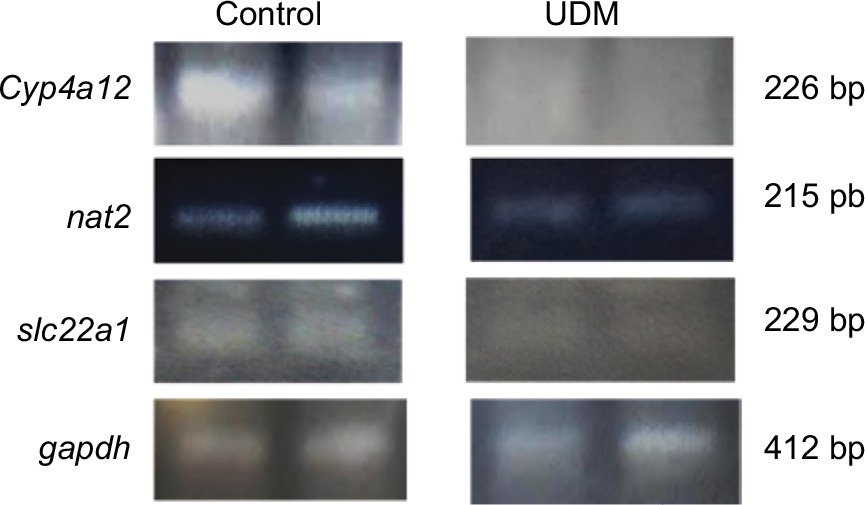 | Figure 7 Reverse transcriptase PCR for the major downregulated genes in the livers of diabetic mice. Notes: The RNA was extracted from the livers of UDM and non-diabetic control group. Then, the RNA was converted to cDNA. The cyp4a12, nat2, and slc22a1 genes were amplified using conventional PCR. The gapdh gene was amplified as housekeeping gene to normalize the expression of the tested genes. Then, the PCR products were run on 1.5% agarose gel. The PCR bands were visualized after staining of the gel with Redsafe dye. Further details are in the Materials and Methods section. Abbreviations: PCR, polymerase chain reaction; UDM, uncontrolled diabetes mellitus. |
Finally, the current study analyzed the gene expression of the inflammation marker gene cyclo-oxygenase (cox2) and found its expression was increased >4-fold in UDM and attenuated to 1.8-fold after insulin therapy (Figure 8).
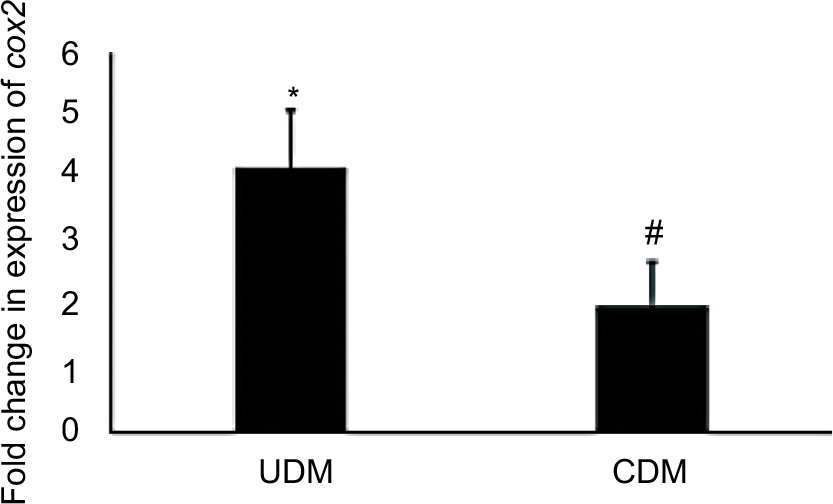 | Figure 8 Gene expression analysis of cox2 gene in the livers of diabetic mice. Notes: “*” refers to significant difference (P-value <0.05) compared with the control group, while “#” means significant difference (P-value <0.05) compared with the UDM. Abbreviations: CDM, controlled diabetes mellitus; PCR, polymerase chain reaction; UDM, uncontrolled diabetes mellitus. |
Discussion
Clinical studies showed that insulin-dependent diabetic patients have reduced capacity to metabolize drugs.10,12 The preset study investigated the alterations in gene expression of 14 genes involved in drug and arachidonic acid metabolism in the livers of insulin-dependent diabetic mice. We found that diabetic mice have significant decline in the mRNA levels of all tested drug- and arachidonic acid-metabolizing enzymes. Moreover, normalizing the blood glucose levels, using insulin, reversed significantly the decline in gene expression. It was also observed that hepatic cyp3a11 was induced in hypoglycemic mice. These alterations may explain, at least in part, the variation in drug metabolism and hence its response among insulin-dependent diabetic patients. The findings of this study may increase our understanding of the molecular changes in the hepatic metabolism of drugs and fatty acids among diabetic patients.
The present study used streptozocin as a chemical compound to induce diabetes in the mice. Streptozocin destroys the beta-pancreatic cells, which makes them unable to produce insulin and results into elevated blood glucose level.26 The streptozocin-induced diabetes is the most common animal model used to study the morphological, biochemical, and molecular alterations induced by DM.27 However, streptozocin itself can influence harmfully the liver cells.28 The alterations in gene expression of drug and arachidonic and metabolizing enzymes, found in this study, might be due to the hyperglycemia rather than the direct effect of streptozocin on the liver; where the reduction in gene expression was attenuated by normalizing the blood glucose levels.
Diabetes is reported to cause hepatic impairment. The gene expression of drug- and arachidonic acid-metabolizing enzymes were altered in hepatic dysfunction and drug-induced hepatotoxicity. Some studies showed that the gene expression and the capacity of drug-metabolizing enzymes decreased in patients with hepatic dysfunctions.29,30 In addition, it is reported that the gene expression of drug-metabolizing enzymes was reduced in hepatic injury and diseases, such as cirrhosis and sepsis.31,32 The antituberculosis rifampin induced hepatotoxicity in mouse livers, which was coupled with down-regulation of arachidonic acid-cyp450s.33 Furthermore, the inflammatory mediator interleukin, which is released during hepatic injury,31 decreased the gene expression of Phase I and II drug-metabolizing enzymes and drug transporters.34 It is reported that inflammatory mediators were elevated in the livers of diabetic patients,35 and we showed in this study that gene expression of inflammatory biomarker cox2 was increased significantly (P-value <0.05) in the livers of UDM. These might indicate that the inflammatory mediators play a role in the down-regulation of drug- and arachidonic acid-metabolizing enzymes in the livers of diabetic mice.
The mouse cyp3a11, cyp2c29, and cyp2d9 are a homology of human CYP3A4, CYP2C9, and CYP2D6, respectively. These CYP450s are the major Phase I drug-metabolizing enzymes, which oxidize >80% of the drugs.36 It is pointed out that CYP3A4 substrate antipyrine metabolism was lower in diabetic patients than normal volunteers.37 In addition, midazolam and testosterone hydrolyzation were reduced in the human liver microsomes isolated from diabetic livers, which were associated with reduced CYP3A4 protein and mRNA levels.11,12 Furthermore, Kudo et al, found that intestinal cyp3a and hepatic cyp2c29 and cyp2d9 mRNA levels were reduced in diabetic mice.38 The results of this study are in line with the previous studies where gene expression of drug-metabolizing cyp450s was significantly lower in UDM than control mice. This down-regulation of drug-metabolizing cyp450s may explain, at least in part, the reduction of oxidation capacity toward drugs among insulin-dependent diabetic patients. Further studies are needed to correlate between the gene expression levels of cyp450s and drug oxidation.
Arachidonic acid-metabolizing cyp450s convert arachidonic acid to cardioactive compounds. Cyp4a12 synthesize the platelet activator and vasoconstrictor 20-hydroxyeicosatetraenoic acid (20-HETE), while cyp2c29 and cyp2j5 metabolize arachidonic acid to the vasodilator epoxyeicosatrienoic acids (EETs).39 All of the arachidonic acid-metabolizing cyp450 genes were reduced significantly in this study. However, 20-HETE-synthesizing genes were downregulated (>10-fold) more than EETs producing genes. It is showed that alterations of gene expression of arachidonic acid-metabolizing cyp450s, influenced on 20-HETE and EETs metabolite levels.40 This may indicate that the ratio of 20-HETE to EETs synthesis was reduced in the livers of diabetic mice. The role of 20-HETE and EETs in the pathophysiology of the liver is still not understood. Although, it is suggested that down-regulation of cyp4a12 decreases the ability to metabolize fatty acid in the liver,15 this reduction in fatty acid metabolism may deposit fatty acids in the liver. The fatty liver was reported in diabetic patients.8 Therefore, the observed reduction in arachidonic acid-cyp450 gene expression, in this study, may contribute to the pathogenesis of the liver tissues among insulin-dependent diabetes.
UGTs also play a major role in endogenous and drug metabolism.39 They metabolize 10% of all prescribed drugs, such as morphine.41 In addition, they are reported to metabolize arachidonic acids.39 It is found clinically that diabetic patients have lower capacity to form acyl glucuronide mycophenolic acid, which was associated with lower human UGT2B7 protein expression in the liver and kidney.12 The present study found that mouse ugt2b1, which is a homology of human UGT2B7, was downregulated by 3.4-fold. In addition, we found for the first time that hepatic ugt1a1 gene, which encodes ugt1a1 enzyme and metabolizes the anticancer irinotecan,42 was also downregulated among UDM. Therefore, it is speculated that the rate of activation of irinotecan is low among insulin-dependent diabetic patient on irinotecan therapy. Although, insulin therapy did not attenuate significantly the down-regulation of ugt genes, this might indicate that molecular regulation of ugt genes is different than cyp450s in the diabetic livers.
This study observed for the first time that gene expression of nat2 gene, which acetylates the drugs, was the most affected Phase II drug-metabolizing enzymes in the liver samples of diabetic mice. This finding is in line with the study of Irshaid et al, where the antimicrobial dapsone acetylation capacity was reduced among insulin-dependent patients.10 Therefore, down-regulation of the hepatic nat2 gene may explain the reduced capacity of drug acetylation among diabetic human patients.
The organic cation transporter 1 (OCT1) mediates the transportation of some drugs, such as the antidiabetic metformin, to the hepatic tissue.43 It is found in this study that OCT1 encoding gene slc22a1 was reduced in UDM but reversed, by insulin therapy, in CDM. It is reported that oct1 expression was reduced in streptozocin-induced diabetic rats and influenced the kinetics of tetraethylammonium.44 Therefore, it is speculated that the pharmacokinetics and hence the response of oct1 substrates, such as metformin, is different between normal and diabetic patients. Further intensive studies are needed to find the correlation between hepatic slc22a1 expression and metformin response in diabetic patients.
It is shown that insulin treatment induced several gene expression in different organs, including the liver.45 In this study, we showed that insulin treatment reversed significantly the decline in mRNA of arachidonic and drug-metabolizing enzymes. However, 5 days treatment of insulin therapy of diabetic mice did not show comparable mRNA levels of arachidonic and drug-metabolizing enzymes to the control group. This might be due to the short duration of insulin therapy (5 days) used in the experiment design of this study. However, the decline in the drug metabolism capacity was also observed among controlled diabetic human volunteers.10 Moreover, it is found in this study that insulin induced significantly cyp3a12 mRNA levels in the livers of hypoglycemic mice. This finding confirmed what was found in Davidson et al study, that human CYP3A4 was induced in the primary human hepatocytes after insulin treatment.46 This may indicate that hypoglycemic patients have higher capacity to metabolize CYP3A4 substrate drugs, which influence the pharmacokinetics and hence drug response. Further clinical studies are needed to find the metabolism rate of CYP3A4 substrates among hypoglycemic patients.
Conclusion
The present study investigated the alterations in gene expression of arachidonic and drug-metabolizing enzymes in the livers of insulin-controlled and non-controlled diabetic and hypoglycemic mice and found that hyperglycemia decreased sharply while insulin attenuated this down-regulation in arachidonic and drug-metabolizing enzymes in diabetic mice. In addition, insulin induced cyp3a11 in the hypoglycemic group. These molecular alterations may help us in understanding the variation in drug metabolism and drug response between controlled and non-controlled diabetic patients compared with healthy people.
Acknowledgment
This work was supported by Deanship of Scientific Research at Al-Zaytoonah University of Jordan with a grant fund number of 13-10-2016.
Disclosure
The authors report no conflicts of interest in this work
References
Corsino L, Dhatariya K, Umpierrez G. Management of Diabetes and Hyperglycemia in Hospitalized Patients. In: Endotext. De Groot LJ, Chrousos G, Dungan K, et al. editors. MA: South Dartmouth; 2000. | ||
Ajlouni K, Khader YS, Batieha A, Ajlouni H, El-Khateeb M. An increase in prevalence of diabetes mellitus in Jordan over 10 years. J Diabetes Complications. 2008;22(5):317–324. | ||
Albache N, Al Ali R, Rastam S, Fouad FM, Mzayek F, Maziak W. Epidemiology of Type 2 diabetes mellitus in Aleppo, Syria. J Diabetes. 2010;2(2):85–91. | ||
Engelgau MM, Geiss LS, Saaddine JB, et al. The evolving diabetes burden in the United States. Ann Intern Med. 2004;140(11):945–950. | ||
Obrosova IG, Fathallah L, Liu E, Nourooz-Zadeh J. Early oxidative stress in the diabetic kidney: effect of DL-alpha-lipoic acid. Free Radic Biol Med. 2003;34(2):186–195. | ||
Yue KK, Chung WS, Leung AW, Cheng CH. Redox changes precede the occurrence of oxidative stress in eyes and aorta, but not in kidneys of diabetic rats. Life Sci. 2003;73(20):2557–2570. | ||
American Diabetes Association. Diagnosis and classification of diabetes mellitus. Diabetes Care. 2010;33(Suppl 1):S62–S69. | ||
Bhatt HB, Smith RJ. Fatty liver disease in diabetes mellitus. Hepatobiliary Surg Nutr. 2015;4(2):101–108. | ||
Mantovani A, Targher G. Type 2 diabetes mellitus and risk of hepatocellular carcinoma: spotlight on nonalcoholic fatty liver disease. Ann Transl Med. 2017;5(13):270. | ||
Irshaid Y, Al-Hadidi H, Abuirjeie M, et al. Acetylator phenotypes of Jordanian diabetics. Eur J Clin Pharmacol. 1992;43(6):621–623. | ||
Dostalek M, Court MH, Yan B, Akhlaghi F. Significantly reduced cytochrome P450 3A4 expression and activity in liver from humans with diabetes mellitus. Br J Pharmacol. 2011;163(5):937–947. | ||
Dostalek M, Court MH, Hazarika S, Akhlaghi F. Diabetes mellitus reduces activity of human UDP-glucuronosyltransferase 2B7 in liver and kidney leading to decreased formation of mycophenolic acid acyl-glucuronide metabolite. Drug Metab Dispos. 2011;39(3):448–455. | ||
Lee JH, Yang SH, Oh JM, Lee MG. Pharmacokinetics of drugs in rats with diabetes mellitus induced by alloxan or streptozocin: comparison with those in patients with type I diabetes mellitus. J Pharm Pharmacol. 2010;62(1):1–23. | ||
Elshenawy OH, Shoieb SM, Mohamed A, El-Kadi AO. Clinical Implications of 20-Hydroxyeicosatetraenoic Acid in the Kidney, Liver, Lung and Brain: An Emerging Therapeutic Target. Pharmaceutics. 2017; 9(1):9. | ||
Leclercq IA, Farrell GC, Field J, et al. CYP2E1 and CYP4A as microsomal catalysts of lipid peroxides in murine nonalcoholic steatohepatitis. J Clin Invest. 2000;105(8):1067–1075. | ||
Lukaszewicz KM, Lombard JH. Role of the CYP4A/20-HETE pathway in vascular dysfunction of the Dahl salt-sensitive rat. Clin Sci. 2013;124(12):695–700. | ||
Pass GJ, Becker W, Kluge R, et al. Effect of hyperinsulinemia and type 2 diabetes-like hyperglycemia on expression of hepatic cytochrome p450 and glutathione s-transferase isoforms in a New Zealand obese-derived mouse backcross population. J Pharmacol Exp Ther. 2002;302(2):442–450. | ||
Ahmed S, Zhou Z, Zhou J, Chen SQ. Pharmacogenomics of Drug Metabolizing Enzymes and Transporters: Relevance to Precision Medicine. Genomics Proteomics Bioinformatics. 2016;14(5):298–313. | ||
Canadian Council on Animal Care. Guide to the care and use of experimental animals Canadian Council on Animal Care. Ottawa, Ont; 1980. | ||
Guo T, Mao Y, Li H, et al. Characterization of the gene expression profile of heterozygous liver-specific glucokinase knockout mice at a young age. Biomed Pharmacother. 2012;66(8):587–596. | ||
Oliveira WH, Nunes AK, França ME, et al. Effects of metformin on inflammation and short-term memory in streptozotocin-induced diabetic mice. Brain Res. 2016;1644:149–160. | ||
Livak KJ, Schmittgen TD. Analysis of relative gene expression data using real-time quantitative PCR and the 2(-Delta Delta C(T)) Method. Methods. 2001;25(4):402–408. | ||
Jarrar YB, Shin JG, Lee SJ. Expression of arachidonic acid-metabolizing cytochrome P450s in human megakaryocytic Dami cells. In Vitro Cell Dev Biol Anim. 2013;49(7):492–500. | ||
Jarrar YB, Balasmeh AA, Jarrar W. Sequence analysis of the N-acetyltransferase 2 gene (NAT2) among Jordanian volunteers. Libyan J Med. 2018;13(1):1408381. | ||
King AJ. The use of animal models in diabetes research. Br J Pharmacol. 2012;166(3):877–894. | ||
Cheng Y, Kang H, Shen J, et al. Beta-cell regeneration from vimentin+/MafB+ cells after STZ-induced extreme beta-cell ablation. Sci Rep. 2015;5:11703. | ||
Damasceno DC, Netto AO, Iessi IL, et al. Streptozotocin-induced diabetes models: pathophysiological mechanisms and fetal outcomes. Biomed Res Int. 2014;2014:819065. | ||
Kume E, Fujimura H, Matsuki N, et al. Hepatic changes in the acute phase of streptozotocin (SZ)-induced diabetes in mice. Exp Toxicol Pathol. 2004;55(6):467–480. | ||
Cobbina E, Akhlaghi F. Non-alcoholic fatty liver disease (NAFLD) - pathogenesis, classification, and effect on drug metabolizing enzymes and transporters. Drug Metab Rev. 2017;49(2):197–211. | ||
Palatini P, de Martin S. Pharmacokinetic drug interactions in liver disease: An update. World J Gastroenterol. 2016;22(3):1260–1278. | ||
Elbekai RH, Korashy HM, El-Kadi AO. The effect of liver cirrhosis on the regulation and expression of drug metabolizing enzymes. Curr Drug Metab. 2004;5(2):157–167. | ||
Higuchi S, Wu R, Zhou M, Ravikumar TS, Wang P. Downregulation of hepatic cytochrome P-450 isoforms and PPAR-gamma: their role in hepatic injury and proinflammatory responses in a double-hit model of hemorrhage and sepsis. J Surg Res. 2007;137(1):46–52. | ||
Kim JH, Nam WS, Kim SJ, et al. Mechanism Investigation of Rifampicin-Induced Liver Injury Using Comparative Toxicoproteomics in Mice. Int J Mol Sci. 2017;18(7):E1417. | ||
Klein M, Thomas M, Hofmann U, et al. A systematic comparison of the impact of inflammatory signaling on absorption, distribution, metabolism, and excretion gene expression and activity in primary human hepatocytes and HepaRG cells. Drug Metab Dispos. 2015;43(2):273–283. | ||
Loria P, Lonardo A, Anania F. Liver and diabetes. A vicious circle. Hepatol Res. 2013;43(1):51–64. | ||
Almazroo OA, Miah MK, Venkataramanan R. Drug Metabolism in the Liver. Clin Liver Dis. 2017;21(1):1–20. | ||
Oltmanns D, Dennin DE, Pentz R, Siegers CP. Antipyrine clearance as a measure of drug metabolism in patients with diabetes mellitus. Z Gastroenterol. 1984;22(10):598–601. | ||
Kudo T, Toda T, Ushiki T, et al. Differences in the pharmacokinetics of Cyp3a substrates in TSOD and streptozotocin-induced diabetic mice. Xenobiotica. 2010;40(4):282–290. | ||
Jarrar YB, Cha EY, Seo KA, et al. Determination of major UDP-glucuronosyltransferase enzymes and their genotypes responsible for 20-HETE glucuronidation. J Lipid Res. 2014;55(11):2334–2342. | ||
Alsaad AM, Zordoky BN, El-Sherbeni AA, El-Kadi AO. Chronic doxorubicin cardiotoxicity modulates cardiac cytochrome P450-mediated arachidonic acid metabolism in rats. Drug Metab Dispos. 2012;40(11):2126–2135. | ||
de Gregori S, de Gregori M, Ranzani GN, et al. Morphine metabolism, transport and brain disposition. Metab Brain Dis. 2012;27(1):1–5. | ||
Dean L. Irinotecan Therapy and UGT1A1 Genotype. In: Medical Genetics Summaries. Pratt V, McLeod H, Dean L, Malheiro A, Rubinstein W, editors. MD: Bethesda; 2012. | ||
Hakooz N, Jarrar YB, Zihlif M, et al. Effects of the genetic variants of organic cation transporters 1 and 3 on the pharmacokinetics of metformin in Jordanians. Drug Metab Pers Ther. 2017;32(3):157–162. | ||
Grover B, Buckley D, Buckley AR, Cacini W. Reduced expression of organic cation transporters rOCT1 and rOCT2 in experimental diabetes. J Pharmacol Exp Ther. 2004;308(3):949–956. | ||
Mastaitis JW, Wurmbach E, Cheng H, Sealfon SC, Mobbs CV. Acute induction of gene expression in brain and liver by insulin-induced hypoglycemia. Diabetes. 2005;54(4):952–958. | ||
Davidson MD, Ballinger KR, Khetani SR. Long-term exposure to abnormal glucose levels alters drug metabolism pathways and insulin sensitivity in primary human hepatocytes. Sci Rep. 2016;6:28178. |
 © 2018 The Author(s). This work is published and licensed by Dove Medical Press Limited. The full terms of this license are available at https://www.dovepress.com/terms.php and incorporate the Creative Commons Attribution - Non Commercial (unported, v3.0) License.
By accessing the work you hereby accept the Terms. Non-commercial uses of the work are permitted without any further permission from Dove Medical Press Limited, provided the work is properly attributed. For permission for commercial use of this work, please see paragraphs 4.2 and 5 of our Terms.
© 2018 The Author(s). This work is published and licensed by Dove Medical Press Limited. The full terms of this license are available at https://www.dovepress.com/terms.php and incorporate the Creative Commons Attribution - Non Commercial (unported, v3.0) License.
By accessing the work you hereby accept the Terms. Non-commercial uses of the work are permitted without any further permission from Dove Medical Press Limited, provided the work is properly attributed. For permission for commercial use of this work, please see paragraphs 4.2 and 5 of our Terms.