")
Back to Journals » Journal of Inflammation Research » Volume 14
Alteration of the Immune Microenvironment in HBsAg and HBeAg Dual-Positive Pregnant Women Presenting a High HBV Viral Load
Authors Gao F , Wang H, Li X, Guo F, Yuan Y, Wang X, Zhang Y, Bai G
Received 3 September 2021
Accepted for publication 14 October 2021
Published 29 October 2021 Volume 2021:14 Pages 5619—5632
DOI https://doi.org/10.2147/JIR.S337561
Checked for plagiarism Yes
Review by Single anonymous peer review
Peer reviewer comments 2
Editor who approved publication: Professor Ning Quan
Fan Gao,1,* Hongyan Wang,2,* Xia Li,2 Fanfan Guo,2 Yufei Yuan,2 Xiaona Wang,2 Yidan Zhang,2 Guiqin Bai2
1Clinical Research Center, The First Affiliated Hospital of Xi’an Jiaotong University, Xi’an, Shaanxi, People’s Republic of China; 2Department of Gynecology and Obstetrics, The First Affiliated Hospital of Xi’an Jiaotong University, Xi’an, Shaanxi, People’s Republic of China
*These authors contributed equally to this work
Correspondence: Guiqin Bai
Department of Gynecology and Obstetrics, The First Affiliated Hospital of Xi’an Jiaotong University, 277 Yanta West Road, Xi’an, 710061, Shaanxi, People’s Republic of China
Tel +86-18991232517
Email [email protected]
Purpose: The aim of this study was to compare the differences in the immune microenvironment between HBV-infected pregnant women with a high HBV viral load and healthy pregnant women, with an emphasis on T cell subset alteration.
Patients and Methods: We compared the differences of cellular and molecular signatures between HBV-infected and healthy pregnant women by performing single-cell RNA and T cell receptor sequencing of peripheral blood mononuclear cells from 51,836 women in the mid-trimester pregnancy stage. Specific trajectories of the different T clusters throughout the course of T cell differentiation were investigated. Flow cytometry was used to validate the proportion of different T cell subtypes.
Results: We identified nine cellular subtypes and found an increased proportion of effector/memory CD8+ T cells in HBV-infected pregnant women. Both CD4+ and CD8+ effector/memory T cells in HBV-related samples expressed higher levels of metallothionein (MT)-related genes (MT2A, MTIE, MTIF, MTIX), metal ion pathways, and multiple inflammatory responses. Among CD8+ T cell clusters, we identified a particular subset of effector/memory CD8+ T cells (CD8-cluster 2) with MTs as the top-ranking genes, which may be enriched in HBV-related samples. These cells showed an increased clonal expansion in HBV infection. Moreover, we found more active immune responses, according to cellular interaction patterns, between immune cell subsets in HBV-infected samples.
Conclusion: This study shows significant differences between HBV-infected and healthy samples, including cell clusters, dominant gene sets, T cell function, clonal expansion, and V/J gene usage of T cell clonotypes, and identifies a distinct CD8+ T cell cluster with immune-active and antiviral properties. These findings pave the way for a deeper understanding of the impact of HBV infection on the immune microenvironment during pregnancy.
Keywords: single-cell RNA sequencing, HBV infection, pregnancy, immune cells, CD8+ T cells
Introduction
HBV chronically infects more than 400 million individuals worldwide,1–5 and approximately half of all HBV carriers are infected through mother-to-child transmission (MTCT).6,7 Therefore, management of pregnant women with chronic HBV infection and blocking MTCT are major global health challenges.1,2,8–11 Current nucleotide analogue (NA) therapies can efficiently suppress viral replication.9,11 Nevertheless, approximately 1–6% of the infants are still infected despite NA treatment,10,12–15 and pregnant women with HBV infection rarely achieve a functional cure.1,2,7,9,11,15–18 WHO developed a global strategy to decrease HBV incidence by 90% and reduce the prevalence rate of hepatitis B surface antigen (HBsAg) in children to 1% by 2020 and <0.1% by 2030.13,19 Therefore, it is necessary to understand the pathogenesis of HBV infection, which can guide the development of novel treatment strategies for HBV-infected pregnant women.
Previous studies have shown that the antiviral immune response is closely associated with HBV pathophysiology and HBV infection control.5,7,20–23 Viruses may reprogram the immune microenvironment to induce immunosuppression or peripheral tolerance during chronic infection.5,24 Particularly, the antiviral function of T cells may be impaired.25 Some studies have shown that immune modulation has a positive effect and can be a promising strategy combined with NA therapies for patients with HBV, which could enhance the antiviral activity of T cells and NK cells.16,25–27 Also, a recent study proposed that a chimeric antigen receptor or a classical T cell receptor treatment may be efficient as a HBV cure.28 Accordingly, studying the phenotype and function of immunocytes could provide evidence for developing immunotherapy-mediated functional cures for patients with HBV.20,21,23,29 Most studies to date have focused on single immune cell types using bulk DNA or RNA sequencing and flow cytometry for identifying alterations in the immune system. However, identifying immune cell subtypes and analyzing differentially expressed genes (DEGs) between diverse cell populations remain major challenges. Furthermore, the specific relationship between HBV infection and pregnancy has not been considered, and there has been no comprehensive comparison of the distinct immune landscape and the underlying mechanisms during pregnancy with or without chronic HBV infection.
In the present study, we constructed a high-dimensional transcriptomic map of the immune microenvironment in healthy and HBV-infected pregnant women using single-cell RNA-sequencing (scRNA-seq) and T cell receptor (TCR) sequencing. As T cells play a dominant role in controlling HBV infection,16,20,22,30 we mainly investigated differential gene expression as well as the function of T cell subsets and the TCR repertoire between healthy and HBV infected women during pregnancy.
Patients and Methods
Patients
Three consecutively admitted pregnant women with HBV infection and three consecutively admitted healthy pregnant women were recruited for this study for scRNA-seq. The inclusion criteria for HBV-infected pregnant women included 1) HBV DNA titer ≥1.0 × 10⁷ IU/mL; 2) HBsAg and HBeAg dual-positive; and 3) second trimester pregnancy. The exclusion criteria included 1) co-infection with HIV, HCV, or HDV; 2) other immune-related diseases; 3) alanine aminotransferase levels >5 times the upper limit of normal, bilirubin >2 mg/dL, creatinine clearance rate <100 mL/min, or evidence of hepatocellular carcinoma, renal dysfunction, or hepatic dysfunction; 4) hemoglobin <8 g/100 mL, neutrophils <1000/mm3, or albumin <2.5 g/100 mL; 5) HBV treatment within 6 months; and 6) usage of medication. The inclusion criteria for healthy pregnant women were being in the second trimester and without any physical illness. Written informed consent was acquired from all patients enrolled in the study, and the study protocol was approved by the Ethics Committee of the First Affiliated Hospital of Xi’an Jiaotong University and was performed in accordance with the Declaration of Helsinki.
Collection of Human Peripheral Blood Mononuclear Cells (PBMCs)
PBMCs were collected from three healthy pregnant women and three HBV-infected pregnant women at the outpatient service of the First Affiliated Hospital of Xi’an Jiaotong University by Ficoll-Hypaque density gradient centrifugation (GE Healthcare, Marlborough, MA, USA). All patients met the inclusion and exclusion criteria. PBMCs were collected before antiviral therapy. The cells were cryopreserved in a –80 °C freezer until analysis.
scRNA-Seq
scRNA-seq libraries were generated using 10× Genomics Single Cell 5ʹ Reagent Kit V2.0 (10× Genomics, Pleasanton, CA, USA) according to the manufacturer’s instructions. Single-cell suspensions were loaded on the Chromium Single-Cell Controller instrument (10× Genomics) to generate single-cell gel beads in emulsions. Reverse transcription reactions, cDNA generation, and library amplification were performed. These libraries were sequenced on the Illumina sequencing platform (HiSeq X Ten) and 150 bp paired-end reads were generated.
scRNA-Seq Data Preprocessing
FastQC (v 0.11.7) was used to assess the quality of the raw data. The Cell Ranger software pipeline (v 3.1.0) provided by 10× Genomics was used to demultiplex cellular barcodes, map reads to the genome and transcriptome using the STAR aligner, and down-sample reads as required to generate normalized aggregate data across samples, producing a matrix of gene counts versus cells.26 We processed the unique molecular identifier (UMI) count matrix using the R (v3.6.1) package Seurat (v3.0.0).26,31 Cells and genes were filtered to remove low-quality cells and likely multiple captures. Cells with UMI/gene numbers beyond the limit mean value ±2-fold the standard deviation, assuming a Gaussian distribution for the UMI/gene numbers of each cell, were removed. Following visual inspection of the cell distribution according to the fraction of mitochondrial genes expressed, we further discarded low-quality cells in which >25% of the counts belonged to mitochondrial genes. After applying these quality control criteria, 51,836 single cells remained for inclusion in downstream analyses. The filtered digital gene expression matrix was normalized using the R Seurat (v3.0.0) package.32
Identification of Cell Types, Differential Expression, and Pathway Analysis
The top variable genes between groups across single cells were identified using the method described by Macosko et al.31 Principal component analysis was performed to reduce the dimensionality on the log-transformed gene-barcode matrices of the top variable genes. The number of principal components was 13 and resolution was 0.4. Default parameters used otherwise. Cells were clustered based on a graph-based clustering approach in the FindNeighbors and FindClusters functions and visualized in two dimensions using the t-distributed stochastic neighbor embedding (t-SNE) method with R (v3.6.1) package Seurat (v3.0.0). T cells, NK cells, B cells, and monocytes were recognized according to the average expression level of curated gene sets of the following: T cells (CD3D/E/G), B cells (CD79A/B, CD19, MS4A1), monocytes (S100A12, VCAN, FCN1), NK cells (XCL1/2, KLRF1). Cluster 13 with 282 cells was deleted because there was no curated gene set that could recognize it. To further address the intrinsic heterogeneity of each major cell type, the abovementioned steps were repeated and clusters of each cell type were identified by unsupervised clustering based on t-SNE. Cell subtypes of T cells, NK cells, and monocytes were then recognized according to the average expression of corresponding curated gene sets.32,33 Cell markers of T cell subtypes found were as follows: CD8+ T cells (CD8A), CD4+ T cells (CD4 or CD8A-IL7Rhigh), effector CD8+ T cells (FGFBP2, PRF1, GZMH, KLRG1), effector CD4+ T cells (PRF1, GZMH, KLRG1, NKG7, GNLY), effector memory CD8+ T cells (GZMK), effector memory CD4+ T cells (GZMK, CCL5), Naïve CD4/CD8 T cells (CCR7). Cell markers of monocytes subtypes: atypical monocytes (SIGLEC10, P2RX1), typical monocytes (S100A12, SELL, CD99, CD14, CD1D, CD36, LGALS2). Cell markers of NK subtypes: CD56dim NK cells (FCGR3A, FCGR3B), CD56bright NK cells (NCAM1). For T cells, CD8+CD4– and CD8–CD4+ T cells were used in the t-SNE projection. Other cells such as CD8+CD4+ and CD8–CD4– T cells (cluster 9 of 1149 cells) were filtered out in this analysis.33
DEGs were identified using the FindMarkers function (test.use = MAST) in Seurat.26,34 We applied a threshold (fold-change > 1.2, p value < 0.05) to identify DEGs between HBV-infected and control groups. Gene Ontology (GO) and KEGG pathway enrichment analysis of DEGs were conducted according to the hypergeometric distribution test performed in R. Pathways with differential activities between different T cell clusters, and between HBV-infected and healthy cells were compared with gene set variation analysis (GSVA). Kyoto Encyclopedia of Genes and Genomes database information was downloaded (https://www.kegg.jp/) to collate gene set files. The GSEABase package (v 1.44.0) was used to read the gmt format gene set file, and GSVA (v 1.30.0) and limma (v 3.38.3) packages were then used for pathway enrichment scoring and differential pathway analysis. Top 5 significant upregulated and down-regulated pathway activities related with T cell functions were further assessed.35
Pseudotime Analysis
We determined the developmental pseudotime with the Monocle 2 package.36 The raw count was first converted from a Seurat object into a CellDataSet object with the importCDS function in Monocle. We used the differentialGeneTest function of the Monocle 2 package to select ordering genes (qval < 0.01) which were likely to be informative in the ordering of cells along the pseudotime trajectory. The dimensional reduction clustering analysis was performed with the reduceDimension function, followed by trajectory inference with the orderCells function using default parameters. Gene expression was plotted with the plot_genes_in_pseudotime function to track changes over pseudo-time.
TCR Repertoire Analysis
The analysis pipelines in Cell Ranger (10× Genomics, version 3.1.0) were used for single-cell sequencing data processing. V(D)J sequence assembly and paired clonotype calling were performed using cellranger vdj with reference = refdata-cellranger-vdj-GRCh38-alts-ensembl-3.1.0 for each sample. Clonotypes were determined by grouping of cell barcodes that shared the same set of productive CDR3 nucleotide sequences. The sequences of all contigs from all cells within a clonotype were then assembled to produce a clonotype consensus sequence. Clonality was integrated into the Seurat gene-expression analysis by adding clonality information to the metadata. Assembled clonotypes were then exported for diversity analyses using VDJtools.37 Clonotypic diversity estimates were calculated based on CDR3 nucleotide sequence and V- and J-segment usage. Top five clonotypes of each sample were used to analyze the proportion of clonal expansion in different T cell clusters. Clonal cells are defined as those clonotypes containing at least two cells. Top five clonotypes of each sample mean that the number of clonal cells in those clonotypes ranked in the top five in total T cells. Kruskal–Wallis test was used to compare cell population proportions. The origins of each sample’s top five clonotypes are shown in tSNE plots. V- and J-segment usage differences were compared in the HBV and control group using Mann–Whitney U test.
Ligand–Receptor Interactions Analysis
To investigate intercellular communications in PBMCs, we analyzed the correlation between ligands and their cognate receptors for each cell type’s ligand–receptor pair using CellPhoneDB (v 2.0) software. The R packages Igraph and Circlize were used to display the cell–cell communication networks.
Flow Cytometry Assay
PBMCs were obtained from five HBsAg and HBeAg dual-positive HBV-infected pregnant women and from eight healthy pregnant women in the second trimester at the outpatient service in the First Affiliated Hospital of Xi’an Jiaotong University for flow cytometry assay. Patients met the same inclusion and exclusion criteria as the patients undergoing scRNA-seq. Cells were resuspended in 200 µL phosphate buffered saline and transfer to a 1.5-mL centrifuge tube. CD3, CD8, and CCR7 antibodies were added into the tube, and samples were incubated 15 min at room temperature without light. After 15 min, cells were filtered into the flow tube and placed in a flow cytometer (Becton Dickinson, Franklin Lakes, NJ, USA). CD3+CD8+CCR7- was defined as the effector/memory CD8+ T cell. The following antibodies were used: PerCP-cy5.5-labeled anti-CD3 (mouse, 70-AH00307-50, Multi Sciences, Hangzhou, China), fluorescein isothiocyanate-labeled anti-CD8A (mouse, 70-AH008A0201-20, Multi Sciences), allophycocyanin-labeled anti-CD4 (mouse, 70-AH0040205-20, Multi Sciences), and phycoerythrin-labeled anti-CCR7 (mouse, 12-1979-42, eBioscience, San Diego, CA, USA). Data analysis was performed using FlowJo (V10).
Statistical Analyses
Mann–Whitney U test and Kruskal–Wallis test were used to compare the proportions of cell populations and number of genes, transcripts between two groups and multiple groups with R (v3.6.1), respectively. P<0.05 was considered statistically significant.
Results
Study Population
Basic clinical characteristics of the study population are provided in Table 1. The age range of the six pregnant women was 25 to 33 years. Their gestational age varied from 22 to 25 weeks.
 |
Table 1 Basic Clinical Characteristics of Pregnant Women |
Alteration in the Immune Cell Population in HBV-Related Samples
In total, 51,836 cells were used for scRNA-seq analysis after quality screening. Basic information of the scRNA-seq analysis in the six samples is provided in Additional Table 1. First, 13 clusters from PBMCs of six samples were generated after dimensionality reduction (Additional Figure 1). We identified four major immune cell types in the six samples: T cells, B cells, monocytes, and NK cells (Figure 1A and B, Additional Figure 2). To identify subtypes of four major cell types, dimensionality reduction and the clustering of each major cell type were repeated. The number of principal components was 11 in T cells, 5 in NK cells, and 8 in monocytes (Additional Figure 3). T cells were then classified into the following subtypes: naïve CD8+ T cells (cluster 5), effector/memory CD8+ T cells (cluster 3, 7, 10, 11), naïve CD4+ T cells (cluster 1, 2), effector/memory CD4+ T cells (cluster 4, 6, 8). Cluster 9 in T cells was removed further in the analysis because of CD4 and CD8 double-negative cells. NK cells were classified into CD56 brightCD16– NK cells (cluster 3), CD56dimCD16+ NK cells (cluster 1, 2, 4, 5). Monocytes were classified into typical monocytes (cluster 1, 2, 4, 5, 6, 7, 8) and atypical monocytes (cluster 3) according to the average expression of corresponding curated gene sets in different clusters (Additional Figures 4–6) The subtypes of four major immune cells are shown in Figure 1C. After deleting the unknown cluster and the CD4, CD8 double-negative cells, there were 50,405 cells included in the next steps. Heat map analysis was performed using the top five DEGs in each cell type (Additional Figure 7). The average fraction of all immune cell types in the six samples is shown in Figure 1D. Regarding the number of genes and transcripts, there were no significant differences in each cell subtype between HBV-related and healthy samples (Figure 1E). HBV-related samples showed a predominant fraction of effector/memory CD8+ T cells in total T cells, compared with that found in healthy samples. Conversely, HBV-related samples had fewer effector/memory CD4+ T cells than healthy samples (Figure 1F).
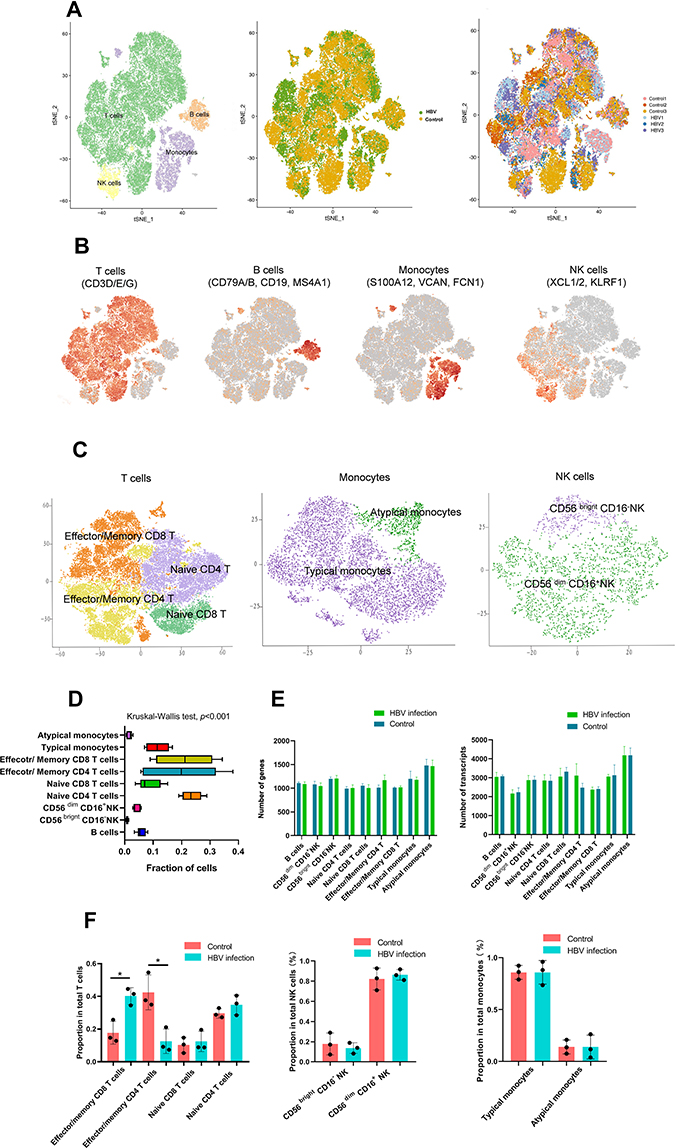 |
Figure 1 Single-cell RNA-Seq analysis of PBMC in pregnant women identifies nine major cell populations. Single-cell RNA-Seq was performed on single-cell suspensions generated from three HBV-infected pregnant women and three healthy pregnant women. (A) tSNE of the 51,836 cells profiled here: four major cell types; its sample type of origin (HBV-infected and healthy samples); the corresponding patient. T cells: 39,049 cells; B cells: 2947 cells; NK cells: 2465 cells; Monocytes: 7093 cells; unknown cells: 282; HBV group: 27,390 cells; Control group: 24,446 cells; Control 1: 8032 cells; Control 2: 7497 cells; Control 3: 8917 cells; HBV1: 11,208 cells; HBV 2: 7599 cells; HBV3: 8583 cells. (B) Expression of marker genes for the cell types. (C) tSNE plot of subtypes of T cells, monocytes and NK cells. (D) For 9 cell subtypes: the average fraction of each cell subtype (Kruskal–Wallis test, p<0.001). (E) The average number of genes in each cell subtype; the average number of transcripts in each cell subtype (Mann–Whitney rank test). (F) The average proportion of cell subtypes in HBV-infected and control groups (*p<0.05, Mann–Whitney rank test). Abbreviations: tSNE, t-distributed stochastic neighbor embedding; NK, natural killer; HBV, hepatitis B virus. |
To validate the alteration of T cell subtypes in HBV-related samples, we isolated effector/memory CD8+ T cells, and effector/memory CD4+ T cells from PBMCs by flow cytometry, noting an increased percentage of effector/memory CD8+ T cells in HBV-infected pregnant women (Figure 2A–C). Flow cytometry results are listed in Additional Table 2.
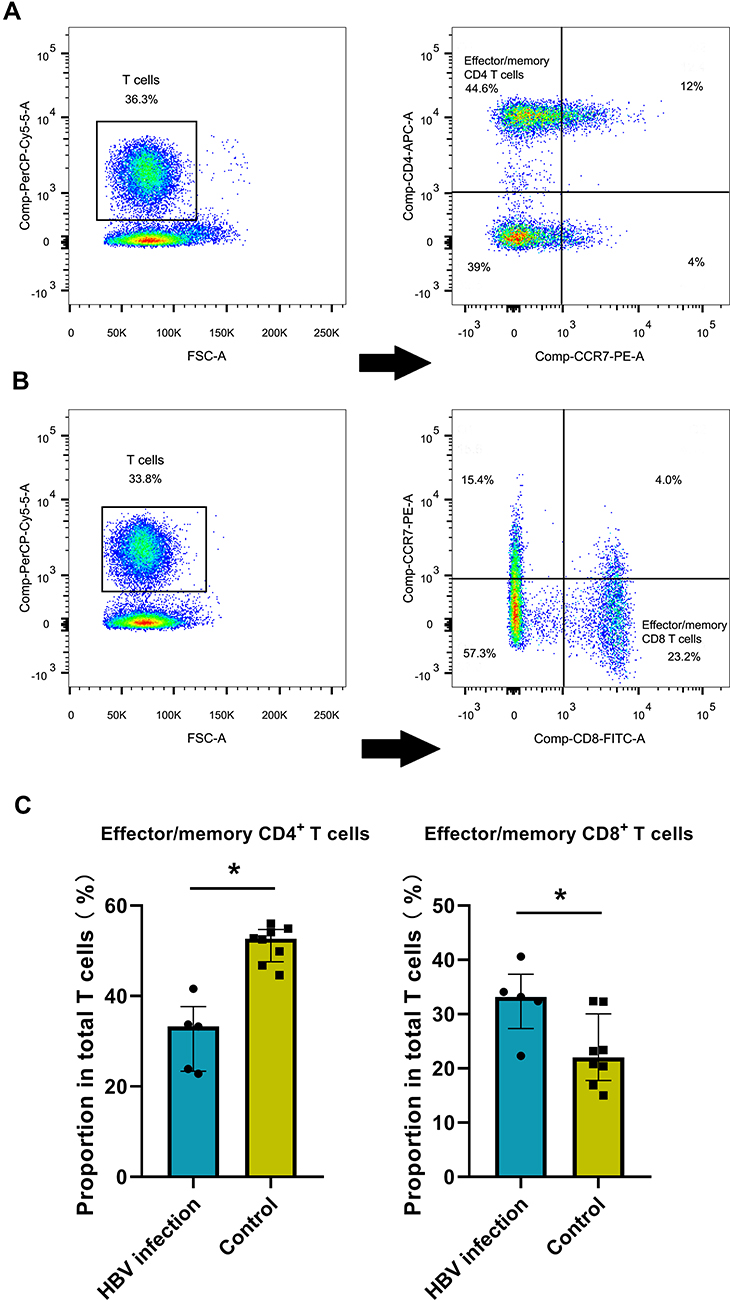 |
Figure 2 HBV-related samples display higher proportion of effector/memory CD8+ T cells by flow cytometry assay. (A) Examples of CD3, CD4 and CCR7 staining to determine effector/memory CD4+ T cells. (B) Examples of CD3, CD8 and CCR7 staining to determine effector/memory CD8+ T cells. (C) The average proportion of effector/memory CD4+ T cells and CD8+ T cells in HBV and control groups (*p<0.05, Mann–Whitney rank test). |
T Cell Subtypes Indicate Immune Activation in HBV-Related Samples
Next, we estimated the differential pathway activities between HBV-related and healthy samples in effector/memory CD8+ T cells and effector/memory CD4+ T cells scored by GSVA (Figure 3A and B). In effector/memory CD8+ T cells, the mineral absorption pathway was the most highly upregulated pathway in HBV-related samples. Other enriched pathways included cytokine–cytokine receptor interaction, TNF signaling pathway, IL-17 signaling pathway, and NOD-like receptor signaling pathway, which are all closely linked with the inflammatory response. While more pathways related to proliferation and differentiation of T cells (PI3K Akt signaling pathway, Ras signaling pathway, Hippo signaling pathway, ECM receptor interaction) were down-regulated in the HBV group. The top enriched pathway in effector/memory CD4+ T cells from HBV-related samples was inflammatory mediator regulation of TRP channels. The following enriched pathways included AMPK-signaling-pathway and chemokine signaling pathway, which indicates that effector/memory CD4+ T cells in HBV-related samples may participate in the inflammatory response and maintain cellular energy balance. Pathways involved with the proliferation of T cells (peroxisome, ErbB-signaling-pathway, and Hippo signaling pathway) were down-regulated in HBV group. T cell activation (increased expression genes: NCF1, CD7, SLA2, TGFB1) was among the top 10 upregulated GO biological processes in the HBV-related samples of CD8+ T cells compared with those of healthy cells. SRP-dependent cotranslational protein targeting to membrane, viral transcription, nuclear-transcribed mRNA catabolic process, nonsense-mediated decay, and translational initiation were upregulated in HBV-related CD4+ T cells, which correlated with an increased expression of RPS3A, RPS10, RPS26, RPL41. Metallic ion-related pathways, including detoxification of copper ion, cellular response to cadmium ion, cellular response to zinc ion, cellular response to copper ion, and cellular response to homeostasis were upregulated in HBV samples in both CD4+ and CD8+ T cells. These enriched pathways correlated with the increased expression of MTs-related genes (MT2A, MT1E, MT1F, MT1X) in HBV-related samples compared with those of healthy subjects in both CD4+ and CD8+ T cells (Figure 3C–F).
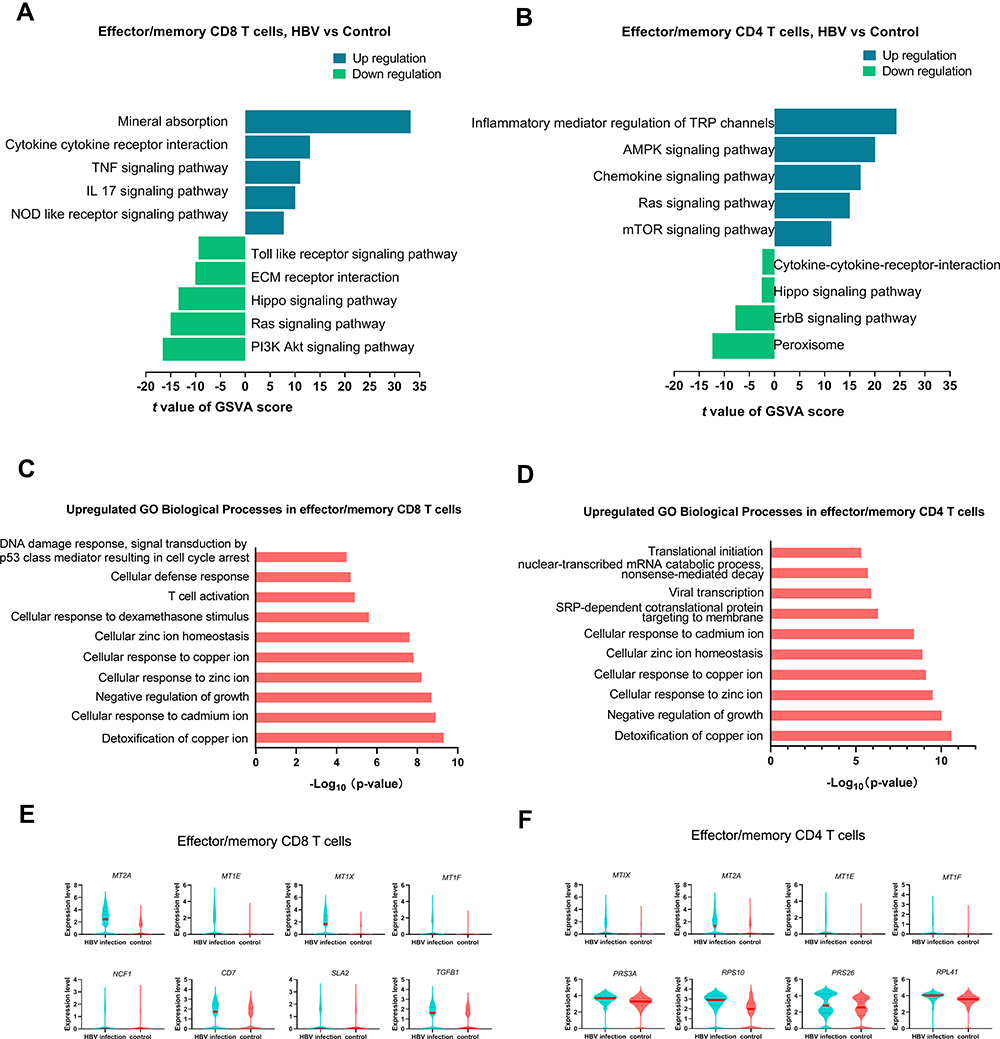 |
Figure 3 Transcriptomic differences between HBV-infected and healthy samples in effector/memory T cells. (A and B) Top five differences in pathway activities related with T cell functions between HBV-infected and healthy samples in effector/memory CD8+ and CD4+ T cells estimated by GSVA. There were only 4 significant pathways significant in down-regulation in effector/memory CD4+ T cells. (C and D) Top 10 upregulated GO biological processes in HBV-related samples compared with healthy samples in effector/memory CD8+ and CD4+ T cells. (E) Upregulated genes related with top 10 GO biological processes in effector/memory CD8+ T cells in HBV-related samples (fold-change > 1.2, p value < 0.05). (F) Upregulated genes related with top 10 GO biological processes in effector/memory CD4+ T cells in HBV-related samples (fold-change > 1.2, p value < 0.05). Abbreviations: GO, Gene Ontology; GSVA, gene set variation analysis. |
CD8-C2 T Cells May Be Related to the Altered Function of Effector/Memory CD8+ T Cells Under HBV Infection
A total of 37,900 T cells were included in t-SNE analysis. There were five CD4+ T cell clusters and five CD8+ T cell clusters identified (Figure 4A and B). T cell clusters origin from HBV and control groups are shown in Additional Figure 8. CD8-C1, CD4-C1, and CD4-C2 T cells represented naïve T cells, whereas the other cell clusters expressed high levels of effector and effector memory markers based on the functional annotation of genes (Figure 4B and C). Because these clusters expressed both effector and effector memory marker genes, it may be inferred that T cells stay in a transient state between effector and memory T cells. To further differentiate among these effector/effector memory clusters, GSVA and the trajectories of CD4 and CD8 clusters were performed among clusters (Figure 4D and E). CD8-C2 presented the following pathways: enriched AMPK signaling pathway, cytokine–cytokine receptor interaction, and mineral absorption, which were clearly different from other T cell clusters. Mineral absorption pathway and cytokine–cytokine receptor interaction were also the most highly upregulated pathways in effector/memory CD8 T cells in HBV-related samples. It may be inferred that the different pathways in effector/memory CD8+ T cells between the HBV and control group were related with CD8-C2. CD8-C2 also showed enrichments in the TGF-beta signaling pathway, peroxisome, MAPK signaling-pathway, chemokine signaling pathway, and FoxO signaling pathway, which indicate that CD8-C2 participate in various inflammatory responses and antiviral pathways (Figure 4D). CD8-C3, CD8-C4, CD4-C3, and CD4-C4 may have a much stronger ability to proliferate and differentiate, enriched in ErbB signaling pathway or ras signaling pathway. The most enriched pathways in CD4-C5 were Toll-like receptor signaling pathway, IL 17 signaling pathway, and TNF signaling pathway. Trajectory analysis of CD8+ T cells inferred a differentiation direction that began with CD8-C1 and bifurcated into two activation branches. The left two branches contained CD8-C2, CD8-C3, and CD8-C4 together, which indicates that these clusters may remain in the same state. This result also supports the evidence that CD8-C2, CD8-C3, and CD8-C4 may stay in a transient state between effector and memory T cells. For CD4+ T cells, the Monocle trajectory analysis also exhibited a branched structure, starting with CD4-C1 and CD4-C2 (naïve CD4 T cell clusters) and bifurcated into right two activation branches. These two branches contained CD4-C3, CD4-C4, and CD4-C5 (Figure 4E). The top 10 genes expressed in effector/memory T cell clusters are shown in Figure 4F. These genes include MT-related genes (MT1X, MT1E, MT2A, MT1F). MT1X, MT1E, MT2A, MT1F were also upregulated in effector/memory CD8+ T cells belonging to the HBV group (Figure 3E). Therefore, this may further support that pathway differences between effector/memory CD8+ T cells in the HBV group may be mainly related with CD8-C2. CD8-C2 also expressed higher levels of FCGR3A and CXCR3 with evident cytotoxic features.
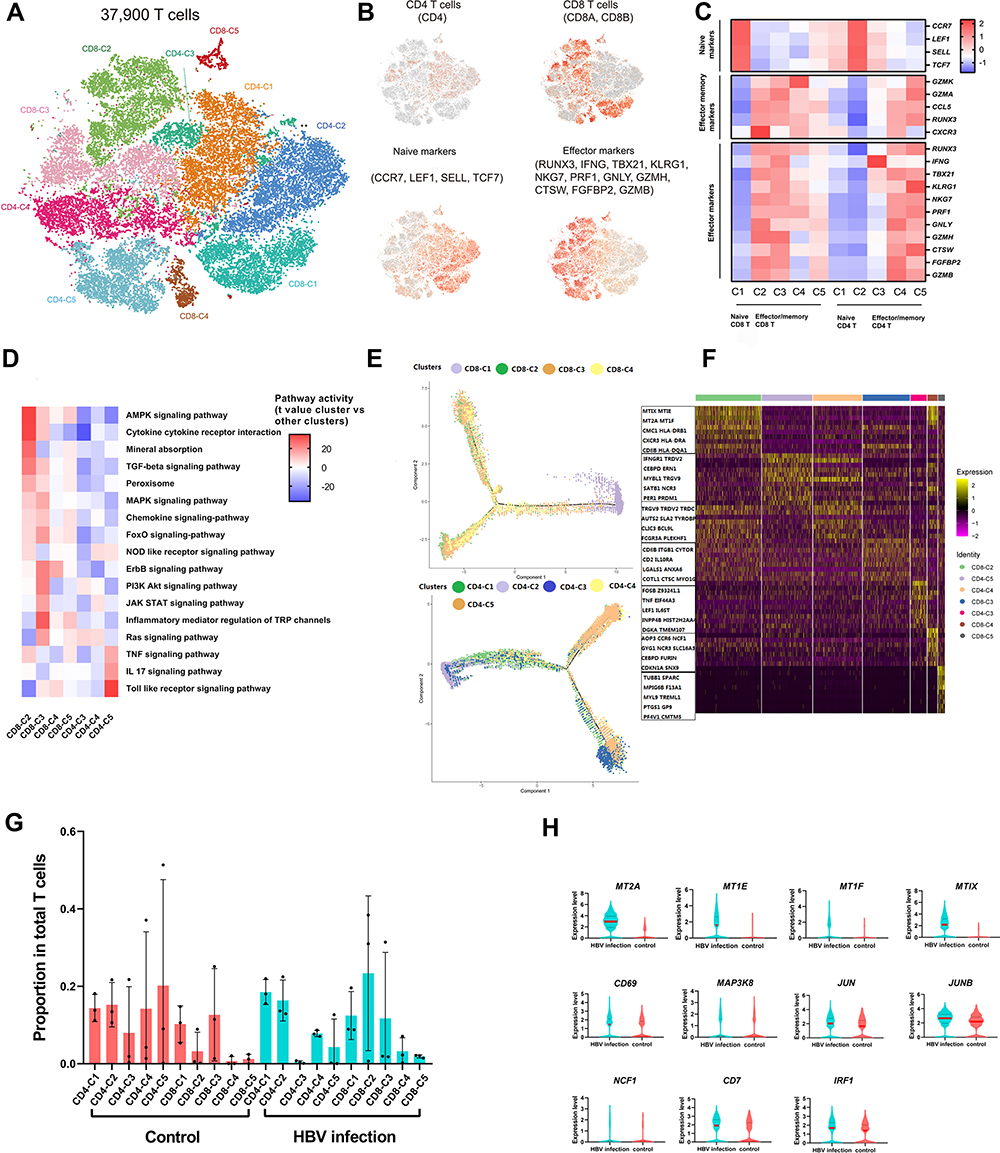 |
Figure 4 Dissection and clustering of T cells in HBV-related and healthy samples. (A) The tSNE project of 37,900 single T cells from six patients (3 HBV-related and 3 healthy patients), showing the formation of 10 clusters, including five for CD8+ T cells, 5 for CD4+ T cells. (B) Expression of marker genes for CD4+ T cells, CD8+ T cells, naïve T cells and effector T cells. (C) Heatmap of z-score normalized mean expression of T cell function-associated genes in each cell cluster. (D) Differences in pathway activities scored using GSVA in CD8+ T-cell clusters 2, 3, 4, 5 and CD4+ T-cell clusters 3, 4, 5. (E) The branched trajectory of CD8+ T cells and CD4+ T cells. (F) Heatmap of top 10 genes in each T cell clusters. (G) Proportion of T cell clusters in total T cells in HBV-infected and healthy samples. (H) Upregulated genes in CD8-C2 T cells in HBV-related samples: metallothionein-related genes (MT2A, MTIE, MTIF, MTIX), T cell-activated genes (NCF1, CD7), inflammation-associated genes (IRF1) and pro-inflammatory genes (CD69, MAP3K8, JUN, JUNB). Abbreviations: CD8-C, CD8-cluster; CD4-C, CD4-cluster; tSNE, t-distributed stochastic neighbor embedding. |
Because of the specific gene expression pattern of CD8-C2, we paid more attention of CD8-C2. CD8-C2 may be the largest group in CD8+ T cells and was mainly enriched in the HBV-related samples (Figure 4G). We further compared CD8-C2 gene expression between HBV–control groups. CD8-C2 of HBV-related samples showed increased expression levels of MT-related genes (MT2A, MTIE, MTIF, MTIX), T cell-activated gene (NCF1, CD7), inflammation-activated genes (IRF1), and pro-inflammatory genes (CD69, MAP3K8, JUN, JUNB) compared with non-infected samples (Figure 4H).
T Cells Show Different Clonal Expansion and Different V/J Gene Usage in HBV Infection
All T cells (37,900 cells) were included in V(D)J sequence assembly and paired clonotype calling. After clonotype recognition using cellranger vdj with reference = refdata-cellranger-vdj-GRCh38-alts-ensembl-3.1.0, a total of 18,289 cells with full-length TCRs for both alpha and beta chains were used for TCR repertoire analysis, including 15,015 unique cells and 3274 clonal cells. The proportion of clonal cells of each T cell cluster in the top five clonotypes of each sample is shown in Figure 5A. The higher the proportion of cluster, the larger the number of clonal cells found in a cluster. In HBV-related samples, CD8-C2 exhibited the highest level of clonal expansion. Clonal expansion showed that CD8-C2 may be the most active CD8 cluster in HBV samples. The distribution of the top five clonotypes in each sample is shown in Figure 5B. Significant differences of V gene and J gene usage frequency in clonotypes are shown in Figure 5C. We noted a higher frequency of TRAV14DV4, TRBV13, TRAJ28 in HBV-related samples than that in the healthy samples (p<0.05). Detecting the differences of specific V/J gene usage in TCR during pregnancy between HBV-infected and non-infected individuals may contribute to understanding the development of HBV infection.
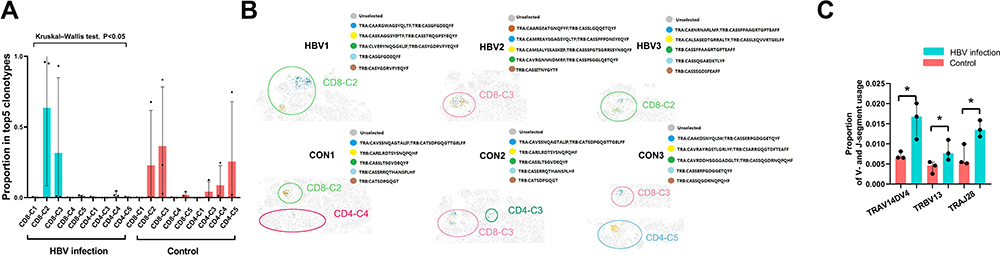 |
Figure 5 Clonal expansion of T cells in HBV-infected and healthy samples by TCRs. (A) The average proportion of clonal cells of each cell cluster in total clonal cells of top five clonotypes. (B) The distribution of top five clonotypes in each sample on the tSNE plots. (C) Significant differences of proportion of V- and J-segment usage between HBV and control group (*p<0.05, Mann–Whitney U test). Abbreviations: TCR, T cell receptor; HBV, hepatitis B virus; CD8-C, CD8-cluster; CD4-C, CD4-cluster. |
Ligand–Receptor Interactions Among Different Immune Cell Subsets
We used CellPhoneDB to identify intercellular communications among different immune cell subsets in HBV-infected and healthy samples (Figure 6). We found that CCR1-CCL5, CCR1-CCL3 receptor/ligand pairs between atypical monocytes and other immune cell subsets, CD94: NKG2E- HLA-E between effector/memory CD8+ T cells and other immune cell subsets were enhanced in HBV-infected samples. The inhibitory interaction produced by CD160-TNFRSF14 between CD56bright CD16-NK cells and other immune cell subsets was weakened in HBV-infected samples.
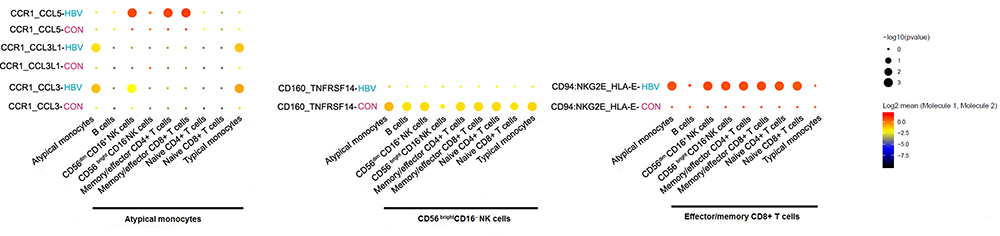 |
Figure 6 Intercellular communication among different immune cell subsets. |
Discussion
Past previous research focuses on the phenotype and functions of HBV-specific T cells during chronic HBV infection in the absence of a pregnancy. Schuch et al reported that impaired circulating T cell responses were different between core- and pol-specific CD8+ T cells in chronically HBV-infected patients with a low viral load.23 Wang et al identified TNF-a producing CD4+ T cells, which were the dominant immune cell population in patients with chronic HBV infection and may be involved in liver damage.20 Another study reported that the combination of antioxidants and natural polyphenols may contribute to reconstitution of an efficient antiviral T cell response.25 Evidence regarding HBV-related immune cells during pregnancy is sparse. Only a recent study suggested that the immune status of chronic HBV-infected pregnant women was different from that of chronic HBV-infected nonpregnant women. It found that T cells in HBV-infected mothers with ALT flare produced fewer anti-inflammatory cytokines or more pro-inflammatory cytokines than those in HBV-infected mothers without ALT flare before, during, or after antiviral treatment.38
Accordingly, in this present study, we constructed a comprehensive single-cell map of PBMCs in HBV-infected pregnant women with a high HBV viral load and healthy pregnant women. We found significant differences between HBV-infected and healthy samples, including T cell subtypes, dominant gene sets, T cell functions, clonal expansion, and V/J gene usage of T cell clonotypes. We also characterized a T cell cluster (CD8-C2), which may proliferate in HBV-related samples with distinctive functional features. Finally, we present a detailed map of global interactions among different immune cell subtypes.
We found that HBV-infected pregnant women may have partial active T cell immune response due to a larger number of effector/memory CD8+ T cells present than that of healthy pregnant women. There were no differences in the proportion of other immune cell populations between HBV-infected and healthy pregnant women. It can be inferred that T cells may have distinct characteristics in HBV-infected pregnant women, which is similar to the results of the above-mentioned study HBV-infected pregnant women with ALT flare.38 In HBV-related samples, pathways related with multiple inflammatory responses were activated in both of CD4+ and CD8+ effector/memory T cells. In addition, both CD4+ and CD8+ effector/memory T cells expressed higher levels of MT and metal ion pathway genes. The upregulation of metal ion pathways and mineral absorption were related to the higher expression of related MT genes in HBV-related samples. Studies already demonstrated that the expression of MTs in both CD4+ and CD8+ T cells could influence immune responses due to zinc-dependent proteins.39–41 IFN-α and inflammatory cytokines, such as TNF, IL-1β, and IL-6 have been reported to induce MTs, suggesting they may participate in immunity.41,42 If MTs could suppress or activate T cells’ function remains debatable. One study found that CD4+ T cells activation and proliferation are related with an increased expression of MTs. The release of Zn2+ from MT correlates with an elevated p38 MAPK activation following restimulation. Manipulating [Zn2+] or MT expression during activation influences cytokine secretion patterns and cell signaling networks.39 Another study reported that MTs were highly enriched in dysfunctional T cells.41 In our study, T cell activation pathway was upregulated in effector/memory CD8+ T cells in HBV-related samples with an increased expression of MTs in both effector/memory CD4+ and CD8+ T cells. It may indicate that MTs exert a favorable effect on T cell activation.
Among CD8 T cell clusters, we identified that HBV-infected pregnant women may show a trend of an increased number of a particular subset of effector/memory CD8+ T cells (CD8-C2) with a high degree of CD8-C2 clonal expansion. MT genes (MT1X, MT1E, MT2A, MT1F) were the most evident markers of CD8-C2. Some studies already reported that the effect of MTs on T cells could be considered a novel therapeutic target for the manipulation of immune responses in chronic viral infection or cancer.39,41 In addition, all results regarding CD8-C2 indicate that CD8-C2 may be the main cluster of activated CD8+ T cells, which has cytotoxic activity as well as pro-inflammatory properties in an HBV infection.33,43 CD8-C2 may be considered a promising CD8+ T cell cluster as a target for further improvement of anti-HBV therapy.
Finally, our results show the intercellular interaction of all immune cell population types in HBV-infected and healthy samples. HBV-infected samples exhibited more active signaling pathways in atypical monocytes, effector/memory CD8+ T cells, and other cell populations44,45 and lower levels of inhibitory interactions between CD56 bright CD16− NK cells and other cell populations.32,46,47 This finding further corroborates the notion that healthy pregnant women may be in an immunosuppressed status, while in infected pregnant women, some immune responses may be activated due to the presence of an HBV infection.38
Our study found evidence of part of active immune responses and pro-inflammatory immunity as well as potential T-cell cytotoxicity in HBV-infected pregnant women. It can be inferred that chronically HBV-infected pregnant women with a high viral load might remain in an incomplete immune tolerance state at the level of PBMCs because of hormonal fluctuations and increased metabolic burden.48 Immune system during pregnancy is dynamically changed with the various stages of pregnancy. Alteration of maternal immune status may lead to ALT flare and liver damage during pregnancy and postpartum.38,49
There are unavoidable limitations in this study. First, the number of HBV-related and healthy samples collected is relatively small; nonetheless, we identified distinct immune microenvironments between the two groups. Second, the results require further validation from bulk RNA-seq and functional experiments.
Conclusion
This study provides deeper insights into the immune microenvironment in both healthy and HBV-infected pregnant women. HBV-infected pregnant women may have a more active immune response, especially by activated CD8+ T cells, compared with that of healthy pregnant women. We identified a distinct subset of activated CD8+ T cells with MTs as the top-ranking genes, which may be enriched in HBV-related samples. We also found different V/J genes in clonotypes of T cells in HBV-related samples compared to healthy samples. These findings may fuel advances in understanding the immune-related pathogenesis of HBV infection in pregnant women with a high HBV viral load and provide a theoretical basis for improving HBV therapy during pregnancy in the future.
Acknowledgments
This study was funded by The National Natural Science Fund, China (81771615), Shaanxi Science and Technology Coordination Innovation Project Plan, China (2016KTCL03-01), the Clinical Research Award of the First Affiliated Hospital of Xi’an Jiaotong University, China (XJTU1AF-CRF-2018-008) and Shaanxi Key Science and Technology Innovation Team Project (2019TD-031).
Author Contributions
All authors made a significant contribution to the work reported, whether that is in the conception, study design, execution, acquisition of data, analysis and interpretation, or in all these areas; took part in drafting, revising or critically reviewing the article; gave final approval of the version to be published; have agreed on the journal to which the article has been submitted; and agree to be accountable for all aspects of the work.
Disclosure
The authors report no conflicts of interest in this work.
References
1. Reyfman PA, Walter JM, Joshi N, et al. Single-cell transcriptomic analysis of human lung provides insights into the pathobiology of pulmonary fibrosis. Am J Respir Crit Care Med. 2019;199(12):1517–1536. doi:10.1164/rccm.201712-2410OC
2. MacParland SA, Liu JC, Ma XZ, et al. Single cell RNA sequencing of human liver reveals distinct intrahepatic macrophage populations. Nat Commun. 2018;9(1):4383. doi:10.1038/s41467-018-06318-7
3. Koh S, Kah J, Tham CYL, et al. Nonlytic lymphocytes engineered to express virus-specific T-cell receptors limit HBV infection by activating APOBEC3. Gastroenterology. 2018;155(1):180–193 e186. doi:10.1053/j.gastro.2018.03.027
4. Schweitzer A, Horn J, Mikolajczyk RT, Krause G, Ott JJ. Estimations of worldwide prevalence of chronic hepatitis B virus infection: a systematic review of data published between 1965 and 2013. Lancet. 2015;386(10003):1546–1555. doi:10.1016/S0140-6736(15)61412-X
5. Lim CJ, Lee YH, Pan L, et al. Multidimensional analyses reveal distinct immune microenvironment in hepatitis B virus-related hepatocellular carcinoma. Gut. 2019;68(5):916–927. doi:10.1136/gutjnl-2018-316510
6. Chen YY, Hao XL, Sun R, Wei HM, Tian ZG. Natural killer cell-derived interferon-gamma promotes hepatocellular carcinoma through the epithelial cell adhesion molecule-epithelial-to-mesenchymal transition axis in hepatitis B virus transgenic mice. Hepatology. 2019;69(4):1735–1750. doi:10.1002/hep.30317
7. Dusseaux M, Masse-Ranson G, Darche S, et al. Viral load affects the immune response to HBV in mice with humanized immune system and liver. Gastroenterology. 2017;153(6):1647. doi:10.1053/j.gastro.2017.08.034
8. Song J, Yang F, Wang S, et al. Efficacy and safety of antiviral treatment on blocking the mother-to-child transmission of hepatitis B virus: a meta-analysis. J Viral Hepat. 2019;26(3):397–406.
9. Jourdain G, Ngo-Giang-Huong N, Harrison L, et al. Tenofovir versus placebo to prevent perinatal transmission of hepatitis B. N Engl J Med. 2018;378(10):911–923. doi:10.1056/NEJMoa1708131
10. Chen HL, Lee CN, Chang CH, et al. Efficacy of maternal tenofovir disoproxil fumarate in interrupting mother-to-infant transmission of hepatitis B virus. Hepatology. 2015;62(2):375–386. doi:10.1002/hep.27837
11. Wang M, Bian Q, Zhu Y, et al. Real-world study of tenofovir disoproxil fumarate to prevent hepatitis B transmission in mothers with high viral load. Aliment Pharmacol Ther. 2019;49(2):211–217. doi:10.1111/apt.15064
12. Cheung KW, Lao TT. Hepatitis B - Vertical transmission and the prevention of mother-to-child transmission. Best Pract Res Clin Obstet Gynaecol. 2020;68(78):78–88. doi:10.1016/j.bpobgyn.2020.02.014
13. Funk AL, Lu Y, Yoshida K, et al. Efficacy and safety of antiviral prophylaxis during pregnancy to prevent mother-to-child transmission of hepatitis B virus: a systematic review and meta-analysis. Lancet Infect Dis. 2021;21(1):70–84. doi:10.1016/S1473-3099(20)30586-7
14. Heimbach JK, Kulik LM, Finn RS, et al. AASLD guidelines for the treatment of hepatocellular carcinoma. Hepatology. 2018;67(1):358–380. doi:10.1002/hep.29086
15. Pan CQ, Duan Z, Dai E, et al. Tenofovir to prevent hepatitis B transmission in mothers with high viral load. N Engl J Med. 2016;374(24):2324–2334. doi:10.1056/NEJMoa1508660
16. Boni C, Vecchi A, Rossi M, et al. TLR7 agonist increases responses of hepatitis B virus-specific T cells and natural killer cells in patients with chronic hepatitis B treated with nucleos(T)ide analogues. Gastroenterology. 2018;154(6):1764–1777 e1767. doi:10.1053/j.gastro.2018.01.030
17. Brown RS, McMahon BJ, Lok ASF, et al. Antiviral therapy in chronic hepatitis B viral infection during pregnancy: a systematic review and meta-analysis. Hepatology. 2016;63(1):319–333. doi:10.1002/hep.28302
18. Gill US, Pallett LJ, Thomas N, et al. Fine needle aspirates comprehensively sample intrahepatic immunity. Gut. 2019;68(8):1493–1503. doi:10.1136/gutjnl-2018-317071
19. Nayagam S, Shimakawa Y, Lemoine M. Mother-to-child transmission of hepatitis B: What more needs to be done to eliminate it around the world? J Viral Hepat. 2020;27(4):342–349. doi:10.1111/jvh.13231
20. Wang H, Luo H, Wan X, et al. TNF-alpha/IFN-gamma profile of HBV-specific CD4 T cells is associated with liver damage and viral clearance in chronic HBV infection. J Hepatol. 2020;72(1):45–56. doi:10.1016/j.jhep.2019.08.024
21. Wijaya RS, Read SA, Schibeci S, et al. KLRG1+ natural killer cells exert a novel antifibrotic function in chronic hepatitis B. J Hepatol. 2019;71(2):252–264. doi:10.1016/j.jhep.2019.03.012
22. Hoogeveen RC, Robidoux MP, Schwarz T, et al. Phenotype and function of HBV-specific T cells is determined by the targeted epitope in addition to the stage of infection. Gut. 2019;68(5):893–904. doi:10.1136/gutjnl-2018-316644
23. Schuch A, Salimi Alizei E, Heim K, et al. Phenotypic and functional differences of HBV core-specific versus HBV polymerase-specific CD8+ T cells in chronically HBV-infected patients with low viral load. Gut. 2019;68(5):905–915. doi:10.1136/gutjnl-2018-316641
24. Vandeven N, Nghiem P. Pathogen-driven cancers and emerging immune therapeutic strategies. Cancer Immunol Res. 2014;2(1):9–14. doi:10.1158/2326-6066.CIR-13-0179
25. Acerbi G, Montali I, Ferrigno GD, et al. Functional reconstitution of HBV-specific CD8 T cells by in vitro polyphenol treatment in chronic hepatitis B. J Hepatol. 2021;74(4):783–793. doi:10.1016/j.jhep.2020.10.034
26. Butler A, Hoffman P, Smibert P, Papalexi E, Satija R. Integrating single-cell transcriptomic data across different conditions, technologies, and species. Nat Biotechnol. 2018;36(5):411. doi:10.1038/nbt.4096
27. Haque M, Lei F, Xiong X, et al. Stem cell-derived viral antigen-specific T cells suppress HBV replication through production of IFN-gamma and TNF. iScience. 2020;23(7):101333. doi:10.1016/j.isci.2020.101333
28. Bertoletti A, Tan AT. HBV as a target for CAR or TCR-T cell therapy. Curr Opin Immunol. 2020;66(35):35–41. doi:10.1016/j.coi.2020.04.003
29. Khakpoor A, Ni Y, Chen A, et al. Spatiotemporal differences in presentation of CD8 T cell epitopes during hepatitis B virus infection. J Virol. 2019;93(4). doi:10.1128/JVI.01457-18.
30. Rinker F, Zimmer CL, Honer Zu Siederdissen C, et al. Hepatitis B virus-specific T cell responses after stopping nucleos(t)ide analogue therapy in HBeAg-negative chronic hepatitis B. J Hepatol. 2018;69(3):584–593. doi:10.1016/j.jhep.2018.05.004
31. Macosko EZ, Basu A, Satija R, et al. Highly parallel genome-wide expression profiling of individual cells using Nanoliter droplets. Cell. 2015;161(5):1202–1214. doi:10.1016/j.cell.2015.05.002
32. Chen YP, Yin JH, Li WF, et al. Single-cell transcriptomics reveals regulators underlying immune cell diversity and immune subtypes associated with prognosis in nasopharyngeal carcinoma. Cell Res. 2020;30(11):1024–1142.
33. Zhang L, Yu X, Zheng L, et al. Lineage tracking reveals dynamic relationships of T cells in colorectal cancer. Nature. 2018;564(7735):268–272. doi:10.1038/s41586-018-0694-x
34. Finak G, McDavid A, Yajima M, et al. MAST: a flexible statistical framework for assessing transcriptional changes and characterizing heterogeneity in single-cell RNA sequencing data. Genome Biol. 2015;16(1):278. doi:10.1186/s13059-015-0844-5
35. Zhu Z, Huang S, Zhang Y, et al. Bioinformatics analysis on multiple gene expression Omnibus datasets of the hepatitis B virus infection and its response to the interferon-alpha therapy. BMC Infect Dis. 2020;20(1):84. doi:10.1186/s12879-019-4720-x
36. Trapnell C, Cacchiarelli D, Grimsby J, et al. The dynamics and regulators of cell fate decisions are revealed by pseudotemporal ordering of single cells. Nat Biotechnol. 2014;32(4):381–386. doi:10.1038/nbt.2859
37. Shugay M, Bagaev DV, Turchaninova MA, et al. VDJtools: unifying post-analysis of T cell receptor repertoires. PLoS Comput Biol. 2015;11(11):e1004503. doi:10.1371/journal.pcbi.1004503
38. Huang M, Gao Y, Yin X, et al. Characterization of T cell immunity in chronic hepatitis B virus-infected mothers with postpartum alanine transaminase flare. BMC Infect Dis. 2021;21(1):922. doi:10.1186/s12879-021-06634-2
39. Rice JM, Zweifach A, Lynes MA. Metallothionein regulates intracellular zinc signaling during CD4(+) T cell activation. BMC Immunol. 2016;17(1):13. doi:10.1186/s12865-016-0151-2
40. Yurkow EJ, Makhijani PR. Flow cytometric determination of metallothionein levels in human peripheral blood lymphocytes: utility in environmental exposure assessment. J Toxicol Environ Health Part A. 1998;54(6):445–457. doi:10.1080/009841098158737
41. Singer M, Wang C, Cong L, et al. A distinct gene module for dysfunction uncoupled from activation in tumor-infiltrating T cells. Cell. 2016;166(6):1500–1511 e1509. doi:10.1016/j.cell.2016.08.052
42. Read SA, O’Connor KS, Suppiah V, et al. Zinc is a potent and specific inhibitor of IFN-lambda3 signalling. Nat Commun. 2017;8(1):15245. doi:10.1038/ncomms15245
43. Lambrechts D, Wauters E, Boeckx B, et al. Phenotype molding of stromal cells in the lung tumor microenvironment. Nat Med. 2018;24(8):1277–1289. doi:10.1038/s41591-018-0096-5
44. Orbelyan GA, Tang F, Sally B, et al. Human NKG2E is expressed and forms an intracytoplasmic complex with CD94 and DAP12. J Immunol. 2014;193(2):610–616. doi:10.4049/jimmunol.1400556
45. Guo C, Cai P, Jin L, et al. Single-cell profiling of the human decidual immune microenvironment in patients with recurrent pregnancy loss. Cell Discov. 2021;7(1):1. doi:10.1038/s41421-020-00236-z
46. Vento-Tormo R, Efremova M, Botting RA, et al. Single-cell reconstruction of the early maternal-fetal interface in humans. Nature. 2018;563(7731):347–353. doi:10.1038/s41586-018-0698-6
47. Kamiya T, Seow SV, Wong D, Robinson M, Campana D. Blocking expression of inhibitory receptor NKG2A overcomes tumor resistance to NK cells. J Clin Invest. 2019;129(5):2094–2106. doi:10.1172/JCI123955
48. Mjosberg J, Svensson J, Johansson E, et al. Systemic reduction of functionally suppressive CD4(dim)CD25(high)Foxp3(+) tregs in human second trimester pregnancy is induced by progesterone and 17 beta-estradiol. J Immunol. 2009;183(1):759–769. doi:10.4049/jimmunol.0803654
49. Rehermann B. Pathogenesis of chronic viral hepatitis: differential roles of T cells and NK cells. Nat Med. 2013;19(7):859–868. doi:10.1038/nm.3251
 © 2021 The Author(s). This work is published and licensed by Dove Medical Press Limited. The full terms of this license are available at https://www.dovepress.com/terms.php and incorporate the Creative Commons Attribution - Non Commercial (unported, v3.0) License.
By accessing the work you hereby accept the Terms. Non-commercial uses of the work are permitted without any further permission from Dove Medical Press Limited, provided the work is properly attributed. For permission for commercial use of this work, please see paragraphs 4.2 and 5 of our Terms.
© 2021 The Author(s). This work is published and licensed by Dove Medical Press Limited. The full terms of this license are available at https://www.dovepress.com/terms.php and incorporate the Creative Commons Attribution - Non Commercial (unported, v3.0) License.
By accessing the work you hereby accept the Terms. Non-commercial uses of the work are permitted without any further permission from Dove Medical Press Limited, provided the work is properly attributed. For permission for commercial use of this work, please see paragraphs 4.2 and 5 of our Terms.