")
Back to Journals » ImmunoTargets and Therapy » Volume 7
Alteration of gene expression profile in CD3+ T-cells after downregulating MALT1
Authors Wang X, Lu S, Xiao Y, Xu L , Zhou L, Hu JY, Li B, Zeng C , Li Y
Received 10 July 2018
Accepted for publication 18 September 2018
Published 20 November 2018 Volume 2018:7 Pages 77—81
DOI https://doi.org/10.2147/ITT.S179656
Checked for plagiarism Yes
Review by Single anonymous peer review
Peer reviewer comments 2
Editor who approved publication: Professor Michael Shurin
Xu Wang,1,2,* Shuai Lu,1,2,* Yankai Xiao,1,2 Ling Xu,2,3 Lingling Zhou,1,2 Junyan Hu,2 Bo Li,1,2 Chengwu Zeng,1,2 Yangqiu Li1–3
1Key Laboratory for Regenerative Medicine of Ministry of Education, Jinan University, Guangzhou, 510632, People’s Republic of China; 2Institute of Hematology, Jinan University, Guangzhou, 510632, People’s Republic of China; 3Department of Hematology, First Affiliated Hospital, Jinan University, Guangzhou, 510632, People’s Republic of China
*These authors contributed equally to this work
Background: T cell immunodeficiency is a common feature in patients with different kinds of hematological disease such as T cell non-Hodgkin lymphoma (T-NHL), B cells NHL (B-NHL), NK/T cell NHL (NK/T-CL) and acute myeloid leukemia (AML). In our recent research, we found that significantly lower expression levels in MALT1 and NF-κB were related to suppression of T cell activation. Therefore, this study was conducted to further investigate the role of downregulating MALT1 in the development of immunodeficiency in T cells.
Methods: We induced activation inhibition in CD3+ T cells by MALT1 knockdown. Then we characterized the gene expression profile after MALT1 suppression by microarray analysis.
Result: The differentially expressed genes were ZAP-70, p65, MDM2, ATM, NFATC2 which participate in the NF-κB, p53, and NFAT pathways in CD3+ T cells after MALT1 downregulation.
Conclusion: MALT1 suppression may contribute to immunodeficiency in T cells via suppression of T cell activation and proliferation pathways. These data may help to explain some of the characteristics of immunodeficiency of T cells.
Keywords: CD3+ T-cells, MALT1, immunodeficiency, T-cell activation, microarray
Introduction
MALT1 has been gradually regarded as an important point of various signaling pathways in both innate and adaptive immune cells. MALT1 has an essential role in the activation of NF-κB by antigen receptors and in the control of lymphocyte activation and proliferation, but also including other receptors in regulating NF-κB with immunoreceptor tyrosine-based activation motifs and some G-protein coupled receptors expressed by both immune and nonimmune cells.1,2 Recently, we found that lower expression of MALT1, which results in lower T-cell activation, is a common characteristic in patients with T-cell non-Hodgkin lymphoma (T-NHL), B-cell NHL (B-NHL), NK/T-cell NHL (NK/T-CL), and acute myeloid leukemia, and it may play a critical role in the molecular mechanisms involved in T-cell immunodeficiency in such hematological malignances.3,4 Also, there are only a few studies focusing on the mechanism of immunodeficiency that may be induced by the deficiency of MALT1. So, in this study, we further analyzed the gene expression profile pattern related to T-cell activation and apoptosis in normal CD3+ T-cells which have been treated by MALT1-siRNA to confirm the role of MALT1 in immune regulation and its molecular mechanism.
Materials and methods
Cell culture
The human CD3+ T-cells were sorted from peripheral blood mononuclear cells (PBMCs) that were obtained from one healthy donor from our team by positive selection using CD3 microbeads (Miltenyi Biotec, Bergisch Gladbach, Germany). The study was approved by the ethics committee of The First Affiliated Hospital of Jinan University. The donor was informed about this study, and written informed consent was signed. The purified CD3+ T-cells were cultured in complete medium, which was supplemented with 200 IU/mL of IL-2 and 2 µg/mL of PHA and maintained in a 95% humidified incubator at 37°C and 5% CO2 for 6 days after stimulation and used for siRNA transduction using Nucleofector™ technology (Amaxa Biosystems, Cologne, Germany).5
siRNA design and synthesis
MALT1-siRNA524 which targets domains between the eighth and ninth exons in the MALT1 gene (Accession: NM_006785.3) and a scrambled nonsilencing siRNA control (SC) were designed with online software (www.invitrogen.com) and synthesized by Invitrogen (Carlsbad, CA, USA).6
Nucleofection
Human CD3+ T-cells were resuspended at 5×10⁶ per 100 µL of Nucleofector solution from the human T-cell Nucleofector™ kit at room temperature,5,7 and were nucleofected with 3 µg of MALT1-siRNA or a control SC siRNA using the T-020 program of the Nucleofection Device II (Amaxa Biosystems). Mock-transfected cells nucleofected without siRNA were used as a negative control. After nucleofection, the cells were immediately mixed with 500 µL of prewarmed culture medium and transferred into culture plates. The treated cells were incubated at 37°C and were collected for RNA isolation.5
RNA isolation and real-time PCR
According to the results that the expression efficiency of siRNA was the highest and the viability of T-cells was the best, we chose to analyze the mRNA expression 48 hours posttransduction. Total RNA was extracted from the CD3+ T-cells according to the manufacturer’s instructions (TRIzol reagent; Invitrogen). The RNA quality was analyzed using 0.8% agarose gel electrophoresis with ethidium bromide staining.3,5 The expression levels of MALT1 and the β2-M reference gene were determined by SYBR Green I real-time PCR. PCR was performed as previously described.3,5 The sequences for the primers used in quantitative real-time PCR were as follows: MALT1: 5′-AAGCCCTATTCCTCACTACCAG-3′ (forward) and 5′-CACTCCACTGCCTCATCTGTTC-3′ (reverse); β2-M: 5′-TACACTGAATTCACCCCCAC-3′ (forward) and 5′-CATCCAATCCAAATGCGGCA-3′ (reverse).
Affymetrix microarray analysis
Total RNA (>3 µg) was sent for global gene expression profile analysis using the Affymetrix HG-U133 plus 2.0 gene chip (Shanghai Biochip Co. Ltd, Shanghai, People’s Republic of China). Affymetrix microarray analysis was performed using the Gene Spring GX11.0 software (Agilent Technologies, Santa Clara, CA, USA).8,9 Probe sets displayed a signal log ratio indicating an increase or marginal increase (ie, log ratio ≥1 (n)) and the detection of an experimental group displayed a signal change with P representing upregulated genes. Conversely, probe sets displayed a signal log ratio indicating a decrease or marginal decrease (ie, log ratio < –1(n)), and the detection of a control group displayed a signal change with P representing downregulated genes. The result data were analyzed using the SBC Analysis System (Shanghai Biotechnology Corporation, Shanghai, People’s Republic of China). After normalization and correction, the log2 fluorescence intensity value for each gene was obtained.8,9 A minimum 2-fold difference was considered significant. The fold change for all genes was calculated by comparing the MALT1-siRNAs- and SC-treated Human CD3+ T-cells.8,9
Statistical analysis
Unpaired t-test was used to analyze the MALT1 expression between different groups. A P<0.05 was considered to be statistically significant.
Results and discussion
Gene expression patterns of MALT1-siRNA-treated CD3+ T-cells
To determine the mechanisms of MALT1-mediated T-cell immunodeficiency and hematological malignances, we first downregulated MALT1 expression by MALT1-siRNA and analyzed its expression level by quantitative real-time PCR. The result indicated that there was a significantly lower expression of MALT1 in MALT1-siRNA-treated CD3+ T-cells (siRNA group: 0.10±0.01, SC group: 0.34±0.01; P<0.001) (Figure 1). Affymetrix microarray analysis was then performed. From the result we found that 339 genes (>2-fold: 17 genes; >4-fold: 1 gene) were upregulated and 854 genes (>2-fold: 104 genes, >4-fold: 1 gene) were downregulated at least 1.5-fold when the MALT1-siRNA- and SC-treated expression data were compared. Then the genes which have at least 1.5-fold change and were involved in the apoptosis and proliferation pathway were selected to make heatmap (Figure 2A, Table 1).
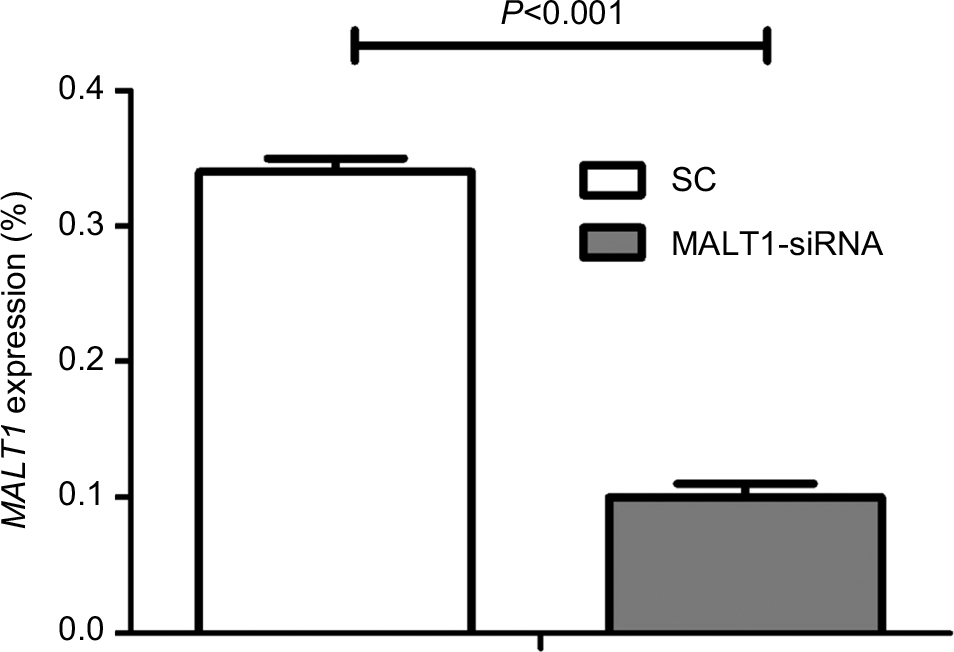 | Figure 1 The expression level of MALT1 in CD3+ T-cells treated by MALT1-siRNA. Notes: SC group was nucleofected with scrambled nonsilencing siRNA control, while MALT1-siRNA group was nucleofected with MALT1-siRNA. Then RNA isolation and real-time PCR were done with both groups. MALT1 expression level in SC group is 3-fold higher than that in MALT1-siRNA group. Abbreviation: SC, nonsilencing siRNA control. |
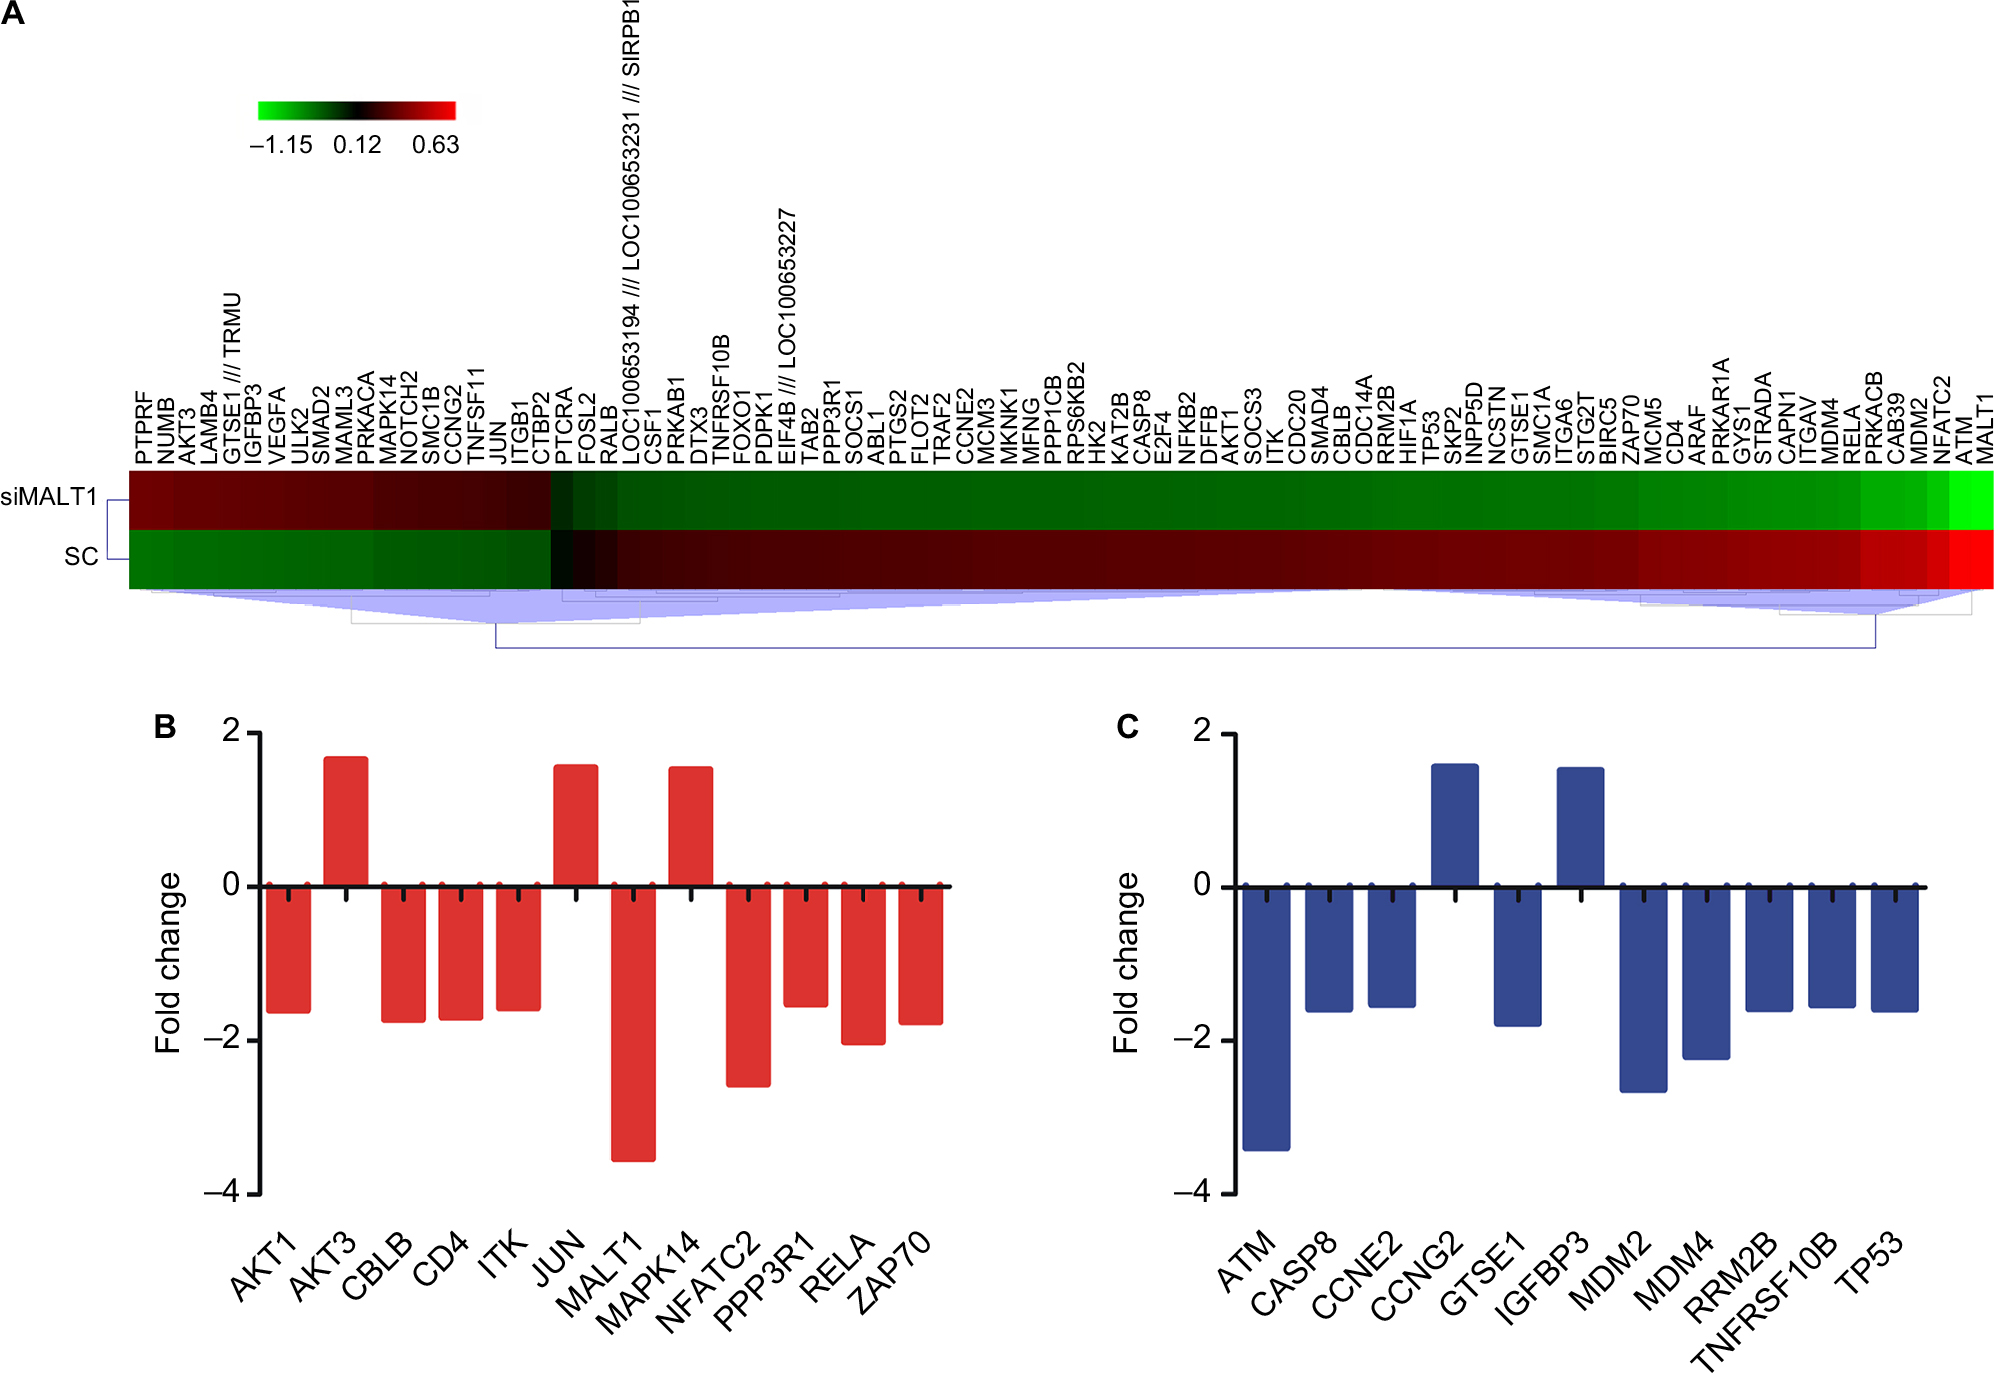 | Figure 2 Gene expression patterns of MALT1-siRNA-treated CD3+ T-cells. Notes: (A) The Affymetrix data were clustered from the genes which have at least 1.5-fold change and were involved in the apoptosis and proliferation pathway, and the red and green colors represent the expression levels increased or decreased, respectively, and the color intensity represents the degree of expression in siRNA-MALT1 CD3+ T-cells; (B) TCR signaling pathway genes, (C) p53 signaling pathway genes differentially expressed in CD3+ T-cells after downregulating MALT1. Abbreviation: TCR, T-cell receptor. |
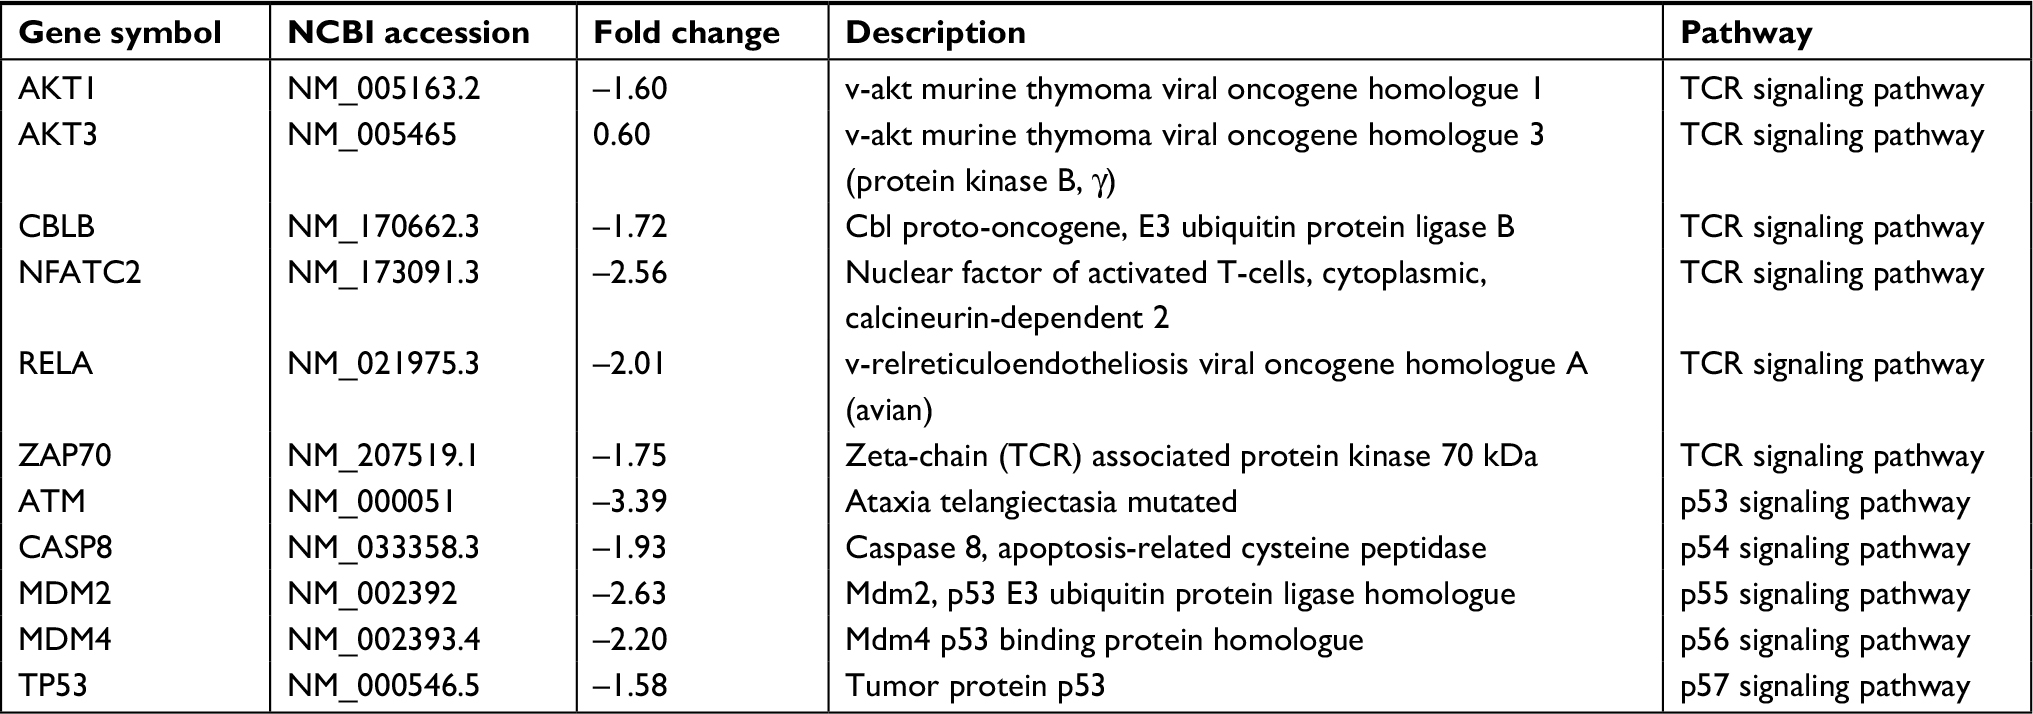 | Table 1 Cell activation and apoptosis associated genes altered after MALT1 knockdown in CD3+ T-cells in microarray analysis Abbreviations: TCR, T-cell receptor; NCBI, National Center for Biotechnology Information. |
Genes altered in TCR signaling pathway
The antigen-specific T-cell receptor (TCR) of the adaptive immune system triggers distinct signal transduction pathways. Numerous genetic models in mice have confirmed the essential role of various transcription factors, like NF-κB, AP1, and NFAT, in promoting T-cell activation, expansion, and effector function in response to infection.10–12 In addition, abnormal pathway activation induced by TCR or abnormal activation of upstream regulators contribute to the development of autoimmunity, chronic inflammation, and malignances.13,14 Moreover, T-cell-induced immune function disorders are also associated with a risk for malignant transformation.15
In this study, 12 genes were differentially expressed, including 3 upregulated genes and 9 downregulated genes, in the TCR signaling pathway (Figure 2B). The significant altered gene RelA (fold change: 0.49) which was downregulated after MALT1 suppression is the most important one of mammalian NF-κB family including Rel-A, NF-κB1, NF-κB2, c-Rel, and Rel-B.16 The c-Rel, Rel-B, and Rel-A proteins also have a carboxyl-terminal nonhomologous transactivation domain, which strongly activates transcription from NF-κB-binding sites in target genes and phosphorylation of Rel-A.11,16 Zap-70 is a cytosolic protein, and it is recruited at the plasma membrane of T-cells following TCR stimulation, and binds to phosphorylated CD3ζ ITAM; it plays a critical role in activating downstream signal transduction pathways in T-cells following TCR engagement.16,17 The results showed that the downregulation of ZAP-70 and Rel-A contributed to the NF-κB pathway inhibition on MALT1-siRNA-treated CD3+ T-cells. As a result, the activation of CD3+ T-cells would be inhibited.
Similarly, NFATC2 is important to the immune response and regulates the growth and differentiation of multiple cell types, and this gene was also downregulated,18,19 which can also help identify that the activation and the sensitivity of immune response of normal T-cells have been inhibited after MALT1-siRNA treatment. Above all, the genes which are closely related to activation and immune function of CD3+ T-cells emerged to have a low expression level, which can indicate that MALT1 may have an important role against immune dysfunction.
Genes altered in the p53 signaling pathway
TP53 (better known as p53) is a tumor suppressor gene that controls response to several different cellular stresses including DNA damage, hypoxia, and oncogene activation.20,21 In response to DNA damage and other stress signals, p53 is highly modified posttranslationally, which increases its stability and promotes its activation and nuclear localization.20,22 While mutations in the p53 gene are present in approximately 50% of all cancers, in most that retain the WT1 gene, its tumor suppressor ability may be reduced or eliminated by several different mechanisms.
In this study, there were totally eleven genes differentially expressed, including three upregulated genes and nine downregulated genes (Figure 2C). Among these genes, MDM2, MDMX, ATM, and p53 were downregulated in MALT1-siRNA-treated CD3+ T-cells. MDM2, which is an important negative regulator of the p53 tumor suppressor, is an E3 ubiquitin ligase that targets p53 protein for ubiquitin-dependent proteolysis in the proteasome.23 In addition, decreased levels of MDM2 and MDMX should result in high levels of p53 in cellular stresses, which is opposite to our result. Besides, the ATM gene, a positive regulator of p53 that triggers p53 Ser15 phosphorylation and promotes its transcriptional activation,9 was also downregulated, which contributes to the low level of p53 after siRNA-MALT1 treating. To sum up, the p53 signaling pathway also has been inhibited after siRNA-MALT1. So, the ability of cells to inhibit cancer development would be decreased, and the possibility for tumorigenesis would be increased.
In conclusion, we characterized altered expression profile of genes related to the TCR signaling pathway and p53 signaling pathway in MALT1-siRNA-treated CD3+ T-cells from a healthy individual. MALT1 suppression mediated inhibition of normal activation in CD3+ T-cells related to these two pathways through downregulation of Rel-A and NFATC2 may have an essential role in immunodeficiency, which is correlated with the results we found. Also, downregulation of p53 signaling pathway suggested that T-cells would have limited ability to help fix DNA mutations; thus, the function of T-cells would be unstable. However, further verification of the altered genes and related proteins is needed.
Conclusion
In this study, by using microarray analysis to evaluate the effects of MALT1 knockdown, we identified a number of genes associated with the NF-κB, p53, and NFAT pathways in the CD3+ T-cells after MALT1 downregulation. These data suggest that MALT1 suppression may contribute to immunodeficiency in T-cells via suppression of T-cell activation and proliferation pathways.
Author contribution
YQL and CWZ contributed to the concept development and study design. XW performed the Nucleofection and analyzed the data, XW, SL, YKX, LX, LLZ, and JYH performed the T-cell sorting and real-time PCR, and prepared PBMCs, RNA, cDNA, and cell culture. XW, YKX, BL, CWZ, and YQL coordinated the study and helped draft the manuscript. All authors read and approved the final manuscript. All authors contributed to data analysis, drafting or revising the article, gave final approval of the version to be published, and agree to be accountable for all aspects of the work.
Acknowledgment
This study was supported by grants from the National Natural Science Foundation of China (Nos. 81770152, 91642111, and 81270604), the Guangdong Science & Technology Project (No. 2015A050502029), the Guangdong Provincial Basic Research Program (No. 2015B020227003), the Guangdong Provincial Applied Science and Technology Research & Development Program (No. 2016B020237006), and the Guangzhou Science and Technology Project Foundation (201510010211, 201807010004, and 201803040017).
Disclosure
The authors report no conflicts of interest in this work.
References
Thome M. Multifunctional roles for MALT1 in T-cell activation. Nat Rev Immunol. 2008;8(7):495–500. | ||
Hara H, Iizasa E, Nakaya M, Yoshida H. L-CBM signaling in lymphocyte development and function. J Blood Med. 2010;1:93. | ||
Wang X, Xu Y, Liang L, et al. Abnormal expression of A20 and its regulated genes in peripheral blood from patients with lymphomas. Cancer Cell Int. 2014;14:36. | ||
Shi L, Chen S, Lu Y, et al. Changes in the MALT1-A20-NF-κB expression pattern may be related to T cell dysfunction in AML. Cancer Cell Int. 2013;13(1):37. | ||
Zha X, Chen S, Yang L, et al. Upregulated TCRζ enhances interleukin-2 production in T-cells from patients with CML. DNA Cell Biol. 2012;31(11):1628–1635. | ||
Shen Q, Liu S, Chen Y, et al. Proliferation inhibition and apoptosis induction of imatinib-resistant chronic myeloid leukemia cells via PPP2R5C down-regulation. J Hematol Oncol. 2013;6(1):64. | ||
Huang X, Chen S, Shen Q, et al. Down regulation of BCL11B expression inhibits proliferation and induces apoptosis in malignant T cells by BCL11B-935-siRNA. Hematology. 2011;16(4):236–242. | ||
Chen Y, Liu S, Shen Q, et al. Differential gene expression profiles of PPP2R5C-siRNA-treated malignant T cells. DNA Cell Biol. 2013;32(10):573–581. | ||
Liu S, Shen Q, Chen Y, et al. Alteration of gene expression profile following PPP2R5C knockdown may be associated with proliferation suppression and increased apoptosis of K562 cells. J Hematol Oncol. 2015;8(1):34. | ||
Bonizzi G, Karin M. The two NF-kappaB activation pathways and their role in innate and adaptive immunity. Trends Immunol. 2004;25(6):280–288. | ||
Hayden MS, Ghosh S. Shared principles in NF-kappaB signaling. Cell. 2008;132(3):344–362. | ||
Taefehshokr S, Key YA, Khakpour M, Dadebighlu P, Oveisi A. Early growth response 2 and Egr3 are unique regulators in immune system. Cent Eur J Immunol. 2017;42(2):205–209. | ||
Dolcet X, Llobet D, Pallares J, Matias-Guiu X. NF-kB in development and progression of human cancer. Virchows Arch. 2005;446(5):475–482. | ||
Bours V, Bentires-Alj M, Hellin AC, et al. Nuclear factor-kappa B, cancer, and apoptosis. Biochem Pharmacol. 2000;60(8):1085–1089. | ||
Grulich AE, Vajdic CM, Cozen W. Altered immunity as a risk factor for non-Hodgkin lymphoma. Cancer Epidemiol Biomarkers Prev. 2007;16(3):405–408. | ||
Baeuerle PA, Henkel T. Function and activation of NF-kappa B in the immune system. Annu Rev Immunol. 1994;12(1):141–179. | ||
Fischer A, Picard C, Chemin K, Dogniaux S, Le Deist F, Hivroz C. ZAP70: a master regulator of adaptive immunity. Semin Immunopathol. 2010;32(2):107–116. | ||
Crabtree GR, Olson EN. NFAT signaling: choreographing the social lives of cells. Cell. 2002;109 Suppl(2):S67–S79. | ||
Yu HB, Yurieva M, Balachander A, et al. NFATc2 mediates epigenetic modification of dendritic cell cytokine and chemokine responses to dectin-1 stimulation. Nucleic Acids Res. 2015;43(2):836–847. | ||
Duffy MJ, Synnott NC, Mcgowan PM, Crown J, O’Connor D, Gallagher WM. p53 as a target for the treatment of cancer. Cancer Treat Rev. 2014;40(10):1153–1160. | ||
Eliaš J, Dimitrio L, Clairambault J, Natalini R. The p53 protein and its molecular network: modelling a missing link between DNA damage and cell fate. Biochim Biophys Acta. 2014;1844(1 Pt B):232–247. | ||
Bieging KT, Mello SS, Attardi LD. Unravelling mechanisms of p53-mediated tumour suppression. Nat Rev Cancer. 2014;14(5):359–370. | ||
Gu J, Kawai H, Nie L, et al. Mutual dependence of MDM2 and MDMX in their functional inactivation of p53. J Biol Chem. 2002;277(22):19251–19254. |
 © 2018 The Author(s). This work is published and licensed by Dove Medical Press Limited. The full terms of this license are available at https://www.dovepress.com/terms.php and incorporate the Creative Commons Attribution - Non Commercial (unported, v3.0) License.
By accessing the work you hereby accept the Terms. Non-commercial uses of the work are permitted without any further permission from Dove Medical Press Limited, provided the work is properly attributed. For permission for commercial use of this work, please see paragraphs 4.2 and 5 of our Terms.
© 2018 The Author(s). This work is published and licensed by Dove Medical Press Limited. The full terms of this license are available at https://www.dovepress.com/terms.php and incorporate the Creative Commons Attribution - Non Commercial (unported, v3.0) License.
By accessing the work you hereby accept the Terms. Non-commercial uses of the work are permitted without any further permission from Dove Medical Press Limited, provided the work is properly attributed. For permission for commercial use of this work, please see paragraphs 4.2 and 5 of our Terms.