")
Back to Journals » OncoTargets and Therapy » Volume 12
α-Hederin Increases The Apoptosis Of Cisplatin-Resistant Gastric Cancer Cells By Activating Mitochondrial Pathway In Vivo And Vitro
Authors Liu Y, Lei H, Ma J, Deng H, He P, Dong W
Received 27 June 2019
Accepted for publication 18 September 2019
Published 23 October 2019 Volume 2019:12 Pages 8737—8750
DOI https://doi.org/10.2147/OTT.S221005
Checked for plagiarism Yes
Review by Single anonymous peer review
Peer reviewer comments 2
Editor who approved publication: Prof. Dr. Nicola Silvestris
Yinghui Liu,1,2,* Hongbo Lei,3,* Jingjing Ma,1,2 Huan Deng,1,2 Pengzhan He,1,2 Weiguo Dong1
1Department of Gastroenterology, Renmin Hospital of Wuhan University, Wuhan, Hubei Province, People’s Republic of China; 2Central Laboratory, Renmin Hospital of Wuhan University, Wuhan, Hubei Province, People’s Republic of China; 3Department of Oncology, Renmin Hospital of Wuhan University, Wuhan, Hubei Province, People’s Republic of China
*These authors contributed equally to this work
Correspondence: Weiguo Dong
Department of Gastroenterology, Renmin Hospital of Wuhan University, No. 238 JieFang Road, Wuhan 430060, Hubei Province, People’s Republic of China
Tel +86-27-88041911
Fax +86-27-88042992
Email [email protected]
Introduction: Gastric cancer remains an important cancer worldwide, and conventional chemotherapeutic drugs have the defects of drug resistance and cell toxicity. α-Hederin has been found to have certain therapeutic effects on various types of human cancers. However, studies on the α-hederin that exert biological activities on the cisplatin-resistant gastric cancer cells are limited. In this study, we evaluated the effects of α-hederin in HGC27/DDP and the potential mechanisms both in vivo and in vitro.
Methods: HGC27/DDP cells were cultured in DMEM/F12 medium. Cell proliferation and viability were assessed quantitatively using Cell Counting Kit-8. Cell invasion and migration were detected by Transwell invasion assay and wound healing assay. Cell apoptosis was examined by employing Hoechst 33258 Staining Kit and an Annexin V-PE apoptosis kit. Intracellular GSH levels were examined by using a GSH Assay Kit. DCFH-DA and JC-1 Kit were used to detect levels of intracellular reactive oxygen species (ROS) and changes in mitochondrial membrane potential (∆Ψm). The protein levels of Apaf-1, AIF, Bax, Bcl-2, Cyt C, Survivin, cleaved caspase-3, cleaved caspase-9, MMP-9 and MMP-2 were detected by Western blot analysis. The effect of α-hederin in vivo was observed by xenograft tumor models in nude mice.
Results: The α-hederin treatment significantly inhibited the proliferation in a dose- and time-dependent manner of HGC27/DDP and induced obvious apoptosis compared with the control group (P<0.05). Meanwhile, the ability of cells to invade and migrate was suppressed (P<0.05). The α-hederin induced the depletion of GSH (P<0.05) and the accumulation of intracellular ROS (P<0.05), changed the mitochondrial membrane potential (P<0.05), increased the Bax, Apaf-1, AIF, Cyt C, cleaved caspase-3 and cleaved caspase-9 expression and decreased the protein level of Bcl-2, survivin, MMP-9 and MMP-2 (P<0.05). Pretreatment with NAC (12 mM) enhanced the tendency and pretreatment with BSO (8 mM) attenuated the tendency above (P<0.05). Meanwhile, α-hederin inhibited xenograft tumor growth in vivo (P<0.05).
Conclusion: Our study provides strong molecular evidence to support our hypothesis that α-hederin inhibits the proliferation and induces the apoptosis of HGC27/DDP cells by increasing the levels of intracellular ROS and triggering mitochondrial pathway activation.
Keywords: α-hederin, cisplatin–resistant gastric cancer cells, apoptosis, reactive oxygen species, mitochondrial pathway
Introduction
Gastric cancer remains an important cancer worldwide, with the incidence rate ranking fifth in the global incidence of malignant tumors; it is the third leading cause of cancer death in the world. China accounts for more than 40% of the over 1,000,000 new cases of stomach cancer worldwide in 2018.1,2 Nowadays, surgery is the only potentially curative treatment of localized gastric cancer; however, many patients were usually diagnosed at advanced or metastatic stages and surgical removal is not feasible.3
Systemic chemotherapy is one of the main treatment measures. But conventional chemotherapeutic drugs in clinical gastric cancer treatment settings, such as cis-diamminedichloroplatinum (cisplatin, DDP),4 have the defects of drug resistance and cell toxicity.3,5 Many gastric cancer patients display cisplatin resistance through multiple mechanisms, including the intake reduction or increasing efflux mediated by specific transporters such as MDRs and ATP7B and additionally elevated expression of DNA repair genes.6 Therefore, it is of great significance to discover low toxicity and high-efficiency drugs from natural compounds for the treatment of DDP-resistant HGC27 gastric cancer cells (HGC27/DDP).
Nigella sativa seed is a common Chinese traditional medicine, which has anti-infection, antioxidant, antineoplastic, hypoglycemic and lipid-lowering as well as immune protection effects.7–9 And α-hederin is one of the main components because of of its antitumor effect. Previous studies have found that α-hederin has certain therapeutic effects on colon cancer, liver cancer, lung cancer, melanoma, leukemia and so on.10–13 α-hederin is thought to inhibit tumor cell proliferation and promote tumor cell apoptosis, which may be related to oxidant/antioxidant imbalance. However, excessive ROS can result in downstream signal transduction which will in turn activate oxidative damage of mitochondrial membrane and trigger apoptosis.14
Reports on the anti-HGC27/DDP cell activity of α-hederin are limited. In this study, we evaluated the effects of α-hederin on cisplatin-resistant gastric cancer cells both in vitro and in vivo and explore the potential mechanisms.
Materials And Methods
Reagents And Cell Culture
Cisplatin and α-hederin were obtained from Sigma (Sigma-Aldrich, St. Louis, MO, USA); cisplatin was dissolved in normal saline at a concentration of 4 mg/mL, while α-hederin was dissolved in 100% dimethyl sulfoxide (DMSO) of 100 mM for storage at 4°C. Bax, Bcl-2, Cyt C, Apaf-1, AIF, cleaved caspase-3, cleaved caspase-9 and GAPDH rabbit monoclonal antibodies were purchased from Cell Signaling Technology. The human gastric cancer cell line (HGC27) was donated by China Center for Type Culture Collection (CCTCC) and cultured in DMEM/F-12 medium (HyClone) supplemented with 10% FBS (Gibco), 1% antibiotic solution (penicillin 100U/mL and streptomycin 100g/mL) at 37°C, and 5% CO2 in a humidified incubator.
Cisplatin-Resistant Cell Construction
Gastric cancer cell line (HGC27) was seeded into a 6-well plate and cultured in fresh medium containing cisplatin at an initial concentration of 0.2 µg/mL. Then, observed the cells growth condition and cultured in cisplatin at the previous concentration until the HGC27 can grow steadily. Subsequently, increase the dose of cisplatin and repeat the procedure until cells could grow well in the presence of 1 µg/mL, then we obtained the cisplatin-resistant gastric cancer cell line (HGC27/DDP) that were tolerant to 1 µg/mL cisplatin.
Cell Proliferation Assay
Cell proliferation and viability were assessed quantitatively using Cell Counting Kit-8 (CCK-8, Beyotime, China). Generally, HGC27 and HGC27/DDP cells (5×10³cells/well) were separately seeded into a 96-well culture plate with 0.1 mL growth medium, and the next day the supernatant was removed and cells were incubated with a medium containing cisplatin of different concentrations (0, 1.6, 3.3, 6.6, 13.3, 26.6, 53.3 µM) for 24 hrs. Meanwhile, HGC27/DDP cells were treated with different doses of α-hederin (0, 2.5, 5, 10, 15, 20, 25 μM) for 24 hrs or 48 hrs. Afterward, 10 µL of CCK-8 dye was added to each well, and the cells were incubated for an additional 2 hrs. Ultimately, the absorbance of each sample at 450 nm was measured by a microplate reader (Victor3 1420 Multilabel Counter, Perkin Elmer, USA). DMEM containing 10% CCK-8 was used as a control.
Transwell Invasion Assay
The HGC27/DDP cells were digested and a total of 100 µL of the cell suspension (1×10⁴cells) was seeded on the upper chamber of a Transwell insert (Corning Costar Corp) with 8 µm pores that precoated with Matrigel (BD Biosciences). The lower chamber was added with 600 µL medium supplemented with 25% FBS. The next day, the lower chamber’s medium containing α-hederin of 0, 5 μM, 10 μM, 15 μM was exchanged 24 hrs later, the insert was fixed by 4% paraformaldehyde solution for 15 mins and stained with 0.1% crystal violet. Invasion cells were observed and calculated in eight random fields under the microscope.
Wound Healing Assay
Cells were seeded into a 6-well plate chamber (1×10⁵cells/well) with fresh medium for 24 hrs. Then, using a 200-µL pipette tip on the bottom of the chamber to scratch a monolayer wound with cell fusion degree up to 80% or 90%, cleaning the floating debris by PBS and immediately photographs were taken (time 0 hrs). Subsequently, the cells were cultured in DMEM/F-12 medium supplemented by 3% FBS with different concentrations of α-hederin (0, 5, 10 and 15 μM) and took photos at 24 hrs and 48 hrs. The area of the wound during this time period was measured.
Hoechst 33258 Staining For Apoptotic Cells
Cell apoptosis was examined by employing Hoechst 33258 Staining Kit (Beyotime). HGC27/DDP cells were cultured into a 6-well plate (1×10⁵cells/well) with fresh medium for 24 hrs and then treated with α-hederin for 0, 5 μM, 10 μM, 15 μM and 10 μM with or without pretreatment 8 mM DL-buthionine-S, R-sulfoximine (BSO, Sigma-Aldrich) or 12 mM N-acetylcysteine (NAC, Sigma-Aldrich) for 2 hrs for another 24 hrs. Subsequently, the cells were fixed by 4% paraformaldehyde solution for 20 mins, washed twice with PBS and stained with Hoechst 33258 for 20 mins at room temperature in the dark. A fluorescence microscope (BX51, Olympus, Japan) was applied to observe and capture the apoptotic morphological features such as chromatin condensation and nuclear fragmentation.
Apoptosis Analysis By Flow Cytometry
The percentage of apoptotic cells was quantified by flow cytometry (FACS-Calibur, Becton-Dickinson) using Annexin V-PE/7-AAD Kit (BD, USA). Cells were seeded into a 6-well plate for 24 hrs at 37°C and exposed to different drugs as described above. Collecting the adherent cells and washing twice with PBS, eventually, we resuspended the cells in binding buffer co-stained with 5 µL Annexin V-PE and 10 µl 7-AAD in the dark for 15 mins ahead of flow cytometric analysis.
Measurement Of Intracellular Glutathione (GSH)
Intracellular GSH levels were examined by using a GSH Assay Kit (Beyotime). HGC27/DDP cells were treated with α-hederin for 24 hrs. Then, the subsequent procedures were performed according to the manufacturer’s instruction. The experimental data were obtained by a microplate reader.
Measurement Of ROS
Intracellular ROS levels were detected by a 2ʹ,7ʹ-dichlorofluore scin diacetate (DCFH-DA) using from a ROS Assay Kit (Beyotime). Cells were seeded into a 6-well plate (1×10⁵cells/well) and then exposed to α-hederin of different concentrations for 24 hrs and with or without pretreatment with NAC (12 mM) or BSO (8 mM) for 2 hrs. HGC27/DDP cells were cultured in 1 mL medium with 10 μM DCFH-DA each well for 30 mins at 37°C and washed with PBS for three times. After that, intracellular ROS levels of cells were captured by an upright fluorescence microscope (BX51, Olympus).
Measurement Of The Mitochondrial Membrane Potential (∆ψm) With JC-1
The changes in mitochondrial membrane potential (∆Ψm) were observed by using JC-1 Kit (C2006, Beyotime). HGC27/DDP cells were seeded into a 6-well plate and incubated with different concentrations of α-hederin described above. After 24 hrs, the supernatant was replaced and cells were incubated with 1 mL JC-1 dye each well at 37°C for 1 h. It was then washed with buffer solution (4°C) twice and then evaluated by a laser confocal fluorescence microscope (Olympus).
Western Blot Analysis
After treating with α-hederin as described above for 24 hrs, total cell proteins were extracted in RIPA buffer supplemented with phenylmethylsulfonyl fluoride (PMSF) and protease inhibitors (Beyotime). BCA Protein Assay Kit (Beyotime) was applied to measure protein concentrations according to the instructional manual. Proteins were separated by 12% SDS-PAGE using electrophoresis and transferred to polyvinylidene difluoride (PVDF) membranes (Millipore) using a wet transfer system. Then, the membranes were blocked with 5% nonfat milk in TBST for 1 hr at room temperature and washed with TBST for three times. Subsequently, the membranes were incubated with various primary antibodies overnight at 4°C. After washing three times by TBST, the PVDF membranes were incubated with secondary antibodies for 1 hr at room temperature in the dark before they were washed with TBST for another three times. Finally, the membranes were visualized with an Odyssey Infrared Imaging System (LI-COR Bioscience).
Xenograft Tumor Model And TUNEL Assay
Cisplatin–resistant gastric cancer cells were subcutaneously inoculated into the dorsal area of the male BALB/c nude mice (5–6 weeks old, Beijing Vital River Laboratory Animal Technology, China) which were allowed to get acclimatized for 1 week. When the tumors reached approximately 150 mm3 in size, the nude mice were divided into four groups (six in each group): α-hederin (2 mg/kg, 4 mg/kg, 6 mg/kg) and saline control group. Treatment was administered via intraperitoneal injection and mouse weight as well as tumor volume was measured every 2 days. Tumor volume in mm3 was determined by measuring the longest diameter (a) and shortest diameter (b) and calculated by using the following formula: volume (mm3) =0.5×a×b2. At the end of the 3-week treatment, tumors were harvested, weighted, and analyzed by TUNEL assay to detect apoptotic cells in tumor tissue sections. Blood was collected to detect the activation of alanine aminotransferase, aspartate aminotransferase (AST), blood urea nitrogen (BUN) and serum creatinine (Cr) for measuring liver and renal function.
All procedures, which complied with the NIH guidelines for the care and use of laboratory animals, were approved by the Animal Care and Use Committees of Renmin Hospital of Wuhan University.
Statistical Analysis
Data are analyzed by the SPSS 17.0 for Microsoft Windows and expressed as the mean ± SD. The difference among groups was determined by ANOVA. A value of P<0.05 was considered to indicate statistical significance.
Results
α-Hederin Inhibits HGC27/DDP Cell Proliferation
HGC27 cells and HGC27/DDP cells were incubated with cisplatin at different concentrations for 24 hrs, respectively, and the results of CCK-8 assay showed that HGC27 was the most sensitive to cisplatin (Figure 1A), and IC50 of cisplatin on HGC27 cells and HGC27/DDP cells was exhibited (Figure 1B). Subsequently, we exposed HGC27/DDP cells to different concentrations of α-hederin as mentioned above for 24 hrs and 48 hrs, and the results showed that α-hederin could reduce the cell growth in a dose- and time-dependent manner (Figure 1C and D).
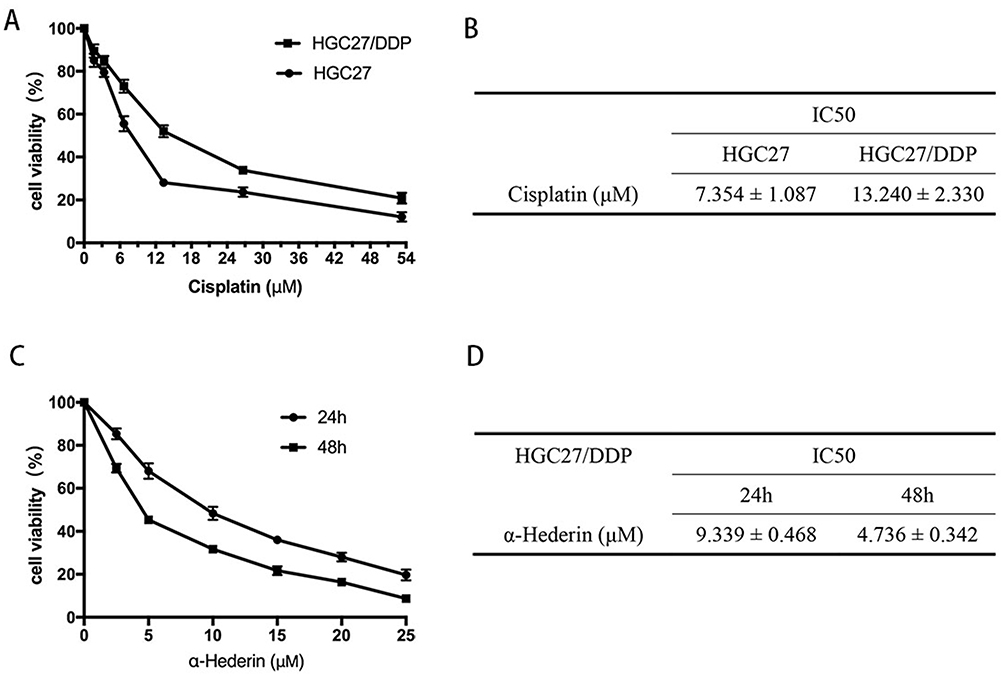 |
Figure 1 α-Hederin inhibits HGC27/DDP cell viability. (A and B) Cell Counting Kit-8 assays showed that HGC27 was the most sensitive to cisplatin; (C and D) α-Hederin inhibits the viability of HGC27/DDP in a dose- and time-dependent manner. All the above data are mean ± SD from the average of three experiments. |
α-Hederin Inhibits HGC27/DDP Cell Invasion And Migration
To assay the effects of α-hederin on invasion and migration of HGC27/DDP, the Transwell invasion assay and the wound healing assay were performed. Meanwhile, the expression levels of MMP-2 and MMP-9 proteins were detected by Western blot Analysis. The results showed that α-hederin inhibits HGC27/DDP cell invasion with increasing dose compared to the control group (P<0.05) (Figure 2A). Then, the average migration speed for the α-hederin groups was substantially lower than the control group in a dose- and time-dependent manner (P<0.05) (Figure 2B). At the same time, the MMP-2 and MMP-9 proteins that related to tumorous invasiveness were decreased by α-hederin (P<0.05) (Figure 2C).
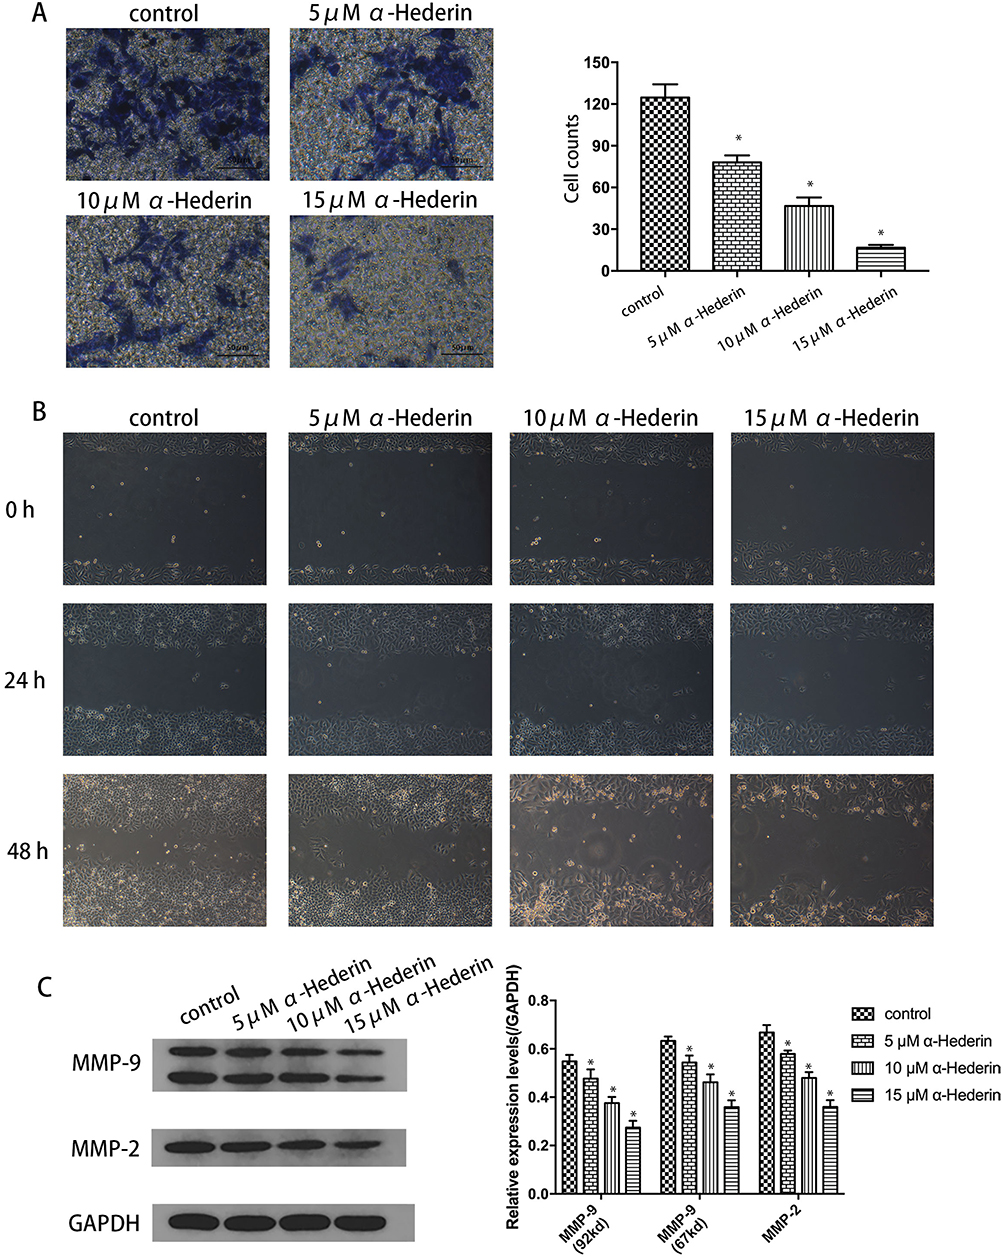 |
Figure 2 α-Hederin inhibits HGC27/DDP cell invasion and migration. (A) Transwell invasion assay showed α-hederin weakened the invasiveness of HGC27/DDP; (B) α-Hederin inhibits the migration of HGC27/DDP in a dose- and time-dependent manner; (C) Western blotting analysis results showed the expression levels of MMP-2 and MMP-9 proteins in HGC27/DDP cells. *P<0.05 versus control. All the above data are mean ± SD from the average of three experiments. |
α-Hederin Induces The Apoptosis Of HGC27/DDP Cells
The Hoechst 33258 staining was designed to detect the morphological alteration in HGC27/DDP cell line, and it exhibited the characteristics of apoptosis. In the control groups, the nuclei were stained as a weak homogeneous blue, while in the groups treated with α-hederin, bright chromatin condensation and nuclear fragmentation could be observed (Figure 3A). Furthermore, the rates of apoptotic cells in the groups were 0.6 ± 0.85, 18.9 ± 1.6, 38.1 ± 4.9 and 60.9 ± 7.5%, respectively (P<0.05). After pretreatment with BSO (8 mM) and NAC (12mM), the percentages of apoptotic cells were 5.9 ± 0.68% in control group, 27.6 ± 2.1% in α-hederin (10 μM) group, 13.1 ± 1.3% in α-hederin (10 μM) and NAC (12 mM) group and 72.8 ± 4.12% in α-hederin (10 μM) and BSO (8mM) (P<0.05) (Figure 3B).
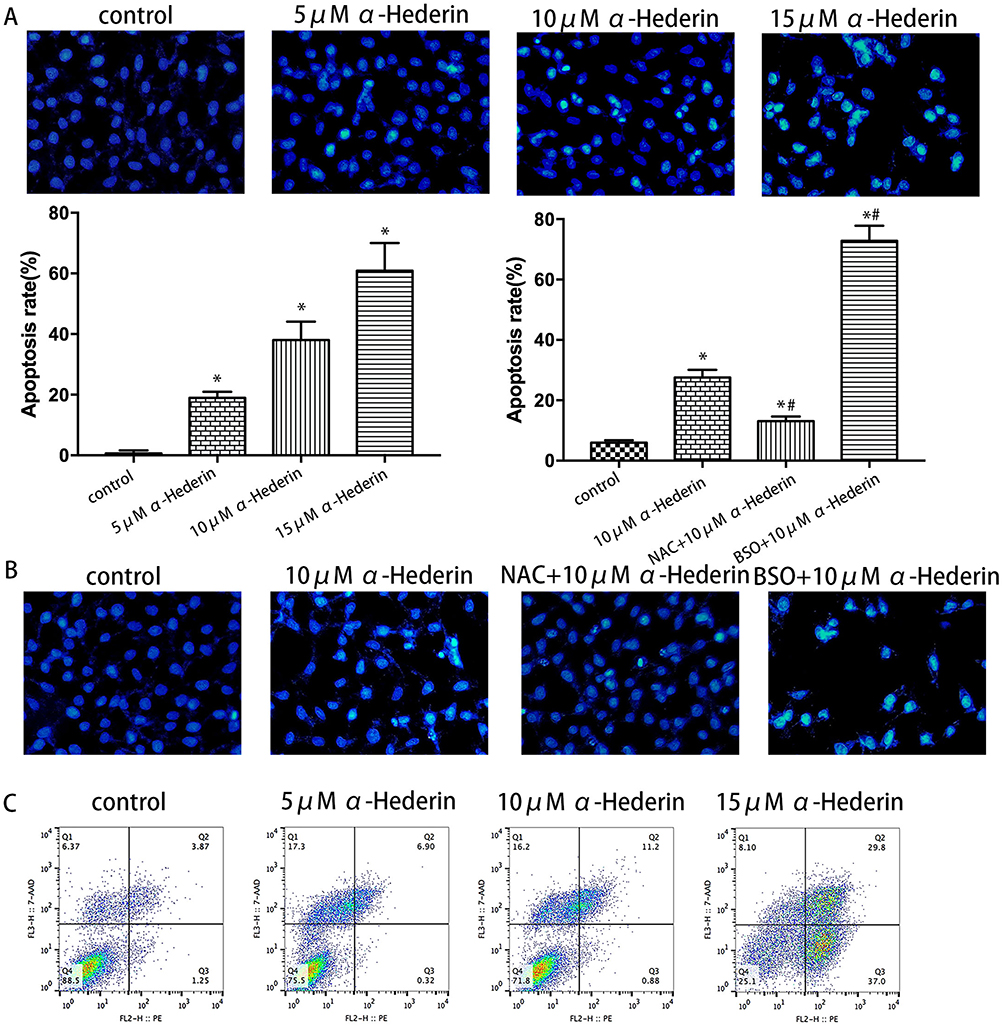 |
Figure 3 α-Hederin induces the apoptosis of HGC27/DDP cells. (A) HGC27/DDP cells were incubated with α-hederin (0, 5 μM, 10 μM, 15 μM) and stained with Hoechst 33258; (B) HGC27/DDP cells were incubated with α-hederin, NAC (12 mM) pretreated + α-hederin, BSO (8mM) pretreated + α-hederin; and apoptotic cells were identified by fragmented and condensed nuclei under a fluorescence microscope; (C) Quantitative flow cytometric measurements of apoptotic in HGC27/DDP cells treated with α-hederin (0, 5 μM, 10 μM, 15 μM). *P<0.05 versus control, #P<0.05 versus α-hederin (10 μM). All the above data are mean ± SD from the average of three experiments. |
Apoptosis induced by α-hederin of different concentrations was further confirmed by Annexin V-PE/7-AAD staining, and the proportion of apoptotic cells was remarkably increased in a dose-dependent manner compared to the control group (P<0.05, respectively) (Figure 3C).
α-Hederin changes the mitochondrial membrane potential via promoting the depletion of intracellular GSH and the accumulation of intracellular ROS.
To further determine whether α-hederin induces the apoptosis of HGC27/DDP cells via GSH depletion and ROS accumulation, cells were treated with α-hederin of different concentrations or treated with α-hederin (10 μM) with BSO (8 mM) or NAC (12 mM) pretreatment for 2 hrs; then DCFH-DA was used to detect the levels of intracellular ROS. The results showed that α-hederin significantly reduced GSH (P<0.05) (Figure 4C). Meantime, it was shown that the fluorescence intensity significantly increased when the dose of α-hederin increased (P<0.05) (Figure 4A); meanwhile, this increase enhanced in the α-hederin and BSO group but reduced in the α-hederin and NAC group (P<0.05) (Figure 4B).
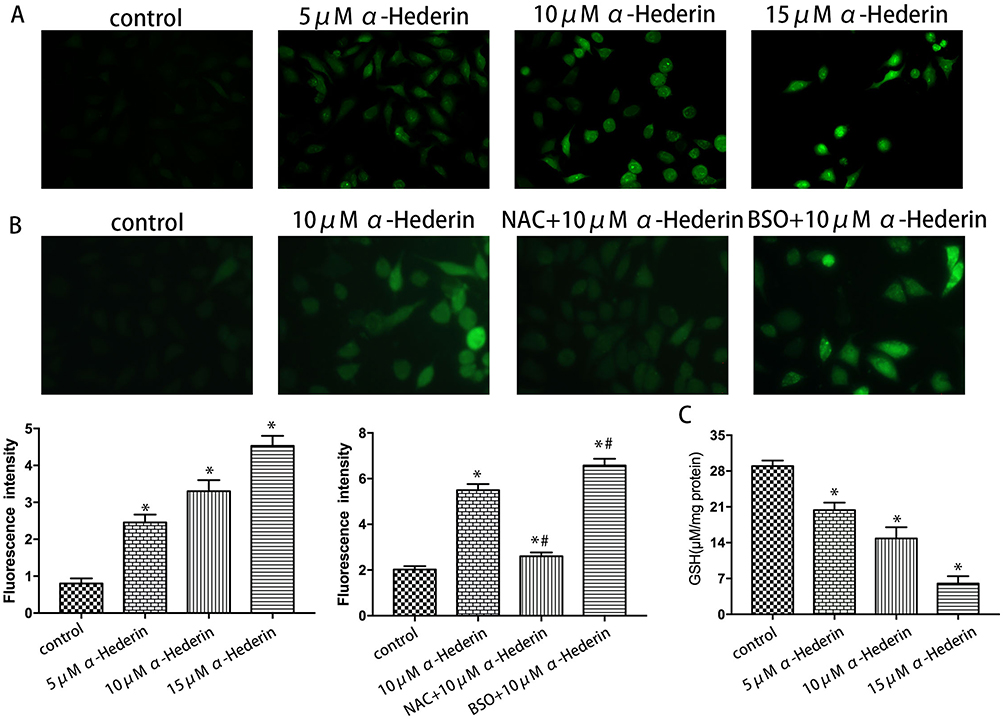 |
Figure 4 α-Hederin induces the depletion of GSH and the accumulation of intracellular ROS. (A) HGC27/DDP cells were treated with α-hederin (0, 5 μM, 10 μM, 15 μM) followed by incubation with 10 μM DCFH-DA for 20 mins and then analyzed for the generation of intracellular ROS by microplate reader; (B) HGC27/DDP cells were treated with α-hederin, NAC (12mM) pretreated + α-hederin, BSO (8mM) pretreated + α-hederin followed by incubation with 10 μM DCFH-DA for 20 mins and then analyzed for the generation of intracellular ROS by microplate reader. (C) The intracellular GSH levels of HGC27/DDP cells treated with α-hederin. *P<0.05 versus control, #P<0.05 versus α-hederin (10 μM). All the above data are mean ± SD from the average of three experiments. |
Subsequently, for researching the underlying mechanism of apoptosis induced by α-hederin, JC-1 cationic dye was used to examine the changes in mitochondrial membrane potential (∆Ψm). The results showed that with the increase in the dose of α-hederin, the ratio of aggregate-to-monomer fluorescence was decreased (P<0.05), as ∆Ψm was decreased accordingly (Figure 5A). Meanwhile, compared to that in the α-hederin group, the pretreatment with BSO lowered the ∆Ψm value further and pretreatment with NAC raised the ∆Ψm value (Figure 5B).
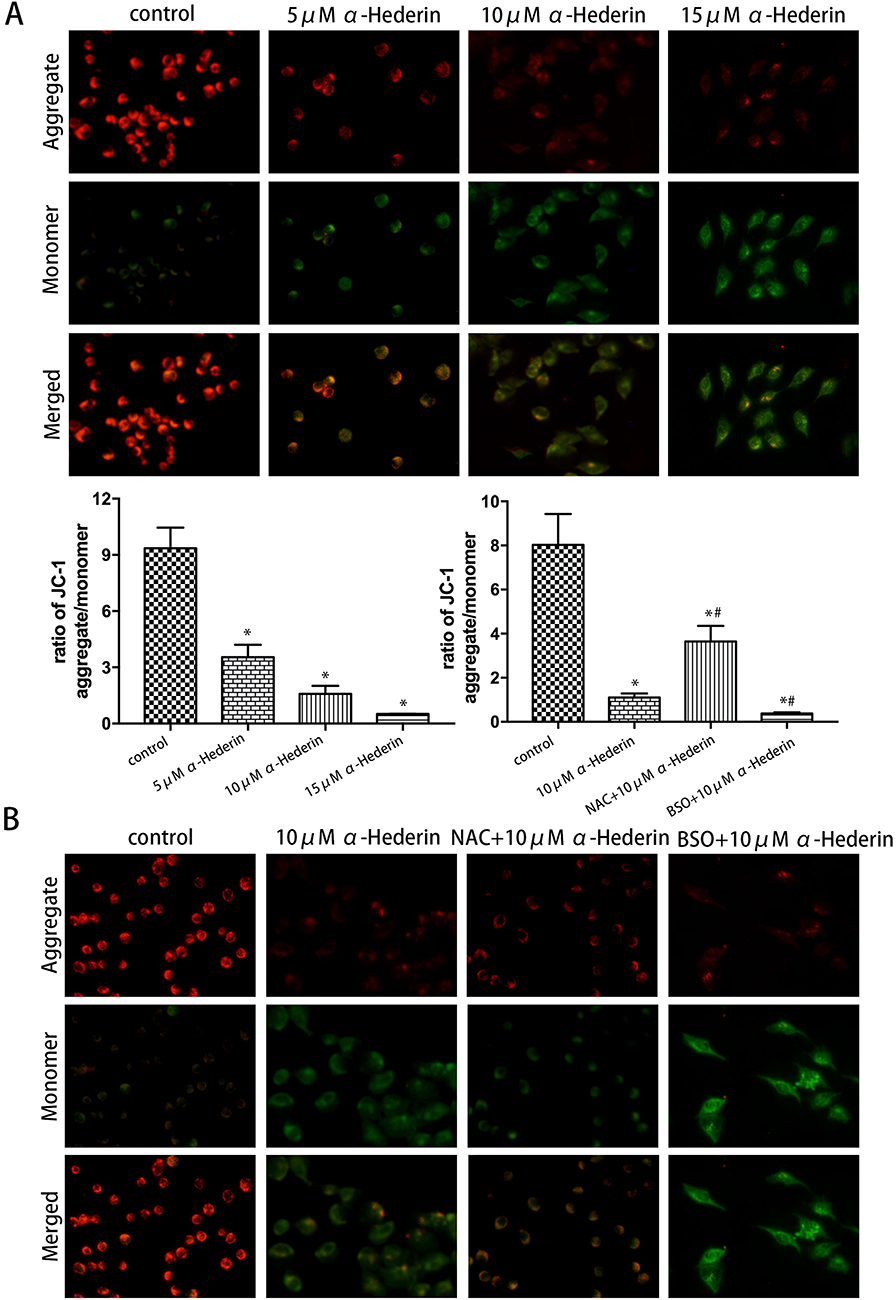 |
Figure 5 Mitochondrial membrane potential (∆Ψm) was detected by JC-1 kit. (A) HGC27/DDP cells were treated with α-hederin (0, 5 μM, 10 μM, 15 μM); (B) HGC27/DDP cells were treated with α-hederin, NAC (12 mM) pretreated + α-hederin, BSO (8 mM) pretreated + α-hederin,using a laser confocal fluorescence microscopy to detect ∆Ψm after staining cells by JC-1. *P<0.05 versus control, #P<0.05 versus α-hederin (10 μM). All the above data are mean ± SD from the average of three experiments. |
α-Hederin induces apoptosis through activation of the mitochondria-mediated pathway via ROS triggering.
To further investigate the detailed mechanism of apoptosis induced by α-hederin exposures, we examined the effect of α-hederin on the mitochondrial pathway using Western blot. The results presented that α-hederin increases the levels of Bax and decreased Bcl-2 expression levels (P<0.05). Meanwhile, α-hederin led to an increase in the levels of Apaf-1, AIF, Cyt C, cleaved caspase-3 and cleaved caspase-9 (P<0.05), which are known as playing the important role in activating mitochondria-mediated apoptosis (Figure 6A).
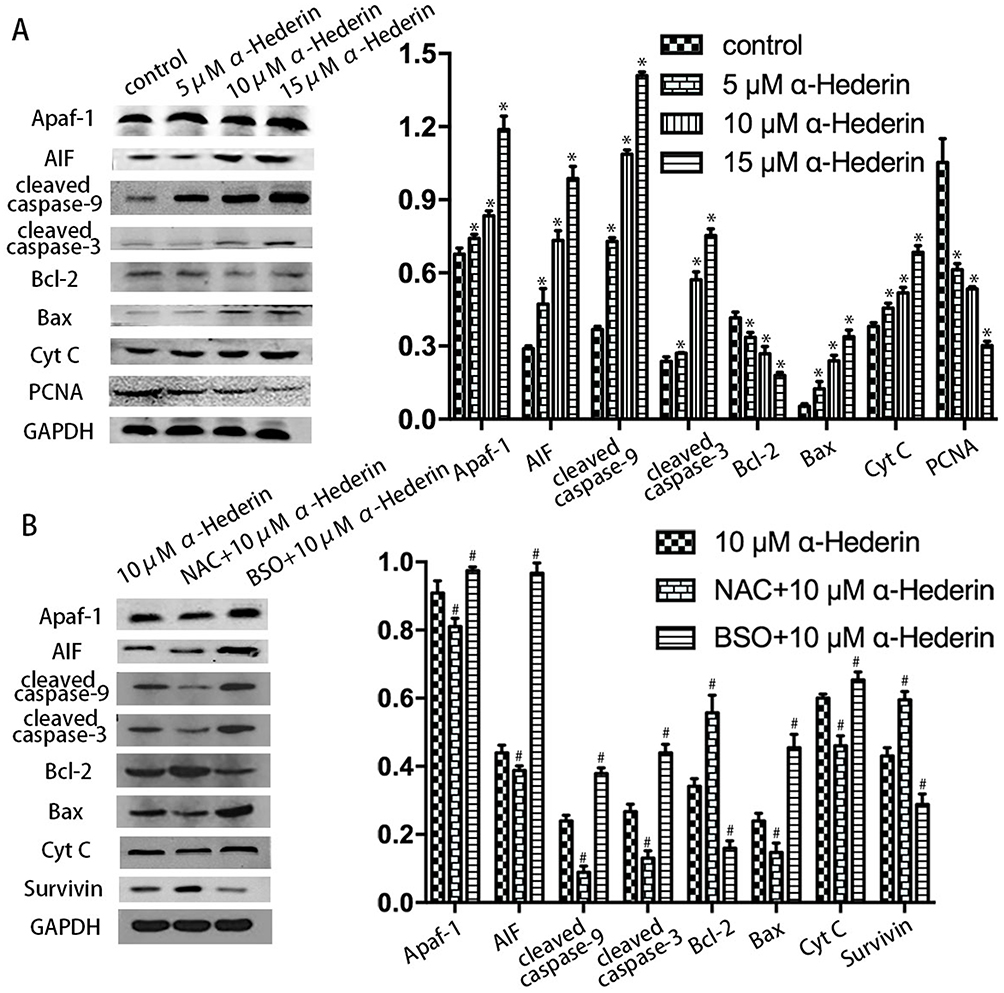 |
Figure 6 α-Hederin induces apoptosis through the mitochondrial pathway. Western blot analysis results showed the expression levels of Bcl-2, Bax, cleaved caspase-3, cleaved caspase-9, AIF, Apaf-1, survivin and Cyt C proteins in HGC27/DDP cells. GAPDH expression was used as an internal control. *P<0.05 versus control, #P<0.05 versus α-hederin (10 μM). All the above data are mean ± SD from the average of three experiments. |
In addition, the pretreatment with BSO could augment the α-hederin-induced decrease in protein impression levels and the pretreatment with NAC could attenuate these protein levels as mentioned above (Figure 6B).
α-Hederin Suppress Tumor Development In Nude Mice
On the basis of the data above in vitro, we further examined the anticancer effects of α-Hederin on xenograft tumor growth in nude mice. None of the mice died during the course of the experiment. We can clearly observe that the size of the tumor decreased (Figure 7A). The data showed that the transplanted tumors increased rapidly in the control group (1846 ± 82.6 mm3); however, tumor growth was suppressed in the treatment group with increasing α-hederin concentration (969 ± 189.1 mm3 in low-dose group, 433 ± 54.2 mm3 in mid-dose group, 286 ± 48.4 mm3 in high-dose group) (P<0.05) (Figure 7B). At the end of the experiment, the tumors were harvested. The weight of the tumors in the control and low-, mid-, and high-dose group was 1010 mg ± 191 mg, 472 mg ± 54 mg, 247 mg ± 12 mg and 120 mg ± 47 mg, respectively (Figure 7C).
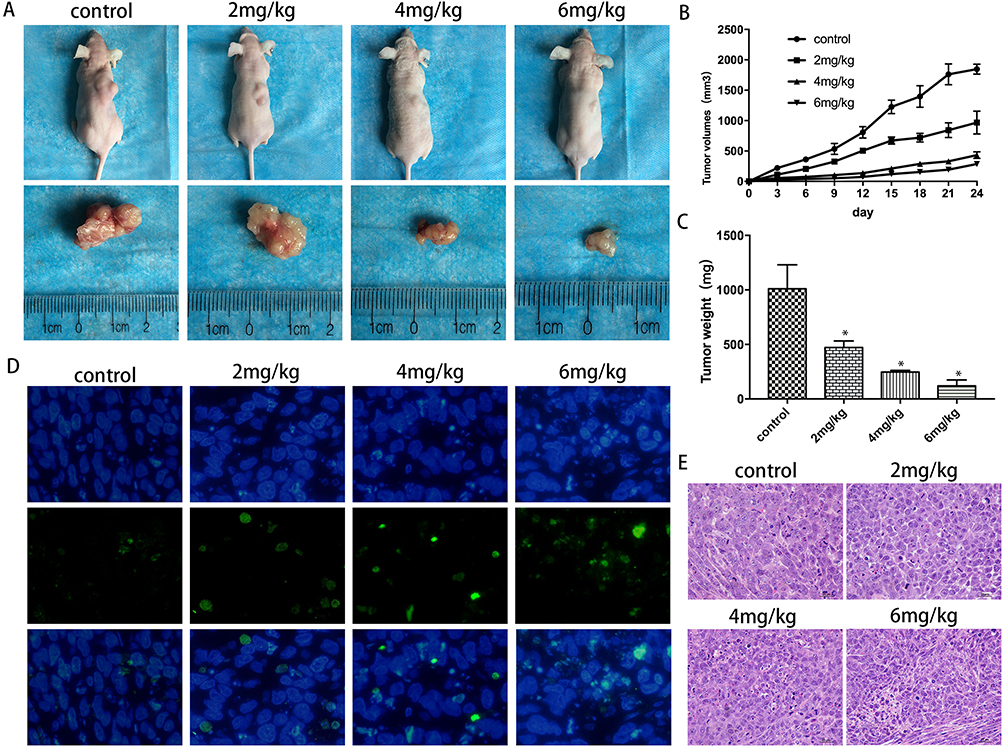 |
Figure 7 Antitumor effect of α-hederin in cisplatin-resistant gastric tumor xenograft mouse model. (A) Morphology of the subcutaneous implanted tumor; (B) Mean tumor volume at each time point; (C) Tumor weight was obtained at the end of the experiment; (D and E) HE staining and TUNEL assay of detecting the apoptotic cells in tumor tissue. *P<0.05 versus control. All the above data are mean ± SD from the average of three experiments. |
HE staining and TUNEL assay of the tumors demonstrated that α-hederin resulted in apparent cell apoptosis in the tumor mass (Figure 7D and E), whereas little apoptosis was observed in the control group (P<0.05). Liver, lung and brain tissues from each group were stained with HE, and no tumor metastases were observed (not shown). What’s more, we assayed the liver and renal injury by the ALT, AST, BUN, Cr levels in the serum, and there was no significant difference among groups (Table 1, P>0.05).
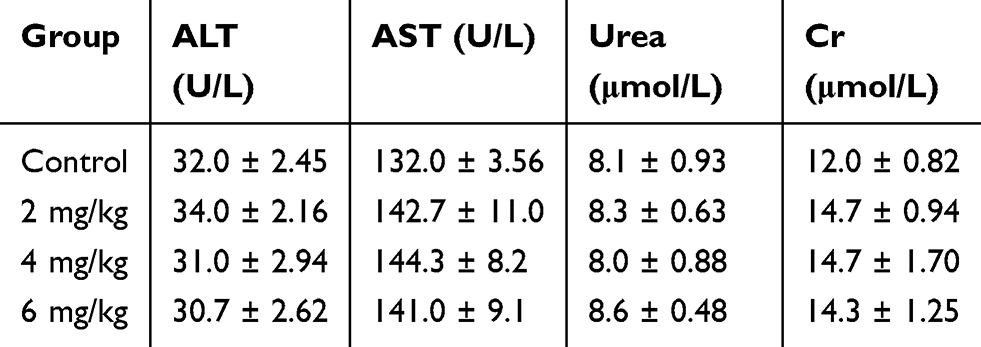 |
Table 1 Effect Of α-Hederin On Hepatic And Renal Function |
Discussion
ROS which are produced by various biochemical and physiological oxidative processes in the body play an important role in the pathogenesis of various human diseases. At low levels, ROS shows beneficial effects, while in excess accumulation, ROS can cause damage to proteins, lipids and DNA.14,15 The imbalances between ROS and antioxidant defense systems may lead to oxidative stress, which initiates carcinogenesis.16 There are numerous findings have indicated that ROS plays a vital role in the growth of cancer cells, such as pancreatic cancer,17 breast cancer,18 non-small cell lung cancer (NSCLC)19 and prostate cancer.20 These research indicated that the increased level of mitochondrial ROS was shown to promote cell proliferation, cell survival, cell migration through mitogen-activated protein kinase (MAPK), NF-kB signaling pathway, Keap1-Nrf2-ARE signaling pathway and mitochondrial apoptosis pathway directly or indirectly.21,22 GSH is a key molecule in the redox process and GSH depletion plays an important role in the process of tumor cell proliferation and apoptosis.23 The accumulation of ROS induced by GSH depletion can cause oxidative damage of mitochondrial membrane, lead to the opening of permeable transporter (PTP), release AIF, Cyt C, procaspase-2 and procaspase-9 and activate caspase-3 that finally induce apoptosis.24,25 N-acetylcysteine (NAC) and DL-buthionine-S, R-sulfoximine (BSO). NAC works not only by serving as a direct precursor of GSH synthesis, thus helping to restore glutathione (GSH) but also serving as a reducing agent for oxidizing proteins by scavenging ROS.26 BSO is a selective inhibitor of γ-glutamylcysteine synthetase, produces GSH depletion and enhances reactive oxygen metabolite.27
Because of conventional chemotherapeutic drugs, 5-fluorouracil and cisplatin have the defects of drug resistance and cell toxicity, α-Hederin has been proposed as a potential therapeutic method for anticancer treatments. Although increasing evidence suggests that α-hederin induces apoptosis in various cancer cell types,28 the underlining signal pathways remain unclarified in the gastric cancer cells. Therefore, almost all the anticancer drugs need to try to activate the inactivated apoptotic mechanism, including α-hederin-induced chemotherapy, and then to ultimately induce apoptosis to successfully achieve the goal of eradication of cancer cells by nonsurgical means.29 At present, apoptotic pathways have been sufficiently studied in various tissues, and the intrinsic apoptotic pathways involve the response to severe cellular damage or stress via the members of Bcl-2 protein family and the mitochondria.30,31 In some researches, α-hederin has been proven to induce the apoptosis of multiple cancer cells via the mitochondria pathway.10,11,24 Hence, in the present study, we provided evidence that α-hederin inhibited the growth of HGC27/DDP cells activating by increasing intracellular ROS and mitochondria-mediated apoptotic signaling pathways.
In our study, we examined the cytotoxic activity and possible molecular mechanism of α-hederin against HGC27/DDP cells by CCK-8, Hoechst assay, flow cytometry, ROS assay, JC-1, Western blot and xenograft assays. CCK-8 assay is a rapid and sensitive method for detecting cell proliferation and cytotoxicity of α-hederin against HGC27/DDP cells.32 In the meantime, Hoechst assay and flow cytometry are commonly used to explore whether the cytotoxicity of α-hederin against HGC27/DDP cells is related to apoptosis.33 Hence, we found that α-hederin inhibited the growth of HGC27/DDP cells in a dose- and time-dependent fashion and we also found that α-hederin induced significantly greater apoptosis with increasing concentrations compared to the control. NAC and BSO pretreatment altered the percentages of apoptotic cells in the HGC27/DDP cells which indicated that the increasing level of intracellular ROS may be concerned with the apoptosis of HGC27/DDP cells induced by α-hederin. In order to determine our speculation whether α-hederin could induce the accumulation of intracellular ROS, we examined the different treatment of α-hederin in HGC27/DDP cells at intracellular ROS level. We found that the levels of intracellular ROS in treatment groups are higher than that in the control group which confirmed our conjecture.
Subsequently, we used fluorescent dye (JC-1) to measure the changes in ∆Ψm and the results which could evaluate whether ROS induced the mitochondria-mediated apoptotic mechanism in HGC27/DDP cells treated with α-hederin. To further explore whether the increasing ROS and the decreasing ∆Ψm induced by α-hederin led to the apoptosis of HGC27/DDP cells, we used Western blot to detect the protein levels of Bax, Bcl-2, cleaved caspase-9, cleaved caspase-3, Apaf-1, AIF and Cyt C. It has been demonstrated that Bcl-2 family proteins play an important role in regulating the permeability of the outer mitochondrial membrane,34 the reduction of Bcl-2/Bax protein ratio will lead to permeation of the outer membrane and the loss of Cyt C, altering the ∆Ψm.34,35 Apoptosis-inducing factor (AIF) is released from mitochondria to the cytoplasm and transferred to the nucleus, mediating chromatin condensation in the nucleus, leading to cell death.36,37 According to our studies, it was found that α-hederin caused an increase of the Bax, Apaf-1, AIF and Cyt C protein levels and a decrease of Bcl-2. Additionally, the pretreatment of BSO or NAC could augment or attenuate mitochondrial pathway protein levels above similarly in cleaved caspase-3 and cleaved caspase-9. Therefore, it is suggested that α-hederin could upregulate the level of intracellular ROS, and continually increasing ROS causes serious damage to mitochondrial structure and function and promotes cell aging and even death by decreasing the expression of Bcl-2 and increasing the expression of Bax.38 Then, Cyt C in cytochrome and Apaf-1 form apoptosomes, which result in the cleavage of procaspase-9. Cleaved caspase-9 can activate the cleavage of procaspase-3 (cleaved caspase-3), which induces apoptosis of HGC27/DDP cells.39–41
Finally, α-hederin enhanced the antiproliferation effect on HGC27/DDP xenografts. The TUNEL assay showed more apoptotic cells than the control group with the increasing dose of α-hederin. Meanwhile, hepatic dysfunction and renal dysfunction were observed that there is no obvious adverse effect.
In conclusion, our results provide strong molecular evidence to support our hypothesis that α-hederin inhibits the proliferation and induces the apoptosis of cisplatin-resistant gastric cancer cells by consuming GSH, increasing levels of intracellular ROS and damaging the mitochondrial membrane which release Cyt C and other apoptosis promoter factors and stimulate the cascade reaction of caspase. In this study, α-hederin was found to be a nontoxic and safe antitumor drug, which has potential application value in the treatment of cisplatin-resistant gastric cancer.
Ethics Statement
All procedures performed in studies involving animal work were approved by the Ethics Committee of Renmin Hospital of Wuhan University, which were in accordance with the ethical standards of the institutional and/or national research committee and with the 1964 Helsinki declaration and its later amendments or comparable ethical standards.
Disclosure
The authors report no conflicts of interest in this work.
References
1. Bray F, Ferlay J, Soerjomataram I, Siegel RL, Torre LA, Jemal A. Global cancer statistics 2018: GLOBOCAN estimates of incidence and mortality worldwide for 36 cancers in 185 countries. CA Cancer J Clin. 2018;68(6):394–424. doi:10.3322/caac.21492
2. Fitzmaurice C, Allen C, Barber RM, et al. Global, regional, and national cancer incidence, mortality, years of life lost, years lived with disability, and disability-adjusted life-years for 32 cancer groups, 1990 to 2015 a systematic analysis for the global burden of disease study. JAMA Oncol. 2017;3(4):524–548. doi:10.1001/jamaoncol.2016.5688
3. Orditura M, Galizia G, Sforza V, et al. Treatment of gastric cancer. World J Gastroenterol. 2014;355(7):729–735.
4. Mo DL, Fang HB, Niu KF, et al. Human helicase RECQL4 drives cisplatin resistance in gastric cancer by activating an AKT-YB1-MDR1 signaling pathway. Cancer Res. 2016;76(10):3057–3066. doi:10.1158/0008-5472.Can-15-2361
5. Seo JH, Jeong ES, Lee KS, Heo SH, Jeong DG, Choi YK. Lentivirus-mediated shRNA targeting of cyclin D1 enhances the chemosensitivity of human gastric cancer to 5-fluorouracil. Int J Oncol. 2013;43(6):2007–2014. doi:10.3892/ijo.2013.2119
6. Galluzzi L, Senovilla L, Vitale I, et al. Molecular mechanisms of cisplatin resistance. Oncogene. 2012;31(15):1869–1883. doi:10.1038/onc.2011.384
7. Alemi M, Sabouni F, Sanjarian F, Haghbeen K, Ansari S. Anti-inflammatory effect of seeds and callus of Nigella sativa L. Extracts on Mix Glial Cells with regard to their thymoquinone content. AAPS PharmSciTech. 2013;14(1):160–167. doi:10.1208/s12249-012-9899-8
8. Randhawa MA, Alghamdi MS. Anticancer activity of Nigella sativa (black seed) - a review. Am J Chin Med. 2011;39(6):1075–1091. doi:10.1142/s0192415x1100941x
9. Butt MS, Sultan MT. Nigella sativa: reduces the risk of various maladies. Crit Rev Food Sci Nutr. 2010;50(7):654–665. doi:10.1080/10408390902768797
10. Li J, Wu DD, Zhang JX, et al. Mitochondrial pathway mediated by reactive oxygen species involvement in α-hederin-induced apoptosis in hepatocellular carcinoma cells. World J Gastroenterol. 2018;24(17):1901–1910. doi:10.3748/wjg.v24.i17.1901
11. Zhan YJ, Wang K, Li Q, et al. The novel autophagy inhibitor alpha-hederin promoted paclitaxel cytotoxicity by increasing reactive oxygen species accumulation in non-small cell lung cancer cells. Int J Mol Sci. 2018;19:10. doi:10.3390/ijms19103221
12. Danloy S, Quetin-Leclercq J, Coucke P, et al. Effects of alpha-hederin, a saponin extracted from hedera helix, on cells cultured in vitro. Planta Med. 1994;60(01):45–49. doi:10.1055/s-2006-959406
13. Sun D, Shen W, Zhang F, et al. α-Hederin inhibits interleukin 6-induced epithelial-to-mesenchymal transition associated with disruption of JAK2/STAT3 signaling in colon cancer cells. Biomed Pharmacother. 2018;101:107. doi:10.1016/j.biopha.2018.02.062
14. Acharya A, Das I, Chandhok D, Saha T. Redox regulation in cancer A double-edged sword with therapeutic potential. Oxid Med Cell Longev. 2010;3(1):23–34. doi:10.4161/oxim.3.1.10095
15. Reczek CR, Chandel NS. ROS-dependent signal transduction. Curr Opin Cell Biol. 2015;33:8–13. doi:10.1016/j.ceb.2014.09.010
16. Prasad S, Gupta SC, Tyagi AK. Reactive oxygen species (ROS) and cancer: role of antioxidative nutraceuticals. Cancer Lett. 2017;387:95–105. doi:10.1016/j.canlet.2016.03.042
17. Lee JK, Edderkaoui M, Truong P, et al. NADPH oxidase promotes pancreatic cancer cell survival via inhibiting JAK2 dephosphorylation by tyrosine phosphatases. Gastroenterology. 2007;133(5):1637–1648. doi:10.1053/j.gastro.2007.08.022
18. Choi JA, Lee JW, Kim H, et al. Pro-survival of estrogen receptor-negative breast cancer cells is regulated by a BLT2-reactive oxygen species-linked signaling pathway. Carcinogenesis. 2010;31(4):543–551. doi:10.1093/carcin/bgp203
19. Tang ZH, Cao WX, Su MX, Chen XP, Lu JJ. Osimertinib induces autophagy and apoptosis via reactive oxygen species generation in non-small cell lung cancer cells. Toxicol Appl Pharmacol. 2017;321:18–26. doi:10.1016/j.taap.2017.02.017
20. Cho HD, Lee JH, Moon KD, Park KH, Lee MK, Seo KI. Auriculasin-induced ROS causes prostate cancer cell death via induction of apoptosis. Food Chem Toxicol. 2018;111:660–669. doi:10.1016/j.fct.2017.12.007
21. Cheng CW, Kuo CY, Fan CC, et al. Overexpression of Lon contributes to survival and aggressive phenotype of cancer cells through mitochondrial complex I-mediated generation of reactive oxygen species. Cell Death Dis. 2013:4. doi:10.1038/cddis.2013.204
22. Moloney JN, Cotter TG. ROS signalling in the biology of cancer. Semin Cell Dev Biol. 2018;80:50–64. doi:10.1016/j.semcdb.2017.05.023
23. Aquilano K, Baldelli S, Ciriolo MR. Glutathione: new roles in redox signaling for an old antioxidant. Front Pharmacol. 2014;5:196. doi:10.3389/fphar.2014.00196
24. Huat BTK, Swamy SMK, Biochemistry C. Intracellular glutathione depletion and reactive oxygen species generation are important in α-hederin-induced apoptosis of P388 cells. Mol Cell Biochem. 2003;245(1–2):127–139. doi:10.1023/a:1022807207948
25. Wen J, You KR, Lee SY, Song CH, Kim DGJ. Oxidative stress-mediated apoptosis. The anticancer effect of the sesquiterpene lactone parthenolide. J Biol Chem. 2002;277(41):38954. doi:10.1074/jbc.M203842200
26. Samuni Y, Goldstein S, Dean OM, Berk M. The chemistry and biological activities of N-acetylcysteine. Biochim Biophys Acta Gen Subj. 2013;1830(8):4117–4129. doi:10.1016/j.bbagen.2013.04.016
27. Marchionatti A, Alisio A, Barboza GDAD, Baudino V, Talamoni NT, dl -Buthionine S. R -sulfoximine affects intestinal alkaline phosphatase activity. Comp Biochem Physiol C Toxicol Pharmacol. 2001;129(2):85–91.
28. Cheng L, Xia TS, Wang YF, et al. The anticancer effect and mechanism of α-hederin on breast cancer cells. Int J Oncol. 2014;45(2):757. doi:10.3892/ijo.2014.2449
29. Hassan M, Watari H, AbuAlmaaty A, Ohba Y, Sakuragi N. Apoptosis and molecular targeting therapy in cancer. Biomed Res Int. 2014;2014. doi:10.1155/2014/150845
30. Ashkenazi A. Targeting the extrinsic apoptotic pathway in cancer: lessons learned and future directions. J Clin Invest. 2015;125(2):487–489. doi:10.1172/jci80420
31. Abraha AM, Ketema EB. Apoptotic pathways as a therapeutic target for colorectal cancer treatment. World J Gastrointest Oncol. 2016;8(8):583–591. doi:10.4251/wjgo.v8.i8.583
32. Xiong SD, Zheng YJ, Jiang P, Liu RH, Liu XM, Chu YW. MicroRNA-7 inhibits the growth of human non-small cell lung cancer A549 cells through targeting BCL-2. Int J Biol Sci. 2011;7(6):805–814. doi:10.7150/ijbs.7.805
33. Bohling SD, Davis E, Thompson K, Kussick SJ, Love J. Flow cytometric analysis of CD200 expression by pulmonary small cell carcinoma. Cytometry B Clin Cytom. 2016;90(6):493–498. doi:10.1002/cyto.b.21340
34. Chen Q, Lesnefsky EJ. Blockade of electron transport during ischemia preserves bcl-2 and inhibits opening of the mitochondrial permeability transition pore. FEBS Lett. 2011;585(6):921–926. doi:10.1016/j.febslet.2011.02.029
35. Llambi F, Green DR. Apoptosis and oncogenesis: give and take in the BCL-2 family. Curr Opin Genet Dev. 2011;21(1):12–20. doi:10.1016/j.gde.2010.12.001
36. Lorenzo HK, Susin SA, Penninger J, Kroemer G; %J Cell Death, Differentiation. Apoptosis inducing factor (AIF): a phylogenetically old, caspase-independent effector of cell death. Cell Death Differ. 1999;6(6):516–524. doi:10.1038/sj.cdd.4400527
37. Dyshlovoy SA, Rast S, Hauschild J, et al. Frondoside A induces AIF-associated caspase-independent apoptosis in burkitt lymphoma cells. Leuk Lymphoma. 2017;58(12):2905–2915. doi:10.1080/10428194.2017.1317091
38. Chen ZY, Liu XD, Ma SM. The roles of mitochondria in autophagic cell death. Cancer Biother Radiopharm. 2016;31(8):269–276. doi:10.1089/cbr.2016.2057
39. Orrenius S. Reactive oxygen species in mitochondria-mediated cell death. Drug Metab Rev. 2007;39(2–3):443–455. doi:10.1080/03602530701468516
40. Wurstle ML, Laussmann MA, Rehm M. The central role of initiator caspase-9 in apoptosis signal transduction and the regulation of its activation and activity on the apoptosome. Exp Cell Res. 2012;318(11):1213–1220. doi:10.1016/j.yexcr.2012.02.013
41. Dou CQ, Han MM, Zhang B, Sun LY, Jin X, Li T. Chrysotoxene induces apoptosis of human hepatoblastoma HepG2 cells in vitro and in vivo via activation of the mitochondria-mediated apoptotic signaling pathway. Oncol Lett. 2018;15(4):4611–4618. doi:10.3892/ol.2018.7857
 © 2019 The Author(s). This work is published and licensed by Dove Medical Press Limited. The full terms of this license are available at https://www.dovepress.com/terms.php and incorporate the Creative Commons Attribution - Non Commercial (unported, v3.0) License.
By accessing the work you hereby accept the Terms. Non-commercial uses of the work are permitted without any further permission from Dove Medical Press Limited, provided the work is properly attributed. For permission for commercial use of this work, please see paragraphs 4.2 and 5 of our Terms.
© 2019 The Author(s). This work is published and licensed by Dove Medical Press Limited. The full terms of this license are available at https://www.dovepress.com/terms.php and incorporate the Creative Commons Attribution - Non Commercial (unported, v3.0) License.
By accessing the work you hereby accept the Terms. Non-commercial uses of the work are permitted without any further permission from Dove Medical Press Limited, provided the work is properly attributed. For permission for commercial use of this work, please see paragraphs 4.2 and 5 of our Terms.