")
Back to Journals » Cancer Management and Research » Volume 12
Allylated Curcumin Analog CA6 Inhibits TrxR1 and Leads to ROS-Dependent Apoptotic Cell Death in Gastric Cancer Through Akt-FoxO3a
Authors Rajamanickam V, Yan T, Wu L, Zhao Y, Xu X, Zhu H, Chen X, Wang M, Liu Z, Liu Z, Liang G, Wang Y
Received 15 August 2019
Accepted for publication 26 November 2019
Published 13 January 2020 Volume 2020:12 Pages 247—263
DOI https://doi.org/10.2147/CMAR.S227415
Checked for plagiarism Yes
Review by Single anonymous peer review
Peer reviewer comments 2
Editor who approved publication: Professor Harikrishna Nakshatri
Vinothkumar Rajamanickam,* Tao Yan,* Liangrong Wu, Yanni Zhao, Xiaohong Xu, Heping Zhu, Xi Chen, Meihong Wang, Zhoudi Liu, Zhiguo Liu, Guang Liang, Yi Wang
Chemical Biology Research Center, School of Pharmaceutical Sciences, Wenzhou Medical University, Wenzhou, Zhejiang 325035, People’s Republic of China
*These authors contributed equally to this work
Correspondence: Yi Wang
Chemical Biology Research Center, School of Pharmaceutical Sciences, Wenzhou Medical University, Wenzhou, Zhejiang 325035, People’s Republic of China
Tel/Fax +86- 577-85773060
Email [email protected]
Background: Gastric cancer is one of the leading causes of cancer-related deaths. Allylated monocarbonyl analogs of curcumin (MACs) have been reported to selectively inhibit a broad range of human cancers including gastric cancer. However, the precise molecular mechanisms underlying the inhibitory activities of MACs are not fully known.
Methods: In this study, we examined the anti-tumor activities of an allylated MAC, CA6, on gastric cancer cells and gastric cancer xenograft mouse model. The potential molecular anti-tumor mechanisms of CA6 were also elucidated.
Results: Our data show that CA6 exhibited significant cytotoxicity in gastric cancer cells, which was seen as an induction of G2/M cell cycle arrest and apoptosis. These activities were mediated through an elaboration of ROS levels in gastric cancer cells and induction of endoplasmic reticulum stress. CA6 increased ROS levels through directly binding to and inhibiting thioredoxin reductase R1 (TrxR1). Also, CA6-generated ROS inhibited Akt and activated forkhead O3A (FoxO3a), causing cytotoxicity in gastric cancer cells. Finally, CA6 treatment dose-dependently reduced the growth of gastric cancer xenografts in tumor-bearing mice, which was associated with reduced TrxR1 activity and increased ROS in the tumor.
Conclusion: In summary, our studies demonstrate that CA6 inhibited gastric cancer growth by inhibiting TrxR1 and increasing ROS, which in turn activated FoxO3a through suppressing Akt. CA6 is a potential candidate for the treatment of gastric cancer.
Keywords: gastric cancer, curcumin analog, reactive oxygen species, TrxR1, FOXO3a
Introduction
Gastric cancer is one of the leading causes of cancer-related death worldwide.1,2 Many patients have inoperable disease at diagnosis.3 Typically, locally advanced disease is treated with adjuvant or neoadjuvant therapy, in possible combination with surgery. However, the metastatic disease outcome is extremely poor.4 In addition, development of drug resistance, disease relapse, and severe side effects of therapies contribute to morbidity and mortality in gastric cancer patients.5 Therefore, these major clinical challenges urgently require new and safe treatment options.
Cancer cells may be distinguished from healthy cells in part by their metabolic phenotype. Metabolic perturbations of cancer cells result in higher level of endogenous reactive oxygen species (ROS). Studies have reported high levels of hydrogen peroxide in a panel of human tumor cell lines.6 Increased levels of ROS may be derived through NADPH oxidases7,8 and loss of tumor suppressor pathways altering antioxidant networks.9 Cancer cells may utilize elevated ROS for progression, increasing the rate of DNA mutations. One possible mechanism by which cancer cells escape the cytotoxic effects of elevated ROS is to maintain cell viability through the upregulation of reductive pathways. The thioredoxin (Trx) system using NADPH channeled through thioredoxin reductase 1 (TrxR1) is one of the major redox systems. Increasing evidence suggests that many redox regulators are involved in resistance to anti-cancer drugs.10 Targeting TrxR1 has been shown to occur with many different electrophiles with anticancer potential.11
Recent studies have shown that compounds that further enhance ROS levels in cancer may bypass the elevated reductive pathways in cancer cells and unmask ROS cytotoxicity.12 One of such ROS altering compounds is curcumin.13 However, curcumin failed to demonstrate an efficacy profile in clinical trials because of its highly reactive β-diketone moiety.14 In our previous studies, we synthesized several allylated monocarbonyl analogs of curcumin (MACs) with enhanced selective toxicity and improved pharmacokinetic properties.15 Among these analogs, CA6 (Figure 1A) showed significant growth inhibition in gastric and colon cancer cells, while exhibiting markedly lower cytotoxicity in normal gastric epithelial cells.16 In the present study, we aimed to identify the mechanisms underlying the inhibitory effects of CA6 in gastric cancer cells. We show that CA6 inhibited the growth of gastric cancer cells through ROS-dependent activation of the endoplasmic reticulum (ER) stress and induction of apoptosis. Importantly, our results show that CA6 increased ROS by directly binding to and inhibiting the activity of TrxR1. Elevated ROS inhibited Akt and activated forkhead O3A (FoxO3a) in gastric cancer cells to induce cytotoxicity.
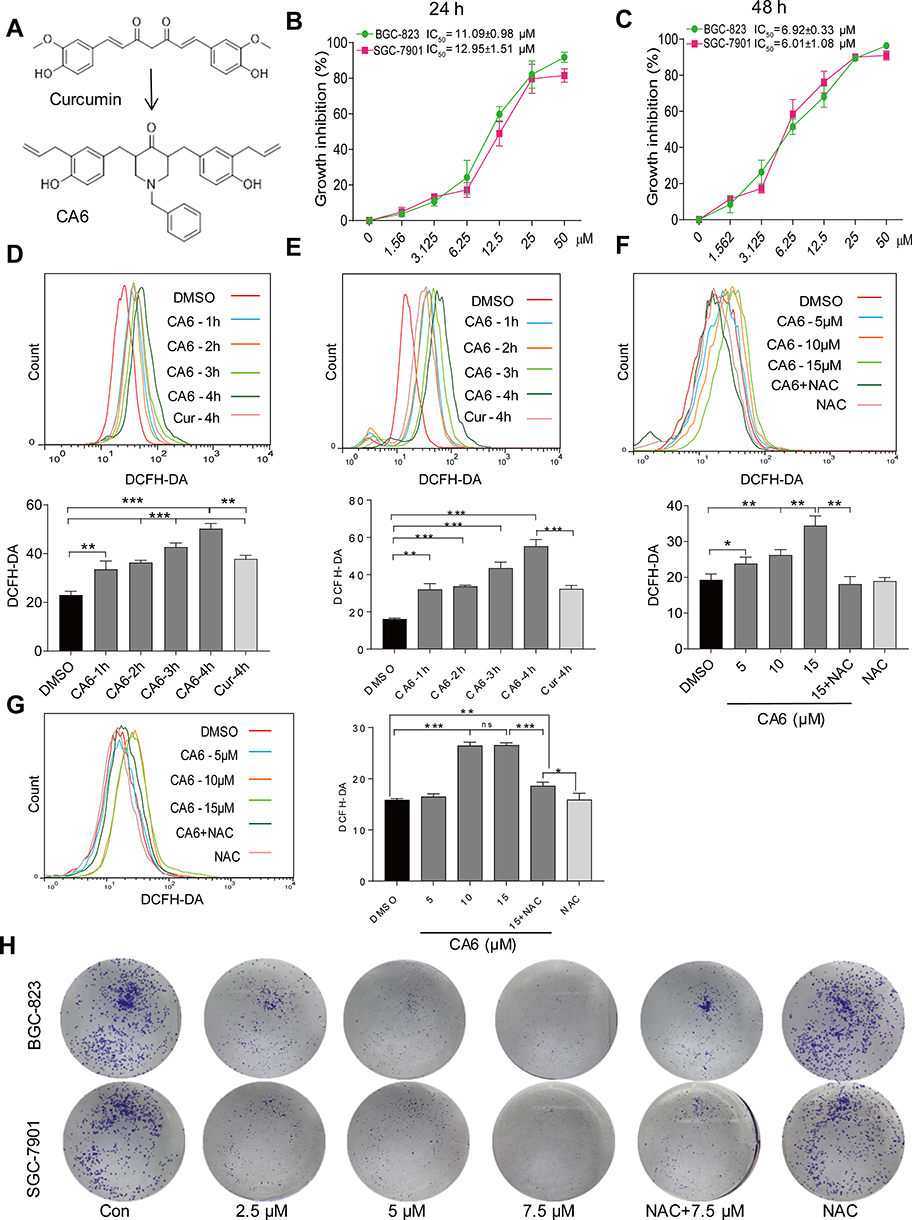 |
Figure 1 CA6 inhibits gastric cancer cell growth and increases ROS levels. (A) The chemical structures of parental compound curcumin and its analog CA6. (B and C) BGC-823 and SGC-7901 cells were challenged with increasing concentrations of CA6 for 24 h (B) or 48 h (C). Cell viability was measured by the MTT assay. IC50 values for CA6 in the two different cell lines are presented [Mean ± SEM; n = 3]. (D and E) Cells were treated with CA6 (15 µM) for different time periods and intracellular ROS levels were measured by flow cytometry. Data showing DCFH-DA staining in BGC-823 (D) and SGC-7901 (E) cells. Curcumin (20 µM) was used as the positive control [Mean ± SEM; n = 3; **P<0.01, ***P<0.001]. (F and G) Cells were treated with CA6 at indicated concentrations for 4 h. NAC was administered at 5 mM alone or as a 2 h pretreatment before exposure of cells to CA6 (15 µM). Data showing DCFH-DA staining of BGC-823 (F) and SGC-7901 (G) cells [Mean ± SEM; n = 3; *P<0.5, **P<0.01, ***P<0.001, ns = not significant]. (H) Effect of CA6 on the colony-forming ability of gastric cancer cells. BGC-823 and SGC-7901 cells were exposed to various concentrations of CA6 for 24 h, with or without pretreatment with NAC (5 mM) for 2 h. Colony detected by crystal violet staining (blue). Representative images shown. |
Materials and Methods
Chemicals and Reagents
Curcumin, methyl thiazolyl tetrazolium (MTT), and antioxidant N-acetyl cysteine (NAC) were purchased from Sigma-Aldrich (St. Louis, MO). Cell cycle and apoptosis detection kits, Annexin V/Propidium iodide (PI) were purchased from BD Biosciences (Franklin Lakes, NJ). Reactive oxygen species probes 2,7-Dichlorodihydrofluorescein diacetate (DCFH-DA), dihydroethidium (DHE), and lipid peroxidation byproduct malondialdehyde (MDA) assay kits were obtained from Beyotime Institute of Biotechnology (Nantong, China). Caspase-9 activity assay, cytosolic and nuclear protein extraction kits, crystal violet dye, Hoechst 33258, and 4ʹ,6-diamidino-2-phenylindole (DAPI) staining solutions were purchased from Beyotime Institute of Biotechnology. Antibodies against Akt, phosphorylated Akt (p-Akt, Thr208 and Ser473), activating transcription factor-4 (ATF4), eukaryotic initiation factor 2α (eIF2α), phosphorylated eIF2α, CCAAT-enhancer-binding protein homologous protein (CHOP), FOXO3a, and p-FOXO3a were purchased from Cell Signaling Technology (Danvers, MA). Antibodies against p-FOXO3a, lamin B1 and cell proliferation marker Ki67 were purchased from Abcam (Cambridge, UK). Antibodies against murine double minute 2 (MDM2), cell division cycle-2 (CDC2), Cyclin B1, cleaved-poly (ADP ribose) polymerase (PARP), phosphatase and tensin homolog deleted on chromosome 10 (PTEN), TrxR1, GAPDH, and horseradish/fluorophore-conjugated secondary antibodies were purchased from Santa Cruz Biotechnology (Santa Cruz, CA, USA). CA6 was synthesized as outlined previously.15
Gastric Cancer Cell Lines
Human gastric cancer cell lines BGC-823 and SGC-7901 were obtained from the Institute of Biochemistry and Cell Biology, Chinese Academy of Sciences (Shanghai, China). Cells were cultured in RPMI-1640 medium (Gibco, Eggenstein, Germany) supplemented with 10% heat-inactivated fetal bovine serum (FBS; Hyclone, Logan, UT), 100 units/mL penicillin, and 100 µg/mL streptomycin (Gibco, Eggenstein, Germany).
Assessment of Cell Viability
Cell viability was measured using MTT assay. Cells were seeded in 96-well plates at a density of 8×10³ cells per well in 100 µL complete growth medium. Next day, cells were treated with increasing concentration of CA6 for 24 h or 48 h. CA6 was dissolved in DMSO and DMSO alone was used as vehicle control. MTT solution was then added and cells were incubated for 4 hrs at 37°C. DMSO was added to each well. The absorbance was measured at 490 nm using Spectra MAX190 (Molecular Device, USA). Cell viability was calculated using the following formula: 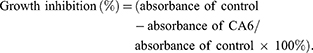
Measurement of Intracellular Reactive Oxygen Species (ROS) in Cultured Cells
Gastric cancer cells were seeded in 6-well plates at a density of 3×10⁵ cells per well and allowed to attach overnight. Cells were then exposed to CA6 (15 µM) or curcumin (20 µM) for various time points. In some experiments, cells were pretreated with NAC (5 mM) for 2 h prior to the CA6 treatment. Cells were then stained with DCFH-DA and fluorescence was measured using FACS Calibur flow cytometer (BD Biosciences, CA).
Colony Formation Assay
BGC-823 and SGC-7901 cells were seeded in 6-well plates and incubated for 24 h. Cells were then exposed to various concentrations of CA6 for 24 h, with or without pretreatment with NAC (5 mM) for 2 h. Medium was replaced with fresh culture medium and cells were further cultured for another 6 days. Cells were washed with PBS, fixed in 4% paraformaldehyde and stained with crystal violet.
Cell Cycle and Apoptosis Analysis
BGC-823 and SCG-7901 cells were seeded in 6-well plates at a density of 3×10⁵ cells per well and allowed to attach overnight. The following day, cells were challenged with CA6 at 5, 10 or 15 µM for 16 h (cell cycle analysis) or 24 h (apoptosis analysis), with or without NAC pretreatment (5 mM) for 2 h. Cells were fixed in ice-cold 75% ethanol. Cells were labeled with PI at a final concentration of 0.05 mg/mL for cell cycle phase detection. For apoptosis detection, cells were harvested in 500 μL binding buffer and labeled with FITC-conjugated Annexin V for 10 min and PI for 5 min. Analysis was performed using FACS Calibur flow cytometer. Data for cell cycle distribution and apoptosis were analyzed using FlowJo7.6 software (TreeStar, San Carlos, CA).
Western Blot Analysis
Protein lysates from cells and tumor tissues were prepared using RIPA lysis buffer supplemented with protease inhibitor cocktail. Cytosolic and nuclear proteins were extracted using fractionation kits from Beyotime. Protein concentrations were determined via Bradford protein assay (Bio-Rad, Hercules, CA). Proteins were separated in 10–15% sodium dodecyl sulfate-polyacrylamide gel electrophoresis (SDS-PAGE) and transferred to polyvinylidene difluoride (PVDF) membranes. The membranes were then blocked with 5% skim milk in tris-buffered saline containing 0.1% Tween 20 (TBST) for 90 min at room temperature. Subsequently, primary antibodies (1:1000) in TBST were added and membranes incubated overnight at 4°C. After washing with TBST, horseradish peroxidase (HRP)-conjugated secondary antibodies (1:3000) were added for 1 h at room temperature. After additional washing with TBST, immunoreactivity was detected by enhanced chemiluminescence detection system (ECL, GE Healthcare). Densitometric quantification was performed using Image J software (National Institute of Health, MD). Protein levels were normalized to loading control GAPDH. In the case of phosphorylated proteins, levels were normalized to respective total proteins determined by antibodies recognizing both phosphorylated and unphosphorylated forms.
Cell Transfection for Gene Silencing
Sequences of siRNA targeting ATF4 and TrxR1 are shown in Supplementary Table S1. siRNA oligonucleotides were synthesized by GenePharma (Shanghai, China). BGC-823 cells were seeded at a density of 1×10⁵ in 6-well plates for 24 hrs. siRNA against human ATF4, TrxR1, or non-targeting control siRNA (GenePharma) were transfected at a final concentration of 50 pmol (ATF4) or 100 nmol (TrxR1) using lipofectamine 3000 reagent (Invitrogen, CA) in serum-free medium for 6 hrs. Complete growth medium was then added and the cells were cultured for an additional 24 hrs. Levels of silenced genes were determined by Western blotting.
Determination of Caspase-9 Activity
Caspase-9 activity in cells and tissue lysates was determined using Caspase-9 Assay Kit (Beyotime). Caspase-9 activity was normalized to total protein concentration in the lysates and expressed as percentage of control.
CA6 and TrxR1 Interaction Studies
To identify the interaction between CA6 and TrxR1, three approaches were used. Firstly, molecular docking study was carried out using Tripos molecular modeling package Sybyl-x.v1.1.083 (Tripos, St. Louis, MO, USA). The crystal structure of human TrxR1 used for docking was obtained from the Protein Data Bank (PDB ID 2ZZ0, chain A). AutoDock Tools version 1.5.6 and PyMol was used to analyze the docking results.
Secondly, the binding of CA6 with recombinant human (rh) TrxR1 (Sigma-Aldrich) protein was determined using ProteOn XPR36 Protein Interaction Array system (Bio-Rad Laboratories, Hercules, CA) with a GLH sensor chip (ProteOn). Briefly, rhTrxR1 was loaded to the sensor, which was activated with 10 mM NiSO4, and the CA6 samples were prepared with running buffer (PBS, 0.1% SDS, 5% DMSO). Sensor and sample plates were placed on the instrument. CA6 samples were then captured in the first flow cells, and the second flow cell was left as a blank. Six concentrations of CA6 were simultaneously injected at a flow rate of 30 mM/min for 120 s of association phase, followed by 120 s of dissociation phase at 25°C. The final graphs represent the difference between the duplex or quadruplex sensorgrams and the blank sensorgrams. Data analysis was done using the ProteOn Manager Software, and the KD values were calculated using aligning the kinetic data from various concentrations of CA6 to the 1:1 langmuir binding model.
Finally, CA6 binding to TrxR1 was determined using 1.1′-bis(anilino)-4,4′-bis(naphthalene)-8,8′-disulfonate (bis-ANS) displacement assay. Briefly, bis-ANS (5 μM) and rhTrxR1 proteins (5 nM) were mixed in PBS (pH 7.4) and incubated for 15 min to reach stable relative fluorescence units (RFUs) emitted at 430–590 nm under the excitation at 385 nm. Then, non-fluorescent CA6 at 1, 2, 4, 6, 8 and 18 μM was added. RFUs at 430–590 nm were measured.
TrxR1 Activity Assays
TrxR1 activity was determined at room temperature using SpectraMax M5 microplate reader (Molecular Devices, USA). NADPH-reduced TrxR1 at 160 nM was incubated with various concentrations of CA6 for 2 h at room temperature in 96-well plates. A mixture of TE buffer (50 mM Tris-HCl, pH 7.5; 1mM EDTA, 50 mL) containing 5.50-dithiobis(2-nitrobenzoate) (DTNB) and NADPH was added to achieve final concentrations of 2 mM and 200 mM, respectively. The linear increase in absorbance at 412 nm during the initial 3 min was recorded. The same amounts of DMSO (1%, v/v) were added to the control experiments and the activity was expressed as the percentage of the control.
TrxR1 activity in lysates was measured by end-point insulin reduction assay as described previously.17,18 Briefly, 100 μg total proteins were incubated in a final reaction volume of 50 μL, containing 100 mM Tris-HCl (pH 7.6), 0.3 mM insulin, 660 μM NADPH, 3 mM EDTA, and 15 μM E. coli-derived Trx (Sigma-Aldrich) for 1 hr at 37°C. The reaction was terminated by adding 200 μL of 1 mM DTNB. A blank sample, containing everything except Trx, was treated in the same manner. The absorbance at 412 nm was measured, and the blank value was subtracted from the corresponding absorbance value of the sample. The activity was expressed as the percentage of the control.
In vivo Gastric Cancer Xenograft Model
Seven-week-old athymic BALB/c nu/nu female mice weighing 20–22 g were purchased from Vital River Laboratories (Beijing, China). Animal studies conducted are in compliance with the ARRIVE guidelines.19,20 All experimental protocols involving animal were approved by the Wenzhou Medical University Policy on the Care and Use of Laboratory Animals (Approved documents: wydw2014-0059). Animals were housed (6 animals/cage) at a constant room temperature with a 12/12 h light/dark cycle and fed a standard rodent diet and water ad libitum.
BGC-823 cells were injected subcutaneously into the right flank of each mouse at 1×10⁶ cells in 0.1 mL PBS. Once the tumors reached a volume of 100–160 mm3, mice were randomly distributed into 4 groups (n=6) as follows: 1) control mice treated with vehicle only; 2) mice treated with 10 mg/kg CA6; 3) mice treated with 20 mg/kg CA6; 4) mice treated with 50 mg/kg curcumin. All treatments were carried out with intraperitoneal injections every day. Tumor volumes were determined every day by measuring length (l) and width (w) and calculated as 0.5×l×w2. Body weights were also determined every day. On day 12, mice were euthanized and the tumor specimens were harvested and weighed. Tumor specimens were then processed for histological analyses and protein measurement studies. MDA content in tumor tissue lysates was analyzed using lipid peroxidation MDA assay (Beyotime).
Determination of Tumor Superoxide Production
Portion of tumor tissues extracted from mice was immediately embedded in OCT compound and cut into 5 μm-thick sections. Tissue sections were then incubated with dihydroethidium (DHE, 10 mM) in PBS at 37°C for 30 min in dark. DHE is oxidized upon reaction with superoxide to ethidium bromide, which then binds to DNA. Red fluorescence from ethidium bromide was viewed and captured using a fluorescence microscope (λex 490 nm, λem610 nm, Nikon, Japan).
Immunohistochemical Staining of Tissues
Harvested tumor tissues were fixed in 10% formalin and embedded in paraffin. Specimens were sectioned at 5 μm thickness. Tumor sections were stained using routine immunohistochemical techniques with primary antibodies against Ki67 (1:200), PTEN (1:100), p-Akt (1:200), or FoxO3a (1:200), respectively. HRP-conjugated secondary antibodies and diaminobenzidine (DAB) were used for detection. Tumor specimens as well as heart, liver and kidney tissues were also stained with hematoxylin and eosin (H&E).
Statistical Analysis
Statistical analyses were performed only when a minimum of n = 3 independent samples were acquired. All data are reported as mean ± SEM. Statistical analysis was performed using GraphPad Prism 6.0 software (GraphPad, San Diego, CA). One-way ANOVA followed by Dunnett’s post hoc test was used when comparing more than two groups of data, and one-way ANOVA, non-parametric Kruskal–Wallis test followed by Dunn’s post hoc test was used when comparing multiple independent groups. When comparing two groups, the unpaired Student’s t-test was used. A P value < 0.05 was considered statistically significant.
Results
CA6 Reduces Cell Viability of Gastric Cancer Cells via Inducing Intracellular ROS
We firstly measured the viability of gastric cancer cells upon exposure to CA6. BGC-823 and SGC-7901 cells were challenged with increasing concentrations of CA6 and cell viability was measured using MTT assay. As shown in Figure 1B and C, CA6 dramatically decreased cell viability of both gastric cancer cell lines after 24- and 48-h treatment. At 24-h post-exposure, we obtained the half-maximal inhibitory concentration (IC50) values of 11.09 ± 0.98 and 12.95 ± 1.51 µM for BGC-823 and SGC-7901 cells, respectively. Longer exposure at 48 h appeared to be more effective, as seen by IC50 values of 6.92 ± 0.33 and 6.01 ± 1.08 µM for BGC-823 and SGC-7901 cells, respectively.
Previously, we have reported that elevated ROS is the primary mediator of cytotoxicity induced by many curcumin analogs.16 Therefore, we evaluated whether the inhibitory effect of CA6 on gastric cancer cells involved intracellular ROS accumulation. As expected, CA6 increased ROS levels in both BGC-823 (Figure 1D) and SGC-7901 cells (Figure 1E). Curcumin, used as a positive control, also increased ROS levels (Figure 1D and E). These results suggest that CA6 is an inducer of ROS in gastric cancer cells. Next, we pretreated BGC-823 and SGC-7901 cells with NAC (N-acetyl cysteine, 5 mM), a specific ROS inhibitor, for 2 h prior to CA6 exposure. Our results show that NAC pretreatment decreased the levels of ROS in both tested gastric cancer cells (Figure 1F and G). In addition, colony-forming ability of gastric cancer cells was also suppressed by CA6 (Figure 1H). Whereas, pretreatment with NAC significantly reversed the inhibitory effect of CA6 (Figure 1H). These findings suggest that CA6-induced intracellular ROS accumulation may be a major cellular mechanism of its inhibitory activity against gastric cancer cells.
CA6-Induced ROS Causes G2/M Cell Cycle Arrest
We next examined the possible effect of CA6 on cell cycle regulation. Flow cytometric analysis revealed an accumulation of cells in the G2/M phase after CA6 exposure (Figure 2A–C). However, NAC pretreatment significantly reduced CA6-induced cell arrest in the G2/M phase (Figure 2A–C). These results show that CA6 reduced cell viability in part through halting cycle progression. We confirmed these results by measuring G2/M cell cycle-associated proteins cyclin B1, murine double minute (MDM2) and cell division cycle protein 2 (CDC2). Consistent to the data of cell cycle analysis, CA6 treatment reduced the protein levels of cyclin B1, MDM2 and CDC2 (Figure 2D). The inhibitory effects of CA6 on the expression of these proteins were much stronger than those of curcumin (Figure 2D). Furthermore, NAC pretreatment prevented CA6-mediated decrease of cell cycle regulating proteins (Figure 2E). These results suggest that the cell cycle arrest effect of CA6 is partially through the induction of ROS.
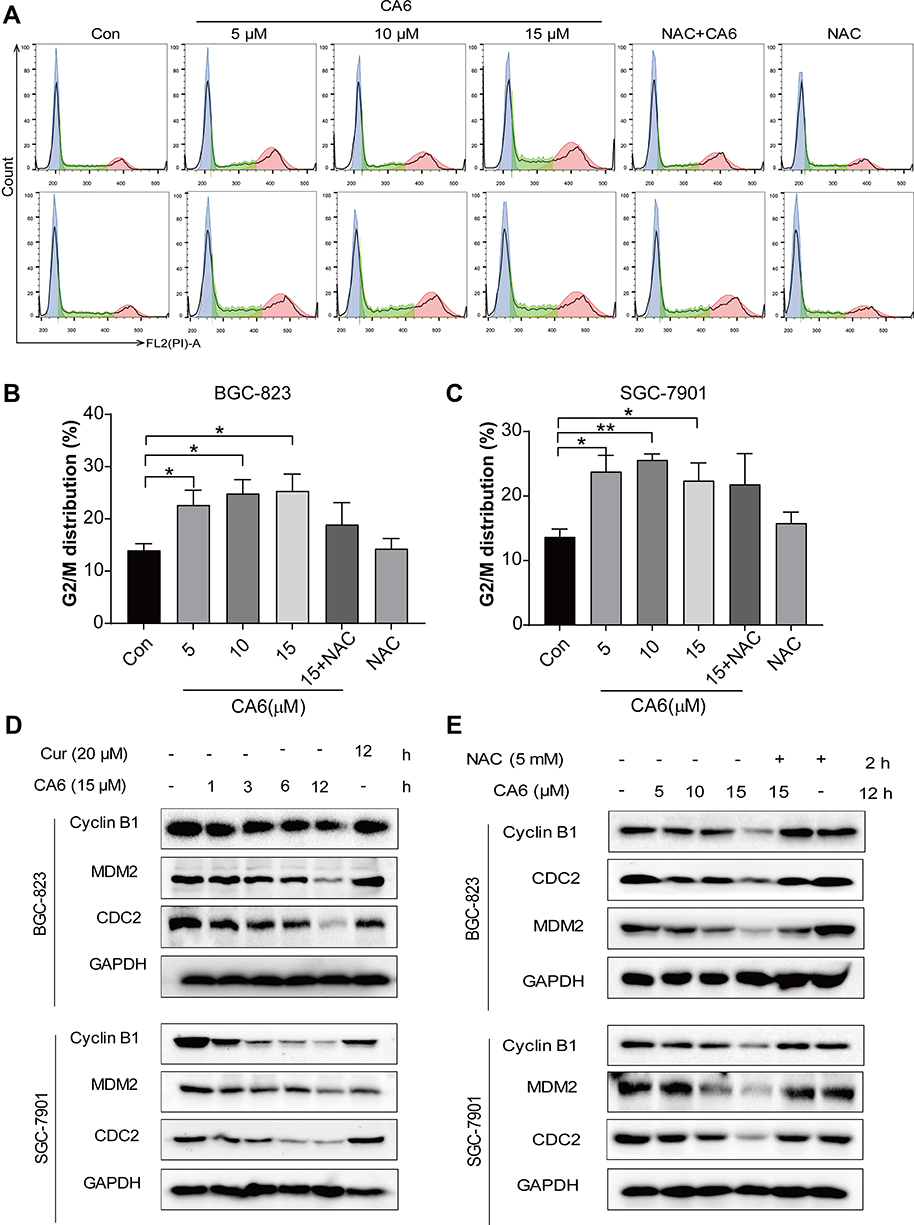 |
Figure 2 CA6 induces ROS-dependent G2/M cell cycle arrest. (A) BGC-823 (first row) and SGC-7901 (second row) were challenged with CA6 for 16 h, with or without pretreatment with NAC (5 mM) for 2 h. Cell cycle distribution was analyzed by PI staining. Representative histograms are shown [n = 3]. (B and C) Quantification of cells in the G2/M phase cells following exposure to CA6. Cells were treated as indicated in panel A [Mean ± SEM; n = 3; *P<0.05, **P<0.01, ***P < 0.001]. (D) BGC-823 and SGC-7901 cells were exposed to 15 µM CA6 for indicated time points. Levels of cell cycle regulating proteins Cyclin B1, MDM-2 and CDC-2 were determined by Western blot. Curcumin (20 µM) was used as the positive control and GAPDH as the loading control. Representative blots shown [n = 3]. (E) BGC-823 and SGC-7901 cells were exposed to CA6, with or without NAC pretreatment (5 mM). Levels of Cyclin B1, MDM-2 and CDC-2 were determined. GAPDH was used as loading control. Representative blots shown [n = 3]. |
CA6 Induces ROS-Dependent ER Stress Response
To investigate the underlying mechanism associated with CA6-induced gastric cancer cell growth inhibition, we examined whether CA6-induced apoptosis. Our data showed that CA6-induced apoptosis in both BGC-823 and SGC-7901 cells (Figure 3A, Supplementary Figure S1). NAC pretreatment decreased the number of apoptotic cells, confirming a ROS-mediated activity of CA6 (Figure 3A, Supplementary Figure S1). Morphological examination also shows apoptotic changes, including cell shrinkage, enlarged nuclei, nuclear fragmentation and chromatin condensation after CA6 treatment (Supplementary Figure S1C–D). Furthermore, CA6 treatment significantly increased the activity of caspase-9 in BGC-823 cells, while pretreatment with NAC markedly reversed this effect (Figure 3F). These results show that CA6-induced apoptosis in gastric cancer cells through ROS elevation.
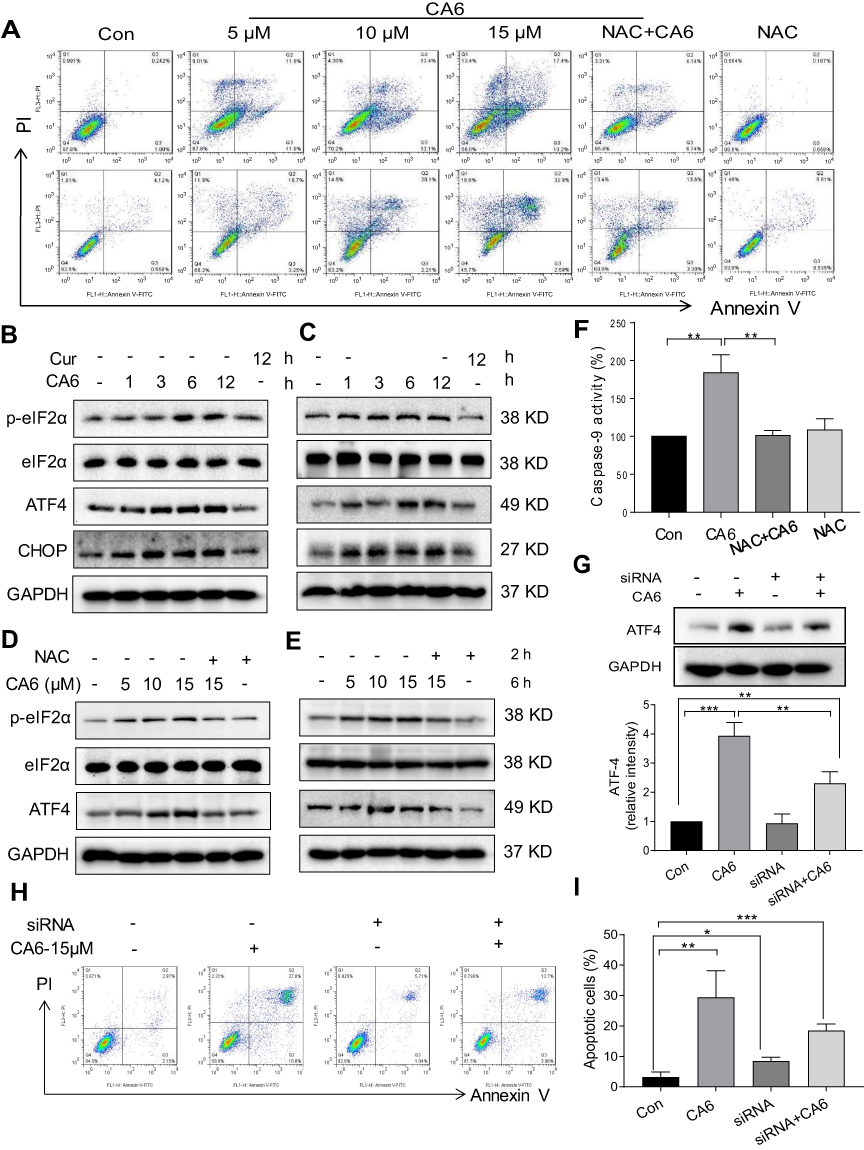 |
Figure 3 CA6 induces ER stress and gastric cancer cell apoptosis. (A) BGC-823 and SGC-7901 cells were pretreated with NAC (5 mM) for 2 h before exposure to CA6 for 24 h. Percentage of cell apoptosis was determined by Annexin-V/PI staining. Representative dot plots shown [n = 3]. (B, C) BGC-823 (B) and SGC-7901 (C) cells were challenged with CA6 (15 µM) for indicated time points. Levels of ER stress-related proteins p-eIF2α, ATF4, and CHOP were determined. Curcumin was used as a positive control at the dose of 20 µM. GAPDH was used as the loading control. Representative blots shown. (D, E) BGC-823 (D) and SGC-7901 (E) cells were exposed to CA6 at the dose of 5, 10 and 15 µM for 6 h. Where indicated, NAC pretreatment (5 mM) was carried out for 2 h. Cells treated with curcumin (20 µM) for 12 h were used as the positive control. Protein levels of p-eIF2α, ATF4 and CHOP were determined. (F) BGC-823 cells were transfected with siRNA against ATF4. Cells were then exposed to CA6 (15 μM) for 6 h. Levels of ATF4 were determined. GAPDH was used as loading control. Representative immunoblot (upper panel) and densitometric quantification (lower panel) is shown [Mean ± SEM; n = 3; **P<0.01]. (G) BGC-823 cells were exposed to CA6 (15 μM) for 12 h, with or without pretreatment with NAC (5 mM) for 2 h. The activity of caspase-9 was determined [Mean ± SEM; n = 3; **P<0.01, ***P < 0.001]. (H, I) Flow cytometric analysis of apoptotic cells following knockdown of ATF4 and exposure to CA6. BGC-823 cells transfected with ATF4 siRNA were exposed to CA6 (15 µM) for 24 h. Dot plots (H) and quantification of apoptotic cells (I) are shown [Mean ± SEM; n=3; *P < 0.05, **P < 0.01, ***P < 0.001]. |
Previous studies have shown that oxidative stress can cause cellular apoptosis by multiple mechanisms including both extrinsic and intrinsic pathways. We have reported that ROS-mediated endoplasmic reticulum (ER) stress induces apoptosis in gastric cancer cells.21 Therefore, we evaluated the induction of ER stress in response to CA6 challenge. Our results show that CA6 increased ER stress-specific proteins phosphorylated-eukaryotic initiation factor-2α (p-eIF2α), activating transcription factor-4 (ATF4), and CCAAT-enhancer-binding protein homologous protein (CHOP) in both BGC-823 (Figure 3B, D) and SGC-7901 cells (Figure 3C, E). These inductions were seen in cells at 6 h post CA6 exposure. Since CA6 increased ROS production in gastric cancer cells rapidly in 1 h (Figure 1D and E), we evaluated whether ROS was necessary for ER stress induction. We observed decreased levels of ER stress-related proteins in cells pretreated with NAC before exposure to CA6 for 6 h (Figure 3D and E). These results suggest that CA6-induced ER stress activation was dependent on increased intracellular ROS generation. Finally, to confirm if ER stress plays an essential role in response to CA6-induced cell death, ATF4 was silenced in BGC-823 cells (Figure 3G). ATF4-silencing led to a significantly reduced number of apoptotic cells upon CA6 exposure (Figure 3H and I). These results suggest that CA6-mediated cytotoxicity in gastric cancer cells through ROS-mediated ER stress activation.
CA6-Induced ROS Elevation Promotes Apoptosis Through ROS-Dependent Modulation of Akt/FoxO3a/PTEN Signaling Axis
Multiple signaling pathways that regulate cell survival can be altered by increased ROS levels in cells. These signaling pathways include mitogen-activated protein kinases22 and phosphoinositide 3-kinase (PI3K)/Akt pathway.23 Akt regulates cell survival by inactivating downstream proteins such as FoxO3a transcription factors.24 Akt phosphorylation, a proxy for activation, induces nuclear export of FoxO proteins through the nuclear pore complex.25 As FoxO proteins exhibit tumor suppression functions and regulate the expression of genes involved in apoptosis and cell cycle arrest,24 we reasoned that the inhibitory activity of CA6 on gastric cancer growth may involve alteration of the Akt-FoxO3a pathway. Our results show that CA6 decreased the levels of p-Akt (Ser473 and Thr308) and p-FoxO3a (Figure 4A and B). We also found that the levels of FoxO3a proteins were increased by CA6 (Figure 4B). Increased levels of phosphatase and tensin homolog deleted on chromosome 10 (PTEN), the main negative regulator of the PI3K-Akt pathway, were also noted in cells exposed to CA6 (Figure 4A). Also, these alterations in Akt-FoxO3a were associated with increased levels of apoptosis marker, cleaved-poly (ADP ribose) polymerase (Figure 4B).
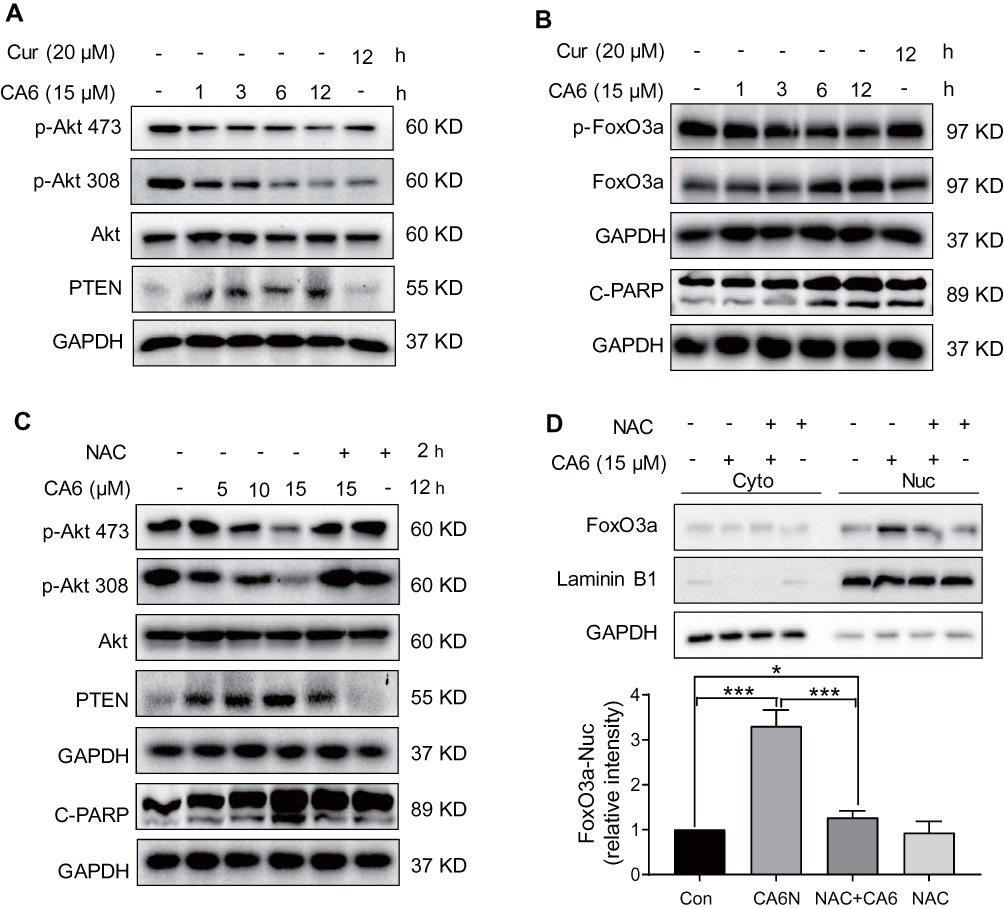 |
Figure 4 CA6 induces apoptosis in gastric cancer cells through ROS-dependent modulation of AKT and FOXO3a. (A) BGC-823 cells were treated with CA6 (15 μM) for indicated time points. Curcumin was used at the dose of 20 µM as positive control. Levels of phosphorylated Akt (Thr308 and Ser473) and PTEN were determined. GAPDH was used as loading control. Representative immunoblots shown [n = 3]. (B) Cells treated as indicated in panel A were probed for levels of phosphorylated-FoxO3a and cleaved-PARP. (C) BGC-823 cells were exposed to CA6 (15 μM) for 12 h, with or without pretreatment with NAC (5 mM) for 2 h. Levels of p-Akt473, p-Akt308, PTEN, and cleaved-PARP were determined. Representative immunoblots shown [n = 3]. (D) Cytosolic and nuclear fractions from BGC-823 cells treated as indicated in panel C. Protein levels of FoxO3a were examined. GAPDH and Lamin B1 were used as loading control. Representative blots shown in the upper panel and densitometric quantification are shown in the lower panel [Mean ± SEM; n = 4; *P < 0.05; ***P < 0.001]. |
Next, to explore the possible link between CA6-induced ROS and Akt-FoxO3a, we eliminated ROS in CA6-challenged cells using NAC. As shown in Figure 4C, depletion of ROS reduced CA6-induced apoptosis, as evident by reduced cleaved-PARP levels. NAC also increased p-Akt levels in gastric cancer cells and reduced PTEN (Figure 4C). Furthermore, neutralizing ROS prevented CA6-induced nuclear accumulation and dephosphorylation of FoxO3a (Figure 4D, Supplementary Figure S2). Taken together, these results confirmed that CA6 amplified ROS generation, leading to growth inhibition and induction of apoptosis, possibly through activating FoxO3a.
CA6 Targets TrxR1 and Suppresses Its Enzymatic Activity
Studies have shown that both curcumin26,27 and some curcuminoids28,29 inhibit TrxR1. To determine whether CA6 targets TrxR1, we first performed a molecular simulation using a docking software. Our docking results showed that CA6 interacted with TrxR1 protein by covalent bonds on residues Cys-494 and Tyr-405 of the C-terminal redox center (Figure 5A). We validated the potential interaction of CA6 with TrxR1 by surface plasmon resonance (SPR). Our SPR data show that CA6 directly bound to recombinant human (rh) TrxR1 protein with a high affinity (KD value = 12.2 µM) (Figure 5B). We then used bis-ANS probe to assess CA6 TrxR1 binding, which interacts with proteins through its hydrophobic phenyl and naphthyl rings. We mixed rhTrxR1 with bis-ANS to obtain the stable fluorescence levels. CA6 was then added to observe the displacement of TrxR1. Fluorescence units were increased when bis-ANS was mixed with rhTrxR1 protein, whereas CA6 decreased the signal indicating competitive binding of CA6 to the hydrophobic pocket of rhTrxR1 protein (Figure 5C).
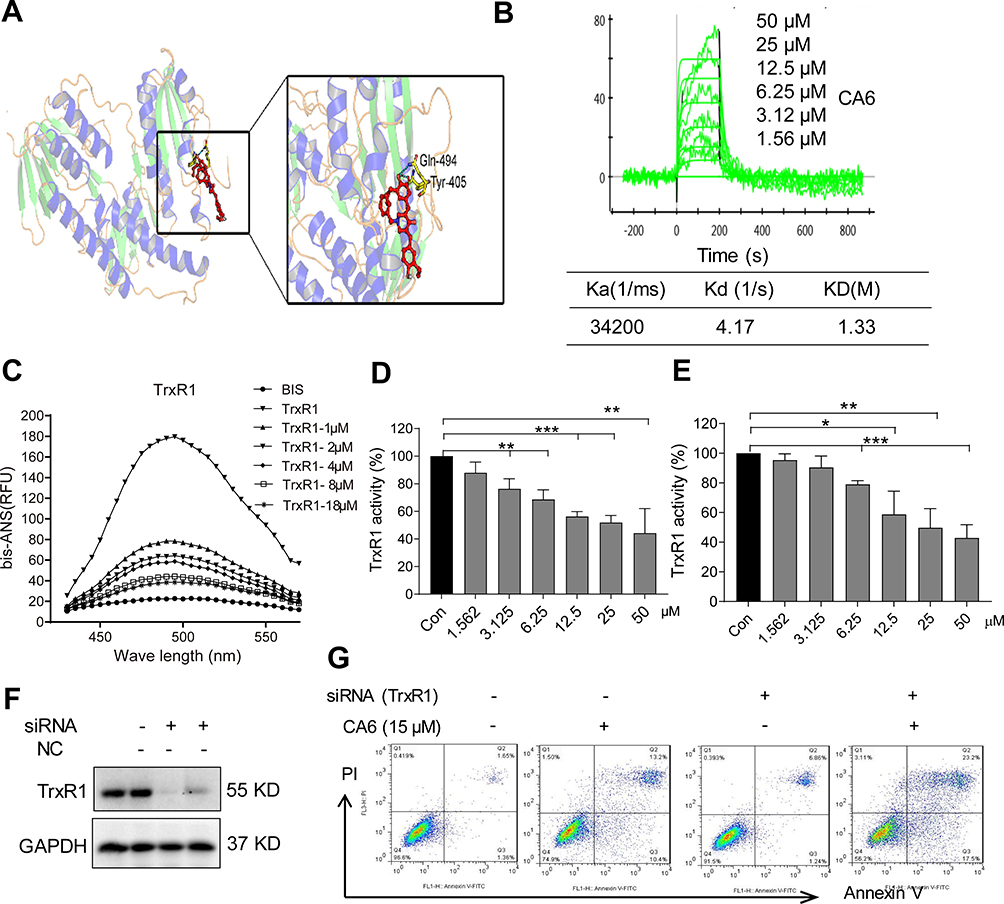 |
Figure 5 CA6 binds to TrxR1 and suppresses its enzymatic activity. (A) Molecular docking between CA6 and TrxR1 was simulated with Tripos molecular modeling package Sybyl-x.v1.1.083. (B) Recombinant human (rh) TrxR1 was added to different concentration of CA6 and binding affinities were measured using SPR. (C) Binding between CA6 and rhTrxR1 was analyzed through bis-ANS displacement assay. (D) The inhibitory effect of CA6 on rhTrxR1 enzymatic activity was determined using DTNB assay [Mean ± SEM; n=3; **P<0.01, ***P<0.001]. (E) TrxR1 enzymatic activity in BGC-823 cell lysates was determined using end-point insulin reduction assay [Mean ± SEM; n=3; *P<0.05, **P<0.01, ***P<0.001]. (F) BGC-823 cells were transfected with siRNA against TrxR1 and levels of TrxR1 were determined via Western blotting. GAPDH was used as loading control. Representative immunoblot shown [n = 3]. (G) BGC-823 cells transfected with TrxR1 siRNA were exposed to CA6 (15 µM) for 24 h. Apoptotic cells were determined using Annexin V/PI staining. Representative dot plots from 3 independent experiments were shown. |
Above findings suggest that TrxR1 may be the direct target of CA6. Therefore, we evaluated whether CA6 could effectively inhibit TrxR1 enzymatic activity. We evaluated the direct inhibitory effects of CA6 on rhTrxR1 protein activity using the 5.50-dithiobis(2-nitrobenzoate) (DTNB) assay. As expected, CA6 dose-dependently inhibited the activity of rhTrxR1 (Figure 5D). Furthermore, addition of CA6 to lysates prepared from BGC-823 cells also showed reduced TrxR1 activity (Figure 5E). To examine whether inhibition of TrxR1 was involved in CA6-indued gastric cancer apoptosis, we silenced TrxR1 in cells (Figure 5F) and exposed the cells to CA6 (Figure 5G). As shown in Figure 5G, TrxR1 silencing significantly enhanced CA6-induced BGC-823 cell apoptosis when compared to CA6 treatment alone. Collectively, our findings show that CA6 targeted TrxR1 and induced apoptotic cell death by reducing TrxR1 activity.
CA6 Inhibits BGC-823 Xenograft Tumor Growth in vivo by Reducing TrxR1 Activity and Enhancing ROS
Our in vitro studies suggest that CA6 inhibited TrxR1 activity and induced apoptosis through the elaboration of ROS. To confirm whether these mechanisms in vivo, we evaluated the anti-tumor effect of CA6 in BGC-823 xenograft tumor mouse model. We used CA6 at two different doses (10 and 20 mg/kg) and curcumin at the dose of 50 mg/kg as control. As shown in Figure 6A, CA6 or curcumin treatment did not affect the mice body weight. No histological alteration was noted in heart, liver, and kidney tissues of mice in any experimental group (Supplementary Figure S3). However, CA6- and curcumin treatments resulted in a significant reduction in both tumor volumes and tumor weights (Figure 6B–D). CA6 at the dose of 20 mg/kg showed a greater inhibitory effect on tumor growth compared to that of CA6 at 10 mg/kg or curcumin at 50 mg/kg (Figure 6B–D). Reduced tumor growth upon CA6 treatment was associated with reduced ki-67 immunoreactivity in harvested tumor specimens (Figure 6E, upper row). We further show that CA6 increased ROS levels in tumor specimens as detected by dihydroethidium (DHE) staining (Figure 6E, bottom row). Increased oxidative stress induced by CA6 is also evident through the measurement of lipid peroxidation product malondialdehyde (MDA) (Figure 6F). Also, our results show that CA6 significant decreased TrxR1 enzyme activity in gastric cancer tissues (Figure 6G).
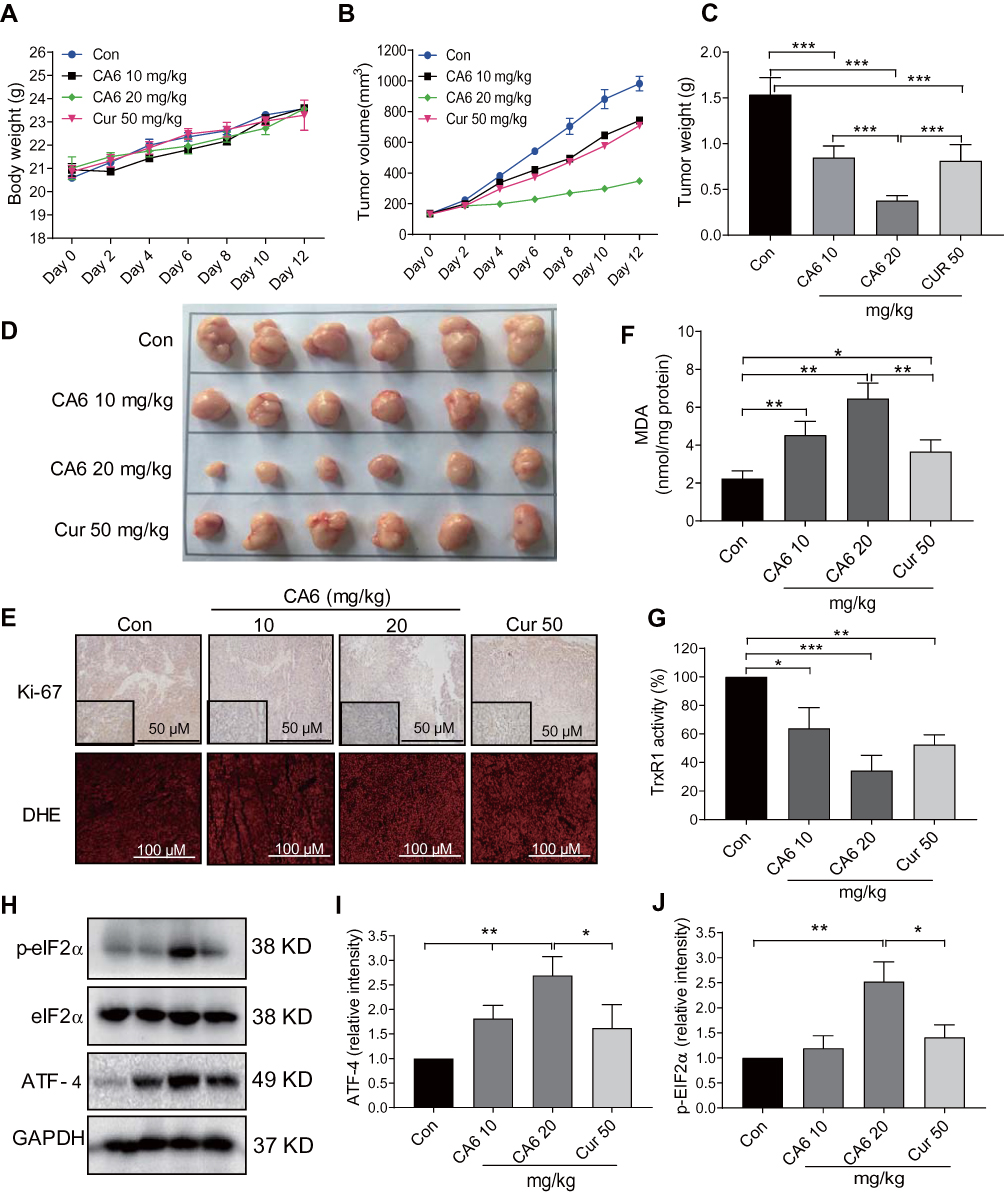 |
Figure 6 CA6 inhibits BGC-823 xenograft tumor growth by elevating ROS and reducing TrxR1 activity. BGC-823 cells were implanted in nude mice. Mice were then treated with CA6 (10 mg/kg or 20 mg/kg) for 12 days. Curcumin (50 mg/kg) was used as positive control. (A) Body weights of mice implanted with BGC-823 cells at indicated intervals [n=6]. (B) Tumor volumes determined at indicated time points following tumor cell injection [n=6]. (C) Measurement of tumor, harvested tumor weights on day 12 [Mean ± SEM; n=6; ***P<0.001]. (D) Images of harvested tumors from mice on day 12. (E) Staining of gastric tumor specimens for cell proliferation marker Ki-67 (top row). Ki-67 was detected using DAB chromogen staining (brown) [n = 6; scale bar = 50 µm]. Lower panel showing DHE staining (red) of tumor specimens [n = 6; scale bar = 100 µm]. (F) Measurement of oxidative stress marker MDA in tumor tissue lysates [Mean ± SEM; n=6; *P<0.05, **P<0.01]. (G) TrxR1 enzymatic activity of tumor tissue lysates as measured via endpoint insulin reduction assay [Mean ± SEM; n=6; *P<0.05, **P<0.01, ***P<0.001]. (H) Levels of ER stress-related proteins p-eIF2a and ATF4 in tumor lysates. GAPDH was used as loading control. Representative immunoblots were shown. (I, J) Densitometric quantification of ATF4 and p-EIF2α. ATF4 was normalized to GAPDH and p-EIF2α to EIF2α [Mean ± SEM; n=6; *P<0.05, **P<0.01]. |
Lastly, we confirmed the involvement of ER stress pathway activation and altered Akt-FoxO3a signaling in tumor specimens. As shown in Figure 6H and I, ATF4 levels were induced by CA6 at both 10 and 20 mg/kg doses. However, p-eIF2α only showed an increase with CA6 at 20 mg/kg dose (Figure 6H and J). These data show that CA6-induced ER stress in gastric cancer tissues. Immunohistochemical staining of tumor tissues from CA6-treated mice also shows decreased levels of p-Akt (Ser473) and p-FoxO3a, and increased levels of FOXO3a and PTEN (Figure 7A). Finally, we found that CA6 treatment increased the activity of caspase-9 in tumors (Figure 7B). Taken together, our in vivo studies mirror our in vitro findings and show that CA6 exhibited inhibitory activities in gastric cancer cells through inhibiting TrxR1 and inducing ROS-mediated apoptotic cell death (Figure 7C).
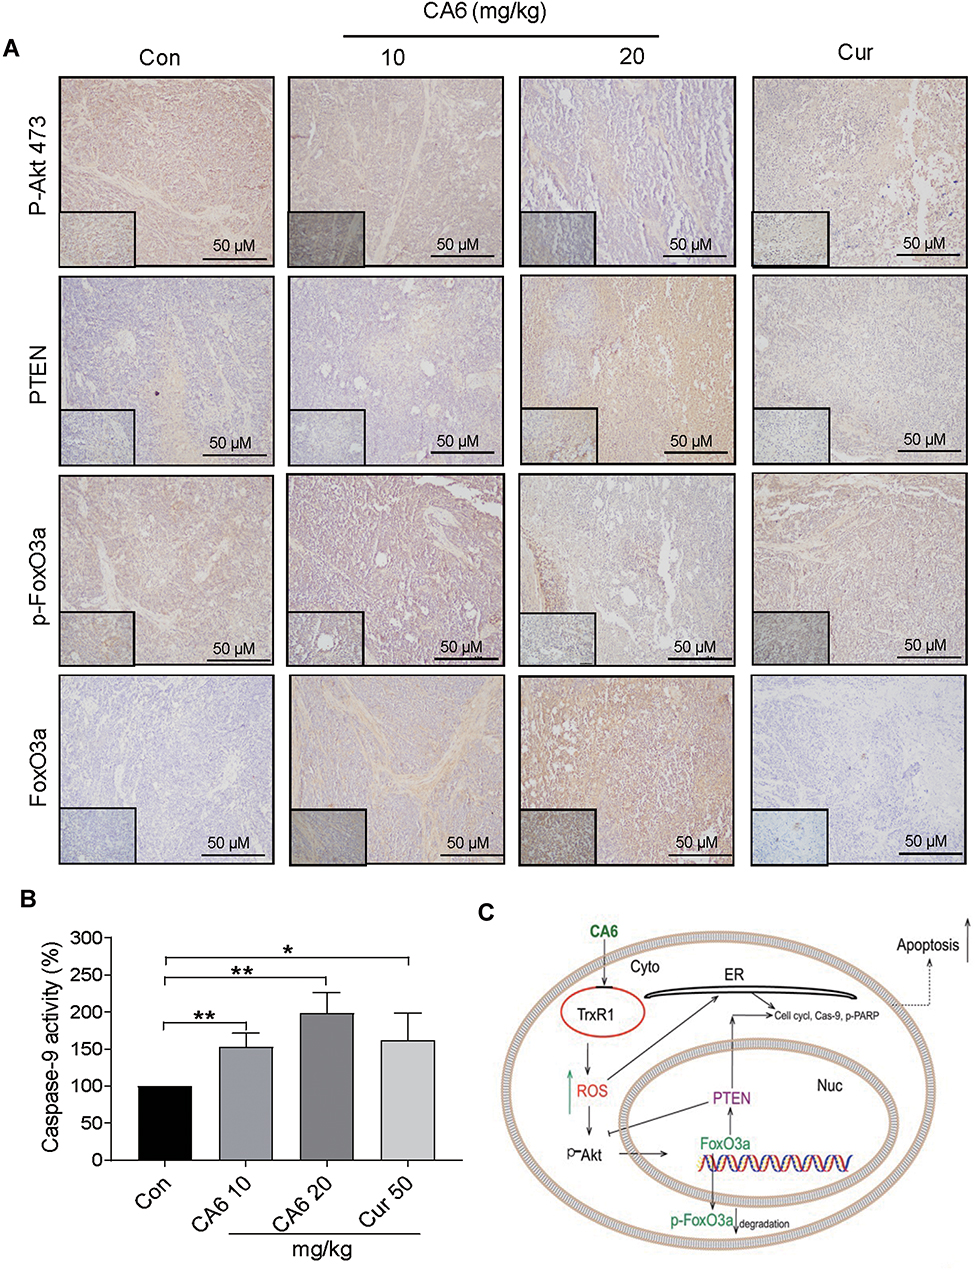 |
Figure 7 CA6 inhibits tumor growth by modulating AKT and FoxO3a in vivo. (A) Immunohistochemical staining of harvested tumor specimens for p-Akt (Ser473), PTEN, p-FoxO3a and FoxO3a. Antigens were detected by DAB chromagen (brown). Tissues were counterstained with hematoxylin (blue) [scale bar = 50 µm]. (B) Caspase-9 activity in tumor tissue lysates [Mean ± SEM; n=6; *P<0.05, **P<0.01]. (C) Schematic illustration of the inhibitory activity of CA6 on gastric cancer growth. |
Discussion
In the present study, we found that the allylated MAC, CA6, inhibited the growth of gastric cancer cells in vitro and in vivo. We show that CA6 directly bound to TrxR1 and inhibited its activity, leading to increased accumulation of ROS in gastric cancer cells. Furthermore, CA6-induced ROS-dependent apoptosis by inhibiting Akt survival pathway and activating FoxO3a. Collectively, our studies show that TrxR1 could be the potential therapeutic target for the treatment of gastric cancer, and we have provided preclinical evidence for the potential use of CA6 in clinic.
Enhancing ROS generation has been identified as a potential reason to induce apoptosis and curb cancer growth.30,31 Even though cancer cells basally generate high levels of ROS,6 which may facilitate proliferation and genomic instability. There appears to be a balance in the chaotic redox system of cancer cells. Agents that further enhance ROS or disrupt the redox state of cancer cells show selective cancer cell cytotoxicity.32 Curcumin and its derivatives have been reported to increase ROS levels in various cancer cell types.29,33,34 In the present study, we found that curcumin analog CA6 also increased ROS generation rapidly in both cultured gastric cancer cells and gastric tumors in mice. These findings suggest that CA6-induced cytotoxicity seen in gastric cancer cells may partly be mediated through elevated ROS levels. ROS-mediated oxidative stress has been shown to be critical in inducing cell death and cell cycle phase arrest.29 Consistent with this notion, CA6 treatment caused G2/M phase arrest in gastric cancer cells and significantly hampered the colony-forming ability of cells. These effects were intricately linked to ROS levels as NAC was able to neutralize CA6-induced G2/M phase arrest, restore colony growth potential, and prevented gastric cancer apoptosis. Our studies support the use of ROS enhancers as potential treatment options for gastric cancer cells.
There is a bidirectional relationship between ROS and ER stress.35 Elevated ROS inducing ER-stress-mediated apoptosis has also been demonstrated in different cancers.35,36 ER stress manifests as increased phosphorylation of eIF2α, which is required for transient downregulation of protein synthesis and selective induction of ATF4.37 ATF4 also induces the expression of CHOP, which is involved in the initiation of cell death.38,39 This link is abundantly displayed in gastric cancer cells exposed to CA6. CA6 increased the levels of p-eIF2a and induced ATF-4 and CHOP. These changes were found to be quite rapid. It was not surprising that eliminating ROS by NAC or knocking down the expression of ATF4 reduced ER-stress-meditated apoptosis in gastric cancer cells. Findings presented here describe a stress-mediated mechanism in which ER-stress is secondary to CA6-induced ROS.
ROS detoxifying enzymes that maintain intracellular ROS homeostasis are regulated by transcription factors, including the FoxO proteins.40 One member of the FoxO family, FoxO3a, plays a vital role in oxidative stress resistance in cells.41 FoxO3a is a downstream substrate of Akt and other growth factors. Activated Akt phosphorylates FoxO3a at multiple sites, leading to nucleus exclusion of FoxO3a and retention in the cytoplasm.42 Aberrantly activated Akt and suppressed FoxO3a have been reported in a number of cancers.43 There is also increasing evidence that many cytotoxic drugs induce apoptosis in cancer cells by altering the Akt-FoxO3a pathway. For example, docetaxel induces cancer cell apoptosis by enhancing FoxO3a activity and stimulating its nuclear translocation.44 A recent study also shows that increased expression of ER-stress protein CHOP may trigger FoxO3a-DNA binding, suggesting a potential link between FoxO3a accumulation and ER stress.45 In our present study, we found that CA6 inhibited Akt in gastric cancer cells. This Akt inhibition likely relieved the negative regulation of Akt on FoxO3a. We observed decreased FoxO3a phosphorylation and increased nuclear FoxO3a levels in cells challenged with CA6. One unanswered question and an important direction for future studies are identifying FoxO3a target genes in gastric cancer cells. Although we anticipate that these targets include growth factor signaling, apoptosis, p53 signaling, and oxidative stress and metabolism,46 identification of gastric cancer-specific targets is likely to generate a list of potential treatment targets.
One of the key findings of our study is that CA6 targeted TrxR1. The Trx system plays a crucial role in coordinating innate antioxidant defense.47 Trx/TrxR system is upregulated in many human cancers10 and believed to facilitate tumor development and metastasis owing to their growth-promoting, apoptosis-resisting, and angiogenesis-supporting functions.48 Moreover, Trx/TrxR system confers an aggressive tumor phenotype, poorer prognosis, decreased patient survival and resistance to programmed cell death.10 Many clinically used drugs have been reported to inhibit TrxR including mitomycinC49 and alkylating and platinum compounds.50 Not surprisingly, many compounds are being developed to target TrxR.51 Herein, using various approaches, we found that CA6 directly bound and targeted TrxR1. The specific interaction of CA6 with TrxR1 was demonstrated by SPR and Bis-ANS displacement assays. More importantly, CA6 inhibited TrxR1 enzymatic activity in BGC-823 cells and BGC-823-derived tumor tissues. Depleting TrxR1 in BGC-823 cells also potentiated the effect of CA6 and increased apoptotic cell death. Although the data strongly support CA6 as an inhibitor of TrxR1, much work still needs to be done to clarify the interaction between CA6, TrxR1 and ROS-dependent apoptosis in gastric cancer cells. For example, a kinetic enzymatic study of the type of inhibition by CA6 on TrxR1 is lacking in the present study. Also, further experiments are needed to evaluate the contribution of other possible TrxR1-independent ROS sources in the metabolism of gastric cancer cells after CA6 treatment.
In summary, the current study demonstrates that CA6 exhibited significant cytotoxicity in gastric cancer cells, including inducing G2/M cell cycle arrest and apoptosis. We found that these activities were mediated through increased ROS levels in gastric cancer cells, both in culture and in the mouse xenograft tumor model. Elevated ROS led to ER stress-dependent cancer cell apoptosis. More importantly, we discovered that CA6 increased ROS levels in gastric cancer cells through directly binding to and inhibiting the activity of TrxR1. Overall, these studies implicate TrxR1 in the pathogenesis of gastric cancer and provide support for further development and testing of CA6 in combating gastric cancer.
Abbreviations
Akt, Protein kinase B; ATF-4, Activating transcription factor-4; bis-ANS, 1,1′-bis(anilino)-4,4′-bis(naphthalene)-8,8′-disulfonate; CDC2, Cell division control protein kinase-2; CHOP, CCAAT/-enhancer-binding protein homologous protein; DAPI, 4ʹ,6-diamidino-2-phenylindole; DCFH-DA, 2,7-Dichlorodihydrofluorescein diacetate; DHE, Dihydroethidium; DMSO, Dimethylsulfoxide; DTNB, 2,4-dinitrochlorobenzene; eIF2, Eukaryotic initiation factor-2; ER, Endoplasmic reticulum; FITC, Fluorescein isothiocyanate; FoxO3a, Forkhead box O3; GAPDH, Glyceraldehyde 3-phosphate dehydrogenase; H&E, Hematoxylin & eosin; HRP, Horseradish peroxidase; IC50, Half maximal inhibitory concentration; MAC, Allylated mono-carbonyl analog of curcumin; MDA, Malondialdehyde; MDM2, Mouse double minute 2 homolog; MTT, Methyl thiazolyl tetrazolium; NAC, N-acetyl cysteine; NADPH, Nicotinamide adenine dinucleotide phosphate.; OCT, Optimal cutting temperature; OD, Optical density; PARP, Poly (ADP ribose) polymerase; PI, Propidium iodide; PI3K, Phosphoinositide 3-kinase; PTEN, Phosphatase and tensin homolog; RFU, Relative fluorescence units; ROS, Reactive oxygen species; RPMI, Roswell Park Memorial Institute media; siRNA, Small interfering RNA; Trx, Thioredoxin; TrxR1, Thioredoxin reductase-1.
Supporting Information
Supplementary methods information, including 1 table and 3 figures, are hyperlinked to this article at each citation of the materials in the main text.
Acknowledgement
We thank Prof. Zia Khan (Western University of Ontario, Canada) for language editing of the manuscript.
Author Contributions
All authors contributed to data analysis, drafting or revising the article, gave final approval of the version to be published, and agree to be accountable for all aspects of the work.
Disclosure
The authors report no conflicts of interest in this work.
References
1. Siegel R, Ma J, Zou Z, Jemal A. Cancer statistics, 2014. Cancer J Clin. 2014;64(1):9–29. doi:10.3322/caac.21208
2. Ferro A, Peleteiro B, Malvezzi M, et al. Worldwide trends in gastric cancer mortality (1980–2011), with predictions to 2015, and incidence by subtype. Eur J Cancer. 2014;50(7):1330–1344. doi:10.1016/j.ejca.2014.01.029
3. Pirini F, Noazin S, Jahuira-Arias MH, et al. Early detection of gastric cancer using global, genome-wide and IRF4, ELMO1, CLIP4 and MSC DNA methylation in endoscopic biopsies. Oncotarget. 2017;8(24):38501–38516. doi:10.18632/oncotarget.16258
4. Van Cutsem E, Sagaert X, Topal B, Haustermans K, Prenen H. Gastric cancer. Lancet. 2016;388(10060):2654–2664. doi:10.1016/S0140-6736(16)30354-3
5. Huang T, Song C, Zheng L, Xia L, Li Y, Zhou Y. The roles of extracellular vesicles in gastric cancer development, microenvironment, anti-cancer drug resistance, and therapy. Mol Cancer. 2019;18(1):62. doi:10.1186/s12943-019-0967-5
6. Szatrowski TP, Nathan CF. Production of large amounts of hydrogen peroxide by human tumor cells. Cancer Res. 1991;51(3):794–798.
7. Weyemi U, Lagente-Chevallier O, Boufraqech M, et al. ROS-generating NADPH oxidase NOX4 is a critical mediator in oncogenic H-Ras-induced DNA damage and subsequent senescence. Oncogene. 2012;31(9):1117–1129. doi:10.1038/onc.2011.327
8. Naughton R, Quiney C, Turner SD, Cotter TG. Bcr-Abl-mediated redox regulation of the PI3K/AKT pathway. Leukemia. 2009;23(8):1432–1440. doi:10.1038/leu.2009.49
9. Kruiswijk F, Labuschagne CF, Vousden KH. p53 in survival, death and metabolic health: a lifeguard with a licence to kill. Nat Rev Mol Cell Biol. 2015;16(7):393–405. doi:10.1038/nrm4007
10. Arner ESJ. Targeting the selenoprotein thioredoxin reductase 1 for anticancer therapy. Adv Cancer Res. 2017;136:139–151.
11. Cebula M, Schmidt EE, Arner ES. TrxR1 as a potent regulator of the Nrf2-Keap1 response system. Antioxid Redox Signal. 2015;23(10):823–853. doi:10.1089/ars.2015.6378
12. Teppo H-R, Soini Y, Karihtala P. Reactive oxygen species-mediated mechanisms of action of targeted cancer therapy. Oxid Med Cell Longev. 2017;2017:11.
13. Willenbacher E, Khan SZ, Mujica SCA, et al. Curcumin: new insights into an ancient ingredient against cancer. Int J Mol Sci. 2019;20:8. doi:10.3390/ijms20081808
14. Salehi B, Stojanovic-Radic Z, Matejic J, et al. The therapeutic potential of curcumin: a review of clinical trials. Eur J Med Chem. 2019;163:527–545. doi:10.1016/j.ejmech.2018.12.016
15. Zhu H, Xu T, Qiu C, et al. Synthesis and optimization of novel allylated mono-carbonyl analogs of curcumin (MACs) act as potent anti-inflammatory agents against LPS-induced acute lung injury (ALI) in rats. Eur J Med Chem. 2016;121:181–193. doi:10.1016/j.ejmech.2016.05.041
16. Rajamanickam V, Zhu H, Feng C, et al. Novel allylated monocarbonyl analogs of curcumin induce mitotic arrest and apoptosis by reactive oxygen species-mediated endoplasmic reticulum stress and inhibition of STAT3. Oncotarget. 2017;8(60):101112–101129. doi:10.18632/oncotarget.v8i60
17. Eriksson SE, Prast-Nielsen S, Flaberg E, Szekely L, Arner ES. High levels of thioredoxin reductase 1 modulate drug-specific cytotoxic efficacy. Free Radic Biol Med. 2009;47(11):1661–1671. doi:10.1016/j.freeradbiomed.2009.09.016
18. Holmgren A, Bjornstedt M. Thioredoxin and thioredoxin reductase. Methods Enzymol. 1995;252:199–208.
19. McGrath JC, Drummond GB, McLachlan EM, Kilkenny C, Wainwright CL. Guidelines for reporting experiments involving animals: the ARRIVE guidelines. Br J Pharmacol. 2010;160(7):1573–1576. doi:10.1111/j.1476-5381.2010.00873.x
20. McGrath JC, Lilley E. Implementing guidelines on reporting research using animals (ARRIVE etc.): new requirements for publication in BJP. Br J Pharmacol. 2015;172(13):3189–3193. doi:10.1111/bph.2015.172.issue-13
21. Zou P, Xia Y, Ji J, et al. Piperlongumine as a direct TrxR1 inhibitor with suppressive activity against gastric cancer. Cancer Lett. 2016;375(1):114–126. doi:10.1016/j.canlet.2016.02.058
22. Xu WT, Shen GN, Luo YH, et al. New naphthalene derivatives induce human lung cancer A549cell apoptosis via ROS-mediated MAPKs, Akt, and STAT3 signaling pathways. Chem Biol Interact. 2019;304:148–157. doi:10.1016/j.cbi.2019.03.004
23. Yang HL, Thiyagarajan V, Shen PC, et al. Anti-EMT properties of CoQ0 attributed to PI3K/AKT/NFKB/MMP-9 signaling pathway through ROS-mediated apoptosis. J Exp Clin Cancer Res. 2019;38(1):186. doi:10.1186/s13046-019-1196-x
24. Huang H, Tindall DJ. Dynamic FoxO transcription factors. J Cell Sci. 2007;120(Pt 15):2479–2487. doi:10.1242/jcs.001222
25. Van Der Heide LP, Hoekman MF, Smidt MP. The ins and outs of FoxO shuttling: mechanisms of FoxO translocation and transcriptional regulation. Biochem J. 2004;380(Pt 2):297–309. doi:10.1042/bj20040167
26. Cai W, Zhang B, Duan D, Wu J, Fang J. Curcumin targeting the thioredoxin system elevates oxidative stress in HeLa cells. Toxicol Appl Pharmacol. 2012;262(3):341–348. doi:10.1016/j.taap.2012.05.012
27. Fang J, Lu J, Holmgren A. Thioredoxin reductase is irreversibly modified by curcumin: a novel molecular mechanism for its anticancer activity. J Biol Chem. 2005;280(26):25284–25290. doi:10.1074/jbc.M414645200
28. He W, Xia Y, Cao P, et al. Curcuminoid WZ35 synergize with cisplatin by inducing ROS production and inhibiting TrxR1 activity in gastric cancer cells. J Exp Clin Cancer Res. 2019;38(1):207. doi:10.1186/s13046-019-1215-y
29. Chen X, Chen X, Zhang X, et al. Curcuminoid B63 induces ROS-mediated paraptosis-like cell death by targeting TrxR1 in gastric cells. Redox Biol. 2019;21:101061. doi:10.1016/j.redox.2018.11.019
30. Vallejo MJ, Salazar L, Grijalva M. Oxidative stress modulation and ROS-mediated toxicity in cancer: a review on in vitro models for plant-derived compounds. Oxid Med Cell Longev. 2017;2017:4586068. doi:10.1155/2017/4586068
31. NavaneethaKrishnan S, Rosales JL, Lee KY. ROS-mediated cancer cell killing through dietary phytochemicals. Oxid Med Cell Longev. 2019;2019:9051542. doi:10.1155/2019/9051542
32. Trachootham D, Alexandre J, Huang P. Targeting cancer cells by ROS-mediated mechanisms: a radical therapeutic approach? Nat Rev Drug Discov. 2009;8(7):579–591. doi:10.1038/nrd2803
33. Dai X, Zhang J, Guo G, et al. A mono-carbonyl analog of curcumin induces apoptosis in drug-resistant EGFR-mutant lung cancer through the generation of oxidative stress and mitochondrial dysfunction. Cancer Manag Res. 2018;10:3069–3082. doi:10.2147/CMAR.S159660
34. Zhang X, Chen M, Zou P, et al. Curcumin analog WZ35 induced cell death via ROS-dependent ER stress and G2/M cell cycle arrest in human prostate cancer cells. BMC Cancer. 2015;15:866. doi:10.1186/s12885-015-1851-3
35. Zhang Z, Zhang L, Zhou L, Lei Y, Zhang Y, Huang C. Redox signaling and unfolded protein response coordinate cell fate decisions under ER stress. Redox Biol. 2018.
36. Tang JY, Farooqi AA, Ou-Yang F, et al. Oxidative stress-modulating drugs have preferential anticancer effects – involving the regulation of apoptosis, DNA damage, endoplasmic reticulum stress, autophagy, metabolism, and migration. Semin Cancer Biol. 2018.
37. Rowlands AG, Panniers R, Henshaw EC. The catalytic mechanism of guanine nucleotide exchange factor action and competitive inhibition by phosphorylated eukaryotic initiation factor 2. J Biol Chem. 1988;263(12):5526–5533.
38. Han J, Back SH, Hur J, et al. ER-stress-induced transcriptional regulation increases protein synthesis leading to cell death. Nat Cell Biol. 2013;15(5):481–490. doi:10.1038/ncb2738
39. Marciniak SJ, Yun CY, Oyadomari S, et al. CHOP induces death by promoting protein synthesis and oxidation in the stressed endoplasmic reticulum. Genes Dev. 2004;18(24):3066–3077. doi:10.1101/gad.1250704
40. Ferber EC, Peck B, Delpuech O, Bell GP, East P, Schulze A. FOXO3a regulates reactive oxygen metabolism by inhibiting mitochondrial gene expression. Cell Death Differ. 2012;19(6):968–979. doi:10.1038/cdd.2011.179
41. Liu Y, Ao X, Ding W, et al. Critical role of FOXO3a in carcinogenesis. Mol Cancer. 2018;17(1):104. doi:10.1186/s12943-018-0856-3
42. Tzivion G, Dobson M, Ramakrishnan G. FoxO transcription factors; Regulation by AKT and 14-3-3 proteins. Biochim Biophys Acta. 2011;1813(11):1938–1945. doi:10.1016/j.bbamcr.2011.06.002
43. Hou Y, Sun G, Jiang X, Zhu Z, Yang J. Nuclear forkhead box O3a accumulation contributing to the proliferative suppression in liver cancer cells by PI3K/Akt signaling pathway. J Cancer Res Ther. 2018;14(Supplement):S1124–S1128. doi:10.4103/0973-1482.204891
44. Sunters A, Fernandez de Mattos S, Stahl Met al. FoxO3a transcriptional regulation of bim controls apoptosis in paclitaxel-treated breast cancer cell lines. J Biol Chem. 2003;278(50):49795–49805. doi:10.1074/jbc.M309523200
45. Ghosh AP, Klocke BJ, Ballestas ME, Roth KA. CHOP potentially co-operates with FOXO3a in neuronal cells to regulate PUMA and BIM expression in response to ER stress. PLoS One. 2012;7(6):e39586. doi:10.1371/journal.pone.0039586
46. Webb AE, Kundaje A, Brunet A. Characterization of the direct targets of FOXO transcription factors throughout evolution. Aging Cell. 2016;15(4):673–685. doi:10.1111/acel.2016.15.issue-4
47. Nguyen P, Awwad RT, Smart DD, Spitz DR, Gius D. Thioredoxin reductase as a novel molecular target for cancer therapy. Cancer Lett. 2006;236(2):164–174. doi:10.1016/j.canlet.2005.04.028
48. Schumacker PT. Reactive oxygen species in cancer cells: live by the sword, die by the sword. Cancer Cell. 2006;10(3):175–176. doi:10.1016/j.ccr.2006.08.015
49. Paz MM, Zhang X, Lu J, Holmgren A. A new mechanism of action for the anticancer drug mitomycin C: mechanism-based inhibition of thioredoxin reductase. Chem Res Toxicol. 2012;25(7):1502–1511. doi:10.1021/tx3002065
50. Witte AB, Anestal K, Jerremalm E, Ehrsson H, Arner ES. Inhibition of thioredoxin reductase but not of glutathione reductase by the major classes of alkylating and platinum-containing anticancer compounds. Free Radic Biol Med. 2005;39(5):696–703. doi:10.1016/j.freeradbiomed.2005.04.025
51. Zhang J, Li X, Han X, Liu R, Fang J. Targeting the thioredoxin system for cancer therapy. Trends Pharmacol Sci. 2017;38(9):794–808. doi:10.1016/j.tips.2017.06.001
 © 2020 The Author(s). This work is published and licensed by Dove Medical Press Limited. The full terms of this license are available at https://www.dovepress.com/terms.php and incorporate the Creative Commons Attribution - Non Commercial (unported, v3.0) License.
By accessing the work you hereby accept the Terms. Non-commercial uses of the work are permitted without any further permission from Dove Medical Press Limited, provided the work is properly attributed. For permission for commercial use of this work, please see paragraphs 4.2 and 5 of our Terms.
© 2020 The Author(s). This work is published and licensed by Dove Medical Press Limited. The full terms of this license are available at https://www.dovepress.com/terms.php and incorporate the Creative Commons Attribution - Non Commercial (unported, v3.0) License.
By accessing the work you hereby accept the Terms. Non-commercial uses of the work are permitted without any further permission from Dove Medical Press Limited, provided the work is properly attributed. For permission for commercial use of this work, please see paragraphs 4.2 and 5 of our Terms.