")
Back to Journals » Journal of Asthma and Allergy » Volume 16
Allergen Sensitization in Children in Weifang, China: Differences Between Monosensitization and Polysensitization
Authors Zhang X , Chen H, Liu S, Wang X, Guo B, Liu J, Feng S, Liu F
Received 31 January 2023
Accepted for publication 3 April 2023
Published 14 April 2023 Volume 2023:16 Pages 397—410
DOI https://doi.org/10.2147/JAA.S405549
Checked for plagiarism Yes
Review by Single anonymous peer review
Peer reviewer comments 2
Editor who approved publication: Dr Luis Garcia-Marcos
Xiyan Zhang,1,2 Hui Chen,1 Shengnan Liu,3 Xijuan Wang,2 Beibei Guo,2 Jingjing Liu,2 Shaojie Feng,2 Fengxia Liu2
1School of Clinical Medicine, Weifang Medical University, Weifang, People’s Republic of China; 2Department of Allergy, Weifang People’s Hospital, Weifang, People’s Republic of China; 3Department of Blood Transfusion, Affiliated Hospital of Weifang Medical University, Weifang, People’s Republic of China
Correspondence: Shaojie Feng; Fengxia Liu, Email [email protected]; [email protected]
Background: Children are the age group with the highest prevalence of allergy diseases. There is currently a lack of knowledge regarding monosensitization and polysensitization characteristics in children. In this study, we investigated the characteristics and differences between monosensitization and polysensitization in children in Weifang, eastern China.
Objective: To demonstrate the basic features of monosensitization and polysensitization in children. To explore the inherent and clinical parameter differences between monosensitized and polysensitized children.
Material and Methods: A total of 6030 individuals with a physician-determined need for allergy testing were tested for 15 common allergens, including 9 aeroallergens and 6 food allergens. A total of 938 allergen-positive children aged 1 month to 18 years were eventually included in this analysis. Complete blood count results from the same time as the allergen test were derived from the computerized medical records. Intrinsic features such as age, gender, sIgE, T-IgE, and clinical parameters such as eosinophil percentage, eosinophil count, basophil percentage, and basophil count were compared.
Results: The results showed that dust mite-related allergens, mould-related allergens, and tree and grass pollen-related allergens were the most prevalent allergens among monosensitized children. Additionally, the results of the combined pattern of polysensitive childhood allergens indicate the most common two allergens that were present together included dust mites and mould-related allergens, dust mite and Artemisia pollens, and dust mite and Humulus scandens pollens. Polysensitization can result in higher sIgE, T-IgE and eosinophil levels.
Conclusion: In conclusion, we provide a basic overview of allergens in monosensitized and polysensitized children. These findings provide new insight into the management of allergic diseases, particularly from the standpoint of polysensitization.
Keywords: allergic disease, children, monosensitization, polysensitization, eosinophils, T-IgE
Introduction
In recent years, the prevalence of allergic diseases has drastically increased worldwide, making it one of the most prevalent chronic diseases affecting the health of children.1 Allergic diseases, also called atopic diseases (“atopic” refers to the genetic susceptibility to developing allergy-related diseases), include allergic rhinitis, allergic conjunctivitis, allergic asthma, atopic dermatitis, food allergies, and urticaria.2 Numerous studies have demonstrated that the high prevalence of allergic diseases is a significant risk factor for respiratory disorders,3 tic disorders,4 and autism spectrum disorders,5 and they deserves widespread attention.
It is estimated that immunoglobulin E (IgE)‐mediated allergy is the most common allergic disease, triggered by trace allergens, affecting approximately 30% of the world’s population. In addition, it plays a significant role in the diagnosis of allergic diseases and serves as the foundation for allergen-specific immunotherapy (AIT).6 Remarkably, IgE triggered by allergens can stimulate basophil and mast cell mediator release in the earliest phases of allergic inflammation by binding to high affinity surface receptors (FcRI). Furthermore, IgE can also enhance allergen-specific T-cell responses by binding to FcεRI or the low affinity receptor CD23 on the surface of antigen-presenting cells (APCs) in the later stages of allergic inflammation. According to studies from Europe, the United States, and the Netherlands, polysensitization (multiple IgE-positive) is more widespread in the general population than monosensitization (single IgE-positive).7,8 However, there have only been a handful of studies that have examined the characteristics of polysensitized children. Moreover, there is a correlation between the distribution of allergens and specific geographic locations, and it is crucial to comprehend the allergen profile of the allergy illnesses that are prevalent in China.
Therefore, the aim of this study was to describe the pattern profile of monosensitization and polysensitization for common allergens in 938 IgE-positive children. Increasing evidence suggests that elevated levels of total serum IgE (T-IgE)9 and eosinophils10 are linked to allergic illnesses, although the underlying patterns remain elusive. In this study, intrinsic features such as age, gender, sIgE, and T-IgE and clinical parameters such as the eosinophil percentage, eosinophil count, basophil percentage, and basophil count were compared between children with monosensitization and those with polysensitization.
Materials and Methods
Study Populations
Between January 7, 2021, and November 16, 2022, 6030 individuals with a physician-determined need for allergy testing at the Weifang People’s Hospital served as the study’s primary data source. The ethics committee of Weifang People’s Hospital (KYLL2021120) approved the study. Children with a single positive allergy or multiple positive allergies ranging in age from one month to eighteen years were the focus of this research. A total of 495 single allergen-positive children and 443 multiple allergen-positive children were included after eliminating the allergen-negative population, removing duplicate test results, and screening for allergen-positive results.
Briefly, by excluding individuals with negative allergen results and those over the age of 18 from the primary population data, we included 1295 children who tested positive for allergens. For repeated examinations of children, only the earliest test results were considered. Then, 495 children with single specific immunoglobulin E (sIgE) positivity (monosensitization group) and 443 children with multiple sIgE positivity (polysensitization group) were included in the analysis using 0.7 as the cut-off value for serum sIgE. To eliminate potential confounding variables, we excluded from this study a subset of polysensitized children who became monosensitized after a cut-off value of 0.7 screening. A diagram of the procedure for including participants in the study population is shown in Figure 1.
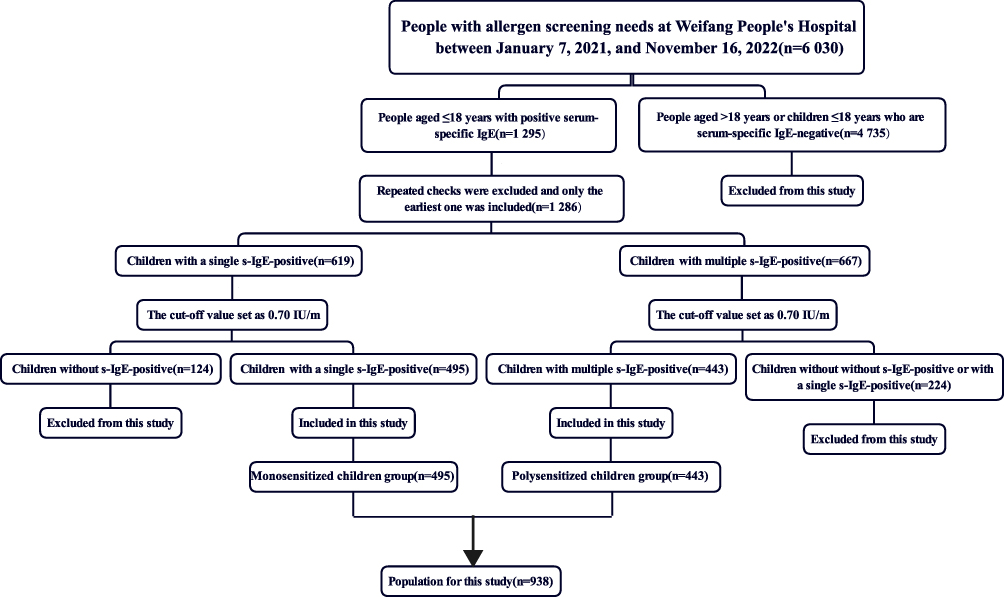 |
Figure 1 Study population. |
T-IgE and sIgE Tests
Participants in this study will undergo the following standardised process for allergen testing. Peripheral venous blood collected aseptically from the subject by a medical professional is immediately transferred to the laboratory for serological allergen screening. Briefly, peripheral venous blood samples were aseptically drawn from 2–4 mL, clotted at room temperature, and centrifuged at 3600 rpm for 4 minutes to separate the serum for allergen testing. According to the manufacturer’s instructions, T-IgE and sIgE were measured using a standard procedure with the assistance of an allergen sIgE antibody detection kit (Beijing Macro-Union Pharmaceutical Co. Ltd., China).
All participants will be tested for T-IgE levels and 15 common allergens, including 9 aeroallergens and 6 food allergens. These allergens were artificially classified into five categories in this study as follows: dust mite-related allergens (cockroach, mixture of house mite and dust mite), mould-related allergens (mixture of Penicillium notatum, branch spore mildew, Aspergillus fumigatus and Alternaria), animal-related allergens (cat epithelium and dog epithelium), food-related allergens (milk, egg white, soybeans, peanuts, sea shrimp, mixture of fish and crab), and tree and grass pollen-related allergens (Artemisia pollen, Humulus scandens pollen, ragweed pollen, and mixture of poplar, willow, and elm). A T-IgE level greater than 100 IU/mL is considered abnormal.
According to the manufacturing instructions, the results are classified into seven classes: level 0 (<0.35 IU/mL), level 1 (0.35–<0.70 IU/mL), level 2 (0.70–<3.50 IU/mL), level 3 (3.5–<17.5 IU/mL), level 4 (17.5–<50 IU/mL), level 5 (50–<100 IU/mL), and level 6 (≥100 IU/mL). For this study, in line with other studies, we assessed sIgE levels ≥ 0.70 IU/mL (level 2 and higher) to be positive. This is because using 0.35 IU/mL as the threshold for determining positive sensitisation is highly sensitive but less specific for diagnosing allergy.11,12 Additionally, we separated the sIgE levels into two categories as follows: the low-level group (levels 2 and 3) and the high-level group (levels 4, 5 and 6).
Complete Blood Count
Complete blood count results obtained at the same time as the allergen test were included in this analysis and were derived from the computerised medical records of the Weifang People’s Hospital. Eventually, 224 and 212 complete blood count results from the monosensitization and polysensitization groups, respectively, were included in this study. The four indications for complete cell counts were compared, including the eosinophil percentage (%), eosinophil count (109/L), basophil percentage (%), and basophil count (109/L). Importantly, we found that the data had three reference ranges, including one reference range with only one result. Therefore, we conducted a group analysis based on the reference values, and only the results for one reference range were excluded.
Statistical Analysis
Statistical analysis and data visualisation for this study were performed using IBM SPSS Statistics version 22 and GraphPad Prism 8 and are presented as the mean ± standard error of the mean (SEM). Percentages were employed to describe categorical values, and chi-square tests were used to test for differences between variables such as gender, sIgE, T-IgE and eosinophil percentage, with a two-tailed value of p<0.05 considered significant. For comparisons of the collected numerical variables, the Wilcoxon signed-rank test and Student’s t-test were performed, and a two‐tailed value of p<0.05 was considered statistically significant. Significance *p<0.05, **p<0.01, and ***p<0.001. NS means no statistical difference.
Results
Characteristics of the Study Population
Between January 7, 2021, and November 16, 2022, a total of 938 children with a median age of 7 (IQR 7) were included in this retrospective study. We divided the participating children into five age groups according to their developmental stage and the atopic march theory:13 32 infants (1 month–1 year), 103 toddlers (>1–3 years), 333 preschool children (> 3–6 years), 297 school-aged children (>6–12 years), and 173 adolescents (>12–18 years). Preschool children and school-aged children were the groups with the highest prevalence.
Characterisation of Allergen Profiles in the Monosensitization Group
To explore the age distribution characteristics of the children in the monosensitization group, we categorised the 495 children into five age groups as follows: 20 infants (4.04%), 55 toddlers (11.11%), 188 preschoolers (37.98%), 151 school-age children (30.51%) and 81 adolescents (16.36%), with preschoolers constituting the greatest proportion. In addition, bar and pie charts were employed to illustrate the distribution of allergens among monosensitized children, including 15 allergens and the five major allergen groupings. The results showed that dust mite-related allergens (56%), mould-related allergens (27%), and tree and grass pollen-related allergens (8%) were the most prevalent forms of single s-IgE positivity among children under the age of 18 (Figure 2A and B).
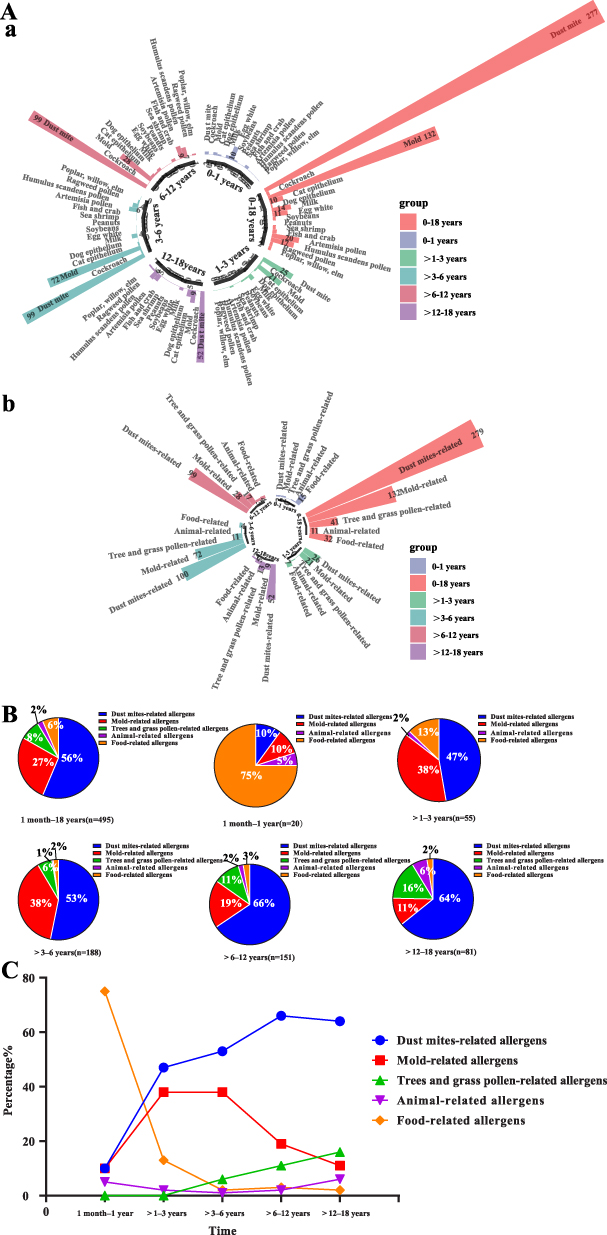 |
Figure 2 Overview of allergen distribution in monosensitized children (n=495). (A) Distribution of allergens in the age group of monosensitized children. (a) Radial bar chart: 15 common allergens; (b) Radial bar chart: 5 major groups of allergens. (B) Analysis of the proportion of the five major allergen groups in the age group of monosensitized children. (C) Trend analysis of the proportion of the five major allergen groups in the age group of monosensitized children. |
After refining the age classification, the pattern of allergen occurrence in the monosensitization group was changed. We observed a high proportion of food allergens in infants and toddlers. In particular, food-related allergens were present in up to 75% of infant cases, suggesting that food-related allergies should be a focus of concern for allergy-related diseases in infancy. Furthermore, it was discovered that allergens associated with dust mites play a preponderant role across the entire duration of childhood, starting in early childhood and steadily increasing in prevalence throughout childhood. Additionally, mould-related allergens are still the second most common allergens in children, although there is a downwards trend after the age of 6 years. Notably, tree and grass pollen-related allergens were not detected before three years but showed an almost linear increase on the timeline, suggesting that their peak may occur in adulthood. Finally, we discovered that there were no significant differences in the proportion of pet-related allergens among the five age groups (Figure 2C). Detailed information on the allergen profiles of the monosensitized groups is presented in Table S1.
Characterisation of Allergen Profiles in Polysensitization Groups
Additionally, the population features and age distribution of polysensitized children were investigated. A total of 443 children in the polysensitization groups are included in this study section, representing 47.23% of the entire experimental population. The results showed that polysensitization is now as important as monosensitization for children with allergen sensitization.
To investigate the distribution of different types of allergens, we subdivided the allergens that were in the polysensitization group. By aggregating the 5 major allergen groups, we revealed that dust mite-related allergens (29%), mould-related allergens (22%), and tree and grass pollen-related allergens (29%) were the predominant allergens in children with polysensitization (Figure 3A). A more detailed allergen profile for the polysensitization group is displayed in Figure 3B and C; mixture of house mite and dust mite were a major component. As illustrated in Figure 3D, the pattern of polysensitization varied with age. Infancy is characterised by a higher occurrence of food-related allergens. In addition, toddlers and preschoolers have a higher occurrence of mould-related allergens. Finally, school-age children and adolescents have a higher occurrence dust mite-related allergens. Notably, we found that polysensitization was present throughout the period from 1 month to 18 years of age, and polysensitization was observed even in infancy. Meanwhile, tree and grass pollen-related allergens were not observed in infancy monosensitized children, but they were detected in infancy in polysensitized children. Detailed information on the allergen profiles of the polysensitized groups is presented in Table S2.
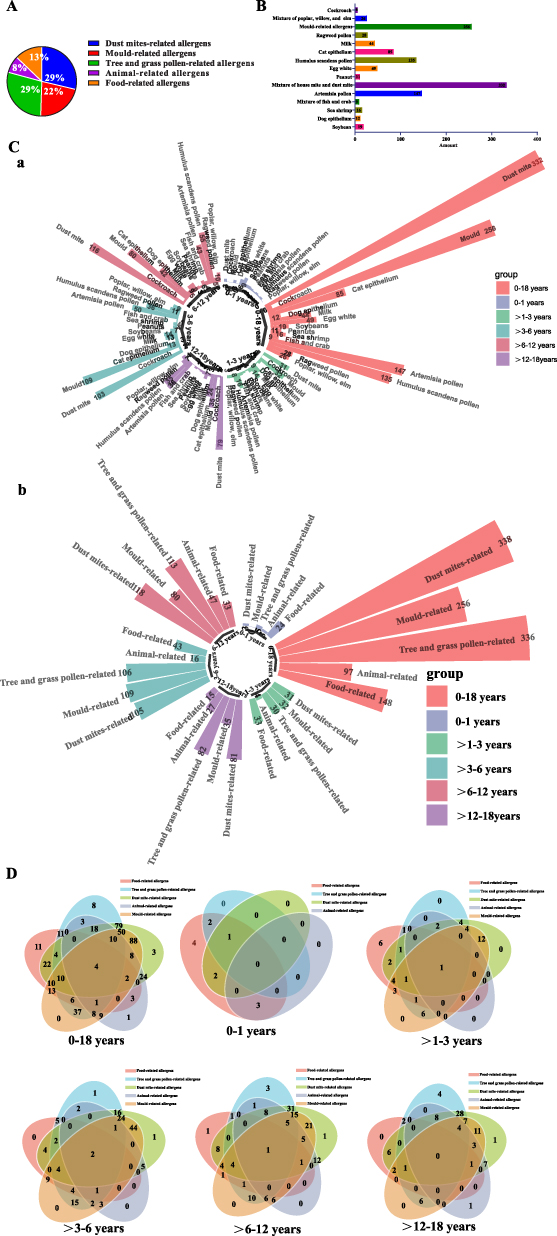 |
Figure 3 Overview of allergen distribution in polysensitized children (n=443). (A) Characteristics of the 5 major groups of allergens in polysensitized children. (B) Characteristics of 15 allergens in polysensitized children. (C) Distribution of allergens in age groups of polysensitized children. (a) Radial bar chart: 15 common allergens; (b) Radial bar chart: 5 major groups of allergens. (D) Overlap profiles of the 5 major allergen groups in the age grouping of polysensitized children. |
In addition, the UpSetR package in R was used to illustrate the combined relationship between 15 allergens in the polysensitization group.14 The results showed that the most common two allergens present together included dust mite and mould-related allergens, dust mite and Artemisia pollens, and dust mite and Humulus scandens pollens. The most common of the three allergen combinations in the polysensitization group were the combinations of dust mite, mould-related allergens, and Artemisia pollens and the combination of dust mite, mould-related allergens, and Humulus scandens pollens, as shown in Figure 4.
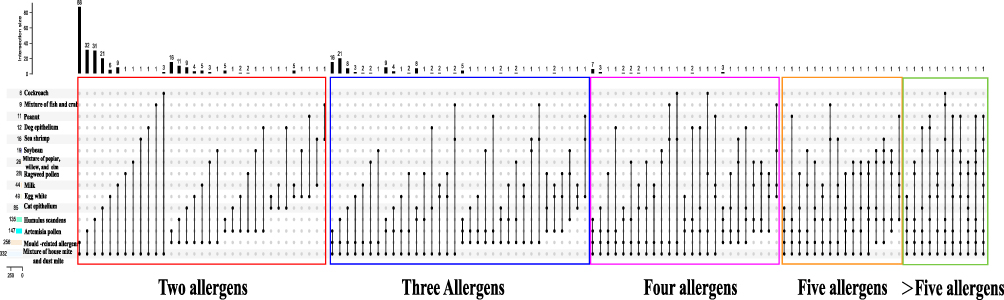 |
Figure 4 Combinations between 15 allergens in polysensitized children. |
The Difference Between Monosensitization Children and Polysensitization Children
In this section, we attempt to elucidate the differences in allergen profiles, gender, age, T-IgE, and clinical parameters of eosinophils and basophils in monosensitized children and polysensitized children.
Differences in Age, Gender and Allergen Distribution
First, we applied the eulerr package in R15 (https://cran.r-project.org/web/
packages/eulerr/index.html) to display the overall distribution of allergens, with the black font representing the distribution of allergens in monosensitized children and the remaining fonts representing the distribution in polysensitized children. As shown in Figure 5, dust mite-related allergies had the highest proportion of monosensitized and polysensitized children. Polysensitization is highly prevalent and difficult to differentiate from monosensitization in children with allergen sensitization (Figure 6A).
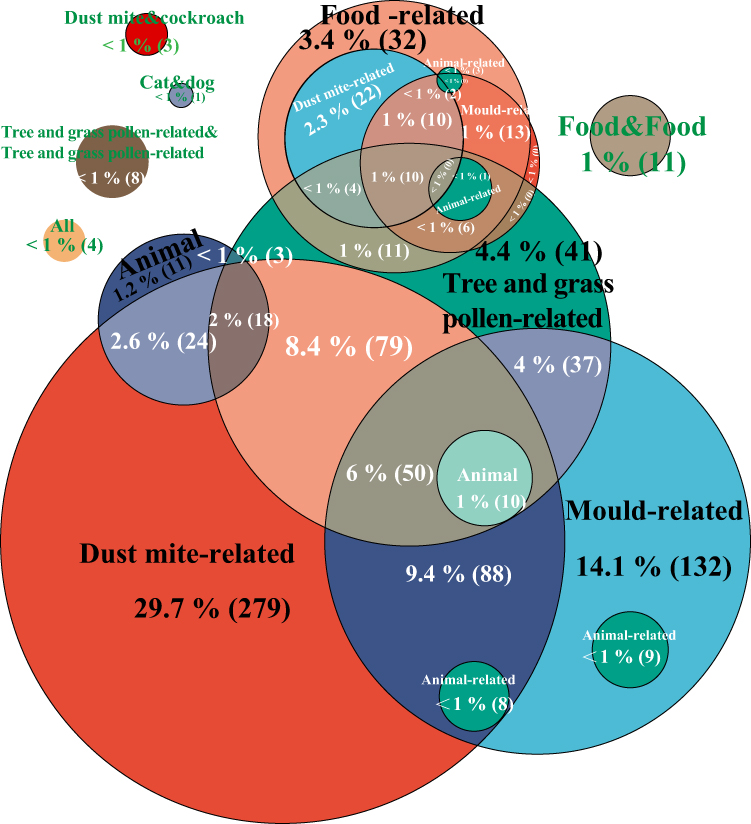 |
Figure 5 An overview of the overall proportion of the five major allergens in monosensitized and polysensitized children. |
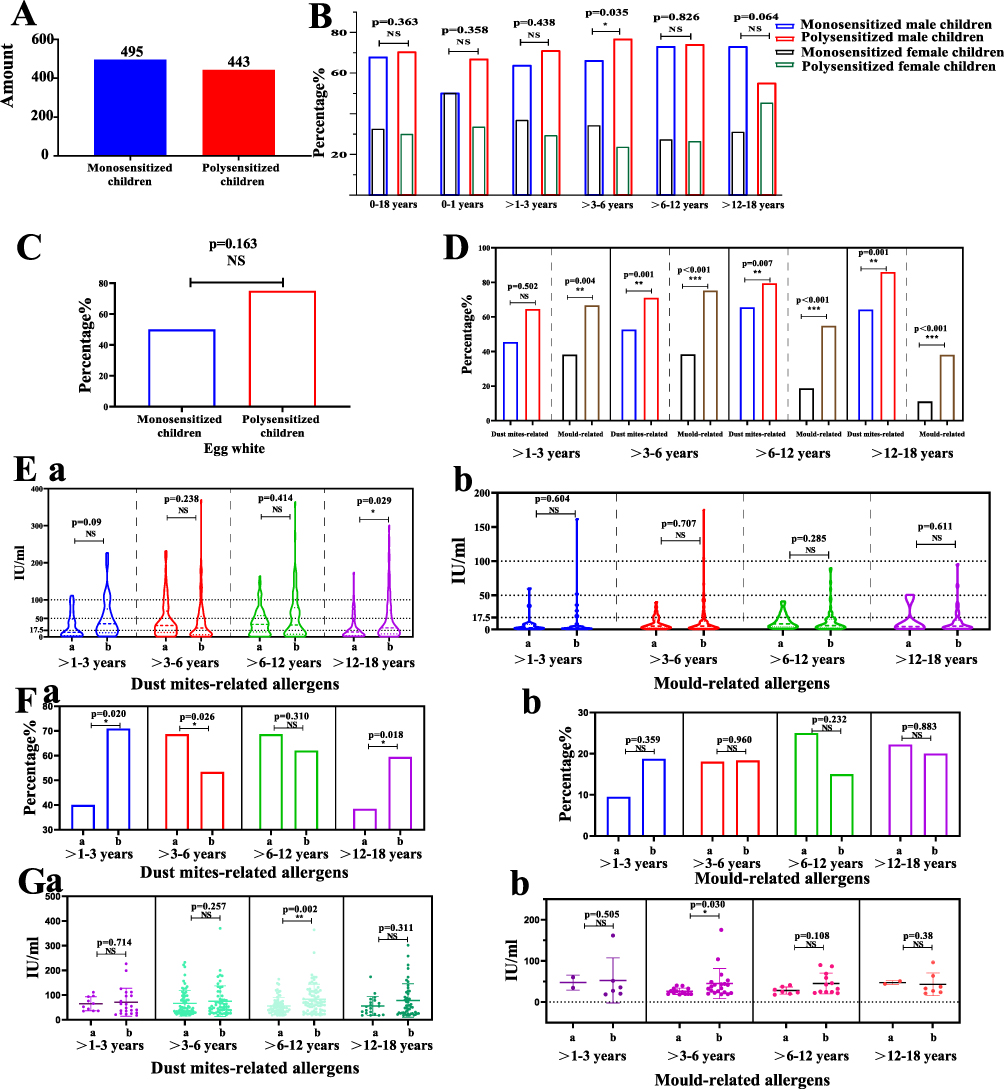 |
Figure 6 Comparative analysis of monosensitized and polysensitized children. (A) Overview of the number of monosensitized and polysensitized children in the overall cohort. (B) Gender differences in monosensitized and polysensitized children. (C) Percentage of eggs in infants among monosensitized and polysensitized children. (D) Differences in the proportions of dust mite-related allergens and mould-related allergens among monosensitized and polysensitized children. E. Differences in serum antibody levels to dust mite-related allergens and mould-related allergens in monosensitized and polysensitized children. (Ea): Dust mite-related allergens; (Eb): Mould-related allergens. (F) Differences in the proportion of high levels of sIgE in monosensitized and polysensitized children. (Fa): Dust mite-related allergens; (Fb): Mould-related allergens. (G) Differences in serum antibody levels of high levels of sIgE in monosensitized and polysensitized children. (Ga): Dust mite-related allergens; (Gb): Mould-related allergens. Significance *p < 0.05, **p < 0.01, and ***p < 0.001. Abbreviation: NS, no statistical difference. |
The difference in allergens between the two groups is the subject of our next section, as shown in Table 1. We investigated whether there were differences in age and gender between monosensitized children and polysensitized children. The findings revealed that polysensitization was more prevalent among males only when they were school-aged. In contrast, there were no significant differences in gender or age between the two groups (Figure 6B).
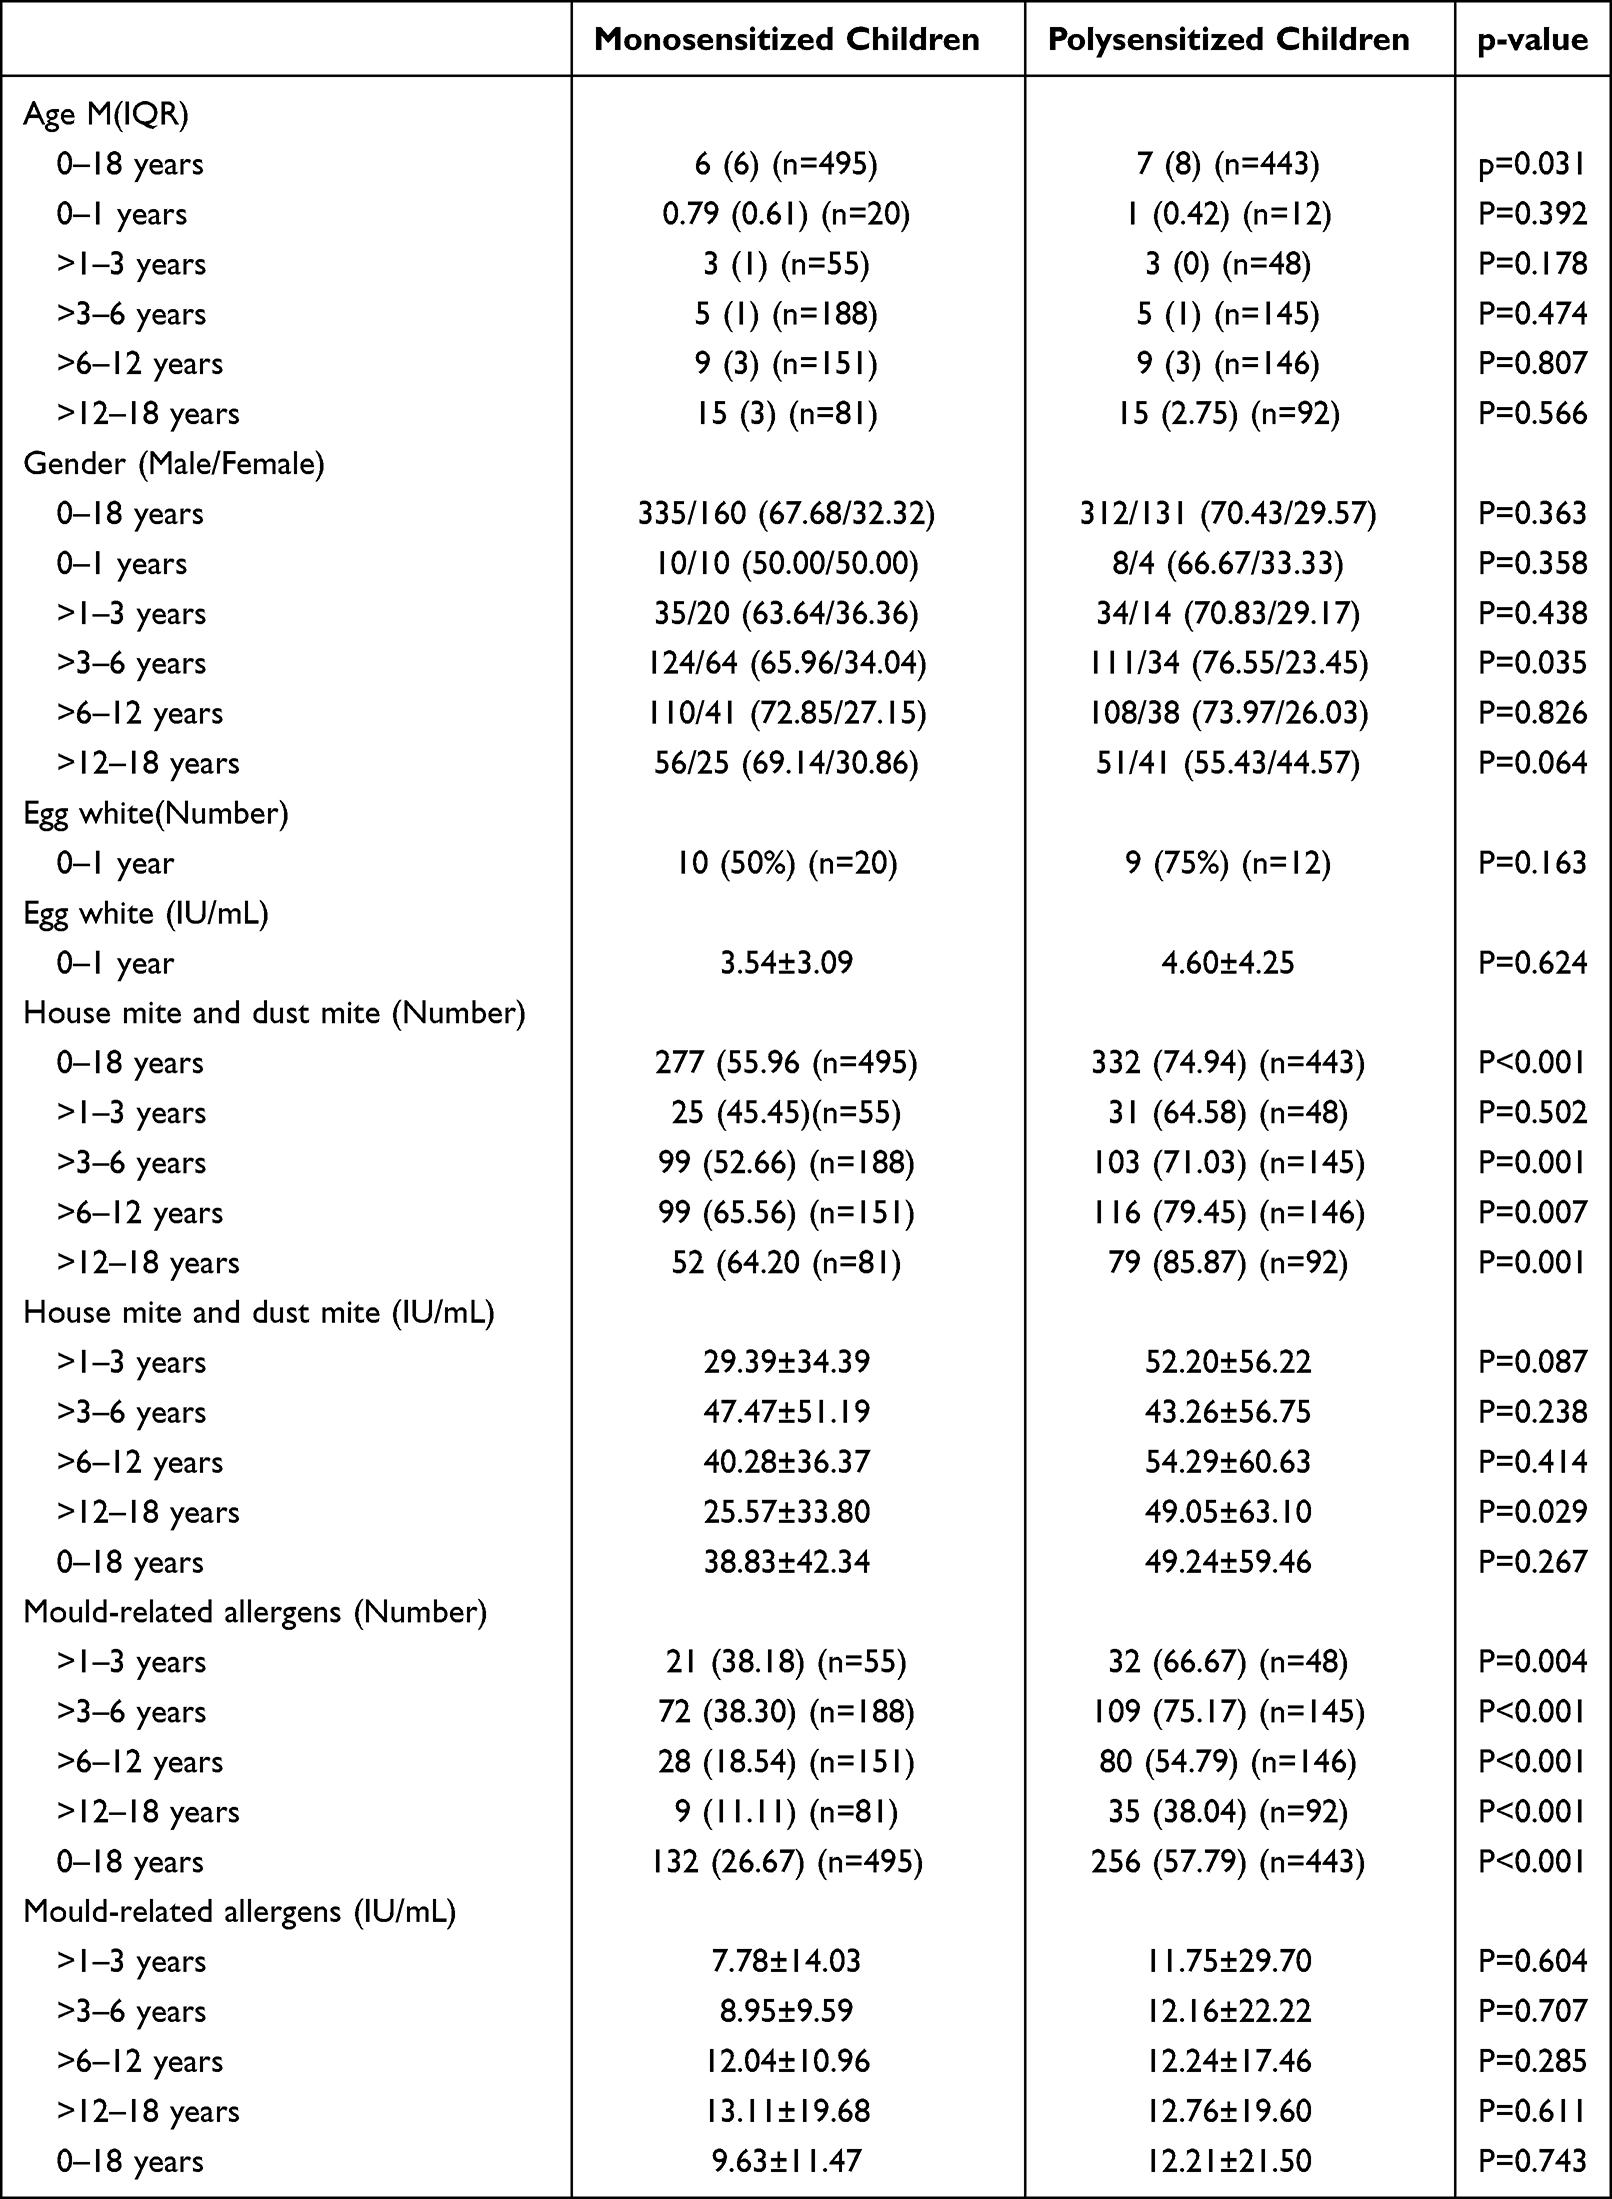 |
Table 1 Differences Between Monosensitized and Polysensitized Children |
Next, we compared the two groups in terms of the proportion of egg allergens in the infant group, which accounted for the highest percentage of food allergies in infants, and discovered no significant differences (Figure 6C). Then, we analysed the differences between the two groups for dust mite-related allergies, mould-related allergens, and tree and grass pollen-related allergens, as these were the most prevalent allergens between the ages of 1 and 18. Our results showed that the proportion of dust mite-related allergens was significantly higher in the polysensitized children than in the monosensitized children, particularly in preschool children (p=0.001), school-aged children (p=0.007), and adolescents (p=0.001). Similarly, the proportion of mould-related allergens was significantly higher in children with polysensitization than in children with monosensitization (Figure 6D). Although there was no significant difference in antibody concentrations to allergens between the two groups, the polysensitized children had greater levels of sIgE (Figure 6E). Tree and grass pollen-related allergens yielded similar experimental results (Figure S1). Additional details on the intrinsic differences between the monosensitization and polysensitization groups can be found in Table S3.
The Difference in the Levels of sIgE
Based on the phenomena depicted in the violin plot, we compared the levels of sIgE in monosensitized and polysensitized children. Our findings demonstrated that the high level of sIgE generated by monosensitization or polysensitization varies with age and allergen type (Figure 6F and G). For instance, polysensitization in toddlers (p=0.020) and adolescents (p=0.018) can result in higher levels of sIgE in response to allergens related to dust mite allergens. However, monosensitization can result in higher levels of sIgE in preschoolers (p=0.026). Notably, the difference in the high level of sIgE is insufficient to create a difference in sIgE concentration between children with monosensitization and polysensitization. Similarly, among mould-related allergens, polysensitization in preschool children (p=0.030) can cause higher levels of sIgE accompanied by differences in the concentration of sIgE. Detailed information on sIgE levels in the monosensitization and polysensitization groups is presented in Figure S2 and Table S4.
The Difference in the Clinical Parameters of Eosinophils and Basophils
To determine the difference in clinical parameters between monosensitized children and polysensitized children, T-IgE and the clinical parameters related to allergies in the complete blood count were further analysed, including the eosinophil percentage, eosinophil count, basophil percentage, and basophil count. The results demonstrated a significant difference in the T-IgE, eosinophil percentage, and eosinophil counts between monosensitized and polysensitized children (Table 2).
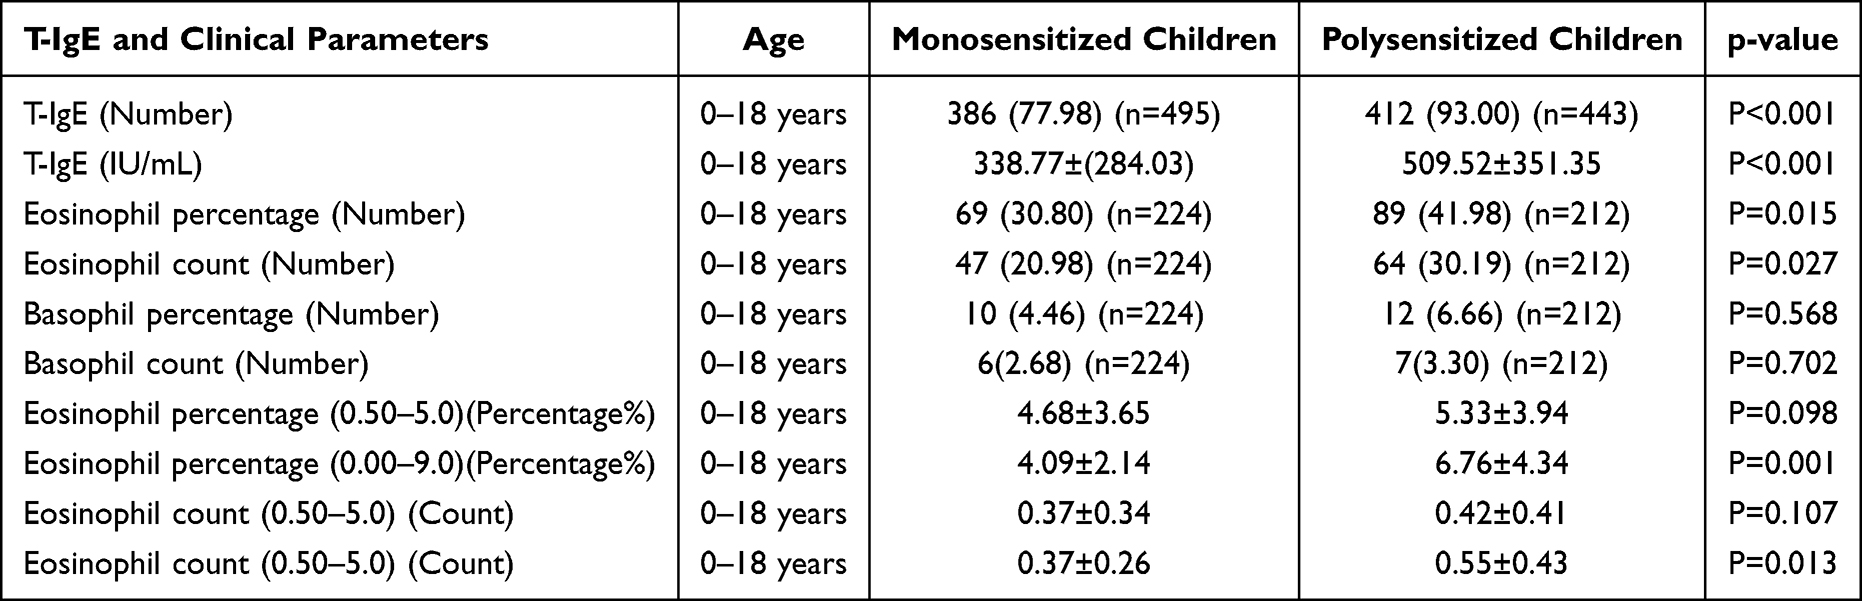 |
Table 2 Differences in T-IgE and Clinical Parameters Between Monosensitive and Multisensitive Children |
We found that polysensitized children could produce up to a 93.00% T-IgE elevation, which was significantly higher than that of monosensitized children (77.98%) (Figure 7A). This phenomenon was also accompanied by an increase in T-IgE levels, which was significantly different between the two groups (Figure 7B). We further confirmed that polysensitization can produce an increase in eosinophil percentage and eosinophil count using 224 and 212 complete blood counts results from the polysensitization and monosensitization groups, respectively (Figure 7A). Remarkably, only the group with a large range of reference values demonstrated this phenomenon (Figure 7C and D). Thus, we hypothesised that the extensive range of reference values accentuates the distinction between polysensitization and monosensitization.
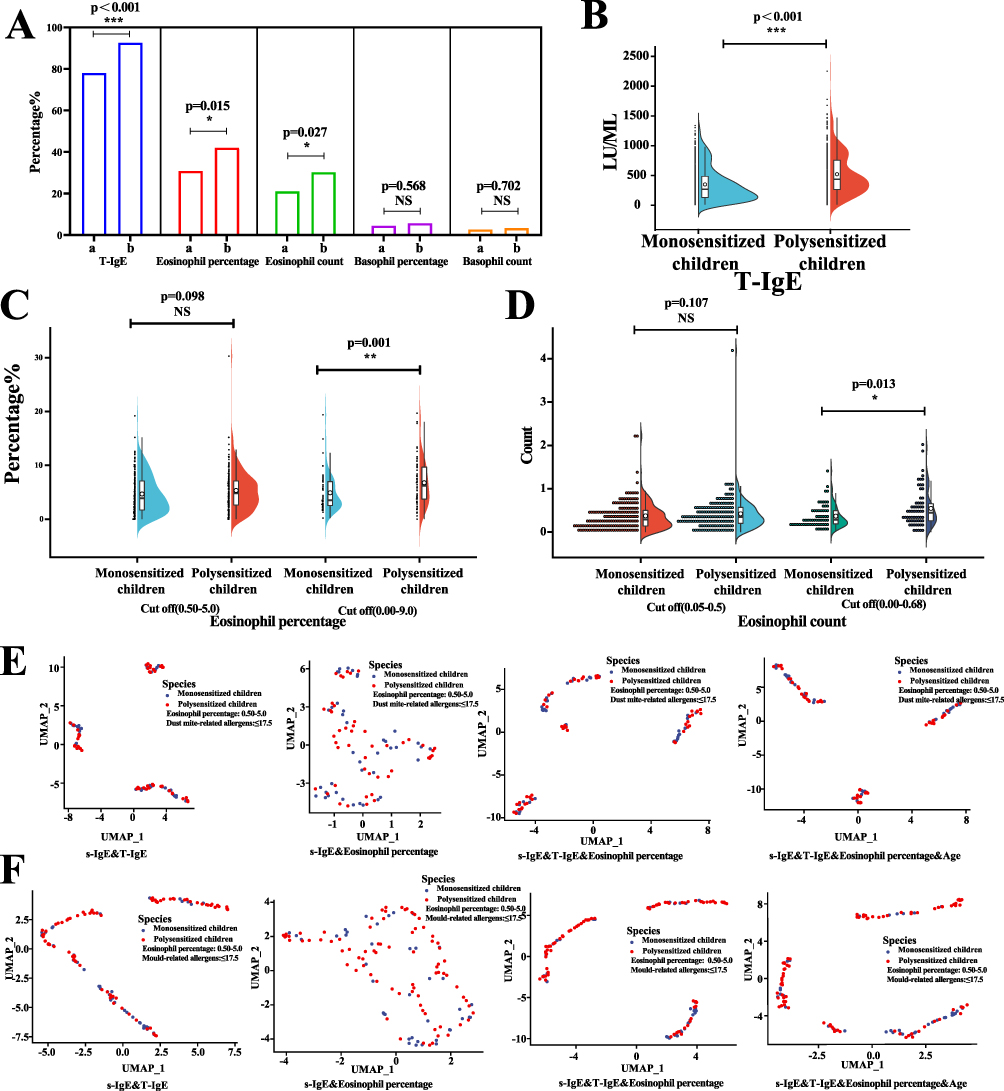 |
Figure 7 Differences in T-IgE and clinical parameters in monosensitized and polysensitized children. (A) Differences in the percentage of positive numbers for T-IgE and clinical parameters in monosensitized and polysensitized children. (a): Monosensitized children; (b): Polysensitized children. (B) Differences in T-IgE serum antibodies in monosensitized and polysensitized children (n=938). (C) Differential analysis of the number of eosinophils percentage in monosensitized and polysensitized children. (D) Differential analysis of the number of eosinophils count in monosensitized and polysensitized children. (E) Dimensional reduction analysis of monosensitized and polysensitized children at low levels of dust mite-related allergens. (F) Dimensional reduction analysis of monosensitized and polysensitized children at low levels of mould-related allergens. Significance *p < 0.05, **p < 0.01, and ***p < 0.001. Abbreviation: NS, no statistical difference. |
Finally, to explore whether the available clinical parameters could distinguish between monosensitized and polysensitized children, we used the UMAP package16 in R for dimensionality reduction analysis and the ggplot package17 for visualisation. The allergens from the dust mite-related allergies with the highest proportion, mould-related allergens, were chosen for further study. By sequentially adding the T-IgE, eosinophil percentage, eosinophil number and age, we found that the available clinical information was not sufficient to distinguish between monosensitization and polysensitization (Figure 7E and F, Figure S3).
Discussion
A growing number of studies indicate that the prevalence of allergy illnesses in children is continuously increasing and is closely associated with allergen-specific IgE sensitization. IgE sensitization should be considered differently in monosensitized and polysensitized individuals.18 Our findings revealed the characteristics of allergens in monosensitized children and a combination of allergens in polysensitized children. The results demonstrated that dust mite-related allergens, mould-related allergens, and tree and grass pollen-related allergens are the primary IgE sensitizers of allergy diseases, with polysensitized children being more susceptible than monosensitized children. Additionally, a systematic comparison was made between monosensitized and polysensitized children, including intrinsic allergen characteristics and extrinsic clinical parameters. Polysensitization can result in higher sIgE, T-IgE and eosinophil levels, but this difference is not enough to distinguish them from children with monosensitization. Nonetheless, the precise mechanisms that lead to children suffering from allergy diseases and eventual monosensitization or polysensitization remain unclear.
The pattern of IgE sensitization in monosensitized children is different for children of different ages, and the patterns identified for tree and grass pollen-related allergens were particularly interesting. At present, over 150 pollens have been shown to produce allergic sensitization and are a common cause of seasonal allergic rhinitis and seasonal conjunctivitis.19,20 Recent studies have shown a strong association between pollen sensitisation and thunderstorm asthma, which affects large numbers of people and can be fatal, emphasising the seriousness of pollen sensitisation.21,22 The distribution of allergic pollen has obvious regional characteristics, which are the result of natural flora patterns and human landscaping. The global distribution of allergic pollen is still unclear.23 Our findings indicate that tree and pollen-related allergens exhibit a near-linear increase with age in monosensitized children and the same proportion of polysensitized children as dust mite allergens, indicating that they pose a significant threat to allergic disease.
Polysensitization is prevalent and difficult to differentiate in allergic disorders. Monosensitization means that some atopic children are allergic to only one allergen, whereas sensitisation to more than one allergen is known as polysensitization. A growing number of studies show that polysensitized children exhibit more severe atopic disease and even clinical symptoms than monosensitized children.24,25 Choosing the appropriate allergen-specific immunotherapy (AIT) regimen for patients with polysensitization is currently challenging for clinicians.26 In this study, polysensitization was shown to be of equal or even greater importance than monosensitization, as the study did not demonstrate the Weifang spring prevalence of French sycamore. The exact causes of polysensitization are still a mystery. Consequently, to paint a clear picture of the current state of polysensitization observed in clinical practice, our study offers the combination of allergens in polysensitization. In addition, we have observed that it is difficult to differentiate between polysensitization and monosensitization using conventional clinical measures such as T-IgE and eosinophils; expensive and numerous allergen tests are necessary to make this distinction. Therefore, quick and low-cost tests for polysensitization detection are critically needed.
There were some drawbacks in this study. First, it is possible that the tree and pollen-related allergen profiles and polysensitization levels have been underestimated. This is because the test kits for commercial allergens did not contain French sycamore, which is a typical Weifang spring allergen in our clinics. Second, the mechanisms that underlie polysensitization were not investigated in our study; this will be the primary focus of future research. Finally, a wider reference range of eosinophils demonstrated greater polysensitization positivity. Nevertheless, the fundamental reasons underlying this finding have not been investigated in detail.
In conclusion, we provide a basic overview of allergens in monosensitized and polysensitized children. In addition, we compared the intrinsic sIgE profile and clinical parameters such as the T-IgE, eosinophil percentage, eosinophil count, basophil percentage and basophil count in monosensitized and polysensitized children. These findings provide new insight into the management of allergic diseases, particularly from the standpoint of polysensitization.
Ethics Approval and Consent
This study conforms to the principles of Helsinki Declaration and was approved by the Ethics Committee of Weifang People’s Hospital (KYLL2021120). Information and examination results for subjects in this study were obtained from computerised medical records of the Weifang People’s Hospital. Subjects and their primary caregivers were aware of and volunteered for these health exams. Therefore, the declaration of informed consent was not required by the ethics committee. Data confidentiality was guaranteed.
Author Contributions
All authors made a significant contribution to the work reported, whether that is in the conception, study design, execution, acquisition of data, analysis and interpretation, or in all these areas; took part in drafting, revising or critically reviewing the article; gave final approval of the version to be published; have agreed on the journal to which the article has been submitted; and agree to be accountable for all aspects of the work.
Funding
This study was supported by the National Natural Science Foundation, China (82171790), Weifang Medical University Affiliated Hospital's Medical Research Cultivation Fund Program, Weifang, China (2021wyfyzzjj08), and Science and Technology Development Program, Weifang, China (2020YX013, WFWSJK-2021-004, WFWSJK-2021-225).
Disclosure
The authors declare that the research was conducted in the absence of any commercial or financial relationships that could be construed as a potential conflict of interest.
References
1. Haanpää L, Af Ursin P, Nermes M, et al. Association of allergic diseases with children’s life satisfaction: population-based study in Finland. BMJ Open. 2018;8(3):e019281. doi:10.1136/bmjopen-2017-019281
2. Kuo HC, Chang LS, Tsai ZY, et al. Allergic diseases do not impair the cognitive development of children but do damage the mental health of their caregivers. Sci Rep. 2020;10(1):13854. doi:10.1038/s41598-020-70825-1
3. Kansen HM, Lebbink MA, Mul J, et al. Risk factors for atopic diseases and recurrent respiratory tract infections in children. Pediatr Pulmonol. 2020;55(11):3168–3179. doi:10.1002/ppul.25042
4. Liu X, Wang X, Zhang X, et al. Allergic diseases influence symptom severity and T lymphocyte subgroups of children with tic disorders. J Investig Med. 2021;69(8):1453–1457. doi:10.1136/jim-2021-001788
5. Li DJ, Tsai CS, Hsiao RC, et al. Associations between allergic and autoimmune diseases with autism spectrum disorder and attention-deficit/hyperactivity disorder within families: a Population-Based Cohort Study. Int J Environ Res Public Health. 2022;19(8):4503. doi:10.3390/ijerph19084503
6. Eljaszewicz A, Ruchti F, Radzikowska U, et al. Trained immunity and tolerance in innate lymphoid cells, monocytes, and dendritic cells during allergen-specific immunotherapy. J Allergy Clin Immunol. 2021;147(5):1865–1877. doi:10.1016/j.jaci.2020.08.042
7. Eckl-Dorna J, Villazala-Merino S, Campion NJ, et al. Tracing IgE-producing cells in allergic patients. Cells. 2019;8(9):994. doi:10.3390/cells8090994
8. Shamji MH, Valenta R, Jardetzky T, et al. The role of allergen-specific IgE, IgG and IgA in allergic disease. Allergy. 2021;76(12):3627–3641. doi:10.1111/all.14908
9. Li F, Wang X, Shen S, et al. Risk factors associated with comorbid asthma in patients with chronic rhinosinusitis with nasal polyps: a cross-sectional study. BMC Pulm Med. 2022;22(1):338. doi:10.1186/s12890-022-02138-0
10. Oppenheimer J, Hoyte FCL, Phipatanakul W, et al. Allergic and eosinophilic asthma in the era of biomarkers and biologics: similarities, differences and misconceptions. Ann Allergy Asthma Immunol. 2022;129(2):169–180. doi:10.1016/j.anai.2022.02.021
11. Letrán A, García I, Espinazo-Romeu M, et al. Cut-off value of D. pteronyssinus specific IgE in double negative patients Der p 1 and Der p 2 and its clinical repercussion. Sci Rep. 2021;11(1):23585. doi:10.1038/s41598-021-03005-4
12. Ying X, Qi X, Yin Y, et al. Allergens sensitization among children with allergic diseases in Shanghai, China: age and sex difference. Respir Res. 2022;23(1):95. doi:10.1186/s12931-022-02008-7
13. Paller AS, Spergel JM, Mina-Osorio P, et al. The atopic march and atopic multimorbidity: many trajectories, many pathways. J Allergy Clin Immunol. 2019;143(1):46–55. doi:10.1016/j.jaci.2018.11.006
14. Conway JR, Lex A, Gehlenborg N. UpSetR: an R package for the visualization of intersecting sets and their properties. Bioinformatics. 2017;33(18):2938–2940. doi:10.1093/bioinformatics/btx364
15. Larsson J. Eulerr: area-proportional Euler and Venn diagrams with ellipses. In: R package version 6.1.1; 2021. Available from: https://cran.r-project.org/package=eulerr.
16. Mcinnes L, Healy J. UMAP: uniform manifold approximation and projection for dimension reduction. J Open Source Softw. 2018;3(29):861. doi:10.21105/joss.00861
17. Ginestet C. ggplot2: elegant graphics for data analysis. J R Stat Soc. 2011;174(1):245–246. doi:10.1111/j.1467-985X.2010.00676_9.x
18. Bousquet J, Anto JM, Akdis M, et al. Paving the way of systems biology and precision medicine in allergic diseases: the MeDALL success story: mechanisms of the development of allergy; EU FP7-CP-IP; project no: 261357; 2010–2015. Allergy. 2016;71(11):1513–1525. doi:10.1111/all.12880
19. Cabrera M, Garzón García B, Moreno Grau S, et al. Association between seasonal allergic rhinitis and air pollution, meteorological factors, and grass pollen counts in Madrid (1996 and 2009). J Investig Allergol Clin Immunol. 2019;29(5):371–377. doi:10.18176/jiaci.0368
20. Prince A, Norris MR, Bielory L. Seasonal ocular allergy and pollen counts. Curr Opin Allergy Clin Immunol. 2018;18(5):387–392. doi:10.1097/ACI.0000000000000475
21. Venkatesan P. Epidemic thunderstorm asthma. Lancet Respir Med. 2022;10(4):325–326. doi:10.1016/S2213-2600(22)00083-2
22. Harun NS, Lachapelle P, Douglass J. Thunderstorm-triggered asthma: what we know so far. J Asthma Allergy. 2019;12:101–108. doi:10.2147/JAA.S175155
23. Suanno C, Aloisi I, Fernández-González D, et al. Monitoring techniques for pollen allergy risk assessment. Environ Res. 2021;197:111109. doi:10.1016/j.envres.2021.111109
24. Wang YH, Lue KH. Association between sensitized to food allergens and childhood allergic respiratory diseases in Taiwan. J Microbiol Immunol Infect. 2020;53(5):812–820. doi:10.1016/j.jmii.2019.01.005
25. Broeks SA, Brand PL. Atopic dermatitis is associated with a fivefold increased risk of polysensitisation in children. Acta Paediatr. 2017;106(3):485–488. doi:10.1111/apa.13729
26. Kim JY, Hwang D, Jang M, et al. Clinical effectiveness of house dust mite immunotherapy in mono- versus poly-sensitised patients with allergic rhinitis: a systematic review and meta-analysis. Rhinology. 2021;59(4):352–359. doi:10.4193/Rhin20.588
 © 2023 The Author(s). This work is published and licensed by Dove Medical Press Limited. The full terms of this license are available at https://www.dovepress.com/terms.php and incorporate the Creative Commons Attribution - Non Commercial (unported, v3.0) License.
By accessing the work you hereby accept the Terms. Non-commercial uses of the work are permitted without any further permission from Dove Medical Press Limited, provided the work is properly attributed. For permission for commercial use of this work, please see paragraphs 4.2 and 5 of our Terms.
© 2023 The Author(s). This work is published and licensed by Dove Medical Press Limited. The full terms of this license are available at https://www.dovepress.com/terms.php and incorporate the Creative Commons Attribution - Non Commercial (unported, v3.0) License.
By accessing the work you hereby accept the Terms. Non-commercial uses of the work are permitted without any further permission from Dove Medical Press Limited, provided the work is properly attributed. For permission for commercial use of this work, please see paragraphs 4.2 and 5 of our Terms.