")
Back to Journals » OncoTargets and Therapy » Volume 12
AKAP12 Endogenous Transcripts Suppress The Proliferation, Migration And Invasion Of Colorectal Cancer Cells By Directly Targeting oncomiR-183-5p
Authors Hu T , Wu X , Li K, Li Y , He P, Wu Z, Fan J, Liu W, Guan M
Received 6 March 2019
Accepted for publication 15 September 2019
Published 8 October 2019 Volume 2019:12 Pages 8301—8310
DOI https://doi.org/10.2147/OTT.S207600
Checked for plagiarism Yes
Review by Single anonymous peer review
Peer reviewer comments 2
Editor who approved publication: Dr Sanjay Singh
Tingting Hu,1,* Xuan Wu,2,* Ke Li,2 Yuan Li,2 Ping He,3 Zhiyuan Wu,4 Jie Fan,5 Weiwei Liu,2,6 Ming Guan1,4
1Department of Clinical Laboratory, Huashan Hospital, Fudan University, Shanghai, People’s Republic of China; 2Central Laboratory and Department of Laboratory Medicine, Shanghai Tenth People’s Hospital, Tongji University, Shanghai, People’s Republic of China; 3Department of Nuclear Medicine, Nanjing Hospital, Nanjing Medical University, Nanjing, People’s Republic of China; 4Department of Clinical Laboratory, Huashan Hospital North, Fudan University, Shanghai, People’s Republic of China; 5Department of Pathology, Huashan Hospital, Fudan University, Shanghai, People’s Republic of China; 6Department of Laboratory Medicine, Shanghai Skin Disease Hospital, Tongji University, Shanghai, People’s Republic of China
*These authors contributed equally to this work
Correspondence: Weiwei Liu
Central Laboratory and Department of Laboratory Medicine, Shanghai Tenth People’s Hospital, Tongji University, No. 301 Middle Yanchang Road, Shanghai, People’s Republic of China
Tel/fax +86-21-6630 6905
Email [email protected]
Ming Guan
Department of Clinical Laboratory, Huashan Hospital, Fudan University, No. 12 Middle Wulumuqi Road, Shanghai, People’s Republic of China
Tel/fax +86-21-5288 8048
Email [email protected]
Purpose: Restoring lost function to suppressor gene products has captured the interest of the research community in the field of gene therapy. AKAP12, also known as Gravin/AKAP250, is a tumor suppressor gene, and its deregulation may be responsible for cancer progression. The aim of this study was to investigate whether AKAP12 mRNA has an anti-cancer function by regulating onco-miRNA expression in colorectal cancer (CRC) cells.
Methods: miRNAs targeting AKAP12 were predicted by bioinformatics analysis and further confirmed by dual-luciferase reporter assays and RT-qPCR. The altered expression of microRNA was validated in early-stage CRC tumor tissues by miRseq. Cell proliferation was measured by Cell Counting Kit-8 (CCK-8) assay. Cell invasion and migration were detected by transwell and wound healing assays, respectively. In vivo experiments were conducted to confirm the in vitro findings.
Results: Among all miRNAs, reversed correlation between AKAP12 expression and miRNA-183-5p expression was most significant. Luciferase assays revealed that AKAP12 directly targeted miR-183-5p. The miRseq data showed that miR-183 was also dysregulated at the early stage of tumor development and upregulated in late sub-stage II CRC patients (P<0.01). Mechanistic analysis both in vitro and in vivo demonstrated that anti-miR-183-5p depressed cell proliferation, migration, and invasion in CRC cells while miR-183-5p overexpression resulted in opposite effects.
Conclusion: Our findings suggested that oncomiR-183-5p promoted the proliferation, migration, and invasion of CRC cells. AKAP12 miRNA-binding elements (MREs) suppressed miRNA-183-5p activities. Any change in expression of AKAP12 thus affected miRNA-183-5p. This may be another anti-tumor mechanism in addition to protein-mediation that regulates tumor suppressor genes.
Keywords: microRNA, cell proliferation, cell migration, cell invasion, AKAP12 endogenous transcripts, colorectal cancer cells, oncomiR-183-5p
Introduction
Colorectal cancer (CRC) is responsible for nearly 10% of cancer cases worldwide in 2012 (of 746,000 cases in men and 614,000 cases in women, 10.0% and 9.2%, respectively, were CRC).1,2 The development of CRC is dependent on the progression from an adenomatous polyp to carcinoma.3,4 Tumor suppressor genes, also known as anti-oncogenes, are genes that are related to the occurrence and development of cancer. With features such as limiting cell proliferation and controlling cellular growth, in several model systems, restoring the expression of tumor suppressor genes inhibits some features of the tumor phenotype.5–8 Therefore, it is important to study anti-oncogene mechanisms and develop novel gene therapies for restoring the expression of tumor suppressor genes in tumor cells.
A kinase anchor protein 12 (AKAP12), also known as Gravin/AKAP250, is a kinase anchoring protein designated as a tumor suppressor gene in CRC. It belongs to the family of kinase anchoring proteins (AKAPs), which represent a series of functionally related molecules that have an interaction with type I or type II regulatory subunits of the cAMP-dependent protein kinase (PKA) holoenzyme. Their primary function is to maintain the signaling transduction scaffold.9–12 Our previous studies found that loss of AKAP12 mRNA expression was detected in CRC tissues, and overexpression of AKAP12 in the LoVo cell line suppressed cell growth and inhibited colony formation.13 This suggests that AKAP12 may represent a novel potential therapeutic target for CRC tumor treatment. Despite the remarkable progress in cancer therapy in the past decades, most agents being investigated are small molecules, which are designed to target specific AKAP complexes to correct pathological signaling defects.14–16 Reactivating its related suppressor pathway may be another therapeutic option to prevent uncontrolled cell growth in cancer.
In recent years, studies have shown that RNAs that act as competitive endogenous regulatory factors play an important role in gene regulation. Pseudogene transcripts, long-stranded non-stranded non-coding RNAs (lncRNAs) and even mRNA can regulate target mRNA expression through miRNAs.17 Studies have highlighted the important role played by miRNAs in the evolution of the tumor microenvironment. Most mature miRNAs are differentially expressed across cancer types; microRNA-183 is expressed at high levels in malignant tissues from liver, brain, colon and pancreas, whereas its expression is decreased in osteosarcoma.18,19 OncomiRNA exhibits its activity via inhibition of mRNAs for tumor suppressor genes, for instance, oncomiR-183 activates the Wnt/β-catenin pathway by directly inhibiting the tumor suppressors Dkk-3 and SMAD4 in prostate cancer.20 The classical mechanisms of miRNA-mediated downregulation are to regulate the target mRNA sequence directly or indirectly before translation is triggered or after translation initiation. miRNA can dynamically and transiently regulate the homeostasis of gene networks through feedback or feedforward loops.21 In light of this, we propose that AKAP12, in particular its miRNA response elements (MREs), might interact with miRNAs to perform cancer suppression.
Here we demonstrated a potential role of AKAP12 mRNA, which may be independent of its encoded function, in CRC cells. Its endogenous transcripts with a miRNA binding site physiologically changed the expression of oncomiRNA-183-5p. Upregulated AKAP12 in CRC cells resulted in the silencing of miR-183-5p, which suppressed the proliferation, migration, and invasion of CRC cells.
Materials And Methods
CRC Cell Lines And Culture Conditions
All human CRC cell lines (SW480, SW620, HCT116, SW1116, SW620 and DLD-1 LoVo) were purchased from the Cell Bank of the Chinese Academy of Sciences (Shanghai, China). Cells were cultured and stored as follows: the base medium was supplemented with 10% fetal bovine serum (Gibco, Australia) for these cell lines according to the manufacturer’s instructions. All cell lines were maintained in a humidified cell incubator at 37°C with an atmosphere of 5% CO2.
RNA Extraction And Quantitative Reverse Transcription PCR (RT-qPCR)
Total RNA and miRNA were isolated from cultured cells using an miRNeasy Mini Kit (Qiagen, Hiden, Germany) per the manufacturer’s instructions. Total RNA, containing miRNA (up to a maximum of 1 μg), was reverse transcribed to high quality cDNA with the miScript II RT Kit (Qiagen, Hiden, Germany) or PrimeScript RT Reagent kit (Takara, Otsu, Shiga, Japan) for non-coding and coding genes, respectively. RT-qPCR was performed using the miScript SYBR Green PCR kit (Qiagen, Hiden, Germany) to detect the expression of miRNAs on the Roche Lightcycler 480II Real-Time PCR system (Roche Diagnostics, Rotkreuz, Switzerland). Small RNA U6 (RNU6B) was used as the endogenous control to normalize miRNA expression. In the same way, the Kapa SYBR fast qPCR kit (Kapa, Boston, MA, USA) was used to detect the expression of coding genes, and the results were normalized to GAPDH expression. The primer sequences used in this study were purchased from Sangon Biotech (Shanghai, China). Primer sequences are shown as follows: miR-183-5p, 5′-ACACTCCAGCTGGGTATGGCACTGGTAGAA-3′’; miR-23b, 5′-ACACTCCAGCTGGGATCACATTGCCAGGG-3′; miR-338, 5′-ATCACATTGCCAGGGTCCAGCATCAGTGATT-3′; miR-33b, 5′-ACACTCCAGCTGGGGTGCATTGCTGTTG-3′; miR-431 5′- ACACTCCAGCTGGGTGTCTTGCAGGCCGT-3′; miR-16, 5′- ACACTCCAGCTGGGTAGCAGCACGTAAATA-3′; miR-15b, 5′-ACACTCCAGCTGGGTAGCAGCACATCATGG-3′; miR-424, 5′-ACACTCCAGCTGGGCAGCAGCAATTCATGT-3′; miR-195, 5′-ACACTCCAGCTGGGTAGCAGCACAGAAAT-3′; miR-103a, 5′-ACACTCCAGCTGGGAGCAGCATTGTACAGGG-3′; U6, 5′-CTCGCTTCGGCAGCACA-3′; AKAP12, 5′-GTCTCCTTCATTCGCAGGCT-3′ and 5′- CATGGCTCCTCCGCACTTCTC-3′; GAPDH, 5′-GAAGGTGAAGGTCGGAGTCA-3′ and 5′-GAAGATGGTGATGGGATTTC-3′. Each sample was run in triplicate, and fold changes were calculated using the relative quantification 2−ΔΔCT method.
Lentiviral Vector Constructs And Cell Infection
The GFP hsa-miR-183-5p lentiviral vector and negative control (NC) were ordered from Cyagen (Guangzhou, China); the inhibitor GFP hsa-miR-183-5p lentiviral vector and NC were ordered from Genechm (Shanghai, China). Either the GFP hsa-miR-183-5p lentiviral vector or NC was transfected with polybrene into SW480 cells, whereas either the inhibitor GFP hsa-miR-183-5p lentiviral vector or NC was transfected with polybrene into SW620 cells. At 96 h post-transfection, the cells were observed by GFP expression from the vectors and then selected with puromycin (1 μg/mL) for 2 weeks to construct cell lines with stable miRNA-183 overexpression or repression. The transfection efficiency was verified by RT-qPCR.
The transient transfection with miR-183-5p mimics and NC, synthesized by GenePharma (Shanghai, China), was performed in SW480 cells using Lipofectamine 2000 (Invitrogen; Thermo Fisher Scientific, CA, USA) according to the manufacturer’s protocol.
The pCMV6-NEO-AKAP12 vector13 was constructed for AKAP12 overexpression; siRNA for AKAP12 downregulation and NC were ordered from GenePharma (Shanghai, China). CRC cells were transfected with Lipofectamine 2000 reagent (Invitrogen) in Opti-MEM (Gibco) at a concentration of 100 nM according to the manufacturer’s instructions. Following transfection for 48 h, RNA was isolated and submitted to RT-qPCR and Western blotting.
Bioinformatics Analysis
miRNAs targeting AKAP12 were predicted using miRBase (http://www.mirbase.org), miRanda (http://www.microrna.org) and TargetScan/TargetScans (http://www.targetscan.org) databases.
miRNA expression of CRC tumours for a total of 137 patients with stage II CRC were compared by analysing miRNAseq data from the TCGA database (http://tcga-data.nci.nih.gov/tcga/). Sample counts were normalized using the edgeR bioconductor package according to the library size.
Dual-Luciferase Reporter Assay
The fragment of the AKAP12 3′-UTR containing the wild type or mutant MREs of miR-183-5p was cloned into XhoI/NotI sites of psiCHECK-2 vector (Promega, Madison, WI, USA) to generate the psiCHECK-2-AKAP12 3′-UTR vectors. HEK293T cells were cotransfected with the recombinant plasmids and miR-183-5p mimics or the NC using Lipofectamine 2000 (Invitrogen). Cells were collected after 48 h transfection. Luciferase activity was measured using the Dual-Luciferase system (Promega). Luciferase data are presented as firefly luciferase activity normalized to Renilla luciferase.
Western Blotting
Protein was prepared in Cell Lysis Buffer (Beyotime, China), and the protein concentration was measured using a BCA Protein Reagent Kit (Beyotime, China). A total of 30–50 μg of protein from each sample was separated by 6% sodium dodecyl sulfate-polyacrylamide gel electrophoresis (SDS-PAGE) gels and then transferred to a polyvinylidene fluoride (PVDF) membrane (Millipore, Temecula, CA, USA). The membranes were incubated with either AKAP12 (1:2,000; Abcam, CA, USA) or GAPDH (1:5,000; Bioworld, MN, USA) overnight at 4°C. Subsequently, the secondary horseradish peroxidase-conjugated anti-mouse IgG (1:20,000; Bioworld, MN, USA) was applied at room temperature. After washing with TBST, proteins were visualized using ECL Plus Western Blotting detection reagent (Millipore) and detected on membranes by image analysis using Fuji Image Quant software (Fuji Film Las-3000, Kanagawa, Japan).
Cell Proliferation Assay
For the cell proliferation assay, all cell lines were seeded into 96-well plates (5,000 cells per well). The numbers of viable cells were counted using Cell Counting Kit-8 reagents (Dojindo Laboratories, Kyushu Island, Japan), following the instructions. The relative viable cell numbers were represented by the absorbance optical density at 450 nm, measured using a microplate reader (Multiscan Go, Thermo Fisher Scientific).
Transwell And Wound Healing Assays
Cell invasion ability was measured using Transwell chambers (8 μm pore size, Corning, MA, USA). About 5×10⁴ SW480 or SW620 cells were plated in the serum-free L-15 medium in the upper chambers of the apparatus (Corning) with Matrigel-coated membranes. The lower chambers were filled with complete L-15 medium, supplemented with 10% FBS. After 48 or 72 h of incubation, the upper chambers that the cells did not traverse were removed and washed. After fixation in ethanol and staining with 0.1% crystal violet (Sigma-Aldrich), the cells that had invaded from the top chamber were imaged and counted under the microscope. Cell migration was measured by a wound healing assay. Cells were cultured to 100% confluence in the 24-well plates and a scraped area was created using a 10-µL pipette tip. Wound closure images were captured in the same field at 0 and 48 h after culturing in serum-free medium. Cell healing was calculated by measuring the shaded area under magnification.
In Vivo Experiments
Four-week-old male BALB/c-nu/nu mice were purchased and maintained under specific pathogen-free conditions in the Animal Center of Shanghai Tenth People’s Hospital affiliated to Tongji University, Shanghai, China. All experiments involving animals were approved by the Ethics Committee of Shanghai Tenth People’s Hospital affiliated to Tongji University (GB/T 35892–2018 Laboratory animal-Guideline for ethical review of animal welfare). For the in vivo tumor formation experiment, SW620 cells transfected with lentivirus containing antimiR-183-5p or anti-control were separately injected into the lateral subcutaneous side of the middle of the double armpit of BALB/c nude mice (n=5). Tumor size was measured 7 days after cell injection and every 3 days thereafter using calipers. The tumor volume was calculated by measuring the length and width. Subsequently, 21 days after injection, the mice were killed and the xenograft tumors were dissected and weighed.
Statistical Analysis
All statistical evaluations were carried out using GraphPad Prism 5 (GraphPad Prism, San Diego, CA, USA). All data are expressed as the mean±SD of three independent experiments. Student’s t-test was used to compare the means of two groups. P-values less than 0.05 were considered statistically significant. Co-expression network analysis was based on Spearman’s rho correlation analysis. The absolute value of rs<0.3 was regarded as “poor” correlation, values between 0.30 and 0.50 as “moderate” correlation, between 0.50 to 0.70 as “good” correlation, and value of rs>0.7 as “strong” correlation.22
Results
Identification Of Putative miRNAs Targeting AKAP12
In order to make a general assessment of putative miRNAs involved in AKAP12 regulation, we reviewed three public databases (miRBase, miRanda, and TargetScan/TargetScans) of miRNA-mRNA interactions. Bioinformatics analysis for the prediction of potential miRNAs that target AKAP12, which was based on the structural and sequential characteristics of miRNA precursors, was carried out to filter putative miRNAs targeting AKAP12. According to the scores and several filtering criteria such as the conservation score (>85), the aggregate Pct (>0.1) and the miSVR score/Phast Cons, ten miRNAs (miRNA-15b, miR-23b, miR-16, miR-195, miR-103a, miR-183-5p, miR-424, miR-338, miR-33b, and miR-431) were selected (Figure 1A).
Abnormality Of AKAP12 Expression Could Lead To The Differential Profiles Of miRNAs
The expression levels of these miRNAs were confirmed by overexpression of AKAP12 in LoVo cells using RT-qPCR. Among all miRNAs expressing the opposite to the target gene expression trend, the levels of miR-183-5p and AKAP12 mRNA were significantly correlated (P<0.001) (Figure 1B). Therefore, we selected miR-183-5p for further study.
Upregulated miR-183 Expression In Late Sub-Stage II CRC Patients
One reason for the dysregulation of AKAP12 is gene promoter methylation, which is an early event in tumorigenesis.23 Thus, to investigate whether miR-183 is also dysregulated at the early stage of tumor development, we compared miR-183 expression level in stage II CRC tumors using the latest colon adenocarcinoma (COAD) RNA-seq data set in The Cancer Genome Atlas (TCGA). Generally, stage II is an early-to-middle stage in which the tumor invasive depth is beyond the intestinal muscle layer without lymph or distant metastasis. According to the degree of invasion, stage II subdivides into IIA, IIB and IIC. Our results revealed that high miR-183 expression was associated with a subset of high-risk CRC stage II patients. The expression of miR-183 was upregulated in late sub-stage II CRC patients (P<0.01), which may indicate that miR-183 acts as an onco-miRNA in CRC (Figure 1C).
 |
Figure 1 miRNAs targeting AKAP12 were predicted by bioinformatics analysis and further confirmed by RT-qPCR and CRC tumor tissues. Notes: (A) Venn diagrams showing the overlap among miRBase, miRanda and TargetScan/TargetScans, which predicted putative miRNAs targeting AKAP12. According to the selection criteria, the top ten were then confirmed by RT-qPCR. (B) Relative expression of miRNAs after overexpression of AKAP12. RT-qPCR showed ectopic expression of miRNAs with an effect on overexpression of AKAP12. Error bars denote the S.D. of triplicates. *P<0.05, **P<0.01, ***P<0.001, Student’s t-test. (C) The relative expression of miRNA-183 in a subset of stage II CRC tissues with COAD. The box plot shows the maximum, minimum, median and two quartiles for each group. **P<0.01.Abbreviations: CRC, colorectal cancer; COAD, Colon adenocarcinoma. |
Reversed Correlation Between AKAP12 Expression And miRNA-183-5p Expression
To examine whether AKAP12 modulated the expression of miR-183-5p, we constructed overexpression vectors and siRNA-mediated gene silencing of AKAP12 in SW480 cells. We subsequently used RT-qPCR to measure the expression of miR-183-5p. We found that knockdown of AKAP12 led to a significant increase in miR-183-5p (Figure 2A), whereas overexpression of AKAP12 resulted in a significant decrease in miR-183-5p (Figure 2B).
We then carried out a dual luciferase assay to detect whether there was a direct interaction between AKAP12 and miR-183-5p. The predicted duplex formations between the AKAP12 3′-UTR and miR-183-5p showed that AKAP12 isoform1 and isoform2 3′-UTRs have three and one binding site, respectively (Figure 2D). The results with the Renilla luciferase signal were normalized to the firefly luciferase signal. It is showed that miR-183-5p decreased the reporter activity by about 45%, whereas the activity of the mutant reporter was not significantly affected in response to miR-183-5p mimic treatment (Figure 2C). These data suggested that AKAP12 3′-UTR was a direct target for miR-183-5p.
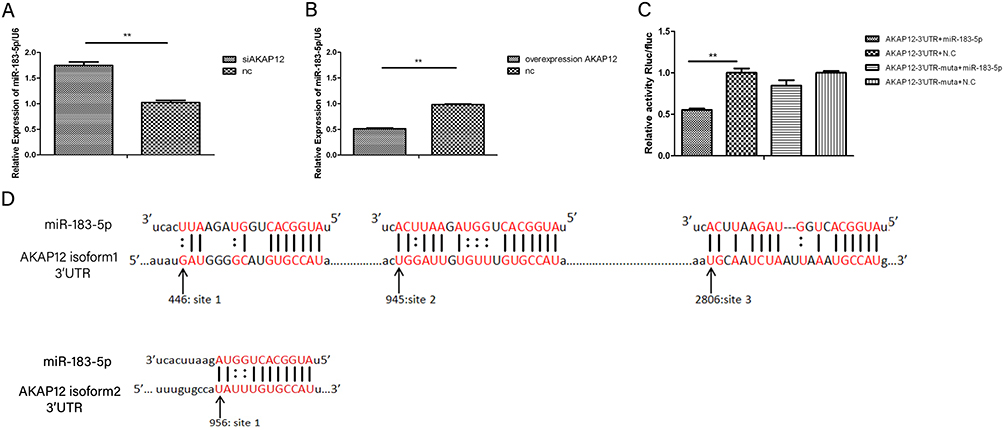 |
Figure 2 Luciferase assays revealed that AKAP12 directly targeted miR-183-5p and RT-qPCR showed a reverse correlation between AKAP12 expression and miRNA-183-5p expression. Notes: (A) miR-183-5p expression level in SW480 was measured using RT-qPCR after transfection with siAKAP12 and control. Error bars denote S.D. of triplicates. **P<0.01, Student’s t-test. (B) miR-183-5p expression level in SW480 cells was measured using RT-qPCR after transfection with AKAP12 vector and control. Error bars denote S.D. of triplicates. **P<0.01, Student’s t-test. (C) A fragment of the AKAP12 3′-UTR containing the wild type or mutant MREs of miR-183-5p was cloned into vectors. miR-183-5p mimics or negative control were transfected into HEK293T cells using Lipofectamine 2000. After 48h transfection, the cells were collected and the luciferase activity was measured. Luciferase data are presented as firefly luciferase activity normalized to Renilla luciferase. Levels of luciferase activity were compared with those of cells transfected with 3′-UTR vector with mutated sequence. Error bars denote S.D. of triplicates. **P<0.01, Student’s t-test. (D) The predicted duplex formations between the AKAP12 3′-UTR and miR-183-5p. From the schematic representation, AKAP12 isoform1 and isoform2 3′-UTRs have three and one binding site, respectively. |
miR-183-5p Downregulates AKAP12 mRNA Level But Has A Limited Effect On Protein Level
It is generally acknowledged that miRNAs exert their effects by regulation of target genes. To investigate whether miR-183-5p regulates endogenous AKAP12 expression, the CRC cell line SW480 was transfected with miR-183-5p mimics or negative control (Figure 3). Compared with the control, the mRNA levels of AKAP12 were reduced in miR-183-5p-overexpressing SW480 cells. Although AKAP12 mRNA expression decreased as miRNA-183 increased (P<0.05), no significant correlation was found in the expression level of the AKAP12 protein between these two groups.
 |
Figure 3 The mRNA and protein levels of AKAP12 in miR-183-5p-overexpressing SW480 cells. Notes: (A and B) The relative expression of miR-183-5p measured by RT-qPCR after transfection showed that the SW480 miR-183-5p group had 10 times higher expression compared with the negative control (NC) group (error bars denote the S.D. of triplicates, **P<0.01), whereas the relative expression of AKAP12 mRNA in the SW480 miR-183-5p group was lower when compared with the NC group (error bars denote the S.D. of triplicates, *P<0.05). (C) Scans of Western Blots. No significant correlation was found between the two groups. |
Biological Effects Of miR-183-5p On CRC Cell Proliferation, Migration And Invasion In Vitro
After observing differences in miRNA expression levels, we measured six of common CRC cell lines by RT-qPCR to evaluate the basal expression levels of miR-183-5p in cell lines (Figure 4). SW480 and SW620 were derived from the same CRC patient, and the latter was derived from mesenteric lymph node metastases after relapse. A comparison between these two patient-matched cell lines showed that the miR-183-5p level was three-fold higher in the SW620 cell line than that in the SW480 cell line. Moreover, all of the cell lines with high metastatic potential (HCT116, SW1116, SW620 and DLD-1 LoVo) had higher expressions of miR-183-5p compared to a low metastatic potential cell line (SW480).
To better elucidate the mechanistic role of miR-183-5p in CRC tumorigenesis, SW620 cells were infected with lentivirus expressing siRNA against miR-183-5p, which resulted in stable repression of miR-183-5p, while SW480 cells were infected with stable overexpression vectors for miR-183-5p. The relative expression levels of miR-183-5p compared with the negative control (NC) in each group were confirmed by RT-qPCR.
In both cell lines, we analyzed the effect of different miR-183-5p expression on cellular proliferation, invasion and migration. Confirmed using the CCK-8 assay, we found that SW620 cells with repression of miR-183-5p had decreased cell proliferation compared to the NC (P<0.01). Wound healing and Matrigel-coated Transwell experiments demonstrated that both the migration and invasion properties of SW620-anti-miR-183-5p cells were significantly suppressed compared with the controls. Meanwhile, increased miR-183-5p expression level contributed to increased proliferative, migratory and invasive capabilities in SW480 cells (Figure 5).
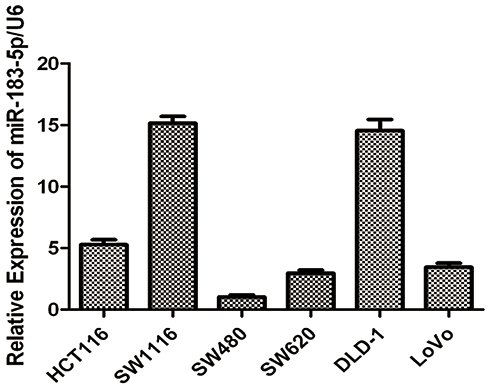 |
Figure 4 The relative expression levels of miR-183-5p in CRC cell lines. Notes: The relative expression levels of miR-183-5p in human CRC cell lines. The expression levels of miR-183-5p in human CRC cell lines were measured by RT-qPCR. Error bars denote S.D. of triplicates. |
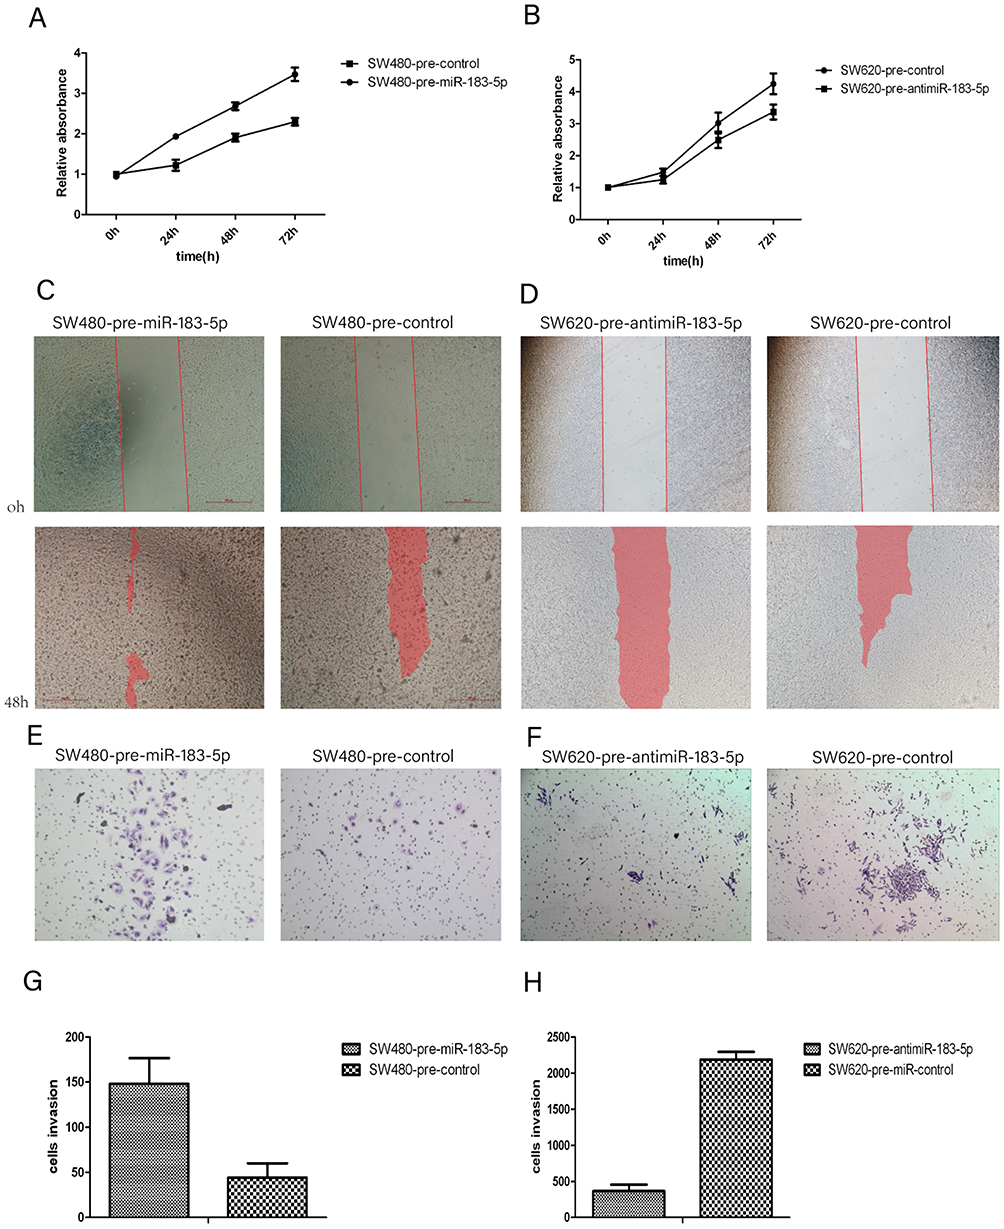 |
Figure 5 anti-miR-183-5p depressed cell proliferation, migration, and invasion in CRC cells while miR-183-5p overexpression resulted in the opposite effects. Notes: (A and B) Cell proliferation in different groups compared with the NC group were detected by the Cell Counting Kit-8(CCK-8) cell proliferation assay. (C and D) Wound healing in each group was compared with the NC group by measuring the shaded areas. (E and F) Overexpression of miR-183-5p promoted invasion of SW480, whereas repression of miR-183-5p suppressed the invasion of SW620. (G and H) Cell invasion in each group, compared with the NC group.Abbreviation: NC, negative control. |
miR-183-5p Knockdown Inhibits Colon Tumor Formation In Vivo
To ascertain the impact of miR-183-5p knockdown on tumor formation, stable SW620-pre-antimiR-183-5p cells and SW620-pre-control cells were respectively injected subcutaneously into both sides of the same nude mice. At 3 weeks, the mice were euthanized and the tumors were dissected out. The volume and the weight of the tumors from SW620-antimiR-183-5p were significantly less than those from controls (P<0.001) (Figure 6).
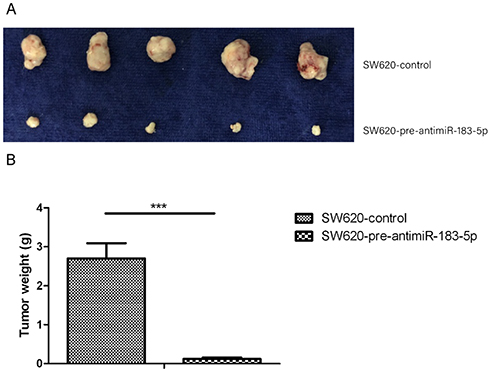 |
Figure 6 AntimiR-183-5p inhibits CRC xenograft growth. Notes: (A) 5 nude mice were injected with SW620-pre-antimiR-183-5p cells and SW620-pre-control cells into both sides, as indicated. Then tumors were removed at 3 weeks. (B) Xenograft tumors in nude mice were weighed. ***P<0.001, Student’s t-test. |
miR-183 Co-Expression Network Analysis
Synergistic regulation between miRNA-miRNA/miRNA-mRNA is critical to understanding complex post-transcriptional regulatory mechanisms. To understand the regulatory mechanisms of miR-183 in CRC, we used co-expression analysis based on Spearman correlation to identify co-expression networks associated with miR-183. Of all the genes that co-expressed in the network, according to the degree of association as good or strong correlation, three oncomiRNAs (miR-182, miR-96, miR200c) were positively correlated with miRNA-183.
Discussion
AKAP12, which belongs to the family of kinase scaffolding proteins, designated as a tumor suppressor gene which was detected in colorectal carcinoma tissues.24 In our previous work, we found that re-expression of AKAP12 inhibits progression and metastatic potential in CRC cell lines.13 Thus, activating AKAP12 tumor suppressor function may be considered an attractive approach to cancer therapy. However, a number of significant hurdles remain in restoring the expression of macromolecular proteins to a normal physiological level, so identifying its related pathogenic pathway and its upstream and downstream regulators should also be considered. On this basis, we focused on the function of AKAP12 to find the mechanism of tumor suppression in controlling signaling pathways by regulating key mediators.
Our study showed that there was a direct interaction between AKAP12 and miR-183-5p. Here, we found that miR-183-5p acted as an oncomiRNA in CRC cell lines and its overexpression or repression affected CRC cell (SW480 or SW620) proliferation, migration and invasion in vitro. In addition, TCGA data showed that high miR-183 expression was associated with a subset of high risk CRC stage II patients. The expression of miR-183 was upregulated in late sub-stage II CRC patients. All these findings suggested that miR-183-5p might be an initiating factor in the developmental process of colon cancer. In particular, AKAP12 has binding sites for this oncomiR-183-5p and regulated its expression by functioning as a miRNA sponge. Upregulated AKAP12 in CRC cells resulted in the silencing of miR-183-5p, which inhibited subcutaneous tumorigenesis in nude mice. Following the reduction of AKAP12 mRNA, oncomiR-183-5p was upregulated and its overexpression directly led to CRC cell proliferation, migration and invasion. Co-expression network analysis based on Spearman correlation revealed when miR-183 expression was disordered, and multiple genes or miRNAs were coordinated during CRC tumorigenesis.
Interestingly, although miR-183-5p targeted the AKAP12 gene, it did not primarily regulate the degradation of AKAP12 mRNA and had no effect on protein transcriptional repression; i.e., miR-183-5p did not affect the synthesis and expression of the classical AKAP-PKA complex, which may indicate that the major mechanism by which miRNA-mediated gene regulation affected target gene expression did not apply in this case.
According to our findings, in addition to its primary function in maintaining the signaling transduction scaffold, 3ʹ-UTR sites of AKAP12 mRNA had miRNA-binding elements (MREs) to miR-183-5p, and overexpression of AKAP12 mRNA resulted in a significant decrease in miR-183-5p. This suggested that there was a noncanonical interaction, by which miR-183-5p was captured the specific endogenous mRNAs as miRNA sponges, just like pseudogenes and long non-coding RNAs, to modulate oncogenic properties. Once miR-183-5p is adsorbed by the MREs of AKPA12, the expression level will decrease and further affect other co-expression networks for the purposes of cancer suppression.
Although several miRNA-targeted therapeutics, such as miRNA mimics and molecules targeted at miRNAs (antimiRs), have shown promise in preclinical development oligonucleotides from degradation, the toxicity of materials still remain problems for utilization in vivo.25 Additionally, new genome engineering technology using CRISPR/Cas9 may be an alternative strategy to inhibit oncomiRNAs, but much work is still required.26 Since Poliseno L. introduce a coding-independent function of PTEN and its pseudogene PTENP1 mRNAs regulate biologically active by competing for microRNA binding, this provides a new way to restore PTEN expression/activity.27,28 Our finding indicates that the 3′-UTR of AKAP12 can interact with its related pathways in tumor suppression, and this may be another available therapeutic option to correct disease.
Conclusion
We highlighted the anti-tumor effects of AKAP12 that may also be caused by mRNA-regulated onco-miRNA183-5p, in addition to changes in the protein itself. The AKAP12 3′-UTR as a viable target for therapeutic intervention could be a valuable prognostic marker or therapeutic agent, especially in CRC patients.
Acknowledgments
This work was supported by grants from the National Natural Science Foundation of China (Grant no. 81572061), the Outstanding Academic Leaders Plan of Shanghai (Grant no. 2018BR07) and the Program for Young Medical Technicians (Clinical Examination) in Shanghai (Grant no. 201605). The funding agencies had no role in the study design, data collection or preparation of the manuscript.
Author Contributions
All authors contributed to data analysis, drafting or revising the article, gave final approval of the version to be published, and agree to be accountable for all aspects of the work.
Disclosure
The authors report no conflicts of interest in this work.
References
1. Schreuders EH, Ruco A, Rabeneck L, et al. Colorectal cancer screening: a global overview of existing programmes. Gut. 2015;64:1637–1649. doi:10.1136/gutjnl-2014-309086
2. Globocan. Estimated Cancer Incidence, Mortality and Prevalence Worldwide in 2012. Available from: http://globocan.iarc.fr/Default.aspx.
3. Obuch JC, Ahnen DJ. Colorectal cancer: genetics is changing everthing. Gastroenterol Clin North Am. 2016;45:459–476. doi:10.1016/j.gtc.2016.04.005
4. Marnol L, Sanchez-de-Diego C, Pradilla Dieste A, et al. Colorectal carcinoma: a general overview and future perspectives in colorectal cancer. Int J Mol Sci. 2017;18:E197. doi:10.3390/ijms18010197
5. Morris LG, Chan TA. Therapeutic targeting of tumor suppressor genes. Cancer. 2015;121:1357–1368. doi:10.1002/cncr.29140
6. Llinas-Arias P, Esteller M. Epigenetic inactivation of tumour suppressor coding and non-coding genes in human cancer: an update. Open Biol. 2017;7:170152. doi:10.1098/rsob.170152
7. Liu Y, Hu X, Han C, et al. Targeting tumor suppressor genes for cancer therapy. Bioessays. 2015;37:1277–1286. doi:10.1002/bies.201500093
8. Carethers JM, Jung BH. Genetics and genetic biomarkers in sporadic colorectal cancer. Gastroenterology. 2015;149:1177–1190. doi:10.1053/j.gastro.2015.06.047
9. Gelman IH. AKAP12. Cancer Metastasis Rev. 2012;31:493–500. doi:10.1007/s10555-012-9360-1
10. Gelman IH. Emerging roles for SSeCKs/Gravin/AKAP12 in the control of cell proligeration, cancer malignancy, and barriergenesis. Gene Cancer. 2010;1:1147–1156. doi:10.1177/1947601910392984
11. Goeppert B, Schmezer P, Dutruel C, et al. Down-regulation of tumor suppressor a kinase anchor protein 12 in human hepatocarcinogenesis by epigenetic mechanisms. Hepatology. 2010;52:2023–2033. doi:10.1002/hep.23939
12. Edwards AS, Scott JD. A-kinase anchoring proteins: protein kinase A and beyond. Curr Opin Cell Biol. 2000;12:217–221. doi:10.1016/s0955-0674(99)00085-x
13. Liu W, Guan M, Hu T, Gu X, Lu Y, Agoulnik I. Re-expression of AKAP12 inhibits progression and metastasis potential of colorectal carcinoma in vivo and in vitro. PLoS One. 2011;6:e24015. doi:10.1371/journal.pone.0024015
14. Esseltine JL, Scott JD. AKAP signaling complexes: pointing towards the next generation of therapeutic targets? Trends Pharmacol Sci. 2013;34:648–655. doi:10.1016/j.tips.2013.10.005
15. Calejo AI, Tasken K. Targeting protein-protein interactions in complexes organized by A kinase anchoring proteins. Front Pharmacol. 2015;8:192.
16. Wild AR, Dell’Acqua ML. Potential for therapeutic targeting of AKAP signaling complexes in nervous system disorders. Pharmacol Ther. 2018;185:99–121. doi:10.1016/j.pharmthera.2017.12.004
17. Soengas MS, Hernando E. TYRP1 mRNA goes fishing for miRNAs in melanoma. Nat Cell Biol. 2017;31:1311–1312. doi:10.1038/ncb3637
18. Lu J, Getz G, Miska EA, et al. MicroRNA expression profiles classify human cancers. Nature. 2005;435:834–838. doi:10.1038/nature03702
19. Dambal S, Shah M, Mihelich B, Nonn L. The microRNA-183 cluster: the family that plays together stays together. Nucleic Acids Res. 2015;43:7173–7188. doi:10.1093/nar/gkv703
20. Ueno K, Hirata H, Shahryari V, et al. microRNA-183 is an oncogene targeting Dkk-3 and SMAD4 in prostate cancer. Br J Cancer. 2013;108:1659–1667. doi:10.1038/bjc.2013.125
21. Acunzo M, Romano G, Wernicke D, Croce CM. MicroRNA and cancer—a brief overview. Adv Biol Regul. 2015;57:1–9. doi:10.1016/j.jbior.2014.09.013
22. Hazra A, Gogtay N. Biostatistics series module 6: correlation and liner regression. Indian J Dermatol. 2016;61:593–601. doi:10.4103/0019-5154.193662
23. Liu W, Guan M, Su B, et al. Quantitative assessment of AKAP12 promoter methylation in colorectal cancer using methylation-sensitive high resolution melting: correlation with duke’s stage. Cancer Biol Ther. 2010;9:862–871. doi:10.4161/cbt.9.11.11633
24. Zhu XQ, Hu ML, Zhang F, et al. Expression profiling based on graph-clustering approach to determine colon cancer pathway. J Cancer Res Ther. 2013;9:467–470. doi:10.4103/0973-1482.119351
25. Ling H. Non-coding RNAs: therapeutic strategies and delivery systems. Adv Exp Med Biol. 2016;937:229–237. doi:10.1007/978-3-319-42059-2_12
26. Nguyen DD, Chang S. Development of novel therapeutic agents by inhibition of oncogenic microRNAs. Int J Mol Sci. 2017;19:E65. doi:10.3390/ijms19010065
27. Poliseno L, Salmena L, Zhang J, et al. A coding-independent function of gene and pseudogene mRNAs regulates tumor biology. Nature. 2010;465:1033–1038. doi:10.1038/nature09144
28. Kotelevets L, Scott MGH, Chastre E. Targeting PTEN in colorectal cancers. Adv Exp Med Biol. 2018;1110:55–73. doi:10.1007/978-3-030-02771-1_5
 © 2019 The Author(s). This work is published and licensed by Dove Medical Press Limited. The full terms of this license are available at https://www.dovepress.com/terms.php and incorporate the Creative Commons Attribution - Non Commercial (unported, v3.0) License.
By accessing the work you hereby accept the Terms. Non-commercial uses of the work are permitted without any further permission from Dove Medical Press Limited, provided the work is properly attributed. For permission for commercial use of this work, please see paragraphs 4.2 and 5 of our Terms.
© 2019 The Author(s). This work is published and licensed by Dove Medical Press Limited. The full terms of this license are available at https://www.dovepress.com/terms.php and incorporate the Creative Commons Attribution - Non Commercial (unported, v3.0) License.
By accessing the work you hereby accept the Terms. Non-commercial uses of the work are permitted without any further permission from Dove Medical Press Limited, provided the work is properly attributed. For permission for commercial use of this work, please see paragraphs 4.2 and 5 of our Terms.