")
Back to Journals » Diabetes, Metabolic Syndrome and Obesity » Volume 12
Aging-associated impairment in metabolic compensation by subcutaneous adipose tissue promotes diet-induced fatty liver disease in mice
Authors Taketani H , Nishikawa T, Nakajima H , Kodo K, Sugimoto S, Aoi W, Horike S , Meguro-Horike M , Ishiba H , Seko Y, Umemura A, Yamaguchi K, Moriguchi M, Yasui K, Itoh Y
Received 16 May 2019
Accepted for publication 16 July 2019
Published 23 August 2019 Volume 2019:12 Pages 1473—1492
DOI https://doi.org/10.2147/DMSO.S214093
Checked for plagiarism Yes
Review by Single anonymous peer review
Peer reviewer comments 3
Editor who approved publication: Prof. Dr. Antonio Brunetti
Hiroyoshi Taketani,1,* Taichiro Nishikawa,1,* Hisakazu Nakajima,2 Kazuki Kodo,2 Satoru Sugimoto,2 Wataru Aoi,3 Shin-ichi Horike,4 Makiko Meguro-Horike,4 Hiroshi Ishiba,1 Yuya Seko,1 Atsushi Umemura,1 Kanji Yamaguchi,1 Michihisa Moriguchi,1 Kohichiroh Yasui,1 Yoshito Itoh1
1Department of Gastroenterology and Hepatology, Kyoto Prefectural University of Medicine, Kyoto, Japan; 2Department of Pediatrics, Kyoto Prefectural University of Medicine, Kyoto, Japan; 3Division of Applied Life Sciences, Graduate School of Life and Environmental Sciences, Kyoto Prefectural University, Kyoto, Japan; 4Advanced Science Research Center, Kanazawa University, Kanazawa, Japan
*These authors contributed equally to this work
Correspondence: Taichiro Nishikawa
Kyoto Prefectural University of Medicine, 465 Kajii-cho, Kawaramachidouri Hirokouji Agaru, Kamigyo-ku, Kyoto 602-8566, Japan
Tel +81 75 251 5519
Fax +81 75 251 1017
Email [email protected]
Background and aims: Nonalcoholic fatty liver disease (NAFLD) is a hepatic manifestation of metabolic syndrome, and its progression is associated with aging-associated impairment in metabolic homeostasis. Recently, energy metabolism in adipose tissue has been the subject of renewed interest, because significant energy expenditure can be induced in cells derived from white adipose tissue progenitors, in addition to brown adipose tissue (BAT). Here we evaluated whether aging-associated change in various adipose tissue depots affects the progression of NAFLD.
Methods: Six-week-old male C57BL/6NCrSlc mice were fed control chow (C) or high-fat diet (60% fat; HF) for 12 or 24 weeks (12w/C, 12w/HF, 24w/C and 24w/HF groups, respectively) or switched from C to HF diet at 18 weeks of age (24w/C/HF group) and fed for a further 24 weeks. Some 24w/HF mice received a subcutaneous transplantation of adipose progenitors (106, cells/mouse) from young donor mice. Basal energy expenditure, glucose tolerance, and liver and adipose tissue histology were then evaluated. In addition, features of senescence and the capacity of adipose progenitors to “brown” were compared in mice of various ages.
Results: 12w/HF mice demonstrated compensation in the forms of hypertrophy of interscapular classical BAT and the appearance of subcutaneous beige adipocytes, consistent with improved metabolic homeostasis. In contrast, 24w/HF and 24w/C/HF mice developed obesity, glucose intolerance, and severe NAFLD, with accelerated senescence and loss of adipose progenitors in subcutaneous fat tissues. Recruitment of adipose progenitors ameliorated these findings in 24w/HF mice.
Conclusion: Impaired metabolic compensation in adipose tissue resulted in the progression of NAFLD, which was associated with aging-related deterioration in adipose progenitors. A new approach targeting adipose tissue progenitors might represent a potential strategy for the prevention of NAFLD.
Keywords: nonalcoholic fatty liver disease, obesity, scenescence, brown adipocyte, mesenchymal stem cells, cell transplantation
Introduction
Modern lifestyles frequently involve overnutrition and lack of exercise, which has dramatically increased the size of the population with overweight or obesity,1 both of which are key factors underpinning the development of chronic metabolic diseases. The prevalence of nonalcoholic fatty liver disease (NAFLD), a hepatic manifestation of metabolic syndrome, has also increased, mainly in people who are obese,2 and it is now regarded as a principal cause of chronic liver disease.3,4 Thus, the progression of NAFLD is likely to be closely associated with a failure of metabolic homeostasis.5
Recently, there has been renewed interest in energy metabolism, with the recognition that brown adipose tissue (BAT) is responsible for substantial energy expenditure and that thermogenesis can be induced in beige adipocytes,6 which are derived from progenitors in subcutaneous fat tissue (sFAT) in adult humans.7,8 Brown adipocytes (BAs) are characterized by substantial mitochondrial content and expression of uncoupling protein 1 (UCP1), which dissipates chemical energy as heat. UCP1-expressing cells are divided into two categories: classical brown adipocytes and beige adipocytes. Classical brown adipocytes are only found in rodents, other small mammals, and human infants, and originate from a myf-5-positive muscle-like cell lineage.9 In contrast, beige adipocytes (also called “brite,” “brown-like,” or “inducible brown” adipocytes) are derived from another cell lineage within white adipose tissue, and their differentiation is induced as a compensatory mechanism to maintain energy balance in response to changes in the external environment.8 Classical BAT is not present almost in adult humans; instead, changes in thermogenesis by beige adipocytes may be significant in the pathogenesis of NAFLD, although this possibility has not been fully elucidated.
Metabolic compensation by beige adipocytes is also affected by aging in rodents and humans.10,11 Aging-associated impairment in progenitor cells, including mesenchymal stem cells (MSCs) in sFAT could impair self-renewal, proliferative ability, and subsequent differentiation into mature adipocytes.12 Therefore, we evaluated the effects of aging on beige adipocytes and the association between the effects of aging on these cells and the progression of NAFLD in mice.
Materials and methods
Animal experiments
Six-week-old male C57BL/6NCrSlc mice were obtained from Shimizu Laboratory Supplies Co., Ltd (Kyoto, Japan) and housed in a temperature-controlled room at 23 °C on a 12 h light/dark cycle, with free access to food and water. Mice were fed with control chow (C) (CRF-1 diet: carbohydrate 60.9%, protein 22.4%, fat 6.0%) or high-fat diet (HF) (HFD60: carbohydrate 19.6%, protein 18.2%, fat 60.0%, Orientalbio Co. Ltd., Tokyo, Japan) in isolation cages for 12 or 24 weeks (12w/C, 12w/HF, 24w/C and 24w/HF study groups, respectively), or switched from C to HF diet at 18 weeks of age (24w/C/HF group) for 24 weeks (Figure 1A). Food intake and body mass gain were measured once a week and mice were sacrificed at 18 or 30 weeks of age. At the end-point, mice were fasted overnight and euthanized with sodium pentobarbital (150 mg/kg, intraperitoneal), and blood was obtained by cardiac puncture. Plasma was separated by centrifugation at 4 °C and stored at −80 °C until assayed. Subcutaneous, visceral fat tissues (vFAT), and interscapular BAT, liver and femoral muscle were immediately dissected and weighed. A portion of each was frozen in liquid nitrogen and stored at −80 °C, and the remainder was fixed in 4% buffered paraformaldehyde for 24 h, and then embedded in paraffin for further analysis. Metabolic function tests, including oxygen consumption, locomotor activity, β-3 adrenergic receptor stimulation, glucose and triglyceride tolerance, and body surface temperature measurement, were performed within a week of the endpoint. Donor mice for cellular transplantation of adipose progenitors, six-week-old male C57BL/6-Tg (CAG-EGFP), were purchased from Shimizu Laboratory Supplies Co., Ltd (Kyoto, Japan). All experiments and methods were approved by the Animal Care and Use Committee of Kyoto Prefectural University of Medicine (Approval Number M25-246), and were performed in accordance with guideline and regulations set by the Animal Research: Reporting of In Vivo Experiments (ARRIVE) guidelines.
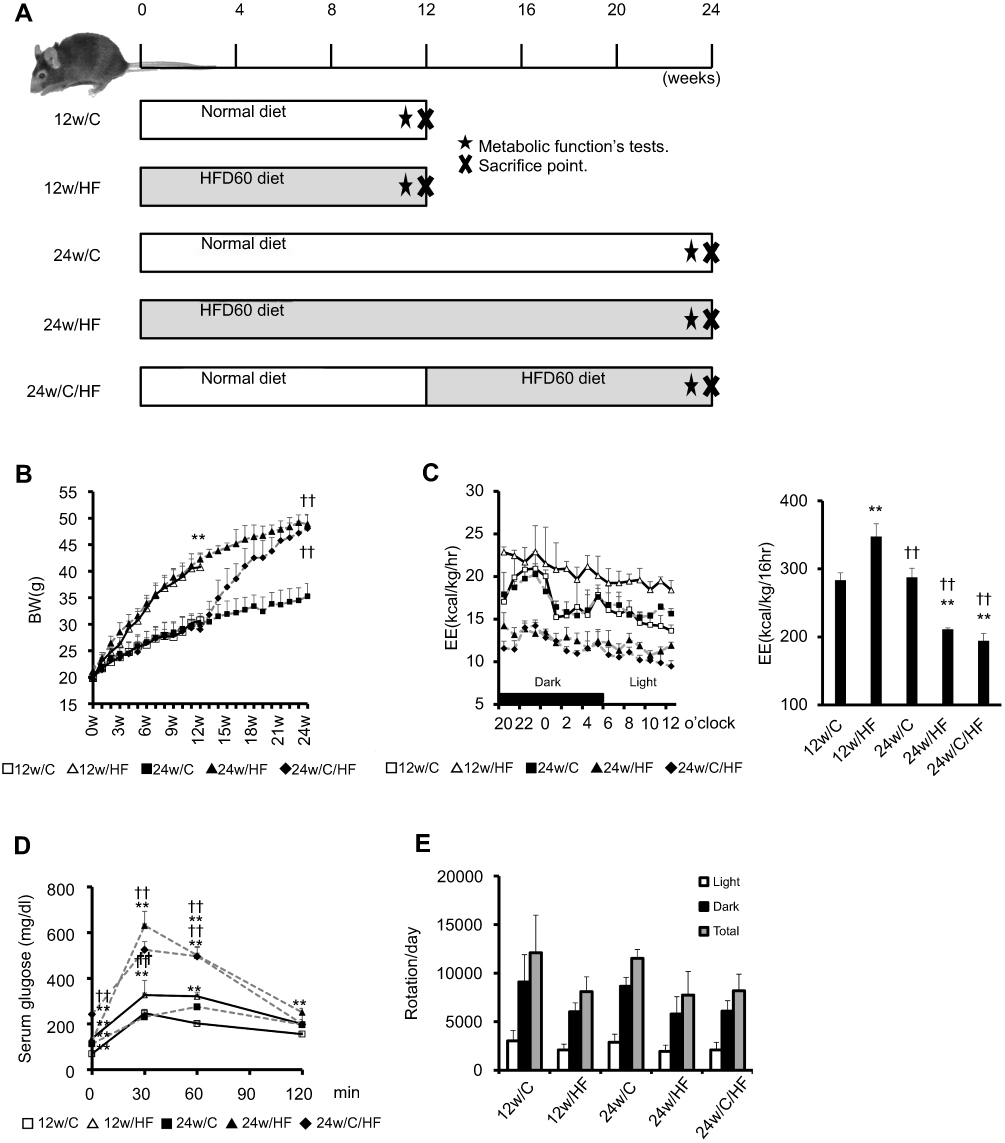 |
Figure 1 HF feeding-induced obesity is associated with an impairment of energy expenditure that is age-dependent. (A) A schema for the animal experiments. C57BL/6NCrSlc male mice were fed with a control (CRF) diet or a high-fat diet (HFD) for 12 or 24 weeks. 24w/C/HF group mice were fed for 12 weeks with the CRF diet and then switched to an HFD for 12 weeks. All mice started their feeding experiments at 6 weeks of age (each group; N=7). Metabolic function tests were performed in the final week (★; time metabolic function tests were conducted). After feeding for 12 or 24 weeks, mice were sacrificed and organs were collected (x; time of euthanasia.) (B) Body mass was measured once weekly and (C) Energy expenditure (EE; kcal/kg/h), Integrated EE for each 16 h period, (D) Glucose tolerance testing, (E) Voluntary exercise (number of rotations per day) were measured in a voluntary wheel running chamber system were measured within a week of the end-point. Values are mean ± SD. **p<0.001, vs 12w/C. ††p<0.001, vs 12w/HF. There are no significant differences between 24w/HF and 24w/C/HF groups. |
Measurement of resting energy expenditure
Mouse resting oxygen consumption was measured in an O2/CO2 flux measuring system (model MK-5000, Muromachi-Kikai, Tokyo, Japan) for 24 h at 23 °C, according to the method reported previously.13 The oxygen consumption (VO2) and carbon dioxide emission (VCO2) were normalized to body mass and the mean values for all periods were calculated. Resting energy expenditure (EE) was calculated using the abbreviated Weir equation (EE [kcal] =3.9× VO2 (ml/min) +1.1× VCO2 (ml/min)).14
Locomotor activity
The locomotor activity of each mouse was measured in a voluntary wheel running chamber system (MK-700PC, Muromachi Kikai). Briefly, each mouse was placed in an individual cage and its movement was determined by counting the revolutions of the wheel for 24 h.13
Metabolic tolerance tests
Oral glucose (OGTT) and triglyceride (OTTT) tolerance tests were performed to assess whole body glucose and lipid homeostasis, respectively. The mice received glucose (2 g/kg) or olive oil (200 µl/mouse) by oral gavage after 16 hrs’ fasting. Blood samples were taken from a tail vein before gavage and 30, 60, 120, and 240 min afterwards. After centrifugation, serum glucose and triglyceride levels were measured biochemically (Wako Fine Chemicals Industries, Ltd. Tokyo, Japan), according to the manufacturer’s protocol.
β-3 adrenergic receptor stimulation test
To evaluate BAT activity, we performed an adrenergic receptor (AdrR) stimulation test. Mice were fasted for 16 h and anesthetized (sodium pentobarbital, 30 mg/kg, intraperitoneal) before the measurement. O2 consumption was measured at baseline and after intraperitoneal injection of the selective β3-AdrR agonist CL316,243 (2 mg/kg body mass, Sigma, Tokyo, Japan), and the time-course and relative increase were calculated. Body surface temperature was also measured using a thermal imaging camera (FLIR i3, FLIR Systems, Tokyo, Japan) and analyzed with FLIR QuickReport software, as previous published.13
Histological analysis
Five-micrometer paraffin-embedded liver, sFAT, vFAT, cBAT, and femoral muscle sections were stained with hematoxylin and eosin, and examined using an Olympus BX50 Research Microscope (Olympus Corporation, Tokyo, Japan). The severity of NAFLD was evaluated according to the NAFLD activity score (NAS), including the assessment of hepatic steatosis (0: <5%, 1: 5–33%, 2: 33–66%, 3: >66%), inflammation (0: none, 1: <2, 2: 2–4, 3: >4 foci/200× field) and hepatocyte ballooning (0: none, 1: few, 2: many or prominent).15
Immunofluorescence analysis
Immunofluorescence staining was performed according to the modified method described in our previous report.16 Briefly, heat-induced antigen retrieval was performed at 95 °C for 15–20 min in citrate buffer (10 mM sodium citrate, pH 6.0), using a microwave processor (MI-77, Azumaya Corporation, Tokyo, Japan). After incubation in phosphate-buffered saline (PBS) containing 2% fetal calf serum for 15 min to block non-specific reactions, tissue sections were incubated with one or a combination of diluted primary antibodies, targeting UCP1 (ab10989, 1:1000, Abcam, Cambridge, UK), GFP (04404–26, 1:50, Nacalai Tesque, Kyoto, Japan), for 1 h at room temperature. After washing three times in PBS, the sections were incubated in diluted secondary antibodies conjugated with fluorochromogen (1:100) for 1 h at room temperature and then mounted in Vectashield (Vector Laboratories, Inc., Burlingame, CA) containing 4ʹ,6-diamidino-2-phenylindole solution. Photomicrographs of each slide were obtained using an All-In-One Fluorescence Microscope (BZ-X700; Keyence, Osaka, Japan).
Immunohistochemistry analysis
Immunohistochemistry was also performed using diluted primary antibodies, targeting UCP1 (ab10989, 1:1000, Abcam) according to the above method, except that blocking of endogenous peroxidase was performed by incubation in 0.3% hydrogen peroxide-methanol for 20 min. The immunocomplex signal was detected using the EnVision™+ system (horseradish peroxidase, rabbit, 3,3ʹ-diaminobenzidine +; Agilent Technologies Dako, Glostrup, Denmark) or ImmPRESS™ reagent (MP-7444; Vector Laboratories, Inc.). The samples were then counterstained using Carrazzi’s hematoxylin for 60 sec. Photomicrographs of each slide were obtained using an Olympus BX50 Research Microscope (Olympus Corporation, Tokyo, Japan).
β-galactosidase staining
We performed β-galactosidase staining to evaluate senescence-associated beta galactosidase activity. Twenty milligrams of tissue was fixed in 10% formaldehyde for 30 min and then stained for overnight at 37 °C using a β-Gal Staining Kit (Life Technologies Japan Ltd., Tokyo, Japan).
Quantification of liver lipids
For assessment of hepatic steatosis, lipid deposition in liver was evaluated by both histological staining and biochemical assay. First, we embedded frozen liver tissues in optimal cutting temperature compound (Sakura Finetek Japan Co., Ltd., Tokyo, Japan) and prepared 10 µm sections for use in oil red O staining. The sections were fixed in 10% formaldehyde for 30 min, washed once in 60% isopropanol, and stained with 0.5% oil red O (Sigma-Aldrich Japan, Tokyo, Japan) in propylene glycerol for 1 h at room temperature. Sections were then washed with isopropanol and mounted. Second, we extracted triglyceride (TG) from frozen liver tissue using the Bligh and Dyer method,17 and the TG content was measured using the Triglyceride E assay (Wako Fine Chemicals Industries, Ltd.), according to the manufacturer’s protocol. Liver TG content was calculated as the ratio of TG (mg) to liver tissue (mg).
Quantitative real-time PCR
Total RNA was isolated from frozen mouse tissues or cultured cells using TRIzol Reagent (Nacalai Tesque), according to the manufacturer’s instructions, except for the removal of debris and the fatty layer by centrifugation during the homogenization step. cDNA was synthesized from total RNA (1 µg) using the Super Script III First-Strand Synthesis System for RT-PCR (Life Technologies Japan Ltd.) and random hexadeoxynucleotide primers, as described previously.18 Quantitative real-time PCR (qRT-PCR) was performed using a Fast SYBR Green Master Mix (Applied Biosystems, Foster City, CA) and 200 nM of each primer in StepOnePlus™ Real-Time PCR System (Applied Biosystems). The sequences of the primers used for this study are listed in Table 1. Amplification was performed using the following protocol: initial denaturation at 95 °C for 10 min, followed by 40 cycles of 95 °C for 15 sec and 60 °C for 1 min. Glyceraldehyde 3-phosphate dehydrogenase was used as reference gene.
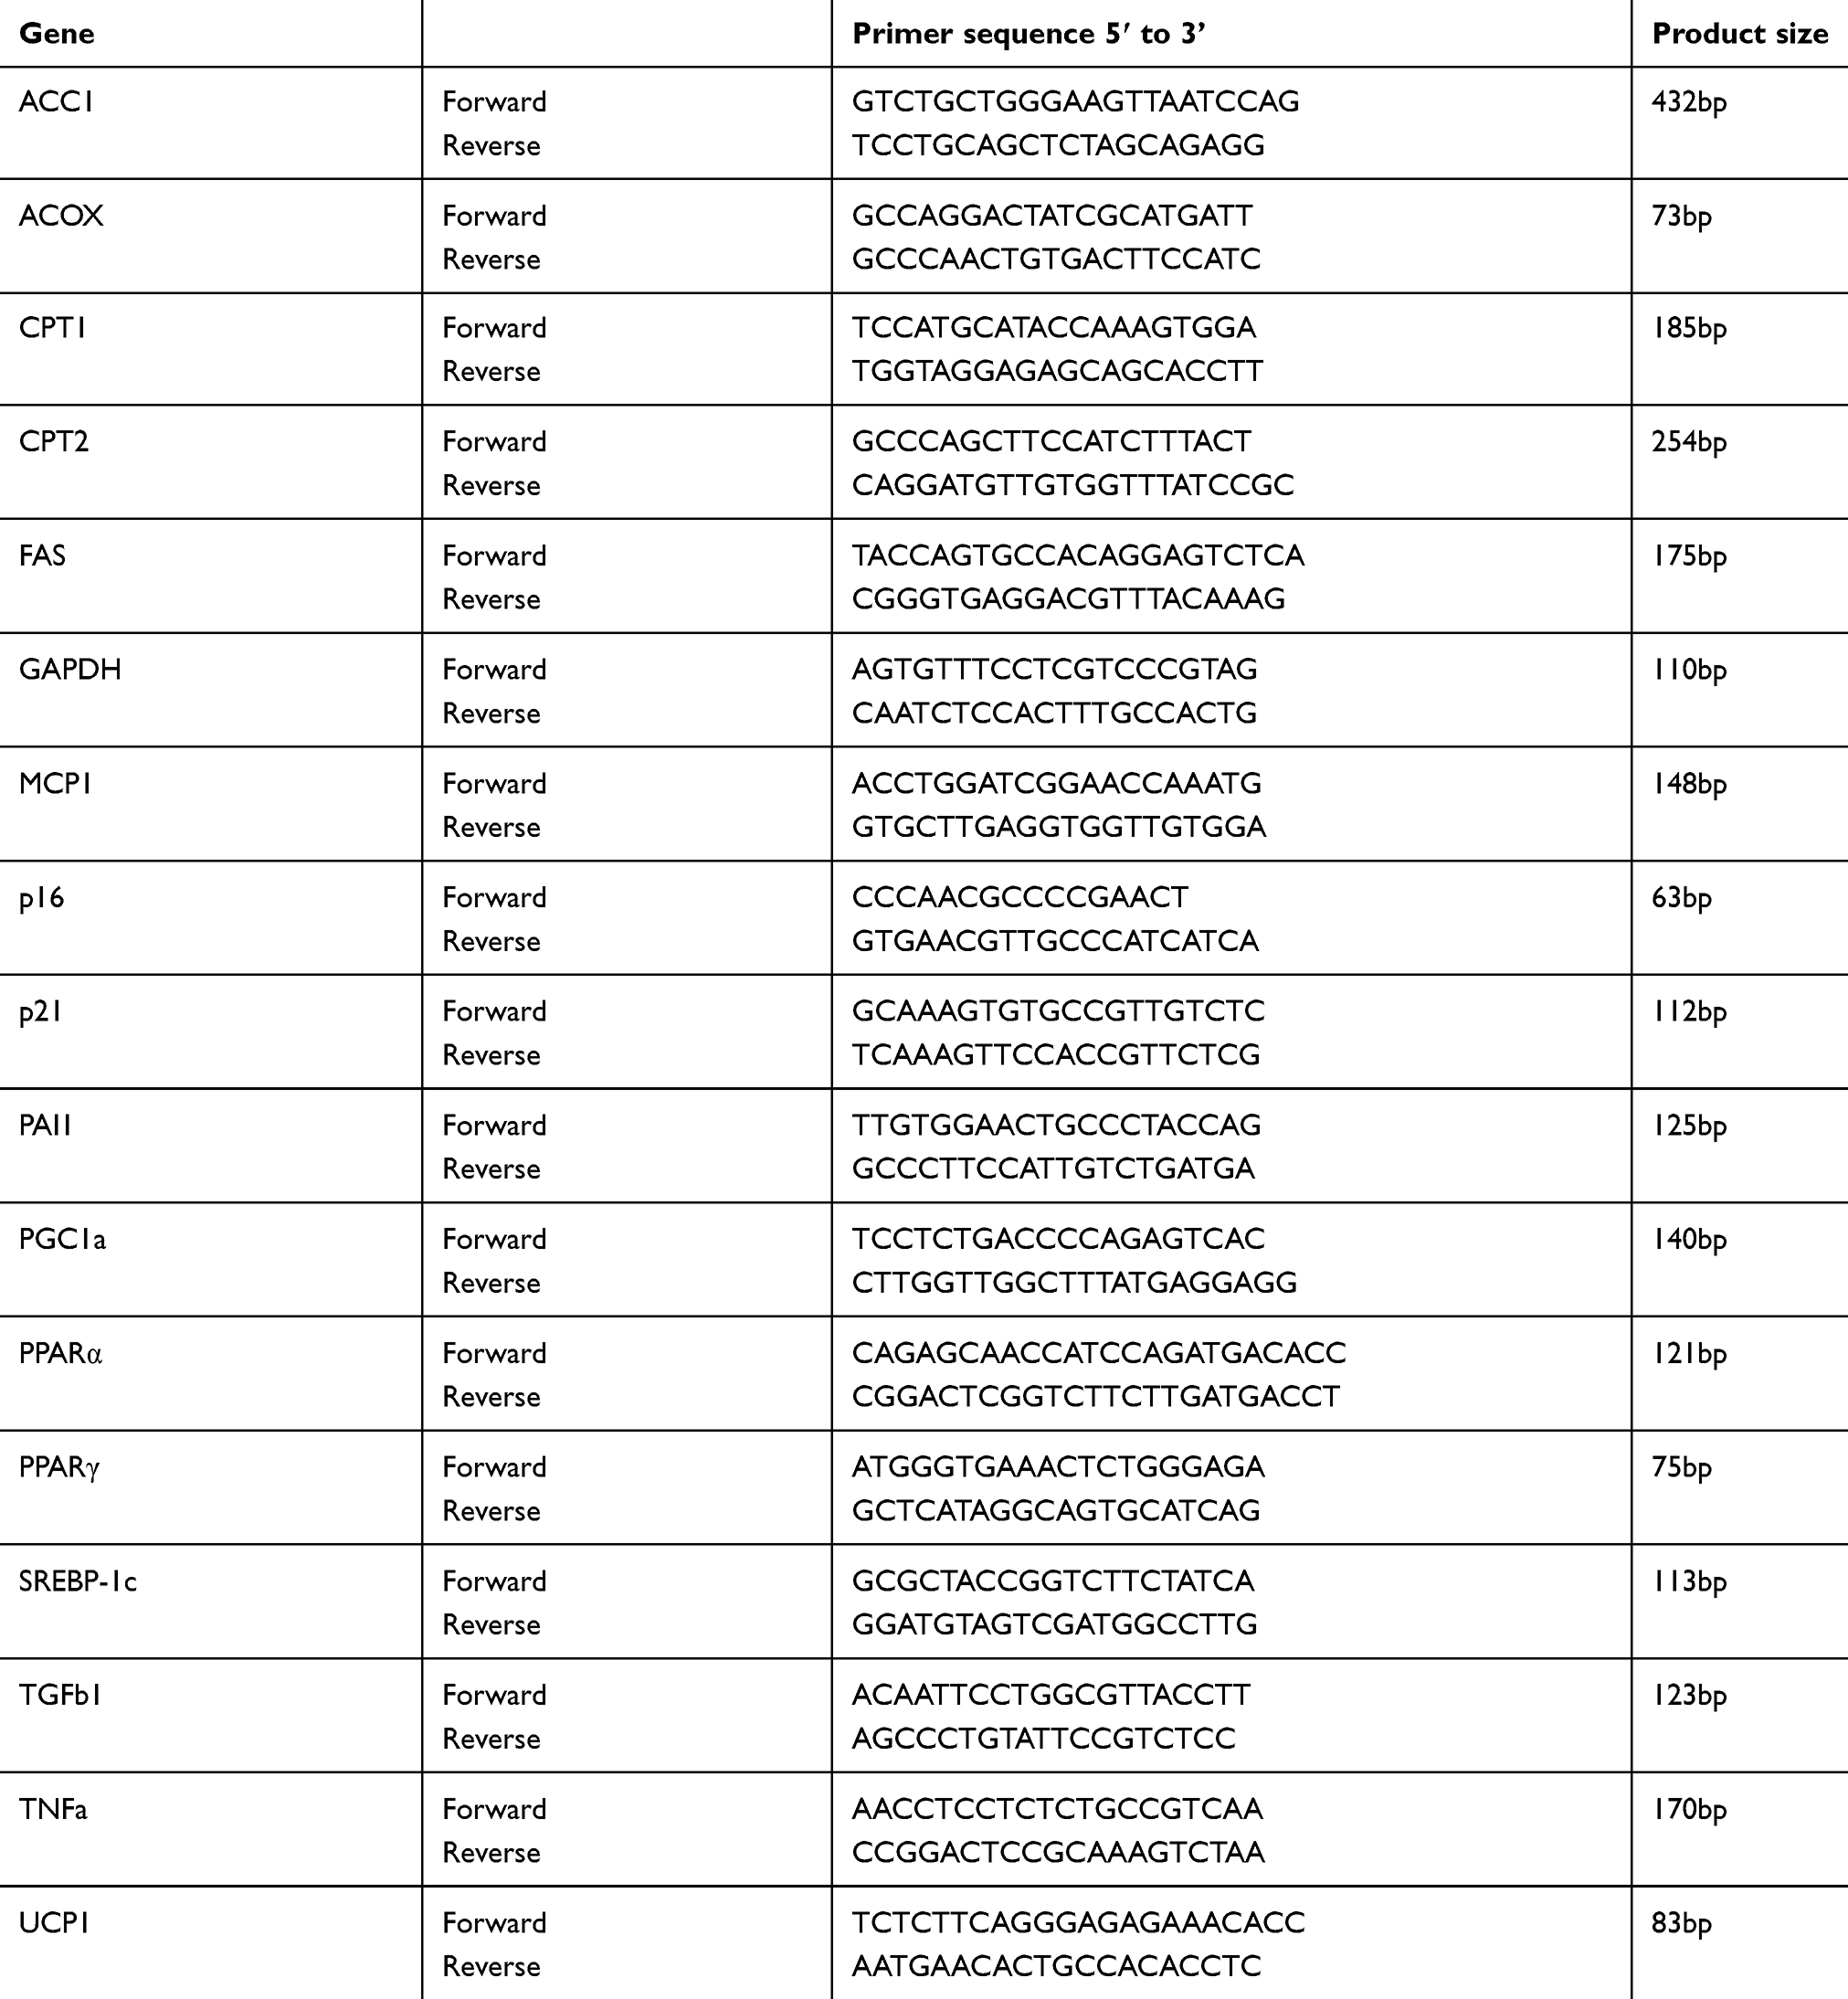 |
Table 1 List of primer sequences used in qPCR assays |
Western blot analysis
Frozen tissues were homogenized and lysed in radioimmunoprecipitation assay buffer containing 0.1% sodium dodecyl sulfate and 1% proteinase inhibitor cocktail (Nacalai Tesque) on ice. Protein concentrations were determined using a Protein Assay Bicinchoninate kit (Nacalai Tesque). Lysates were electrophoresed on Mini-PROTEAN TGX gels (Bio-Rad Laboratories, Inc., Tokyo, Japan) and then electrophoretically transferred to Immobilon-P polyvinylidene difluoride membranes (Merck Millipore, Burlington, MA). Immunoblotting was performed using specific antibodies against β-actin (A1978, 1:1000, Sigma-Aldrich, St. Louis, MO) and p21 (ab109199, 1:500, Abcam), as described previously.19
Isolation of adipose tissue-derived mesenchymal stem cells
Adipose progenitors (adipose tissue-derived mesenchymal stem cells [Ad-MSCs]) were isolated according to a previously reported method with minor modifications.20 Briefly, abdominal sFAT was obtained from three mice in each group. Minced tissues were digested in Hanks’ balanced salt solution containing 0.2% collagenase D (Roche Diagnostics K.K., Tokyo, Japan) at 37 °C for 1 h in a shaking incubator. The solution then was separated into two phases by centrifugation at 400× g. Erythrocytes were eliminated by suspending the pellet in erythrocyte lysis solution (0.16 M NH4Cl). After passing through a 40 µm mesh filter into a new tube, the cells were suspended in a Dulbecco’s modified Eagle’s medium (DMEM) containing 10% fetal bovine serum, seeded on uncoated culture plates at 106 cells/25 cm2, and maintained at 37 °C in 5% CO2. The adherent cells were cultured and harvested at 70–80% confluence. Immunophenotyping of detached cells was performed in FACSCalibur flow cytometer with CellQuest software (BD Biosciences), according to the manufacturer’s protocol.21 One hundred thousand cells were incubated with each primary antibody in the Mouse Multipotent Mesenchymal Stromal Cell Marker Antibody Panel (R&D Systems Inc., Minneapolis, MN), which included positive markers (CD29, CD44, CD106, and stem cells antigen 1 [SCA-1]) and negative markers (hematopoietic markers: CD11b and CD45). Then, the cells were stained with goat anti-rat IgG conjugated with Alexa Fluor 488 (Life Technologies Japan Ltd.) and suspended in 2% bovine serum albumin in PBS, prior to the assay. Remaining cells were stained with anti-mouse CD105 antibody conjugated with phycoerythrin (Sony Biotechnology, Inc., San Jose, CA) and CD105-positive cells were purified in a cell sorter (SH800; Sony Biotechnology, Inc.). Two or three passages were conducted to achieve a morphologically homogenous cell population, then the cells were used as Ad-MSCs for further analyses. Unstained cells were used as a negative control for each flow cytometric analysis.
Assessment of the capacity of cells to differentiate into beige adipocytes
5×10⁵ Ad-MSCs were seeded onto collagen I (BD Biosciences, Tokyo, Japan)-coated six-well tissue culture plates and cultured to 95% confluence. The cells were then differentiated into white adipocytes using a brown/white adipocyte culture kit (Product ID:MK423, Takara Bio Inc., Ootsu, Japan), according to the manufacturer’s protocol, except for the addition of 1µM pioglitazone (Takeda Pharmaceutical Company Limited., Osaka, Japan), a master regulator of adipose conversion in vitro, into the culture medium. Induction of BAs was performed by culture in maintenance medium containing 2 µM CL316,243 (Sigma-Aldrich) for the final two days as a maturation step. The efficiency of BA induction was assessed by immunostaining for UCP1 (ab10983, Abcam), mitochondrial staining using MitoTracker Green FM (Life Technologies Japan Ltd., Tokyo, Japan), and oil Red O staining. Pre-BAs also were isolated from the classical BAT of six-week-old male C57BL/6 mice, as described above, and were used as positive controls in these assays (data were shown in Figure 5B).
DNA microarray analysis
Total RNA was isolated from Ad-MSCs from three mice in each group. Cyanine-3 (Cy3)-labeled cRNA was prepared from 0.2 µg RNA using the Low Input Quick Amp Labeling Kit (Agilent Technologies, Tokyo, Japan), according to the manufacturer’s instructions, followed by RNeasy column purification (Qiagen, Valencia, CA). Samples were hybridized to SurePrint G3 Mouse GE Ver. 2.0 (G4852A, Agilent Technologies). The slides were scanned on an Agilent DNA Microarray Scanner (G2539A) using one color scan setting for 8×60,000 array slides. The scanned images were analyzed with Feature Extraction Software 11.0.1.1 (Agilent Technologies) using default parameters, to obtain background-subtracted and spatially detrended Processed Signal intensities. The raw data has been deposited in the Gene Expression Omni-bus (GEO) database, under number GSE115068 (https://www.ncbi.nlm.nih.gov/geo/query/acc.cgi?acc=GSE115068, a token for this link; ixkvmegunxobdmd).
Transplantation of Ad-MSCs
For the transplantation experiment, donor Ad-MSCs were isolated from abdominal subcutaneous adipose tissues from 6-week-old C57BL/6-Tg (CAG-EGFP) mice, as described above. Freshly harvested GFP-Ad-MSCs (106 cells suspended in 1ml of serum-free DMEM, 24w/Tx group) or vehicle (serum-free DMEM, 24w/Sh group) were injected into the subcutaneous adipose tissue of mice in the 24-week HF group when they were 26 weeks old. All mice in each group were monitored for 4 weeks and sacrificed when they were 30 weeks old. Metabolic function tests were performed in the week preceding the endpoint.
Statistical analysis
All data are shown as mean ± SD. A Student’s t-test was used to compare the values from two groups. For comparison of the values obtained with the different five groups in this study, the statistical analysis was performed in one-way analysis of variance (ANOVA) with Tukey-Kramer multiple comparison tests. Statistical significance was defined as p<0.05.
Results
Aging and hf-feeding induces obesity and metabolic dysfunction
Six-week-old male C57BL/6NCrSlc mice were allocated to five groups (Figure 1A). HF feeding induced greater increases in body and fat mass (subcutaneous and visceral) than the control diet over 12 weeks (p<0.001), and older mice, including the diet-switched group (24w/C/HF), showed more severe obesity and visceral fat accumulation (p<0.001, Figure 1B, Table 2). In younger mice, HF feeding was associated with higher basal EE normalized to body mass (p<0.05, Figure 1C). However, aging impaired this HF-induced metabolic compensation, demonstrated by lower EE and glucose intolerance in both 24w/HF and 24w/C/HF mice (p<0.001, Figure 1C, D). Interestingly, the features of obesity and metabolic dysfunction were similar in these older groups, even though the HF feeding period was different (Figure 1B). Voluntary exercise and calorie intake were also evaluated, and there were no significant differences in these parameters among the groups (Figure 1E, Table 3). These results suggest that young mice are protected from HF-induced obesity through compensatory mechanisms involving higher energy expenditure.
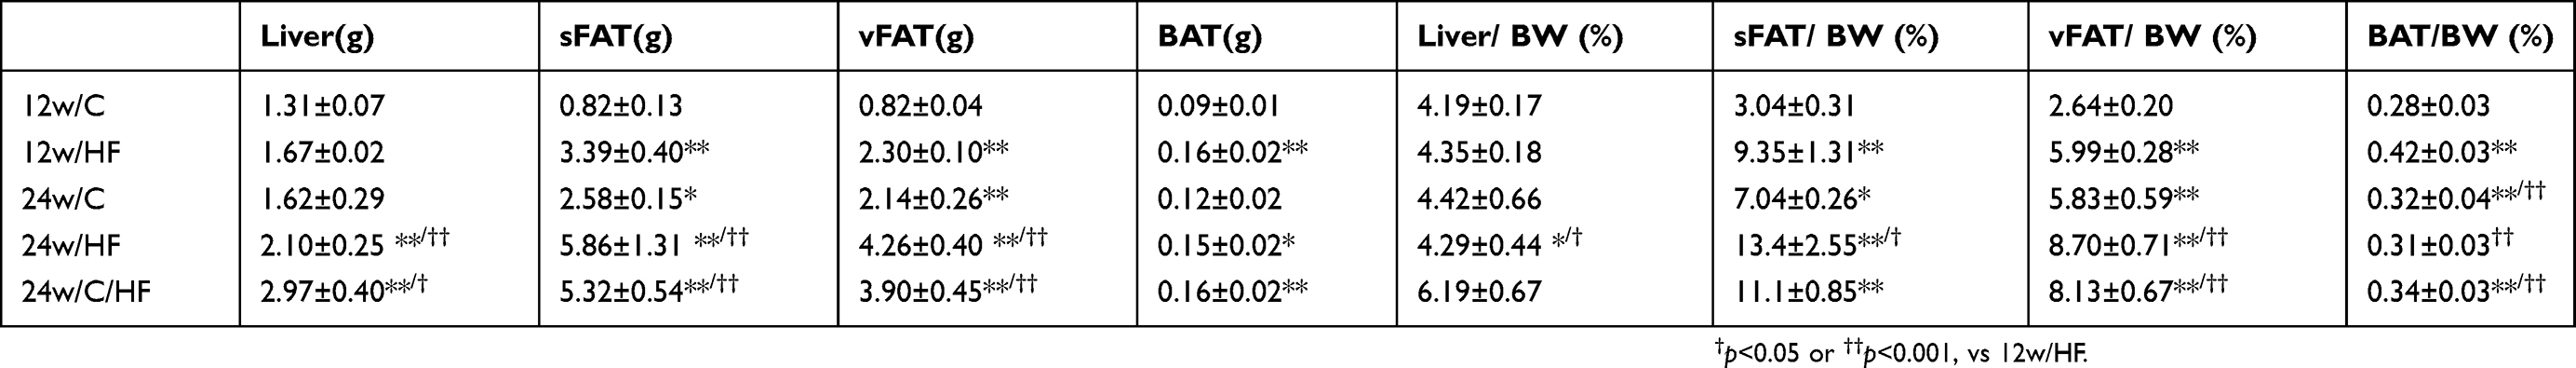 |
Table 2 Body and tissue masses for each animal |
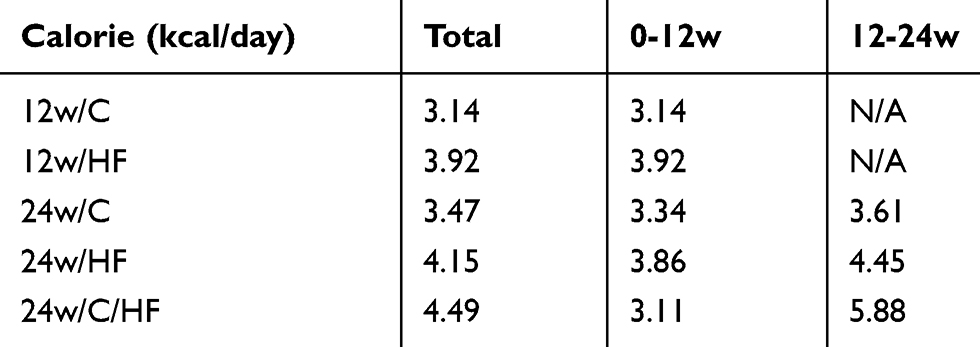 |
Table 3 Dietary calorie intake |
Diet-induced steatohepatitis worsens with age
The effect of aging on the development of NAFLD was evaluated histologically using the NAS. Mice fed a HF for 12 weeks showed mild hepatic steatosis without inflammatory infiltration and hepatocyte ballooning, regardless of the additional gain in body mass (Figure 2A). On the other hand, older mice (24w/HF and 24w/C/HF) significantly developed NAS (p<0.001, Figure 2B) and higher TG content (p<0.05, Figure 2C, D). Furthermore, qRT-PCR assays implied that the pathways of fatty acid synthesis was partially changed in older mice, because the mRNA levels of fatty acid synthase (FAS) and peroxisome proliferator-activated receptor γ (PPARγ) were higher in these animals regardless of their diet (Figure 2E). Thus, an alternative explanation was needed to explain the adverse effect of aging on NAFLD progression with regard to energy expenditure.
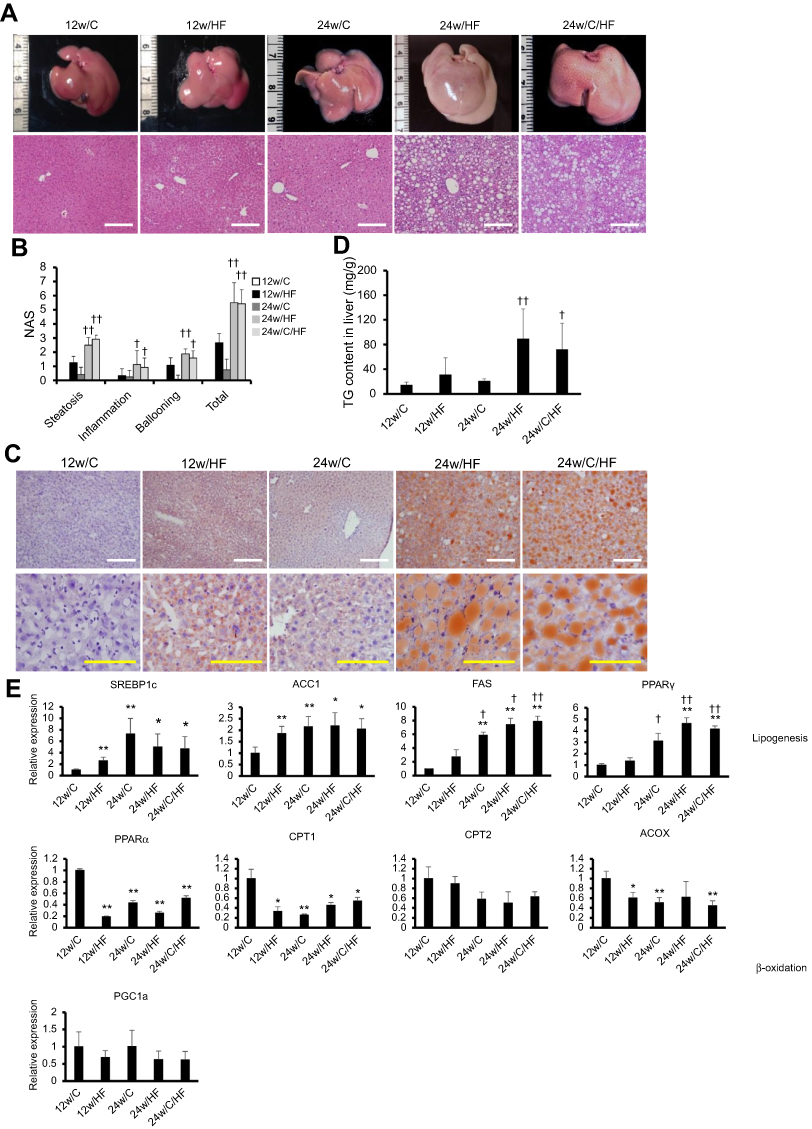 |
Figure 2 HF feeding promotes the features of steatohepatitis with age. (A) Macroscopic image and H&E staining of livers. The white scale bar represents 200 µm. (B) Measurement of NAFLD activity score (NAS), including hepatic steatosis (0: <5%, 1: 5–33%, 2: 33–66%, 3: >66%), inflammation (0: none, 1: <2, 2: 2–4, 3: >4 foci at 200×) and hepatocyte ballooning (0: none, 1: few, 2: many or prominent). (C) Oil-Red O staining of livers. White and yellow scale bars in each picture represent 200 µm and 100 µm, respectively. (D) TG content of liver tissues. (E) mRNA expression of lipogenic genes (SREBP1c, ACC1, FAS, PPARγ) and β-oxidation-associated genes (PPARα, CPT1, CPT2, PGC-1α). Values are mean ± SD. *p<0.05 or **p<0.001, vs 12w/C. †p<0.05 or ††p<0.001, vs 12w/HF. There are no significant differences between 24w/HF and 24w/C/HF groups. |
Functional compensation for adverse effects on energy homeostasis in young mice and its loss during aging
To determine the cause of the impairment in metabolic compensation shown in older mice, we evaluated adipose tissue depots in every group of mice. In young HF-fed mice, interscapular BATs were significantly enlarged (p<0.001, Table 2) and there were some cells with brown adipocytes morphology in sFAT but not vFAT (Figure 3A). The appearance of beige adipocytes in sFAT was accompanied by higher expression of UCP1, a major brown adipocyte marker (Figure 3B). In contrast, BAT showed severe fatty degeneration and there were fewer beige adipocytes in sFAT in older HF-fed mice (Figure 3A). The expression of UCP-1 in sFAT was consistent with these findings (Figure 3C). Thus, the compensatory responses of BAT and sFAT to HF feeding were lost with age. Aging-associated functional impairment of BAT was also demonstrated in assays of beta-adrenergic stimulation and thermogenesis. (Figure 3D, E)
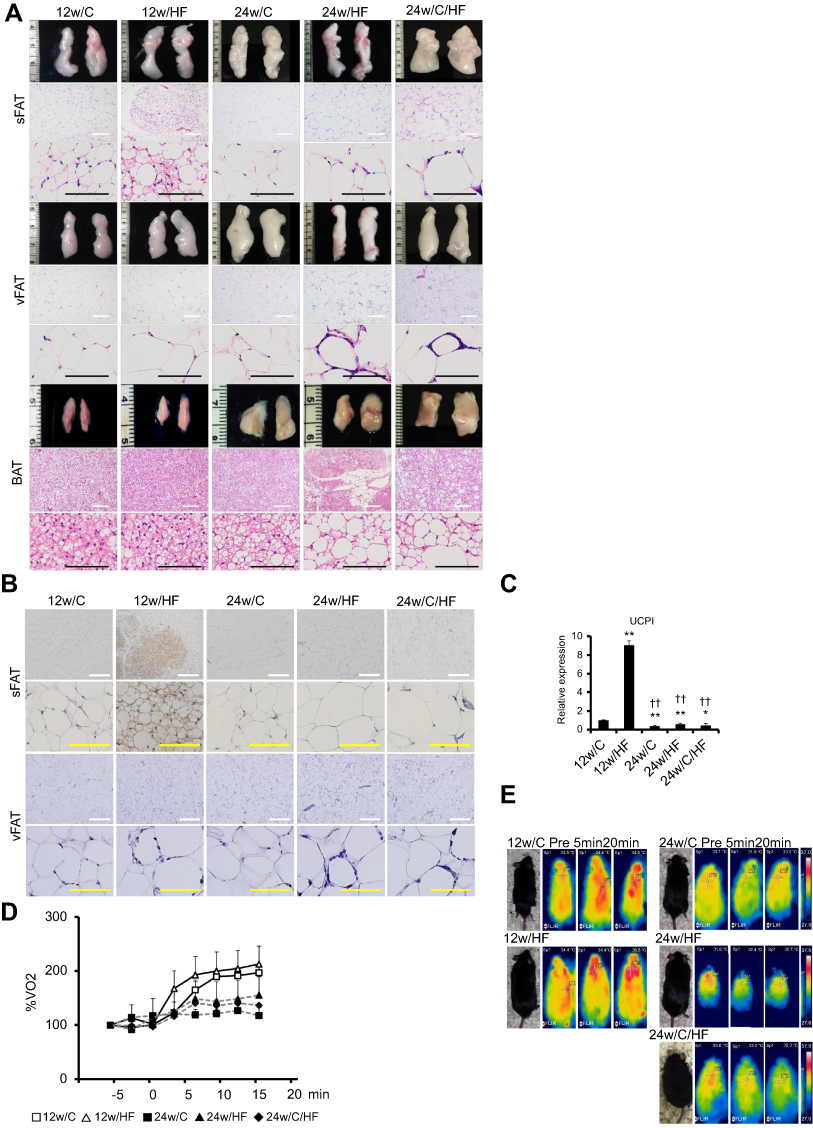 |
Figure 3 Aging-related loss of browning capacity and impaired metabolic compensation in response to HF feeding. (A) Histology of subcutaneous and visceral adipose tissues, and interscapular brown adipose tissues (sFAT, vFAT, and BAT) were examined by HE staining. White and black scale bars in each picture represent 200 µm and 100 µm, respectively. (B) Immunohistochemistry (IHC) of UCP1 in sFAT and vFAT. White and yellow scale bars represent 500 µm and 100 µm, respectively. (C) mRNA expression of brown adipocyte markers (UCP1) in sWAT. Assessment of brown adipose tissue (BAT) activity by (D) β3-adrenergic receptor (AdrR) stimulation test and (E) thermography. O2 consumption and body surface temperature of each animal were measured at baseline and after intraperitoneal injection of a selective β3-AdrR agonist (CL316,243, 2 mg/kg body mass). Values are mean ± SD. *p<0.05. **p<0.001, vs 12w/C. ††p<0.001, vs 12w/HF. There are no significant differences between 24w/HF and 24w/C/HF groups. |
Subcutaneous adipose tissue senescence is induced by HF feeding
BAT is known to regress with age in both rodents and humans; however, the aging-associated metabolic changes occurring in sFAT have not been fully elucidated. Therefore, we evaluated cellular senescence in sFAT. The expression of p21, a major senescence marker, was significantly higher at both the mRNA and protein levels in HF-fed older mice (Figure 4A, B). However, there were no significant differences among the groups in p16 expression (Figure 4A); therefore, we also evaluated beta-galactosidase activity in sFAT as another marker of senescence. β-galactosidase staining also showed that HF feeding promotes cellular senescence in 30-week-old, but not in 18-week-old mice (Figure 4C), suggesting that some of the changes in sFAT during aging may impair its browning capacity.
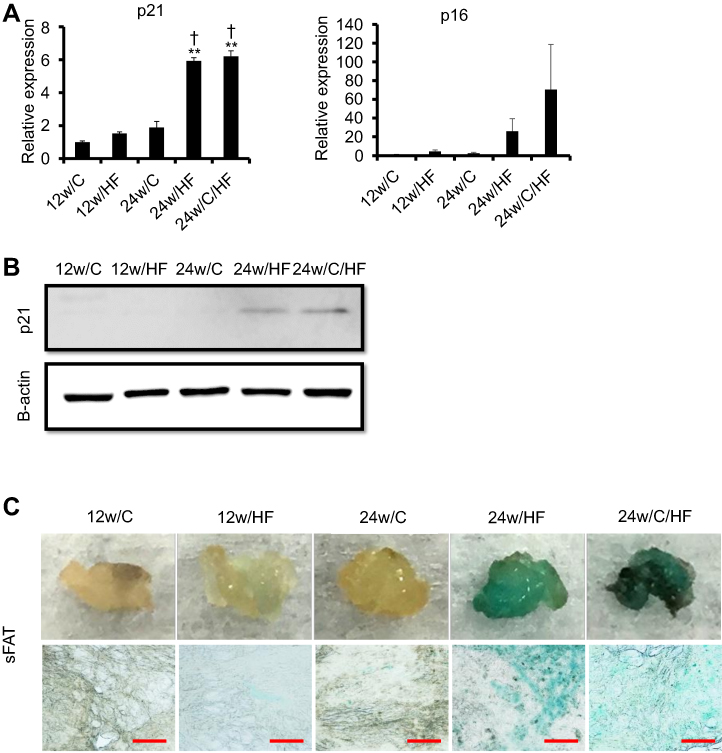 |
Figure 4 Features of senescence in sFAT are promoted by HF feeding and aging. (A) mRNA expression of p21 and p16 (representative senescence markers) and (B) protein expression of p21. Blots were checked for equal loading by re-probing with anti-beta actin on the same membrane. (C) Assessment of tissue senescence in sFAT using X-gal staining (upper panel; stained tissues, lower panel; compressed sections). The red scale bar represents 100 µm. Values are mean ± SD. **p<0.001, vs 12w/HF. †p<0.05, vs 24w/C. There are no significant differences between 24w/HF and 24w/C/HF groups. |
HF and aging induce changes in the gene expression profile of mesenchymal stem cells and inhibit the differentiation of beige cells
MSCs that reside in adipose tissue are generally believed to be the principal source of adipocytes and essential for browning. Therefore, we next characterized the MSC population in sFAT. The expression of all MSC markers was lower in isolated cells from sFAT in 24w/HF group than those in 12w/HF group, indicating that the population of Ad-MSCs declines with age (Figure 5A). The capacity of the MSCs to differentiate into white adipocytes and beige cells in vitro was also lower in older mice, as shown by a decline in fat deposition, UCP1 expression, and mitochondrial content of the cells (Figure 5B). Further characterization of Ad-MSCs by DNA microarray revealed that about two thousand genes were down-regulated with aging in 24w/C vs 12w/C and 24w/HF vs 12w/HF (Figure 5C, D), including several involved in the browning of white adipose tissue, such as fibroblast growth factor 21 (FGF21) and peroxisome proliferator-activated receptor-γ coactivator-1α (PGC-1α) (Table 4). These results suggest that a combination of aging and HF diet promote changes in the gene profile of Ad-MSCs that could explain the impairment in metabolic homeostasis.
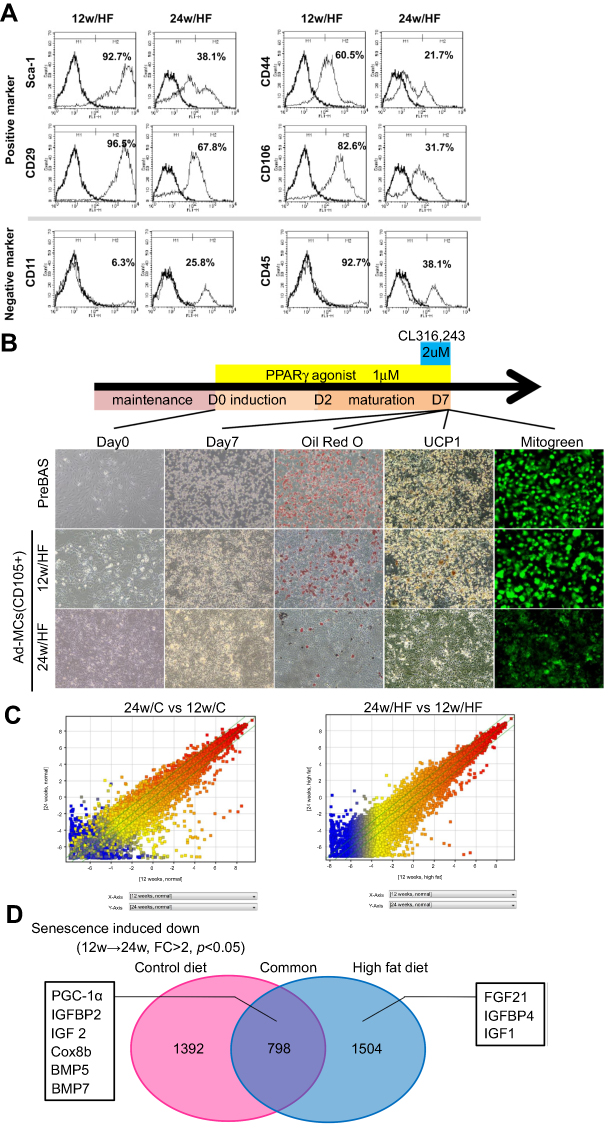 |
Figure 5 Aging and HF feeding alters the character of mesenchymal stem cells in sFAT (Ad-MSC). (A) Evaluation of Ad-MSC using a set of stem cell markers by Flow Cytometry. (B) Assessment of the differentiation capacity of Ad-MSCs into brown adipocytes (BA) using AdipoInducer Reagent, pioglitazone (1 µM) and CL316,243 (2 µM). The efficiency of BA induction was assessed by UCP1 IHC, mitochondrial (MitoGreen) and oil-red O staining. Pre-BAs from the classical BAT of 6-week-old male C57BL/6NCrSlc mice were used as positive control. (C) Scatterplot of gene expression profiles for Ad-MSCs from 24w/C and 12w/C mice (left panel) or from 24w/HF and 12w/HF mice (right panel). Green lines indicate the cut-offs for 2-fold up- and down-regulation. (D) Venn diagram of the down-regulated genes (with p<0.05 and >2-fold difference) in Ad-MSCs in the process of senescence (from younger to older mice). In the process of senescence, 2,190 genes in the control diet feeding groups and 2,302 genes in HF feeding groups were down-regulated. 798 genes were common to both categories. Several genes associated with browning in sFAT were included in each category, as shown in a schema. |
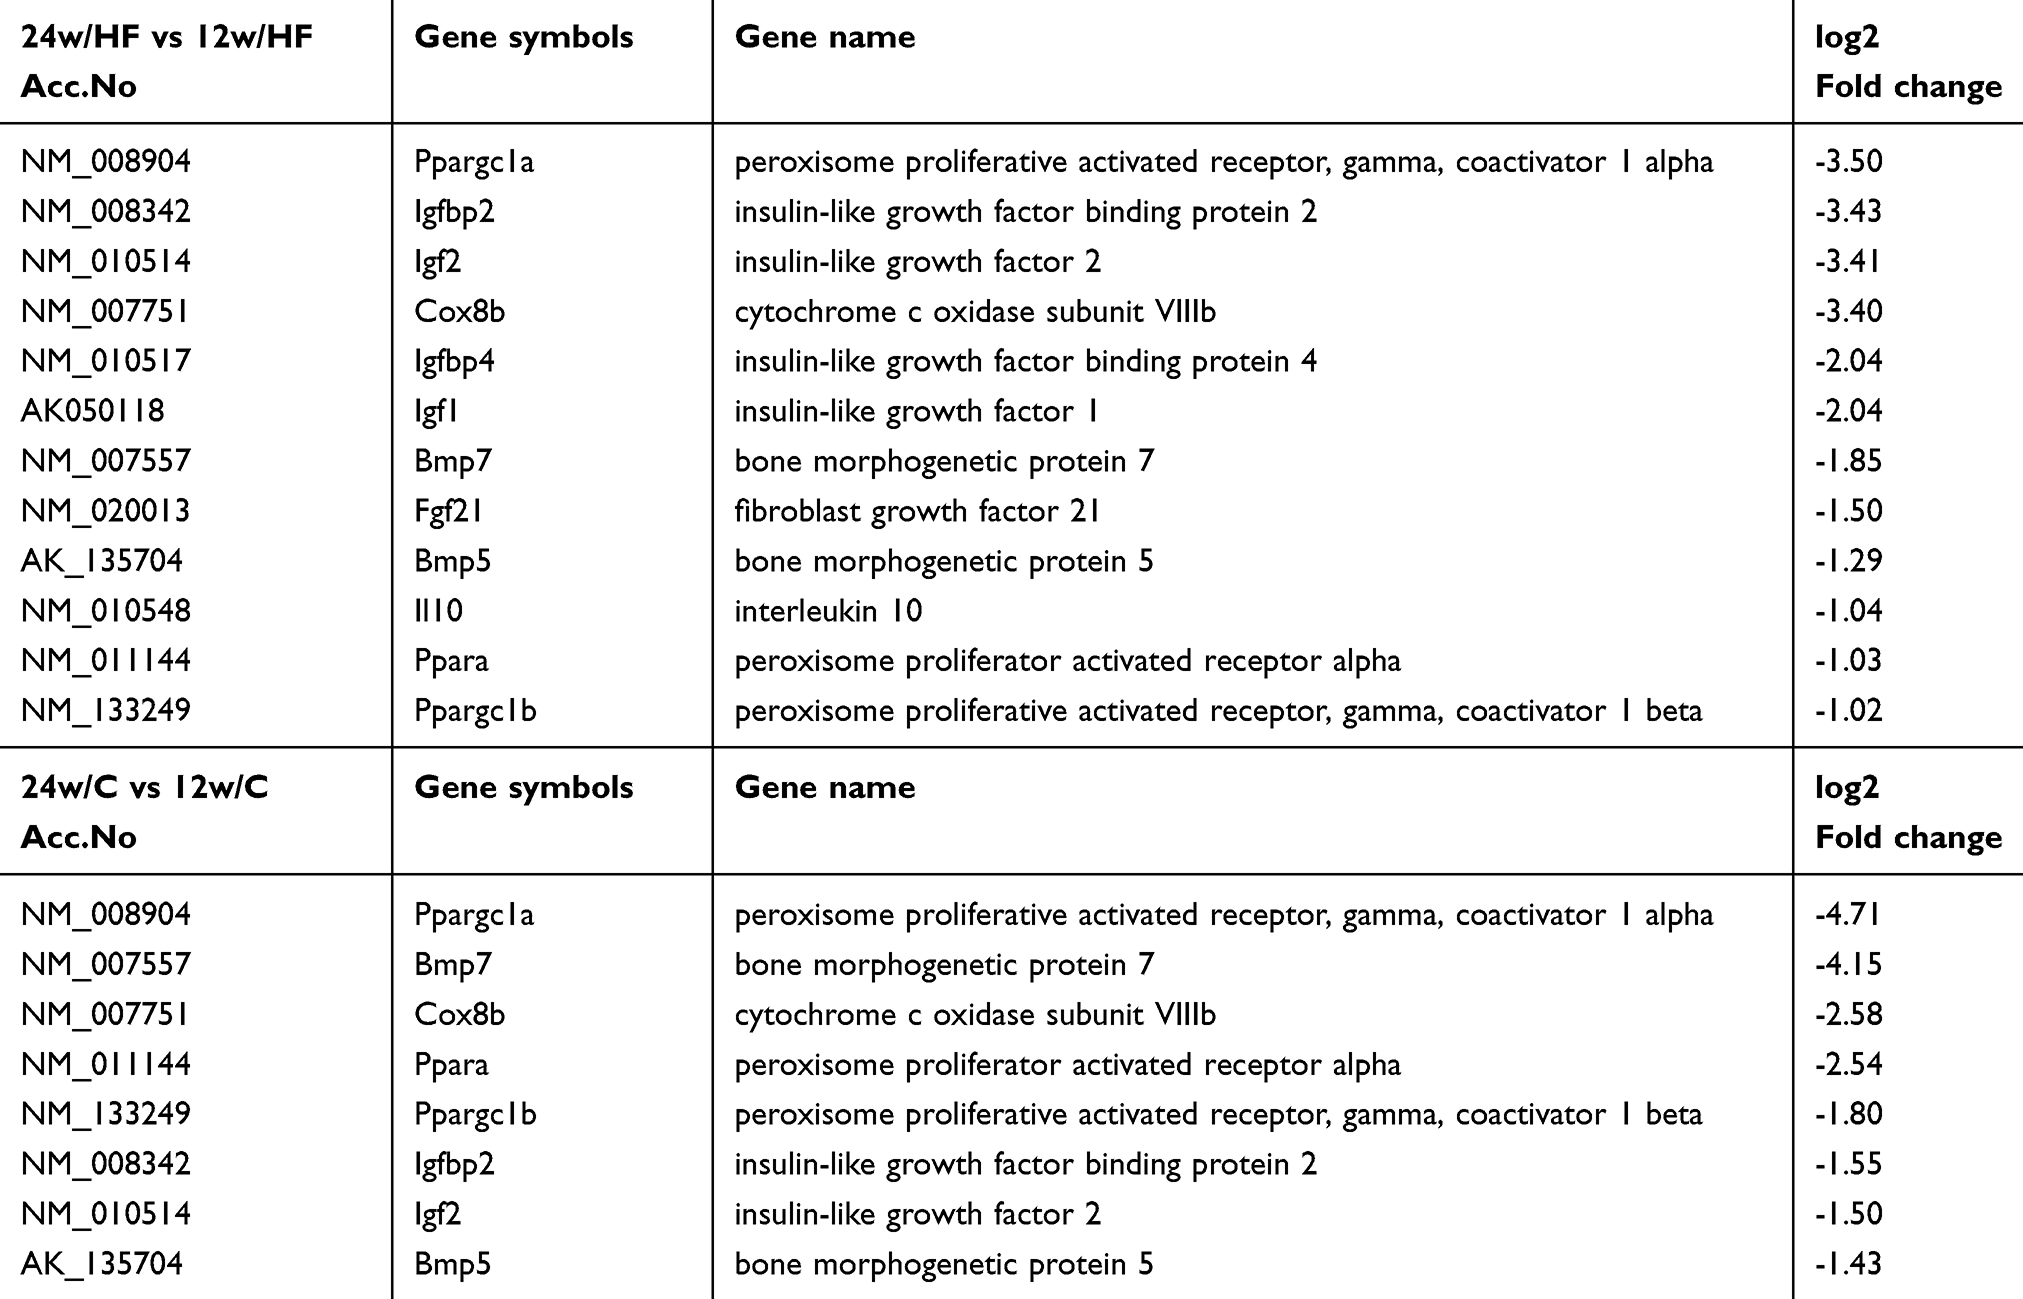 |
Table 4 List of down-regulated genes associated with self-renewal and adipocyte differentiation in Ad-MSCs from older mice |
Transplantation of MSC from young mice improves the hepatic and metabolic phenotypes
We next evaluated the effect of Ad-MSC recruitment in mice with severe obesity and NAFLD (as shown in Figure 6A). Injection of CD105 (a marker of MSC)-enriched MSCs from young mice significantly reduced body mass gain from two weeks after transplantation (p<0.001, Figure 6B). Cell transplantation significantly ameliorated the reduction in EE and improved both glucose and TG tolerance in the 24w/Tx group (p<0.001, Figure 6C, D), even though there were no differences in locomotor activity or food intake between the groups compared (Figure 6E, Table 5). Furthermore, this metabolic rescue ameliorated features of NAFLD, including by reducing hepatic TG content (Figure 6F, G). On the other hand, the recruitment of Ad-MSCs from old-obese mice fed with HF for 24 weeks did not show a beneficial effect to control obesity and NAFLD with absence of brown adipocytes inside sFAT in recipient mice (Figure S1, Table S1).
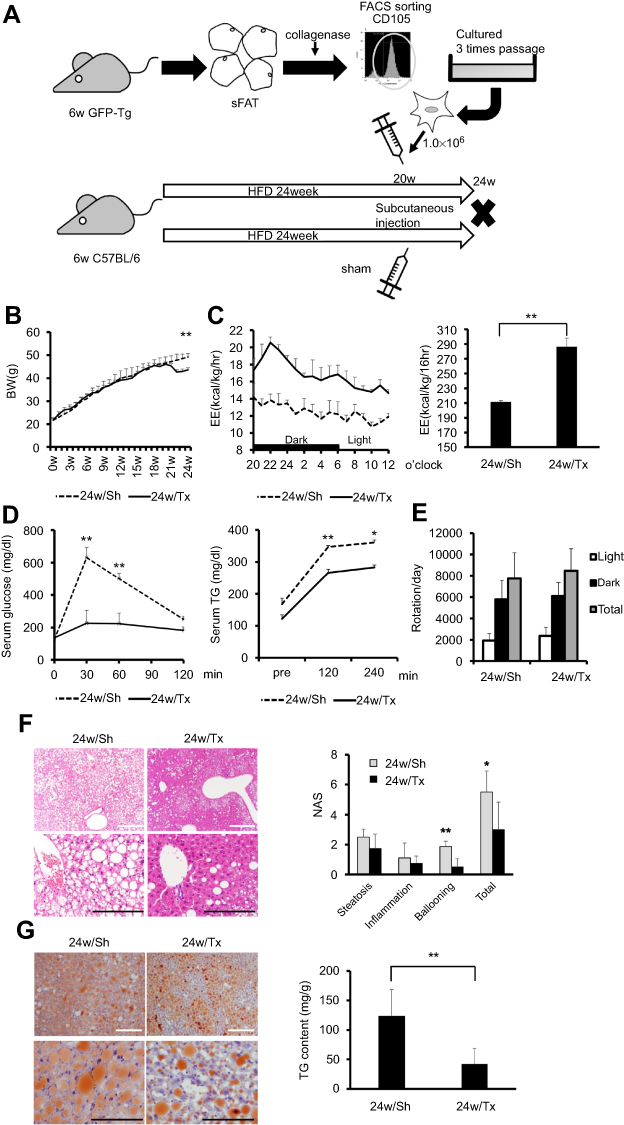 |
Figure 6 Transplantation of Ad-MSCs from young mice ameliorates the obesity-associated metabolic impairment and features of steatohepatitis. (A) A schema for the MSC transplantation experiment. We obtained Ad-MSCs from 6-week-old C57BL/6-Tg (CAG-EGFP) mice as shown in a schema. Freshly harvested Ad-MSCs (one million cells/mouse) were injected into the subcutaneous adipose tissue of 24w/HF mice at 26 weeks of age (24w/Tx group). Same volumes of DMEM were also injected into control mice as sham operation group (24w/Sh group). All mice were sacrificed at 30 weeks of age. We performed metabolic function tests within a week of the end-point (n=5 mice per group). (B) Body mass, (C) Energy expenditure (EE; kcal/kg/h), (D) Glucose and triglyceride (TG) tolerance tests were undertaken, and (E) Voluntary exercise (number of rotations per day) was measured in both 24w/Tx and 24w/Sh mice. (F) Histological assessment of NAFLD activity score (NAS) and (G) TG accumulation in liver tissue in the sham-treated and transplantation groups. White and black scale bars in each picture represent 200 µm and 100 µm, respectively. Values are mean ± SD. *p<0.05 or **p<0.001, vs 24w/Sh. |
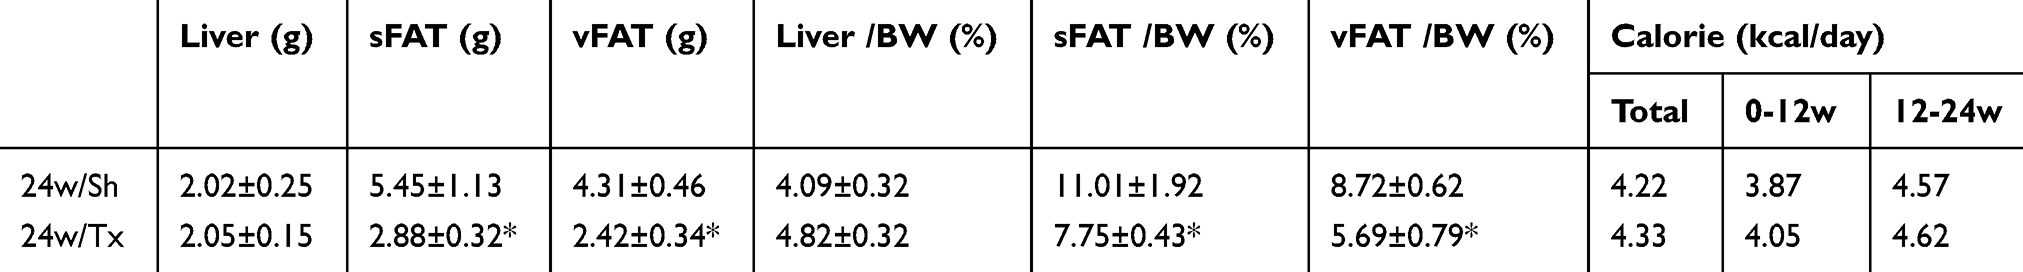 |
Table 5 Comparison of body and tissue masses, and dietary calorie intake of both mice transplanted with MSCs or with sham operation |
Re-establishment of functional beige adipocytes by MSC recruitment
We next evaluated the origin of the metabolic compensation by focal cell therapy in each fat depot. UCP1-positive cells appeared inside sFAT in the transplantation group, whereas they did not appear in the sham group (Figure 7A). Reactivation of browning by MSC recruitment was also confirmed by the sensitive thermogenic response to β3-adrenergic receptor stimulation (Figure 7B). In sFAT following MSC transplantation, UCP1-positive cells mainly originated from donor cells (GFP-positive), but part of the population was also derived from host cells (Figure 7C). Furthermore, the MSC recruitment significantly improved the imbalance in the expression of profibrotic factors in sFAT in older HF-fed mice (Figure 7D). These results suggest that MSCs in sFAT are not only the source of beige adipocytes, but also establish an advantageous extracellular microenvironment for browning.
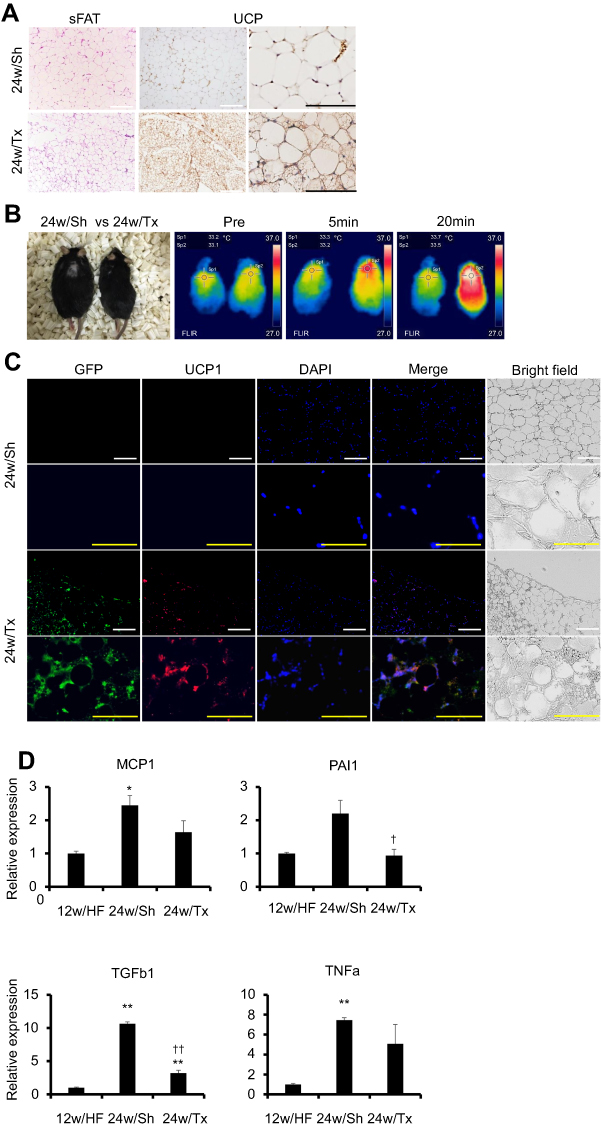 |
Figure 7 Ad-MSCs transplantation rescued the impaired metabolic homeostasis by reactivating beige adipocytes and normalizing the extracellular milieu in sFAT. (A) H&E staining and UCP1 IHC of sWAT of both 24w/Sh and 24w/Tx mice. White and black scale bars represent 100 µm and 200 µm, respectively. (B) Assessment of BAT activity using thermography. Surface body temperature was measured at baseline and after intraperitoneal injection of CL316,243 (2 mg/kg body mass). (C) Double staining IHC for GFP (green) and UCP1 (red) with DAPI in sWAT of 24w/Sh and 24w/Tx. White and yellow scale bars in each picture represent 100 µm and 200 µm, respectively. (D) mRNA levels of inflammatory and profibrotic factors (PAI1, TGFb1, TNFa, MCP1) in sFAT of 12w/HF, 24w/Sh and 24w/Tx mice. Values are mean ± SD. *p<0.05 or **p<0.001, vs 12w/HF. †p<0.05 or ††p<0.001, vs 24w/Sh. |
Discussion
Recently, the incidence of NAFLD has been increasing worldwide, making it one of the principal causes of chronic liver disease. The development and progression of NAFLD involve complex mechanisms, including genetic predisposition22 and lifestyle-induced energy imbalance,23 therefore involving “multiple hits”. Obesity is an independent risk factor for the development of NAFLD.24 In particular, the expansion of visceral, but not subcutaneous, adipose tissue is associated with contrasting metabolic risks of heart disease, renal disease, and NAFLD in humans,25 as a result of differential secretion of adipokines. In addition, the function of adipose tissue in the maintenance of energy homeostasis has recently attracted a great deal of attention. This tissue is no longer thought of purely as a storage depot for excess calories, but also as an energy consuming tissue, being capable of non-shivering thermogenesis in response to environmental changes. This study evaluated the significance of adipose tissue metabolism during the progression of NAFLD.
BAT is composed of UCP1-expressing adipocytes, but these have also been identified in the white adipose tissue of adult humans, in addition to their presence in small animals, such as rodents, and newborn babies.11,26 BAT demonstrates higher mitochondrial density and UCP1 expression than WAT, and is capable of uncoupling oxidative phosphorylation and dissipating chemical energy as heat in larger quantities. Thus, it is more comparable to skeletal muscle with regard to energy expenditure than WAT. In adult humans uncoupling can only occur in beige adipocytes that become activated in sFAT, due to the absence of classical brown adipocytes,6 and their activity is inversely related to total body adiposity and indices of the metabolic syndrome.27 Hence, the capacity of beige adipocytes to maintain energy balance may be an important regulatory mechanism limiting the progression of NAFLD.
Aging is a validated risk factor for the progression of NAFLD to cirrhosis,28 and hence cellular senescence in various organs, including the liver, has a role in the pathogenesis of NAFLD. We previously reported that telomere shortening in hepatocytes is associated with obesity, insulin resistance and hepatic steatosis,29 and hepatocyte senescence markers correlate with NAFLD.30 These data indicate that age-associated metabolic disturbances in hepatocytes are involved in the development of NAFLD. In addition, aging affects the development of NASH through a more marked inflammatory response, but not aggravation of simple steatosis in a mouse model,31 which is partially consistent with our data demonstrating the progression of NAFLD in older groups of mice (24w/HF and 24w/C/HF). Aging-related changes in the immune system might also trigger the progression from simple fatty liver to NASH. However, patients with NAFLD show lower hepatic and whole-body fat oxidation at rest and during exercise,32 and caloric restriction and aerobic exercise training can ameliorate NAFLD.33 These findings suggest that aging-associated metabolic impairment is an essential component of the pathogenesis of NAFLD, as also indicated by our study.
Beige adipocytes are more frequent in younger, leaner and female subjects,11 who would be very unlikely to have NAFLD. However, the relationship between beige adipocyte activity and NAFLD has not been characterized. In this study, we hypothesized that the age-related functional decline of beige adipocytes would affect the progression of NAFLD and evaluated the difference between young and older mice with reference to a previous study that showed that the induction of beige adipocytes in mice decreases from around 20 weeks of age.10 Here, older mice showed more severe NAFLD, despite the HF feeding period being adjusted to mirror that of the young mice, which was the result of impaired compensation by beige adipocytes to the HF diet and lower EE (Fig.3C, 1C). Although WAT (subcutaneous and visceral) and liver showed features of aging, including greater β-galactosidase staining, there was no effect on the expression of lipid metabolism genes in the liver. These data might suggest that the aging of adipose tissue is more closely related to the progression from simple steatosis to NASH, especially in its early stages.
Recent data have revealed the presence of beige adipocyte precursors that can differentiate into either white or dormant beige adipocytes in the stromal vascular fraction of sFAT, which are designated Ad-MSCs.6 Ad-MSCs from young mice were more capable of differentiating into white and beige adipocytes, and were more likely to express MSC markers than those from aged mice. Declined differentiation capacity of Ad-MSCs from aged mice partially might come from the heterogeneity of the cells. FGF21 plays a physiological role in the browning of WAT and adipose-derived FGF21 acts in an autocrine and paracrine manner to increase the expression of UCP1 in adipose tissue, by enhancing PGC-1α.34 In addition, FGF21 is a pro-longevity hormone that ameliorates the negative effects of aging on body mass, adiposity, and insulin resistance.35 Our microarray analysis demonstrated that FGF21 expression by Ad-MSCs was lower in older mice (Table 4), which might explain aging-related changes in adipose tissue and liver, and aging-associated metabolic disturbance in WAT.
The importance of Ad-MSCs in the metabolic syndrome is supported by several lines of evidence, including the therapeutic effect of transplantation of MSCs.36,37 Although MSCs maintain browning capability and their senescence is associated with a loss of browning,6,10 investigation of the potential mechanisms whereby MSCs prevent metabolic diseases has previously mainly focused on their anti-inflammatory and anti-fibrotic effects. Interleukin-10, an anti-inflammatory cytokine, was down-regulated in aged Ad-MSCs in our study (Table 4), but its effect on energy metabolism is still unclear.
Compensation by adipose tissue for changes in energy metabolism is an important mechanism involved in the control of obesity-associated metabolic diseases, as demonstrated previously by the transplantation of bioengineered brown adipocytes derived from multipotent stem cells.38 In the present study, subcutaneous transplantation of Ad-MSCs from young mice restored the potential for browning and ameliorated the metabolic disorder and NAFLD in older mice. This result indicates that the MSC phenotype has a significant impact on the capability of adipose tissue to metabolically compensate for an adverse extracellular environment. Interestingly, the expression of autocrine insulin-like growth factors, which have important roles in the multipotency and self-renewal capability of MSCs,39 was lower in older Ad-MSCs (Table 4), which might also be involved in the age-related loss of effect of Ad-MSCs to maintain metabolic homeostasis. Further studies are required to establish the potential pathway involved.
In conclusion, environmental change, in the form of an HF, promoted aging-associated impairment in progenitor cells in sFAT and loss of BAT, which resulted in a breakdown of systemic energy homeostasis, severe obesity, and the progression of NAFLD. Furthermore, subcutaneous transplantation of Ad-MSCs with a young phenotype re-established a BAT phenotype, induced metabolic compensation, and ameliorated NAFLD. The physiological significance of adult human BAT has not yet been fully explored. These results provide new insight to suggest that a strategy focused on Ad-MSCs would have therapeutic potential for NAFLD.
Abbreviations
NAFLD, Nonalcoholic fatty liver disease; BAT,brown adipose tissue; sFAT, subcutaneous fat tissue; BA, brown adipocytes; UCP1, uncoupling protein 1; MSC, mesenchymal stem cell; C, control chow; HF, high-fat diet; C/HF, switched group from control chow to high-fat diet; vFAT, visceral fat tissue; VO2, oxygen consumption; VCO2, carbon dioxide emission; EE, energy expenditure; OGTT, oral glucose tolerance test; OTTT, oral triglyceride tolerance test; AdrR, adrenergic receptor; NAS, NAFLD activity score; PBS, phosphate-buffered saline; TG, triglyceride; qRT-PCR, quantitative real-time PCR; Ad-MSC, adipose tissue-derived mesenchymal stem cell; DMEM, Dulbecco’s modified Eagle’s medium; Sca-1, stem cells antigen 1; Cy3, Cyanine-3; ANOVA, analysis of variance; FAS, fatty acid synthase; PPARγ, peroxisome proliferator-activated receptor γ; FGF21, Fibroblast growth factor 21; PGC-1α, co-activator 1α.
Acknowledgments
This work was supported by the Research Encouragement Donations from MSD K.K., Shionogi & Co., Ltd. and Takeda Chemical Industries, Ltd (to TN).
Author contributions
Study concept and design: T.N.; acquisition of data: T.N., H.T, K.K., S.S.; analysis and interpretation of data: T.N., H.T., H.N.; microarray analysis: S.H., M.M-H.; drafting of the manuscript: T.N., H.T.; critical revision of the manuscript for intellectual content: T.N., H.I., Y.S., A.U., Ka.Y., M.M., Ko.Y., Y.I.; obtained funding: T.N.; administrative, technical or material support: T.N., H.T., H.N., K.K., S.S., Y.I. W.A. All authors contributed to data analysis, drafting or revising the article, gave final approval of the version to be published, and agree to be accountable for all aspects of the work
Disclosure
Y Itoh report grants from Merck Sharp & Dohme, Shionogi & Co., Ltd., Daiichi Sankyo Company, Limited, Eisai Co., Ltd., EA Pharm Co., Ltd. and AbbVie Inc., during the conduct of the study. Y Itoh reports personal fees from Merck Sharp & Dohme, Bristol-Myers Squibb Company, Gilead Sciences Inc., AbbVie Inc., Mitsubishi Tanabe Pharma Corporation, Daiichi Sankyo Company, Limited, Janssen Pharmaceutical K.K., Astellas Pharma Inc., Ajinomoto Pharmaceuticals Co., Ltd., Eisai Co., Ltd., Otsuka Pharmaceutical Co., Ltd., Mylan Inc., GlaxoSmithKline Plc., Sysmex Co., Kowa Pharmaceutical Company Ltd., Sumitomo Dainippon Pharma Co., Ltd., Taiho Pharmaceutical Co., Ltd., Takeda Pharmaceutical Company Limited., Chugai Pharmaceutical Co., Ltd., Tsumura & Co., Fujifilm Medical Co., Ltd., Sanofi K.K., AstraZeneca Plc, Zeria Pharmaceutical Co., Ltd., Taisho Toyama Pharmaceutical Co., Ltd., Asuka Pharmaceutical Co., Ltd., Ono Pharmaceutical Co., Ltd., Nissan Chemical Industries, Ltd., Nichinichi Pharmaceutical Co., Ltd., and EA Pharm Co., Ltd. Prof. Y Itoh also reports grants from Shionogi Limited, Kissei Pharmaceutical Co., Ltd., Japan Blood Product Organization, Bayer AG and grants from BeiGene Ltd, outside the submitted work. The authors report no other conflicts of interest in this work.
References
1. NCD Risk Factor Collaboration (NCD-RisC). Worldwide trends in body-mass index, underweight, overweight, and obesity from 1975 to 2016: a pooled analysis of 2416 population-based measurement studies in 128·9 million children, adolescents, and adults. Lancet. 2017;390:2627–2642. doi:10.1016/S0140-6736(17)32129-3
2. Bellentani S, Scaglioni F, Marino M, Bedogni G. Epidemiology of non-alcoholic fatty liver disease. Dig Dis. 2010;28:155–161. doi:10.1159/000282080
3. Cholankeril G, Wong RJ, Hu M, et al. Liver transplantation for nonalcoholic steatohepatitis in the us: temporal trends and outcomes. Dig Dis Sci. 2017;62:2915–2922. doi:10.1007/s10620-017-4684-x
4. Wong VW. Nonalcoholic fatty liver disease in Asia: a story of growth. J Gastroenterol Hepatol. 2013;28:18–23. doi:10.1111/jgh.12011
5. Paschos P, Paletas K. Non alcoholic fatty liver disease and metabolic syndrome. Hippokratia. 2009;13:9–19.
6. Wu J, Boström P, Sparks LM, et al. Beige adipocytes are a distinct type of thermogenic fat cell in mouse and human. Cell. 2012;150:366–376. doi:10.1016/j.cell.2012.05.016
7. Harms M, Seale P. Brown and beige fat: development, function and therapeutic potential. Nat Med. 2013;19:1252–1263. doi:10.1038/nm.3361
8. Ishibashi J, Seale P. Medicine. Beige can be slimming. Science. 2010;328:1113–1114. doi:10.1126/science.1190816
9. Seale P, Bjork B, Yang W, et al. PRDM16 controls a brown fat/skeletal muscle switch. Nature. 2008;454:961–967. doi:10.1038/nature07182
10. Rogers NH, Landa A, Park S, Smith RG. Aging leads to a programmed loss of brown adipocytes in murine subcutaneous white adipose tissue. Aging Cell. 2012;11:1074–1083. doi:10.1111/acel.12010
11. Cypess AM, Lehman S, Williams G, et al. Identification and importance of brown adipose tissue in adult humans. N Engl J Med. 2009;360:1509–1517. doi:10.1056/NEJMoa0810780
12. Graja A, Schulz TJ. Mechanisms of aging-related impairment of brown adipocyte development and function. Gerontology. 2015;61:211–217. doi:10.1159/000366557
13. Kodo K, Sugimoto S, Nakajima H, et al. Erythropoietin (EPO) ameliorates obesity and glucose homeostasis by promoting thermogenesis and endocrine function of classical brown adipose tissue (BAT) in diet-induced obese mice. PLoS One. 2017;12:e0173661. doi:10.1371/journal.pone.0173661
14. Weir JB. New methods for calculating metabolic rate with special reference to protein metabolism. J Physiol. 1949;109:1–9. doi:10.1113/jphysiol.1949.sp004363
15. Kleiner DE, Brunt EM, Van Natta M, et al. Nonalcoholic steatohepatitis clinical research network. Design and validation of a histological scoring system for nonalcoholic fatty liver disease. Hepatology. 2005;41:1313–1321. doi:10.1002/hep.20701
16. Nishikawa T, Bell A, Brooks JM, et al. Resetting the transcription factor network reverses terminal chronic hepatic failure. J Clin Invest. 2015;125:1533–1544. doi:10.1172/JCI73137
17. Bligh EG, Dyer WJ. A rapid method of total lipid extraction and purification. Can J Biochem Physiol. 1959;37:911–917. doi:10.1139/o59-099
18. Nishikawa T, Bellance N, Damm A, et al. A switch in the source of ATP production and a loss in capacity to perform glycolysis are hallmarks of hepatocyte failure in advance liver disease. J Hepatol. 2014;60:1203–1211. doi:10.1016/j.jhep.2014.02.014
19. Okada Y, Yamaguchi K, Nakajima T, et al. Rosuvastatin ameliorates high-fat and high-cholesterol diet-induced nonalcoholic steatohepatitis in rats. Liver Int. 2013;33:301–311. doi:10.1111/liv.12033
20. Sung JH, Yang HM, Park JB, et al. Isolation and characterization of mouse mesenchymal stem cells. Transplant Proc. 2008;40:2649–2654. doi:10.1016/j.transproceed.2008.08.009
21. Nishikawa T, Nakajima T, Moriguchi M, et al. A green tea polyphenol, epigalocatechin-3-gallate, induces apoptosis of human hepatocellular carcinoma, possibly through inhibition of Bcl-2 family proteins. J Hepatol. 2006;44:1074–1082. doi:10.1016/j.jhep.2005.11.045
22. Sookoian S, Pirola CJ. Meta-analysis of the influence of I148M variant of patatin-like phospholipase domain containing 3 gene (PNPLA3) on the susceptibility and histological severity of nonalcoholic fatty liver disease. Hepatology. 2011;53:1883–1894. doi:10.1002/hep.24283
23. Koopman KE, Caan MW, Nederveen AJ, et al. Hypercaloric diets with increased meal frequency, but not meal size, increase intrahepatic triglycerides: a randomized controlled trial. Hepatology. 2014;60:545–553. doi:10.1002/hep.27149
24. Li L, Liu DW, Yan HY, Wang ZY, Zhao SH, Wang B. Obesity is an independent risk factor for non-alcoholic fatty liver disease: evidence from a meta-analysis of 21 cohort studies. Obes Rev. 2016;17:510–519. doi:10.1111/obr.12407
25. Fox CS, Massaro JM, Hoffmann U, et al. Abdominal visceral and subcutaneous adipose tissue compartments: association with metabolic risk factors in the framingham heart study. Circulation. 2007;116:39–48. doi:10.1161/CIRCULATIONAHA.106.675355
26. Virtanen KA, Lidell ME, Orava J, et al. Functional brown adipose tissue in healthy adults. N Engl J Med. 2009;360:1518–1525. doi:10.1056/NEJMoa0808949
27. Franssens BT, Hoogduin H, Leiner T, van der Graaf Y, Visseren FLJ. Relation between brown adipose tissue and measures of obesity and metabolic dysfunction in patients with cardiovascular disease. J Magn Reson Imaging. 2017;46:497–504. doi:10.1002/jmri.25594
28. Noureddin M, Yates KP, Vaughn IA, et al. NASH CRN. Clinical and histological determinants of nonalcoholic steatohepatitis and advanced fibrosis in elderly patients. Hepatology. 2013;58:1644–1654. doi:10.1002/hep.26465
29. Nakajima T, Moriguchi M, Katagishi T, et al. Premature telomere shortening and impaired regenerative response in hepatocytes of individuals with NAFLD. Liver Int. 2006;26:23–31. doi:10.1111/j.1478-3231.2005.01178.x
30. Aravinthan A, Scarpini C, Tachtatzis P, et al. Hepatocyte senescence predicts progression in non-alcohol-related fatty liver disease. J Hepatol. 2013;58:549–556. doi:10.1016/j.jhep.2012.10.031
31. Fontana L, Zhao E, Amir M, Dong H, Tanaka K, Czaja MJ. Aging promotes the development of diet-induced murine steatohepatitis but not steatosis. Hepatology. 2013;57:995–1004. doi:10.1002/hep.26099
32. Croci I, Byrne NM, Choquette S, et al. Whole-body substrate metabolism is associated with disease severity in patients with non-alcoholic fatty liver disease. Gut. 2013;62:1625–1633. doi:10.1136/gutjnl-2012-302789
33. Hashida R, Kawaguchi T, Bekki M, et al. Aerobic vs. resistance exercise in non-alcoholic fatty liver disease: A systematic review. J Hepatol. 2017;66:142–152. doi:10.1016/j.jhep.2016.08.023
34. Fisher FM, Kleiner S, Douris N, et al. FGF21 regulates PGC-1α and browning of white adipose tissues in adaptive thermogenesis. Genes Dev. 2012;26:271–281. doi:10.1101/gad.177857.111
35. Zhang Y, Xie Y, Berglund ED, et al. The starvation hormone, fibroblast growth factor-21, extends lifespan in mice. eLife. 2012;1:e00065. doi:10.7554/eLife.00065
36. Ezquer M, Ezquer F, Ricca M, Allers C, Conget P. Intravenous administration of multipotent stromal cells prevents the onset of non-alcoholic steatohepatitis in obese mice with metabolic syndrome. J Hepatol. 2011;55:1112–1120. doi:10.1016/j.jhep.2011.02.020
37. Lee CW, Hsiao WT, Lee OK. Mesenchymal stromal cell-based therapies reduce obesity and metabolic syndromes induced by a high-fat diet. Transl Res. 2017;182:61–74. doi:10.1016/j.trsl.2016.11.003
38. Nishio M, Yoneshiro T, Nakahara M, et al. Production of functional classical brown adipocytes from human pluripotent stem cells using specific hemopoietin cocktail without gene transfer. Cell Metab. 2012;16:394–406. doi:10.1016/j.cmet.2012.08.001
39. Youssef A, Aboalola D, Han VK. The roles of insulin-like growth factors in mesenchymal stem cell niche. Stem Cells Int. 2017;2017:9453108. doi: 10.1155/2017/9453108
Supplementary materials
Transplantation of Ad-MSCs from young-lean or old-obese GFP mice
Six-week-old male C57BL/6-Tg (CAG-EGFP) mice were purchased from Shimizu Laboratory Supplies Co., Ltd (Kyoto, Japan) as donor with young phenotype (6w-donor) and a part of animals were fed with high-fat diet (HF) (HFD60: carbohydrate 19.6%, protein 18.2%, fat 60.0%, Orientalbio Co. Ltd., Tokyo, Japan) for 24 weeks as donor mice with old phenotype (24w-donor). Adipose progenitors were isolated from subcutaneous adipose tissues in each donor group (6w- or 24w-GFP-Ad-MSCs), as described in Material and Method. For recipient animals, six-week-old male C57BL/6NCrSlc mice (Shimizu Laboratory Supplies Co., Ltd) were fed with HF for 24 weeks. Freshly harvested 6w- or 24w-GFP-Ad-MSCs (106 cells suspended in 1ml of serum-free DMEM, 24w/Tx group) or vehicle (serum-free DMEM, 24w/Sh group) were injected into the subcutaneous adipose tissue (sFAT) of recipient mice when they were 26 weeks old, and all mice in each group (24w/YoungTx, 24w/OldTx and 24w/Sh groups) were monitored for 4 weeks and then sacrificed. NAFLD activity score (NAS) in liver sections and immunohistochemistry of uncoupling protein 1 (UCP1) in sFATs were assessed as described in Material and Method.
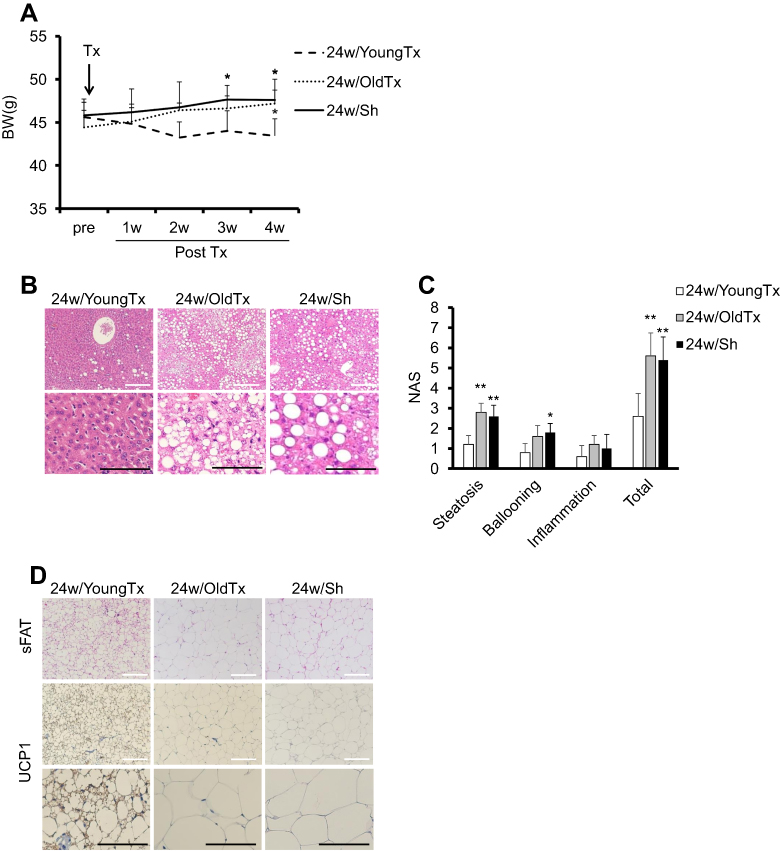 |
Figure S1 Transplantation of Ad-MSCs from old-obese mice did not sufficiently improve obesity and features of steatohepatitis, unlike Ad-MSCs from young-lean mice. Ad-MSCs were isolated from 6-week-old or 30-week-old C57BL/6-Tg (CAG-EGFP) mice respectively, as described above. Freshly harvested Ad-MSCs (one million cells/mouse) were injected into the subcutaneous adipose tissue of 24w/HF mice at 26 weeks of age (24w/YoungTx or 24w/OldTx groups). Same volumes of DMEM were also injected into control mice as sham operation group (24w/Sh group). All mice (n=5 mice per group) were monitored and sacrificed at 30 weeks of age. (A) Body mass, (B) (C) Histological assessment of NAFLD activity score (NAS) and (D) Immunohistochemistry (IHC) of UCP1 in sFAT. White and black scale bars in each picture represent 200 µm and 100 µm, respectively. Values are mean ± SD. *p<0.05 or **p<0.001, vs 24w/YoungTx. There are no significant differences between 24w/OldTx and 24w/Sh groups. |
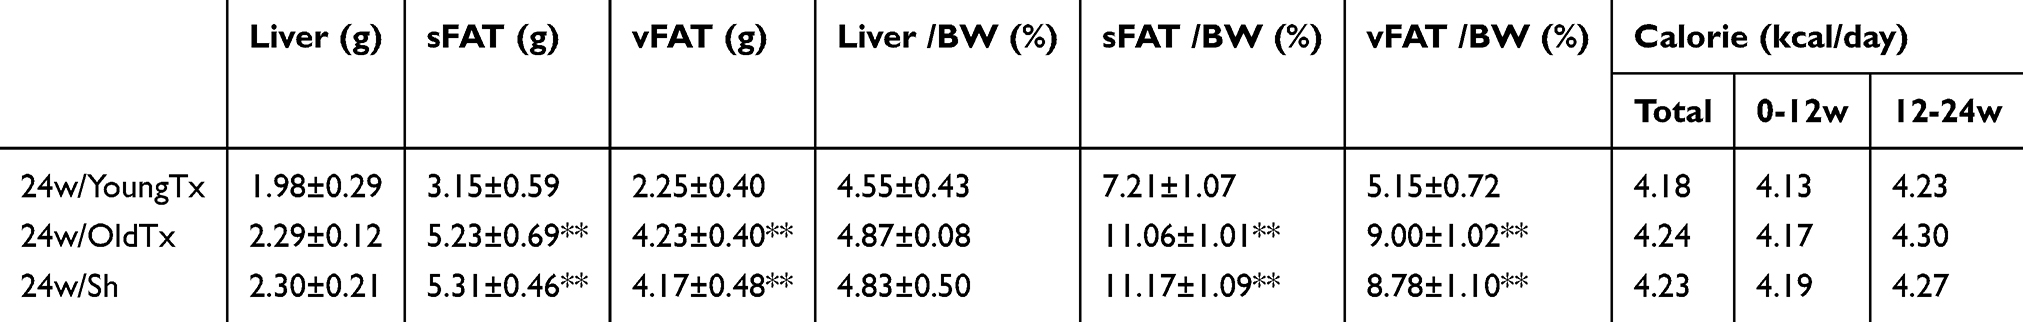 |
Table S1 Comparison of body and tissue masses, and dietary calorie intake of mice transplanted with MSCs or with sham operation |
 © 2019 The Author(s). This work is published and licensed by Dove Medical Press Limited. The full terms of this license are available at https://www.dovepress.com/terms.php and incorporate the Creative Commons Attribution - Non Commercial (unported, v3.0) License.
By accessing the work you hereby accept the Terms. Non-commercial uses of the work are permitted without any further permission from Dove Medical Press Limited, provided the work is properly attributed. For permission for commercial use of this work, please see paragraphs 4.2 and 5 of our Terms.
© 2019 The Author(s). This work is published and licensed by Dove Medical Press Limited. The full terms of this license are available at https://www.dovepress.com/terms.php and incorporate the Creative Commons Attribution - Non Commercial (unported, v3.0) License.
By accessing the work you hereby accept the Terms. Non-commercial uses of the work are permitted without any further permission from Dove Medical Press Limited, provided the work is properly attributed. For permission for commercial use of this work, please see paragraphs 4.2 and 5 of our Terms.