")
Back to Journals » Journal of Pain Research » Volume 13
Age and Gender as Factors of Pressure Sensitivity of Pain-Free Persons: Are They Meaningful?
Authors Cámara RJA , Gharbo RK , Egloff N
Received 7 February 2020
Accepted for publication 7 July 2020
Published 21 July 2020 Volume 2020:13 Pages 1849—1859
DOI https://doi.org/10.2147/JPR.S248664
Checked for plagiarism Yes
Review by Single anonymous peer review
Peer reviewer comments 3
Editor who approved publication: Professor Robert B. Raffa
Rafael JA Cámara,1 Raschid K Gharbo,2 Niklaus Egloff3
1 medscoops ® – Health Sciences, Mainz, Germany; 2Zürcher RehaZentrum, Klinik Davos, Davos-Clavadel, Switzerland; 3Department of Neurology, Division of Psychosomatic Medicine, Inselspital, Bern University Hospital, Bern, Switzerland
Correspondence: Raschid K Gharbo Rosenhügelweg 7, Davos-Platz 7270, Switzerland
Tel +41 79 245 67 47
Email [email protected]
Purpose: Prior findings suggest that women and elderly persons are more sensitive to pressure than men and younger persons; however, the magnitudes of these differences are substantially inconsistent. We answered the question whether the higher sensitivity of women and elderly persons is quantitatively meaningful. Specifically, we investigated if it is large enough to hamper the diagnosis, classification and follow-up of pain conditions by clinicians.
Materials and Methods: From each age stratum (18– 20, 21– 30, 31– 40, 41– 50, 51– 60, 61– 70, 71– 80, and > 80 years), 40 pain-free women and 40 pain-free men were recruited. They rated the intensity of pressure of ten Newtons over ten seconds on an analogue zero to ten rating scale. The pressure was applied on their middle fingers and ear lobes with a threshold algometer. Centile curves visualized the sex- and age-dependent fluctuation of pressure sensitivity.
Results: Over the entire age range from 20 to 80 years, the median curves fluctuated within the interval of less than two points. The distance between the median curves of men and women was also less than two points. On the average, the median difference was half a point on the finger (p = 0.249) and the ear lobe (p = 0.083).
Conclusion: Less than two points is below the minimal clinically important difference for a zero to ten analogue pain rating scale; differences smaller than one point are even below the resolution of the scale. Sex differences and age fluctuations of pressure sensitivity are negligible.
Keywords: age, sex, pain, sensitivity
Introduction
Sex and age differences tickle the fancy of physicians, researchers, and the general population, especially when it comes to the question of who is more sensitive. Several findings suggest that women experience pain more intensely than men. They include pressure, thermal, and ischemic pain.1,2 Investigations on age using mechanical pressure and ischemic pain stimuli have reported decreased pain thresholds in older age.3–5
A review of 172 studies found that with sufficient statistical power, pressure pain thresholds were lower in women than in men.6 Further results confirmed this difference, but its magnitude is substantially inconsistent.7 The differences vary between 5% up to 100%.3,8,9 Equally inconsistent are the thresholds within the same gender and even within the same measurement location between studies. This inconsistency might be due to the measuring methods. Quantitative sensory testing of pain is feasible by methods such as functional magnetic resonance imaging on one hand (nociceptive representation) while the patient is reporting the outcome on the other hand (magnitude estimation).10 While the first method is more “objective” and precise, the second method is more “subjective” and relevant to the patients. For the second method, it is possible to measure the kilopascals, or seconds, to a threshold, for instance until a stimulus is perceived as painful, respectively tolerable (threshold algometry), or to rate the intensity of the stimulus on an analogue scale (analogue pain rating).
Most threshold algometry studies focused on kilopascal or kilograms per square centimeter.3,9,11 Few studies kept the pressure constant over time and measured the time to the defined sensation.12 As a definition of minimal clinically important difference (MCID) is missing for threshold algometry, it is unknown if the sex- or age-dependent differences are meaningful or not.
Although analogue pain rating is the most popular pain assessment tool in research of disease-caused pain and the patients consider it the most relevant outcome, it is rare in quantitative sensory testing of pain and completely missing in investigations of age and sex differences.13–15 This is puzzling, since it is easier to put a peg on a patient´s finger or ear lobe than increasing the pressure constantly with a standard handheld algometer. Experimental studies showed that human delivery of pressure varies considerably during extended applications with these devices.16 An advantage of analogue rating is that the MCID is defined for a zero to ten analogue pain rating scale; a change or difference is clinically relevant if it is at least two points, or 30% of the initial value.17 Additionally, the maximal range of analogue pain rating is defined. Interpreting sex and age differences in relation to a maximal range makes it easier to decide how meaningful they are.
We answered the question whether the increased pain sensitivity of women and elderly is quantitatively meaningful. We did this by quantifying pain sensitivity as fluctuating age- and sex-dependent percentile curves of numeric ratings within a range of zero to ten. The use of percentile curves is more precise than simple mean comparisons or linear regressions, which is a further innovation of this study.
Materials and Methods
Design and Participants
The local ethics committee of the University of Bern, Switzerland, approved the protocol of the study (2018–00467; 66/09), which was conducted in accordance with the Declaration of Helsinki. The study was anonymous, ie, without “personal data” according to Article 4 of the General Data Protection Regulation. To keep the anonymity (Declaration of Helsinki, Article 17), the informed consent was oral and witnessed (Declaration of Helsinki, Article 26).
This study was carried out from May 2012 to August 2018 in Switzerland. In order to enroll a sample representing different strata from the general population, participants were enrolled from a general practice, five yoga schools, and eight sport clubs. Additionally, for more representability and to obtain an even distribution, the sampling was stratified by sex and age, which was crucial for the purpose of this study.
All eligibility criteria were documented on a separate case report form. Eligible participants were 18 to 89 years old, their frequency of pain medication was “very rare, maximally a few times per year”, their last pain medication was “longer than three months ago”, they had no “anti-inflammatory or immunosuppressive therapy”, “intact” measuring sites, and no medical history of “diabetes mellitus type 1 or 2”, “severe mental impairment”, or “pain lasting longer than three months”. If their frequency of pain medication was “occasionally, few times a month” or more often, they were excluded. Another exclusion criterion was “infected, inflamed or injured” fingers or ear lobes.
The participants were informed about the objective and purpose of the data collection. The study personnel interviewed the participants and recorded their gender, age, and the intensity with which they perceived a standard pressure stimulus on their middle fingers and on their ear lobes on a completely anonymized digital questionnaire (ie, without pseudonyms or any other identifying information (Figure 1)). The procedures took less than five minutes per participant and the local and circadian conditions were identical on all study sites. The rooms were quiet without any interruptions and shielded from other people.
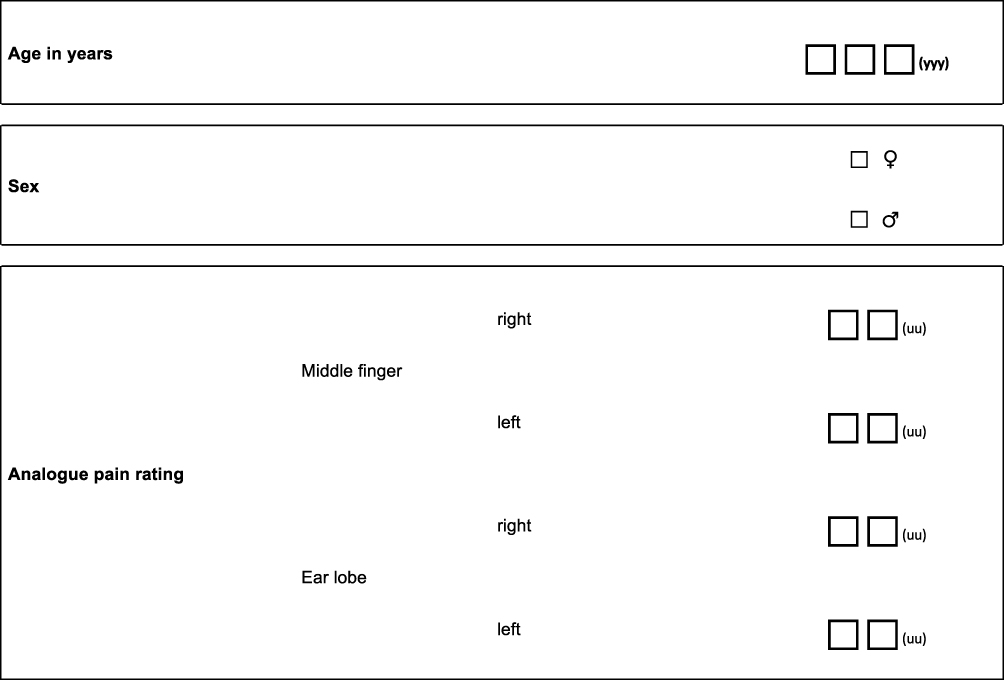 |
Figure 1 Interview: The personnel interviewed the participants and recorded their gender, their age, and the intensity with which they perceived a standard pressure stimulus on their middle fingers and on their ear lobes. “0” was no sensation at all; “10” was the strongest imaginable pain. |
Instrumentation and Application
Algometry was performed with polypropylene pegs – type Algopeg, size 78x10 millimeters, Inselspital Bern. It is a precisely standardized tonic pressure stimulus applied to the right middle finger, the left middle finger, the right ear lobe and the left ear lobe. The measurements were performed on both sides of the body to average out possible side-specific differences in perception.18 The force to obtain a clamp opening of five millimeters (mm) is ten Newtons. After ten seconds, the participants rate the intensity of the pressure on a zero to ten analogue rating scale.19
This algometry protocol was used in several clinical studies evaluating hypersensitivity and hyperalgesia in chronic pain condition.15,19-22 For testing pain pressure sensitivity, it has a well-proven internal and external validity .19,20 In terms of internal validity, standardized Bland Altman repeatability coefficients were 0.96 for finger pain rating and 0.63 for ear lobe pain rating. Moreover, 95% of the differences between test and retest results were within two standard deviations from “no difference” for ear lobe, and within one standard deviation for middle finger pain rating, with all p values <0.001.19,20 This is at least as consistent as hand-held algometers and very reliable according to the criteria of the British Standards Institution.23 In terms of external validity, the area under the receiver operating characteristic curve for analogue pain rating was not inferior to that of threshold algometry. It was at least 95% as large for finger measures (two-sided p = 0.038) and at least equally as large for ear lobe measures (two-sided p = 0.003).20 In addition, qualitative pilot testing showed stable measurement readings between 0 and +35 degrees centigrade, and repeated use of more than 2000 consecutive tests did not result in any decrease in clamping force.19
Reference Values
Our reference values were MCIDs and preexisting analogue pain rating scale values in studies with pain patients.14,21 We selected the power such that one unit on the analogue pain rating scale was statistically significant.17,24 In doing so, we answered the question whether studies on the diagnosis and follow-up of pain diseases must adjust their results for sex and age differences in the perception of pain, or if these differences only play a minor role when studying sensory arrays of altered nociceptive processes.
Data Analysis
The modeling and mapping of the centile curves followed after describing the subjects by age, gender, as well as gender- and site-specific relative distribution of pressure sensitivity. Age-unadjusted median comparisons of both sexes, p-values of these comparisons, and the age-related proportion of the variance of pressure sensitivity were rough numeric extracts of the visualized full evidence. The latter was equal to the pseudo R2 of the median regressions (see below). The Cuzick extension of the Wilcoxon rank-sum test searched for a trend of pressure sensitivity across eight age categories, namely the second to the ninth age decade.25 Bland Altman methods described the agreement between the values of the finger and the ear.26 Differences of 0.5 pressure sensitivity points were fluctuations within individuals caused by computing the arithmetic mean between right and left. Stata SE Version 12.1 supported all calculations.
Quantile regressions of pressure sensitivity by age modelled the median, the quartiles, and the tenth and 90th centiles of both genders and of the entire sample. Epanechnikov Kernel polynomial density functions of fourth order resulted in flexible regression curves.27 For each unit over the age interval from 20 to 80 years, the models estimated the centiles, their standard error, and hence their lower and upper 95% confidence limits. The graphs plotting all estimates compared the pressure sensitivity (analogue pain rating units) on the y-axis with the age (years) on the x-axis. To provide more robust estimates with more consistent widths of the 95% confidence bands over the entire age interval from 20 to 80 years, the models included subjects aged between 18 and 20, as well as older than 80 years. However, the estimates for these peripheral age categories were too vague for visualization.
Sample Size Calculation
Over the entire age interval from 20 to 80 years, the 95% confidence bands of both gender-specific medians of finger algometry had to be maximally ± 0.5 points wide, where one point is the smallest difference measurable between two individuals. An interim analysis estimated the Kernel density and hence the heteroscedastic variance functions. Based on assumed consistency of the latter function, the formula for asymptotic conservative confidence bands indicated how much the sample size still had to increase in order to decrease the 95% confidence bands to the target width.28 In case of gender-dependent variance functions, the larger of both functions was the reference for both genders. After prudent rounding, the sample size resulting from this calculation was 40 women and 40 men in each of the eight age decades (18–20 years, third to eighth decade, and >80 years), summing up to a total of 640 participants.
Results
Participants Flow
A total of 648 pain-free persons participated in this study (Figure 2).
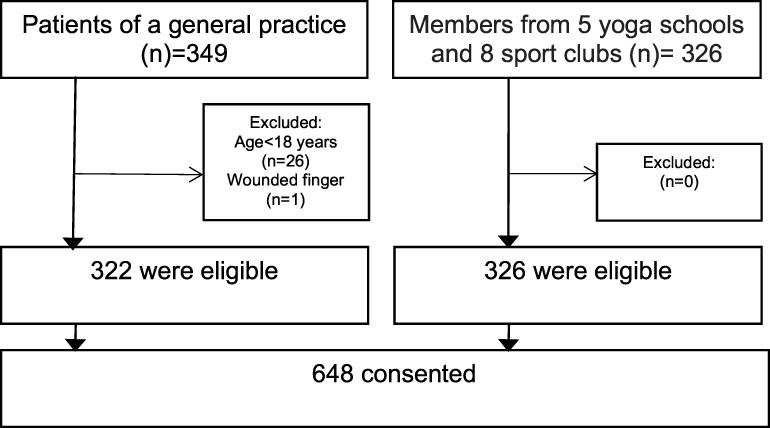 |
Figure 2 Participant flow: All participants provided full data. |
Pressure Sensitivity as a Function of Gender and Age
The mean age was 51 years for the entire sample, the same for the 347 women, and one year older for the 301 men. In both sexes the standard deviation of age was 21, its minimum 18, and its maximum 90 years (Table 1).
 |
Table 1 Number of Participants by Age Category and Gender |
The participants were less sensitive to pressure on the finger than on the ear lobe (median of differences = 4.0; mean of differences = 4.0 standard deviation of differences = 2.0). On the finger, the median was 1.5 in women and 1.0 in men (p = 0.249). As this difference of 0.5 points is half the smallest measurable unit, it is below clinical relevance. On the ear lobe, the median was 6.0 for women and 5.5 for men (p = 0.083). The largest sex-differences were 8% at the zero-level, ie, “no pressure pain at all”, and 7% at the three-point-level (Table 2).
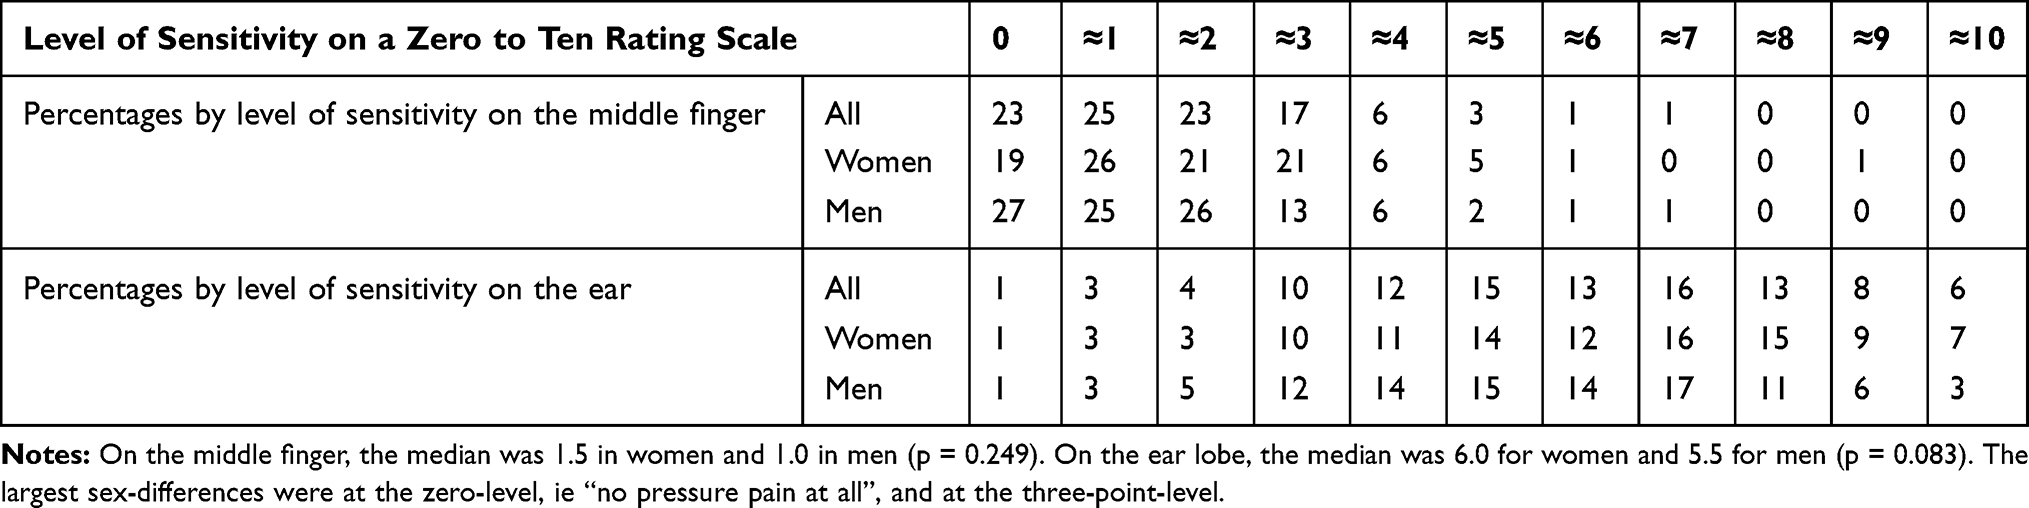 |
Table 2 Percentages by Level of Pressure Sensitivity, Measurement Site, and Gender |
On the middle finger, the fluctuating increase of pressure sensitivity from the age of 30 to 80 years was maximally one unit on the analogue pain rating scale, thereby indicating low clinical meaningfulness, if any. While the tenth percentile was always zero, the distance between the outer percentiles increased with the age, suggesting that pressure sensitivity is more variable with higher age. All 95% confidence bands were narrower than one measurement unit, thereby confirming sufficient statistical power to detect meaningful differences (Figure 3)
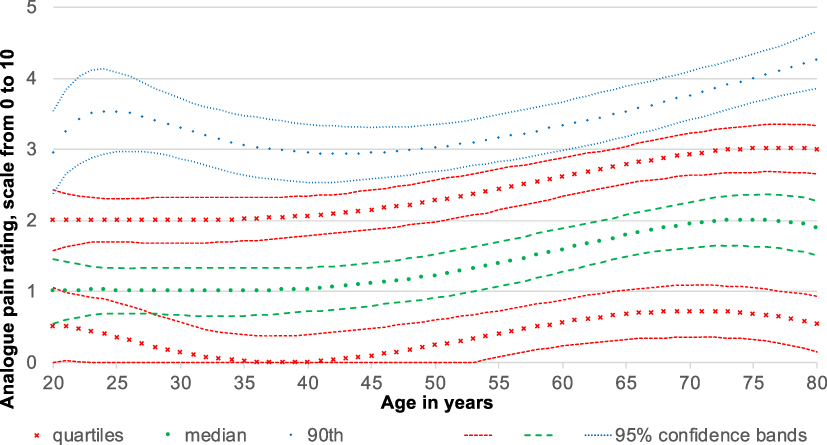 |
Figure 3 Pressure sensitivity on the middle finger in 648 healthy individuals. Provided that our sample is representative, 25% of the pain-free individuals are below the lower quartile, 25% are between the median and the adjacent quartile, and 10% are beyond the 90th centile. The middle lines are our estimates, and the 95% confidence bands indicate their statistical precision. Given that they are narrower than one measurement unit, the statistical uncertitude is smaller than the measurement uncertitude. Thus, the statistical power is sufficient. The median increase in pressure sensitivity starts with the age of 40 years and reaches its top difference of one measurement unit at the age of 75 years. The absolute minimal clinically important difference for 0 to 10 numeric rating scales is at least two units, and the relative minimal clinically important difference is 30%. In other words, the increase from 40 to 75 years is relatively relevant to its onset but absolutely, one point is too little to be meaningful for patients. |
On the ear lobe, the fluctuating increase of pressure sensitivity had the same magnitude as on the middle finger. The 95% confidence bands were slightly wider, yet still sufficiently narrow over most of the visualized age interval (Figure 4). The variance between individuals of different ages ranged from 1.2% (ear lobe of women) to 4.5% (ear lobe of men) of the entire variance, meaning that pressure sensitivity differed more between individuals of the same age than between different age groups. The p-values for the trend form the age of 20 to over 80 years varied between 0.071 on the middle finger of both sexes and 0.484 on the ear lobe of both sexes.
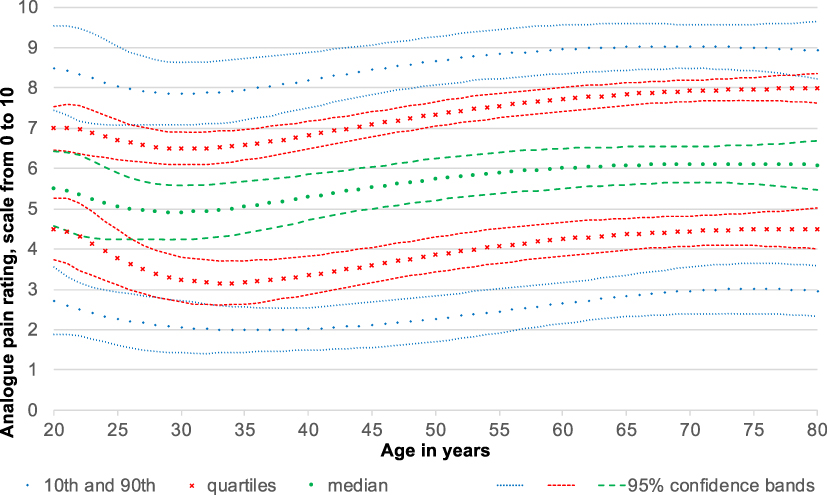 |
Figure 4 Pressure sensitivity on the ear lobe in 648 healthy individuals. Provided that our sample is representative, 25% of the pain-free individual are below the lower quartile, 25% are between the median and the median and the adjacent quartile, and 10% are beyond the 10th and 90th centile. The middle lines are our estimates, and the 95% confidence bands indicate their statistical precision. Given that they are narrower than one measurement unit, the statistical uncertitude is smaller than the measurement uncertitude. Thus, the statistical power is sufficient. The median of pressure sensitivity decreases from the age of 20 years to a minimum at 30 years and increases to its top difference of 1.2 measurement units at the age of 76 years. The absolute minimal clinically important difference for a zero to ten numeric rating scales is at least two measurement units, and the relative minimal clinically important difference is 30%. In other words, the increase from 30 to 76 years is neither relatively nor absolutely meaningful for the perception of patients. |
On the middle finger, the difference between the medians of women and men was less than one unit. There was no exception over the entire age interval from 20 to 80 years. In other words, women might be more pressure-sensitive than men, but then the difference is subliminal. The widths of the 95% confidence bands yield sufficient statistical power, and yet their overlapping shows that the difference is below statistical significance (Figure 5).
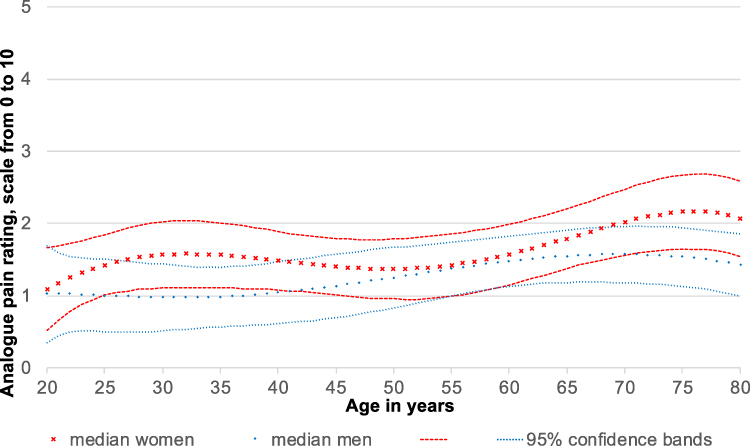 |
Figure 5 Pressure sensitivity on the finger in 347 women compared to 301 men. Provided that our sample is representative, the medians split the individuals of the respective gender in two equally large groups. The middle lines are our estimates, and the 95% confidence bands indicate their statistical precision. Due to the smaller number of individuals, the gender-specific confidence bands are wider than the overall confidence bands. However, they remain narrower than one unit. Thus, the gender-specific statistical power is sufficient, too. The difference between men and women fluctuates between zero and 0.6 units. This difference is below the individual perception of one unit and clearly below the minimal clinically important difference of two units. It is below statistical significance, too, as the 95% confidence bands overlap. The median increase in pressure sensitivity in men starts to increase with the age of 40 years and reaches its maximum difference of half a measurement unit at the age of 70 years. In women pressure sensitivity increases from 20 years to 32 years reaching a first peak followed by a slight dip and a second peek with 76 years with a maximum difference of 1.2 measurement units. |
On the ear lobe, the difference between the medians of women and men reached 1.6 units on the analogue pain rating scale within the interval from 40 to 50 years, which is clinically not meaningful.24 Outside of this age interval, the 95% confidence bands overlapped, showing again low statistical significance (Figure 6).
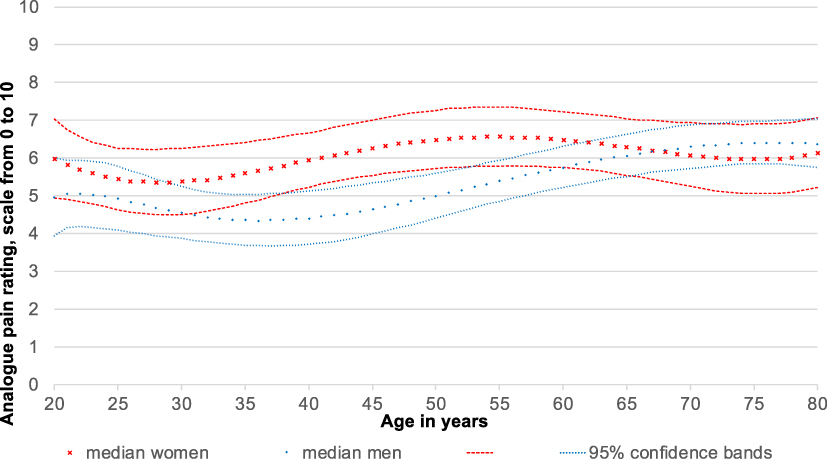 |
Figure 6 Pressure sensitivity on the ear lobe in 347 women compared to 301 men. Provided that our sample is representative, the medians split the individuals of the respective gender in two equally large groups. The middle lines are our estimates, and the 95% confidence bands indicate their statistical precision. Due to the smaller number of individuals, the gender-specific confidence bands are wider than the overall confidence bands. They are wider than one unit. The difference between men and women ranged between zero and 1.6 measurement units. The largest difference in pressure sensitivity between men and women is between 40 and 50 years. During this period, the sensitivity of both sexes increases. The absolute minimal clinically important difference for zero to ten numeric rating scales is at least two measurement units, and the relative minimal clinically important difference is 30%. In other words, the difference between women and men is not meaningful. |
Discussion
Our percentile curves confirm the results of previous studies; sensitivity to pressure increases with age, and, in contrast to previous results, the percentile curves visualize when this increase starts, when it ends, and, most notably, how small it is. Pressure sensitivity starts to increase with the age of 30 to 40 years and reaches its peak at the age of 75 years (Figures 3 and 4). The maximum difference is only one unit, which is the smallest change one individual can perceive within her- or himself. It is half as large as the MCID of the zero to ten pain rating scale, which is very frequently used for pain conditions but too seldomly used for induced pain.17,24 Some studies postulate that while the absolute MCID is two units, the relative MCID is 30%.29 In this case, the increase, which is the same on the finger as on the ear lobe regardless of the higher overall sensitivity on the ear lobe, would be more relevant on the ear lobe than on the finger. Nevertheless, it remains below individual perception.
Like the age-dependent increase, our percentile curves show that women indeed rate pressure higher than men, but the difference is very small. On the finger, it fluctuates between zero and 0.6 units depending on the age (Figure 5). On the ear lobe, it fluctuates between zero and 1.6 units (Figure 6). Again, this difference is always below the minimal clinically relevant difference and mostly even below individual perception. As the overlapping 95% confidence bands show, it is below statistical significance. Importantly, this is the case despite sufficient statistical power, as the confidence bands of the medians are narrower than one unit. In other words, the statistical precision of our percentile curves is higher than supraliminal human perception. Only in the ear lobe of men, we observed a meaningful increase of 2.1 units between 35 and 78 years (Figure 6). The increase of pain sensitivity in the women’s ear lobe is neither relatively nor absolutely meaningful.
Our study has two limitations. First, a random sample would represent the general population of pain-free individuals better than our stratified sample. Nevertheless, our strata included physically active persons (yoga schools and sport clubs) and patients with other conditions than pain. These strata were in turn stratified by sex and age. In other words, our sample was more representative than a pure convenience sample. Second, we assessed only the essential variables in order to minimize the physical and psychologic burden for the participants. We needed less than five minutes per participant without storing or else processing identifying information. This resulted in almost identical circadian circumstances for all participants. We refrained from completely satisfying our curiosity regarding ethnicity, employment, socio-economic status, education, physical activity, pain expectations, fear avoidance, mood, stress, circadian and local circumstances, hormonal influences such as menstruation, and other variables that might influence pain perception.30–32 We did so because our directed acyclic graphs showed possible mediatorion, as gender and age might influence the unknown variables, but no risk of bias, given that the unknown variables do not influence gender and age. This means that adjusting for any of these variables would increase the risk of bias rather than decreasing it. Stratifying by these variables would have been interesting, but we visualized pain perception by sex and age without studying the underlying mechanisms.
Another issue is that our findings were limited to tonic low-intensity pressure stimuli applied at the finger and ear lobe. However, a comparison of these two very different locations showed that the absolute sex differences and age fluctuations were the same. Relatively, they were different because people are generally more sensitive to pressure on the ear lobe than on the finger. These results indicate that in analogue pain rating, the absolute differences are more reliable than the relative differences. The results also indicate that analogue pain rating is more consistent across different locations than threshold algometry. For further advantages and disadvantages of other testing procedures, we refer to the introduction. We acknowledge that all procedures contribute to a more complete picture, and we contributed with a stronger focus on the relevance for the patients. Our results were determined in a large “pain-free” population of 648 participants. The sample size was selected in a way that clinically meaningful differences were statistically significant. Overall, the concordance between the actually observed percentages and the modelled percentile curves speaks for a high goodness of fit. The test protocol for this study had already been used in prior studies in order to facilitate comparisons, as recommended by several reviews.15,21,22,33
Threshold algometry studies comparing the kilopascal of healthy participants found that women were anywhere from equally sensitive to two times more sensitive to pain pressure than men.3,8,12,34-36 Studies comparing the seconds of tolerance of a constant pressure were in the same range.12,36 Generally, the difference between women and men seems smaller than the variance within the same gender.
Our findings are in line with previous findings and exactly the same as in a previous meta-analysis, as our women were 1.1 to 1.3 times more pressure sensitive than our men.9 The differences between women and men observed in previous studies were usually statistically significant, despite similar and often even smaller differences than in our study, and there were only a few exceptions.37,38 On one hand, this is surprising, as our study was larger than most previous studies. On the other hand, the detailed pictures we draw require more power than a mere comparison of means.
The women / men ratio of 1.3, as observed in finger algometry, translates to only a third point on an analogue pain rating scale from zero to ten. In more sensitive measurement locations, such as ear lobe algometry, the ratio diminishes to 1.1 or less and remains a third point on an analogue pain rating scale from zero to ten, regardless of age. For analogue pain rating scale, MCID must be approximately two points or 30% to reach clinical importance.17,24 This reflects the negligibility of differences.
Numeric and visual analogue scales have the advantage that their MCID are known. Visual analogue scales are plain with horizontal lines and only the ends have anchors. Respondents place a mark at some point on the line.39 On a 100 millimeter visual analogue scale, the smallest unit is one millimeter, which would allow to be more precise than with a numeric analogue scale; perhaps overly precise, namely more precise than the true discriminant ability of the patients. For both scales, the absolute MCID is around 20% of the entire range.14,29,40 If visual and numeric rating behaved equally, pain-free volunteers would have a 10mm average. This would mean men differed from women by 10% to 30%, which would translate to one to three millimeters. With sufficient sample size, even that difference would be statistically significant. To verify this assumption, we would like to encourage further studies on quantitative sensory testing of pain to use numeric analogue scales, as we did, as well as visual analogue scales, as nobody has done to date to our knowledge.
There are relatively few investigations on age-related changes in pain sensitivity response.41 Their findings suggest that pain perception decreases in old age, although they were generally equivocal.4,41,42 Previous studies comparing the pressure pain threshold in kilopascal of healthy participants found that elderly people were between equally and two times more sensitive to pressure than younger people.3,5,43-45 The test locations and age limits for distinguishing between “young” and “old” were inconsistent between the studies. This could also apply to our measurement method. However, our examination has the advantage that it does not represent absolute values, but rather calibrated in relation to the maximum imaginable pain at the respective location.
In an extensive PubMed search with the criteria “Pain”, “Age” “QST” and “PPT”, 21 of more than 100 screened articles were read and tabulated. None of these looked at age-dependent pressure sensitivity as something floatable rather than comparing two groups. For this reason, we believe that we were the first. On the finger, the median sensitivity had a minimum of one point from 20 to 45 years and a maximum of two points at 75 years. On the ear lobe, it had a minimum of five points at 30 years and a maximum of six points from 60 to 80 years. Again, the ratio strongly depends on the location, whereas the difference is always one point. The ratio is in line with previous findings that show higher pain sensitivity in higher age as it is between 1.2 and two measurement units, which is below MCID.3,45 However, a meta-analysis and other studies found the opposite, namely up to 12% more tenderness in the younger age group.46,47
The distance between the two quartiles on the finger fluctuated between 1.5 and 2.4 measurement units of the analogue pain rating scale. On the ear lobe, the distance between the quartiles fluctuated between 2.5 and 3.4 units, which is almost two times larger than the maximal difference between men and women and the maximal age-dependent increase. The widely spaced quartiles indicate another important fact that other factors, such as central sensitivity, are more relevant for pressure sensitivity than gender or age.21
In summary, the slightly, higher pressure sensitivity of women compared to men and the age-dependent increase are negligible; the differences are often not even one unit. Compared to a former study using the identical test protocol chronic pain without generalized hyperalgesia affects pressure sensitivity by several units, and the impact of chronic pain with generalized hyperalgesia is even higher.21 On the middle fingers and on ear lobes more than 90% of the 80 years old pain-free persons – women or men – still rate their sensitivity below the average of persons with generalized hyperalgesia (see the 90th centile). In other words, the difference between presence versus absence of central hyperalgesia is too large to be masked by gender or age fluctuations. This eases the diagnosis of central hyperalgesia and the task of all clinicians who monitor the progress of their therapy.
Conclusion
The influence of gender and age on pressure sensitivity is negligible compared to the influence of chronic pain and central hyperalgesia. It might trigger discussions about gender stereotypes, but it has no clinical relevance.
Acknowledgments
The authors thank Silvia Beurmann, PhD, for critical reading and the medical students Guilia Spotswood, Lisa Hartmeier, Silvia Thuraisingam and Christian Merz for the clinical tests.
Disclosure
The authors report no conflicts of interest in this work.
References
1. Binderup AT, Arendt-Nielsen L, Madeleine P. Pressure pain sensitivity maps of the neck-shoulder and the low back regions in men and women. BMC Musculoskelet Disord. 2010;11(1):1. doi:10.1186/1471-2474-11-234
2. Sullivan M, Tripp D, Santor D. Gender differences in pain and pain behavior: the role of catastrophizing. Cognit Ther Res. 2000;24(1):121–134. doi:10.1023/A:1005459110063
3. Petrini L, Matthiesen ST, Arendt-Nielsen L. The effect of age and gender on pressure pain thresholds and suprathreshold stimuli. Perception. 2015;44(5):587–596. doi:10.1068/p7847
4. Gibson SJ, Farrell M. A review of age differences in the neurophysiology of nociception and the perceptual experience of pain. Clin J Pain. 2004;20(4):227–239. doi:10.1097/00002508-200407000-00004
5. Lautenbacher S, Kunz M, Strate P, Nielsen J, Arendt-Nielsen L. Age effects on pain thresholds, temporal summation and spatial summation of heat and pressure pain. Pain. 2005;115(3):410–418. doi:10.1016/j.pain.2005.03.025
6. Racine M, Tousignant-Laflamme Y, Kloda LA, Dion D, Dupuis G, Choinière M. A systematic literature review of 10 years of research on sex/gender and experimental pain perception – part 1: are there really differences between women and men? Pain. 2012;153(3):602–618. doi:10.1016/j.pain.2011.11.025
7. Chesterton LS, Barlas P, Foster NE, Baxter GD, Wright CC. Gender differences in pressure pain threshold in healthy humans. Pain. 2003;101(3):259–266. doi:10.1016/S0304-3959(02)00330-5
8. Neziri AY, Scaramozzino P, Andersen OK, Dickenson AH, Arendt-Nielsen L, Curatolo M. Reference values of mechanical and thermal pain tests in a pain-free population. Eur J Pain. 2011;15(4):376–383. doi:10.1016/j.ejpain.2010.08.011
9. Andersen S, Petersen MW, Svendsen AS, Gazerani P. Pressure pain thresholds assessed over temporalis, masseter, and frontalis muscles in healthy individuals, patients with tension-type headache, and those with migraine – a systematic review. Pain. 2015;156(8):1409–1423. doi:10.1097/j.pain.0000000000000219
10. Baliki MN, Geha PY, Apkarian AV. Parsing pain perception between nociceptive representation and magnitude estimation. J Neurophysiol. 2009;101(2):875–887. doi:10.1152/jn.91100.2008
11. Castien RF, van der Wouden JC, De Hertogh W. Pressure pain thresholds over the cranio-cervical region in headache: a systematic review and meta-analysis. J Headache Pain. 2018;19(1):9. doi:10.1186/s10194-018-0833-7
12. Otto MW, Dougher MJ. Sex differences and personality factors in responsivity to pain. Percept Mot Skills. 1985;61(2):383–390. doi:10.2466/pms.1985.61.2.383
13. Hjermstad MJ, Fayers PM, Haugen DF, et al. Studies comparing numerical rating scales, verbal rating scales, and visual analogue scales for assessment of pain intensity in adults: a systematic literature review. J Pain Symptom Manage. 2011;41(6):1073–1093. doi:10.1016/j.jpainsymman.2010.08.016
14. Olsen MF, Bjerre E, Hansen MD, et al. Pain relief that matters to patients: systematic review of empirical studies assessing the minimum clinically important difference in acute pain. BMC Med. 2017;15(1):35. doi:10.1186/s12916-016-0775-3
15. Studer M, Stewart J, Egloff N, et al. [Psychosocial stressors and pain sensitivity in chronic pain disorder with somatic and psychological factors (F45.41)]. Schmerz. 2017;31(1):40–46. doi:10.1007/s00482-016-0159-9
16. Melia M, Geissler B, König J, et al. Pressure pain thresholds: subject factors and the meaning of peak pressures. Eur J Pain. 2019;23(1):167–182. doi:10.1002/ejp.1298
17. Farrar JT, Young JP, LaMoreaux L, Werth JL, Poole RM. Clinical importance of changes in chronic pain intensity measured on an 11-point numerical pain rating scale. Pain. 2001;94(2):149–158. doi:10.1016/S0304-3959(01)00349-9
18. Egloff N, Sabbioni MEE, Salathé C, Wiest R, Juengling FD. Nondermatomal somatosensory deficits in patients with chronic pain disorder: clinical findings and hypometabolic pattern in FDG-PET. Pain. 2009;145(1):252–258. doi:10.1016/j.pain.2009.04.016
19. Egloff N, Klingler N, von Känel R, et al. Algometry with a clothes peg compared to an electronic pressure algometer: a randomized cross-sectional study in pain patients. BMC Musculoskelet Disord. 2011;12(1):174. doi:10.1186/1471-2474-12-174
20. Cámara RJA, Merz C, Wegmann B, Stauber S, von Känel R, Egloff N. Cost-saving early diagnosis of functional pain in nonmalignant pain: a noninferiority study of diagnostic accuracy. Pain Res Treat. 2016;2016:1–7. doi:10.1155/2016/5964250
21. Egloff N, Cámara RJA, von Känel R, Klingler N, Marti E, Ferrari M-LG. Hypersensitivity and hyperalgesia in somatoform pain disorders. Gen Hosp Psychiatry. 2014;36(3):284–290. doi:10.1016/j.genhosppsych.2014.01.011
22. Stewart JA, Mailler-Burch S, Müller D, et al. Rethinking the criteria for fibromyalgia in 2019: the ABC indicators. J Pain Res. 2019;12:2115–2124. doi:10.2147/JPR.S205299
23. British Standards Institution. Accuracy (Trueness and Precision) of Measurement Methods and Results—part 5: Alternative Methods for the Determination of the Precision of a Standard Measurement Method. Vol. BS ISO. British Standards Institution: 1998; 5725. https://www.iso.org/obp/ui/#iso:std:iso:5725:-1:ed-1:v1:en.
24. Michener LA, Snyder AR, Leggin BG. Responsiveness of the numeric pain rating scale in patients with shoulder pain and the effect of surgical status. J Sport Rehabil. 2011;20(1):115–128. doi:10.1123/jsr.20.1.115
25. Cuzick J. A Wilcoxon-type test for trend. Stat Med. 1985;4(1):87–90. doi:10.1002/sim.4780040112
26. Bland JM, Altman DG. Statistical methods for assessing agreement between two methods of clinical measurement. Lancet. 1986;1(8476):307–310. doi:10.1016/S0140-6736(86)90837-8
27. Epanechnikov VA. Non-parametric estimation of a multivariate probability density. Soc Ind Appl Math. 1969;14(1):53–158.
28. Wang J, Yang L. Polynomial spline confidence bands for regression curves. Univ Illinois Chicago Michigan State Univ Stat Sinica. 2009;19:325–342.
29. Salaffi F, Stancati A, Silvestri CA, Ciapetti A, Grassi W. Minimal clinically important changes in chronic musculoskeletal pain intensity measured on a numerical rating scale. Eur J Pain. 2004;8(4):283–291. doi:10.1016/j.ejpain.2003.09.004
30. Jennings EM, Okine BN, Roche M, Finn DP. Stress-induced hyperalgesia. Prog Neurobiol. 2014;121:1–18. doi:10.1016/j.pneurobio.2014.06.003
31. Riskowski JL. Associations of socioeconomic position and pain prevalence in the United States: findings from the national health and nutrition examination survey. Pain Med. 2014;15(9):1508–1521. doi:10.1111/pme.12528
32. Aviram J, Shochat T, Pud D. Pain perception in healthy young men is modified by time-of-day and is modality dependent. Pain Med. 2015;16(6):1137–1144. doi:10.1111/pme.12665
33. Uddin Z, MacDermid JC. Quantitative sensory testing in chronic musculoskeletal pain. Pain Med. 2016;17(9):1694–1703. doi:10.1093/pm/pnv105
34. De Rui M, Marini I, Bartolucci ML, et al. Pressure pain threshold of the cervico-facial muscles in healthy elderly people: the role of gender, age and dominance. Gerodontology. 2015;32(4):274–280. doi:10.1111/ger.12117
35. Jensen R, Rasmussen BK, Pedersen B, Lous I, Olesen J. Cephalic muscle tenderness and pressure pain threshold in a general population. Pain. 1992;48(2):197–203. doi:10.1016/0304-3959(92)90059-K
36. Sarlani E, Grace EG, Reynolds MA, Greenspan JD. Sex differences in temporal summation of pain and aftersensations following repetitive noxious mechanical stimulation. Pain. 2004;109(1–2):115–123. doi:10.1016/j.pain.2004.01.019
37. Komiyama O, De Laat A. Tactile and pain thresholds in the intra- and extra-oral regions of symptom-free subjects. Pain. 2005;115(3):308–315. doi:10.1016/j.pain.2005.03.006
38. Isselée H, De Laat A, Lesaffre E, Lysens R. Short-term reproducibility of pressure pain thresholds in masseter and temporalis muscles of symptom-free subjects. Eur J Oral Sci. 1997;105(6):583–587. doi:10.1111/j.1600-0722.1997.tb00221.x
39. Funke F Internet-based measurement with visual analogue scales: an experimental investigation. Published online December 22, 2010.
40. Wickström K, Edelstam G. Minimal clinically important difference for pain on the VAS scale and the relation to quality of life in women with endometriosis. Sexual Reprod Healthcare. 2017;13:35–40. doi:10.1016/j.srhc.2017.05.004
41. El Tumi H, Johnson MI, Dantas PBF, Maynard MJ, Tashani OA. Age-related changes in pain sensitivity in healthy humans: a systematic review with meta-analysis. Eur J Pain. 2017;21(6):955–964. doi:10.1002/ejp.1011
42. Gibson SJ, Helme RD. Age-related differences in pain perception and report. Clin Geriatr Med. 2001;17(3):
43. Pickering G, Jourdan D, Eschalier A, Dubray C. Impact of age, gender and cognitive functioning on pain perception. Gerontology. 2002;48(2):112–118. doi:10.1159/000048937
44. Edwards RR, Fillingim RB. Age-associated differences in responses to noxious stimuli. J Gerontol a Biol Sci Med Sci. 2001;56(3):M180–M185. doi:10.1093/gerona/56.3.M180
45. Cole LJ, Farrell MJ, Gibson SJ, Egan GF. Age-related differences in pain sensitivity and regional brain activity evoked by noxious pressure. Neurobiol Aging. 2010;31(3):494–503. doi:10.1016/j.neurobiolaging.2008.04.012
46. Lautenbacher S, Peters JH, Heesen M, Scheel J, Kunz M. Age changes in pain perception: a systematic-review and meta-analysis of age effects on pain and tolerance thresholds. Neurosci Biobehav Rev. 2017;75:104–113. doi:10.1016/j.neubiorev.2017.01.039
47. Blankenburg M, Meyer D, Hirschfeld G, et al. Developmental and sex differences in somatosensory perception – a systematic comparison of 7- versus 14-year-olds using quantitative sensory testing. Pain. 2011;152(11):2625–2631. doi:10.1016/j.pain.2011.08.007
 © 2020 The Author(s). This work is published and licensed by Dove Medical Press Limited. The full terms of this license are available at https://www.dovepress.com/terms.php and incorporate the Creative Commons Attribution - Non Commercial (unported, v3.0) License.
By accessing the work you hereby accept the Terms. Non-commercial uses of the work are permitted without any further permission from Dove Medical Press Limited, provided the work is properly attributed. For permission for commercial use of this work, please see paragraphs 4.2 and 5 of our Terms.
© 2020 The Author(s). This work is published and licensed by Dove Medical Press Limited. The full terms of this license are available at https://www.dovepress.com/terms.php and incorporate the Creative Commons Attribution - Non Commercial (unported, v3.0) License.
By accessing the work you hereby accept the Terms. Non-commercial uses of the work are permitted without any further permission from Dove Medical Press Limited, provided the work is properly attributed. For permission for commercial use of this work, please see paragraphs 4.2 and 5 of our Terms.