")
Back to Journals » Diabetes, Metabolic Syndrome and Obesity » Volume 14
“Adjusting Internal Organs and Dredging Channel” Electroacupuncture Ameliorates Insulin Resistance in Type 2 Diabetes Mellitus by Regulating the Intestinal Flora and Inhibiting Inflammation
Authors Zhang L, Chen X, Wang H , Huang H, Li M, Yao L , Ma S, Zhong Z, Yang H , Wang H
Received 16 February 2021
Accepted for publication 13 May 2021
Published 9 June 2021 Volume 2021:14 Pages 2595—2607
DOI https://doi.org/10.2147/DMSO.S306861
Checked for plagiarism Yes
Review by Single anonymous peer review
Peer reviewer comments 2
Editor who approved publication: Prof. Dr. Juei-Tang Cheng
Liying Zhang,1,* Xinhua Chen,2,* Haili Wang,1 Haipeng Huang,1 Mengyuan Li,1 Lin Yao,1 Shiqi Ma,1 Zhen Zhong,1 Hongmei Yang,3 Hongfeng Wang4
1School of Acupuncture and Massage, Changchun University of Chinese Medicine, Changchun, Jilin, 130117, People’s Republic of China; 2Department of Acupuncture and Moxibustion, Affiliated Hospital of Changchun University of Chinese Medicine, Changchun, Jilin, 130021, People’s Republic of China; 3Jilin Ginseng Academy, Changchun University of Chinese Medicine, Jilin, 130117, People’s Republic of China; 4Northeast Asia Institute of Chinese Medicine, Changchun University of Chinese Medicine, Jilin, 130117, People’s Republic of China
*These authors contributed equally to this work
Correspondence: Hongmei Yang; Hongfeng Wang
Jilin Ginseng Academy, Changchun University of Chinese Medicine, 1035 Boshuo Road, Changchun, Jilin, 130117, People’s Republic of China
Tel/Fax +86 431 86763992
Email [email protected]
Hongfeng Wang
Northeast Asia Institute of Chinese Medicine, Changchun University of Chinese Medicine, 1035 Boshuo Road, Changchun, Jilin, 130117, People’s Republic of China
Tel/Fax +86 431 89912521
Email [email protected]
Introduction: Traditional Chinese acupuncture has been demonstrated to be beneficial for treatment of type 2 diabetes mellitus (T2DM). The mechanism of acupuncture on T2DM is crucial for their biological activity as well as their usefulness as tools in biology and medicine. However, its mechanism is poorly understood.
Methods: In an effort to explore the mechanism, eight db/db mice (a type of spontaneous T2DM mouse) were treated with adjusting internal organs and dredging channel electroacupuncture (AODCEA) for 2 weeks. Another eight db/db mice were fed as T2DM group (T2DMG), and eight db/m mice were set as normal control group (NCG). Lipopolysaccharide (LPS), interleukin-6 (IL-6), and diabetes-related indicators, such as fasting blood glucose (FBG) and triglyceride (TG), were detected by enzyme-linked immune sorbent assay (ELISA). The V4 region of 16S rRNA gene was analyzed by Illumina sequencing to evaluate the effect of AODCEA on intestinal flora. The amount of short-chain fatty acids (SCFAs) in the feces were determined by gas chromatography-mass spectrometry (GC-MS).
Results: Our results indicate that AODCEA treatment can reduce diabetes-related indicators. We observed the increased probiotics such as Blautia and Lactobacillus and decreased opportunist pathogens (Alistipes, Helicobacter, Prevotella) by AODCEA interventions. Importantly, the total amount of SCFAs in the feces of T2DM mice was promoted by AODCEA. Finally, obviously alleviated systemic inflammation was exhibited through AODCEA treatment by detection of lipopolysaccharide (LPS) and interleukin-6 (IL-6) in serum.
Conclusion: AODCEA can reshape the structure of intestinal flora, which can increase intestinal SCFAs, affect the circulating LPS level, and reduce the inflammatory response.
Keywords: gut microbiota, acupuncture, Type 2 diabetes mellitus, short-chain fatty acids, inflammation, insulin resistance
Introduction
Diabetes is an expanding global health problem. It is estimated that around 700 million people will suffer from diabetes by 2045.1 Type 2 diabetes mellitus (T2DM) characterized by insulin resistance is the most common type of diabetes. Modern pharmacological studies have shown that intestinal flora plays a vital role in the occurrence and development of T2DM.2,3 Intestinal bacteria can produce short-chain fatty acids (SCFAs), mainly including acetic acid, propionic acid, and butyric acid, by fermentation of carbohydrates in food residues. SCFAs can improve the acidic environment in the colon, inhibit the growth of harmful bacteria, and prevent intestinal dysfunction. SCFAs have been shown to play an anti-inflammatory role in diabetes through histone deacetylase (HDACs) inhibition.4 Meanwhile, gut microbiota can produce many substances that could induce inflammation in peripheral tissues. Those substances such as peptidoglycan and lipopolysaccharide (LPS) cause insulin resistance and T2DM when they enter the blood from the gut lumen.5–8 Fecal bacteria from T2DM mice transplanting into pseudo-germfree mice has induced diabetic-like changes.9 On the contrary, transplanting fecal bacteria from normal mice to db/db mice can improve metabolism.10 Hence, intestinal flora is considered as a new target for the treatment of diabetes.
Acupuncture is a traditional Chinese medicine therapy. It is believed that acupuncture can regulate the functions of organs through the meridians. Studies have shown that acupuncture can improve obesity and insulin sensitivity in patients with type 2 diabetes, and has a certain therapeutic effect on diabetes.11–13 “Adjusting internal organs and dredging channel” electroacupuncture (AODCEA) is a type of therapy established by our research group based on the theory of traditional Chinese medicine, and is mainly used for the treatment of diabetes and its complications. This treatment has been proved to improve the hyperglycemia of T2DM rats.14 Recent studies have shown that acupuncture can treat many diseases, such as insomnia, Parkinson’s disease, and depression15–17 by affecting intestinal microbiota. AODCEA may also be involved in regulating intestinal flora in the treatment of diabetes, but this process has not been proved.
Herein, we intended to investigate potential protective mechanism of AODCEA against T2DM, putting a special focus on gut microbiota and inflammation. The effect of AODCEA treatment on the composition of gut microbiota in db/db mouse was investigated by using 16S rRNA gene sequencing. Correlation analysis between T2DM-related metabolic factors and gut microbiota was also conducted to identify the key bacteria in ameliorating T2DM. Moreover, short-chain fatty acids (SCFA) content in feces was measured by gas chromatography-mass spectrometry (GC-MS). Finally, serum LPS and interleukin-6 (IL-6) levels were determined to test inflammation response after AODCEA treatment of db/db mice. To the best of our knowledge, we have demonstrated for the first time the detailed mechanism of AODCEA for treatment of T2DM, especially in gut microbiota and inflammation.
Materials and Methods
Animals and Group
Sixteen male db/db mice and 8 db/m mice (18–23 g, 7 weeks old) were purchased from the Health Science Center of Peking University (License No.: SCXK (Beijing) 2016–0010, Beijing, China). The mice lived in a specific-pathogen free (SPF) facility controlled in 12 h light/dark cycles, with climate-controlled rooms maintained at 22 ± 2 °C and 50–60% relative humidity. Animals had free access to food and water. In addition, food, water, and bedding are autoclaved. After adaptive feeding for one week, 16 db/db mice were randomly divided into an AODCEA intervention group (AODCEA, n = 8) and T2DM control group (T2DMG, n = 8), and 8 db/m mice were treated as a normal control group (NCG). All animal experimentation procedures were performed according to the Chinese Guidelines for Animal Care, which comply with the internationally accepted uses of experimental animals, and the protocols were reviewed and approved by the Animal Experiment Ethics Committee of Changchun University of Chinese Medicine.
Animal Experiment
During experiments, mice in the AODCEA group were administered AODCEA therapy for 20 minutes once daily for 6 days each week, with 1 day off, for 2 consecutive weeks. The selected acupoints included bilateral BL13 (Feishu), BL20 (Pishu), BL23 (Shenshu), LI4 (Hegu), LR3 (Taichong), ST36 (Zusanli), and SP6 (Sanyinjiao). The location of the acupressure points was determined on the basis of the acupuncture point map in experimental acupuncture.17 All acupuncture procedures were conducted using 10 mm acupuncture needles (Andy Medical Equipment Co. Ltd, Guizhou, China) to a depth of 4 mm at BL13, BL20 and BL23, to a depth of 1 mm at LI4 and LR3, to a depth of 3 mm at ST36, and to a depth of 1.5 mm at SP6. Acupoints were stimulated using a HuaTuo SDZ‐V Electric Acupuncture Therapy Apparatus (Suzhou Medical Appliance Factory, Suzhou, China). The acupoints of BL13 and BL23, as well as SP6 and LR3, were connected on the same side with a dilatational wave of 3 Hz (frequency ratio of 1:5) to stimulate the paarts of the body to the extent that could be tolerated by the mice. Mice in the T2DM group and NC group were only observed as controls.
During the course of the 2-week treatment, body weight and fasting blood glucose (FBG) were measured once per week. The animals were fasting for 12 hours before measuring blood glucose, and the blood was obtained from the tail vein. Fecal samples were collected at week 2 (from 8:00 am to 11:00 am). The collecting tubes were kept at a low temperature when collecting feces. After collecting enough feces, they were frozen in liquid nitrogen, and then transferred to a −80 °C freezer for the next analysis.
After AODCEA intervention, oral glucose tolerance test (OGTT) was performed on animals, and the specific operation was as follows: the animals were fasted overnight (12 h) and administered sterilized glucose solution (2 g/kg, Sigma–Aldrich, United States) by oral gavage. The glucose levels of the blood samples collected from the tail vein were measured at five different time points (0, 0.5, 1, 1.5 and 2 h) using a glucose-meter (OneTouch Two, ROCHE, Germany), and the area under the curve (AUC) of the OGTT was calculated.
After measuring glucose levels, the mice were anesthetized by breathing isoflurane, followed by sample collection for further analysis. Serum aliquots were prepared from blood samples collected by cardiac puncture which were stored at room temperature for 2 h, followed by being centrifuged at 3000 rpm for 10 min at 4 °C (Thermo Fisher, ST40R, United States). Serum aliquots were collected into a clean tub. Colon tissues were harvested, and the colon contents were cleaned with normal saline and then soaked in 4% paraformaldehyde solution for the next examination.
Detection of Diabetes-Related Indexes, LPS, and IL-6 by ELISA
The content of triglyceride, low density lipoprotein cholesterol (LDL-C), and LPS in serum were determined using enzyme-linked immunosorbent assay kit (Cloud Clone Corp. Product Number: SEB006Mu, SEB107Mu and SEB526Ge). Serum concentration of IL-6 was measured with mouse IL-6 ELISA kit (Beyotime Biotechnology Co., Ltd., Product Number: PI326). The serum fasting insulin (FINS) content was detected using mouse FINS ELISA kit (Jiangsu Cote Biological Technology Co. Ltd., Product Number: KT2579). The homeostasis model assessment-insulin resistance (HOMA-IR) index was calculated with the formula: (FBG value × FINS value)/22.5, and the HOMA-β index was calculated with the formula: 20 × FINS value/(FBG value - 3.5).
16S rDNA Sequencing and Data Analysis
DNA was extracted from 0.5 g of mice fecal samples using the E.Z.N.A.® Stool DNA kit (D4015, Omega, Inc., USA). The V4 region of the bacterial small-subunit (16S) rRNA gene was amplified with slightly modified versions of primers 515F (5ʹ-GTGYCAGCMGCCGCGGTAA-3ʹ) and 806R (5ʹ-GGACTACHVGGGTWTCTAAT-3ʹ). The 5ʹ ends of the primers were tagged with specific barcodes per sample and sequencing universal primers.
PCR amplification was performed in a total volume of 25 µL reaction mixture containing 25 ng of template DNA, 12.5 µL PCR premix, and 2.5 µL of each of the primers. The PCR conditions to amplify the prokaryotic 16S fragments were as follows: initial denaturation at 98 °C for 30 seconds, followed by 35 cycles of denaturation at 98 °C for 10 seconds, annealing at 54 °C/52 °C for 30 seconds, and extension at 72 °C for 45 seconds, and final extension at 72 °C for 10 minutes. The PCR products were purified by AMPure XT beads (Beckman Coulter Genomics, Danvers, MA, USA) and quantified by Qubit (Invitrogen, USA). Purified amplicons were pooled in equimolar and were paired-end sequenced (2 × 250) on an Illumina Hiseq2500 platform according to the standard protocol.
Determination of SCFAs in Feces by GC-MS
Reagent Preparation
2-ethylbutyric acid (Sigma, Product Number: 109959) was diluted with diethyl ether (Sigma, Product Number: 309966) as an internal standard solution of 0.1 mmol/L. Acetic acid (Sigma, Product Number: 100063) was diluted into eight different concentrations of standard solution by diethyl ether, and the concentrations were 0.05, 0.1, 0.15, 0.2, 0.25, 0.3, 0.35, 0.4 mmol/L. Each standard solution preparation method of propionic acid (Sigma, Product Number: 402907), butyric acid (Sigma, Product Number: 402907) and valeric acid (Sigma, Product Number: 240370) is the same as acetic acid.
Sample Preparation
0.2 g of feces was dissolved in 0.5 mL distilled water in a centrifuge tube, swirled for 1 min, centrifuged at 10,000 r/min for 5 min, and then the supernatant was taken out, filtered and put into a new centrifuge tube. 50 μL of 50% sulfuric acid solution and 750 μL of internal standard were added to the centrifuge tube, followed by being swirled for 1 min, being centrifuged at 10,000 r/min for 5 min, and standing at 4 °C for 30 min. In the end, the upper solution (1 mL) was taken for subsequent analysis.
GC-MS Parameters
A Thermo ScientificTM TraceTM 1310 gas chromatography system coupled to a Thermo ScientificTM TSQ 8000 inert MSD quadrupole mass spectrometer (Thermo Fisher Scientific, USA) and equipped with an TR-FFAP capillary column (30 m × 0.25 × 0.25 μm, Thermo Fisher Scientific, USA) was used to perform an analysis of SCFAs from fecal samples. The solution obtained in 4.5.2 section was injected in a split mode into the column, and the split ratio was 10:1. Helium was used as the carrier gas at a constant flow rate of 1 mL/min. The initial oven temperature was 40 °C, which was maintained for 2 min and then raised to 200 °C at a rate of 10 °C/min. The temperature of the ion source was 250 °C, and the temperatures of the injector was 230°C. The mass detector system was operated in an electron impact (EI) mode with an ionization energy of 70 eV. The ions were monitored from m/z 10 to 100. A quantitative analysis was performed using Thermo Xcalibur software.
Histopathological Examination
The colonic tissues fixed with paraformaldehyde were successively soaked in gradient alcohol solvents (80%, 90%, 95%, 100%) and xylene for dehydration. And then tissue blocks were embedded in paraffin, sectioned, mounted on slides, dewaxed with xylene, and hydrated using the same gradient alcohol solvents as those used in the dehydration process. The tissues were stained with hematoxylin and eosin (H&E) (Sigma–Aldrich, Product Number: MHS16 and 318906), then dehydrated with the same gradient alcohol solves as described above and sealed with neutral gum. The histopathological features were observed under light microscope (OLYMPUS, IX73, Japan).
Statistical Analysis
Data were expressed as mean ± standard error (SD) in each group. Statistical analyses were performed using the SPSS software (SPSS 20.0, SPSS Inc., United States). One-way analysis of variance (ANOVA) with LSD post hoc tests were used to compare the groups. p < 0.05 was considered statistically significant. Correlations between diabetes-related parameters and bacterial compositions were assessed by Spearman correlation testing.
Results
AODCEA Treatment Alleviated Diabetes-Related Indicators of Db/Db
In order to evaluate the effects of AODCEA on T2DM mice, we monitored the body weight, FBG, and some other diabetes-related parameters in each group. Before intervention (week 0), the values of body weight and fasting blood glucose of mice in the T2DM group and the AODCEA group were significantly higher than those in the NC group, and there was no significant difference between the two former groups. However, compared with T2DM group, the body weight and FBG were significantly reduced in the AODCEG group after 2 weeks of AODCEA intervention (Figure 1A and B). OGTT was used to determine the effect of AODCEA therapy on glucose metabolism in mice. The OGTT curve showed that blood glucose in the AODCEA group was lower at each time point, and the peak time of blood glucose in the T2DM group was clearly delayed in comparison with that in the AODCEA group (Figure 1C). Meanwhile, the area under the OGTT curve (AUC) in the AODCEA group was also smaller than that in the T2DM group (Figure 1D). These results indicated that AODCEA can improve the abnormal glucose tolerance in db/db mice.
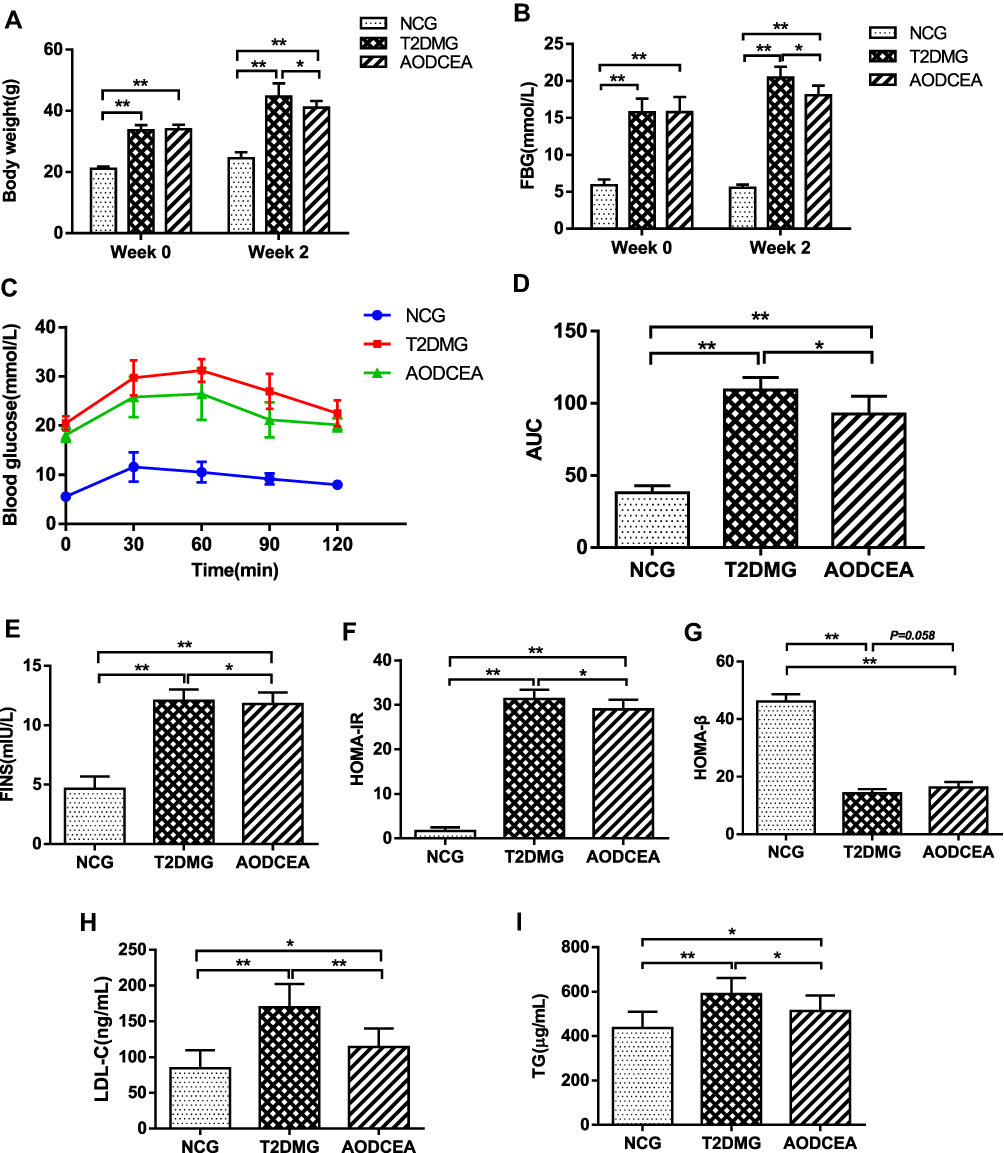 |
Figure 1 Effects of AODCEA on general indicators of diabetes. (A) Body weight and (B) FBG changes before and after AODCEA intervention. (C) Blood glucose values at each time point of OGTT; (D) AUC was calculated according to the OGTT curve. (E) Serum insulin levels was determined after treatment; (F) HOMA-IR index was calculated from the following formula: HOMA-IR = FINS × FBG/22.5; (G) HOMA-β index was calculated from the formula: 20 × FINS/(FBG-3.5). Triglycerides (TG) (H) and low density lipoprotein cholesterol (LDL-C) (I) levels in mice serum were analyzed using ELISA kit. Data are expressed as means ± SD. Differences were assessed by ANOVA followed by LSD post hoc test and denoted as follows: *p < 0.05, **p < 0.01 (n = 8). |
In order to identify the effect of AODCEA treatment on IR and to evaluate the function of islet β cells, HOMA-IR and HOMA-β indexes were also calculated based on FINS concentration in mouse serum. There was no significant difference in fasting insulin levels between the T2DM and AODCEA groups (Figure 1E). The result showed significant improvement in IR by AODCEA therapy as reflected by lower HOMA-IR index (Figure 1F). As for HOMA-β index, although there was no statistically significant difference between the T2DM group and the AODCEA group, the values in the AODCEA group were slightly higher (Figure 1G).
Furthermore, AODCEA treatment significantly inhibited the increase in serum triglyceride (TG) and low-density lipoprotein cholesterol (LDL-C) levels in the AODCEA group compared to those in the T2DM group, indicating the improvement effect of T2DM with dyslipidemia (Figure 1H and I).
Overall Structure Modulation of Gut Microbiota Among Different Groups
The V4 region of bacterial 16S rRNA gene commonly used in the study of gut microbiota was analyzed by MiSeq platform to examine the impact of AODCEA on gut microbiota composition. After removing unqualified sequences, a total of 975,468 high quality sequences were obtained from 24 fecal samples. And 1152 operational taxonomic units (OTUs) were used for subsequent analysis. The α-diversity index of gut microbiota, including Shannon index, Simpson index, and rarefaction curve, were evaluated (Figure 2A–C). As shown in Figure 2A and B, the Shannon index and Simpson index in the T2DM group is increased significantly compared with the NCG and the AODCEA group. The same trend was observed for OUTs, the number of OUTs in the T2DM group was also higher than that in either the AODCEA group or NCG (Figure 2C). These results means that the α-diversity of intestinal flora existing in T2DM increased, and AODCEA can change this tendency. It should be pointed out that the rarefaction curve analysis has reached a stable value in current sequencing, as shown in Figure 2C, meaning that the sequencing depth has covered the rare new phenotypes and species as much as possible. Besides, an obvious clustering for each group was showed by principal-coordinate analysis (PCoA) based on Bray-Curtis distance (Figure 2D).
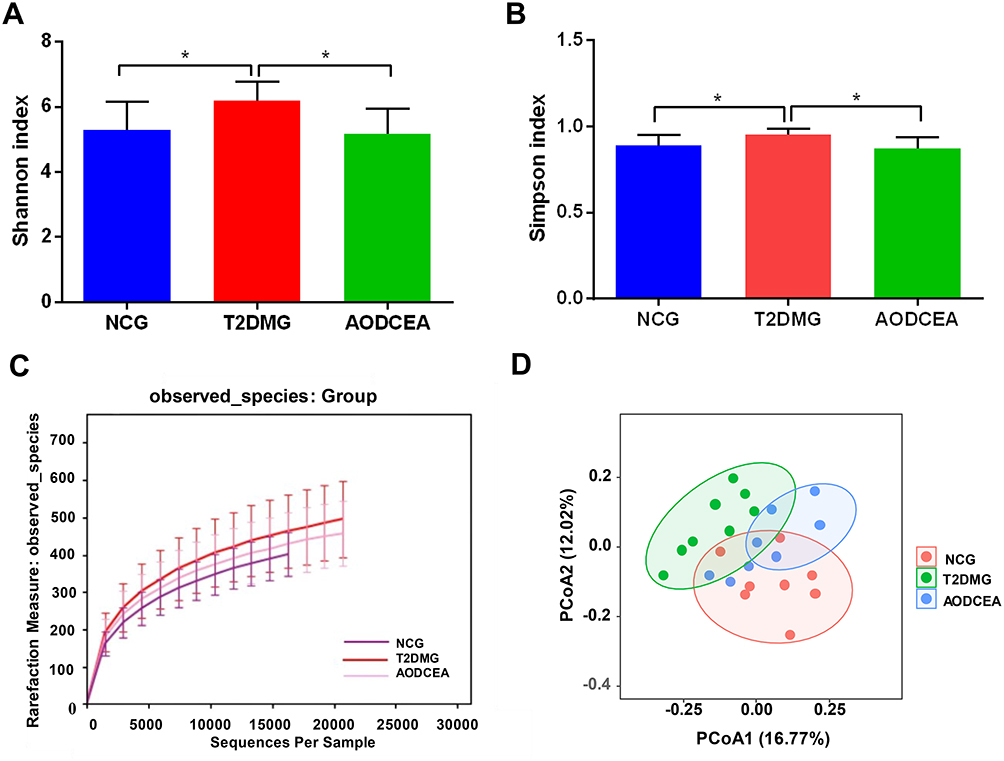 |
Figure 2 Diversity of fecal microbiota among the NCG, T2DMG, and AODCEA group. Shannon index (A) and Simpson index (B) (data expressed as mean ± SD); (C) rarefaction analyses; and (D) unweight UniFrac-based PCoA. Differences were evaluated by ANOVA with LSD post hoc test and denoted as follows: *P < 0.05 (n = 8). |
We analyzed the flora sequences of the three groups at the phylum level, and the relative abundances of the top 11 phyla in each sample are shown in Figure 3. And the relative abundances of four primary phyla (Firmicutes, Bacteroidetes, Proteobacteria, and Actinobacteria) in each group is listed in Table 1. In contrast to the T2DMG group, the AODCEA group displayed significantly increased Firmicutes and significantly decreased Bacteroidetes. To summarize, taxonomic profiling demonstrated that AODCEA treatment could modulate the gut microbiota structure of T2DM mice into similar levels in NCG.
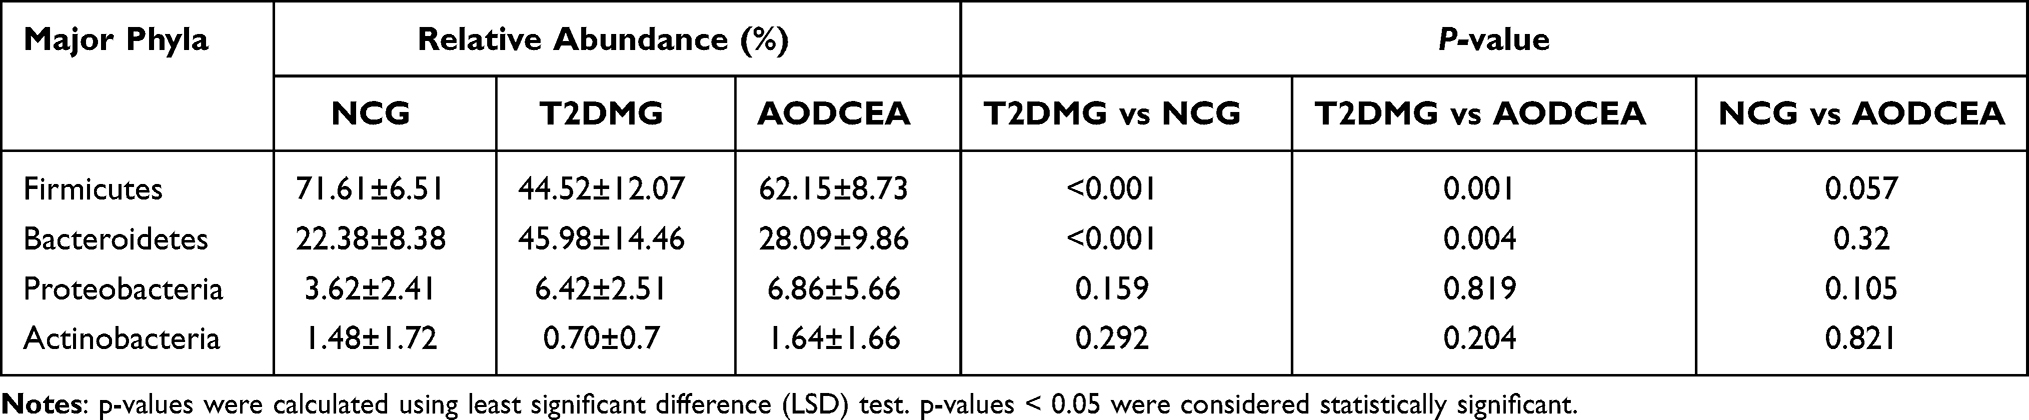 |
Table 1 Relative Abundance of Four Major Bacteria Phyla Among Three Groups |
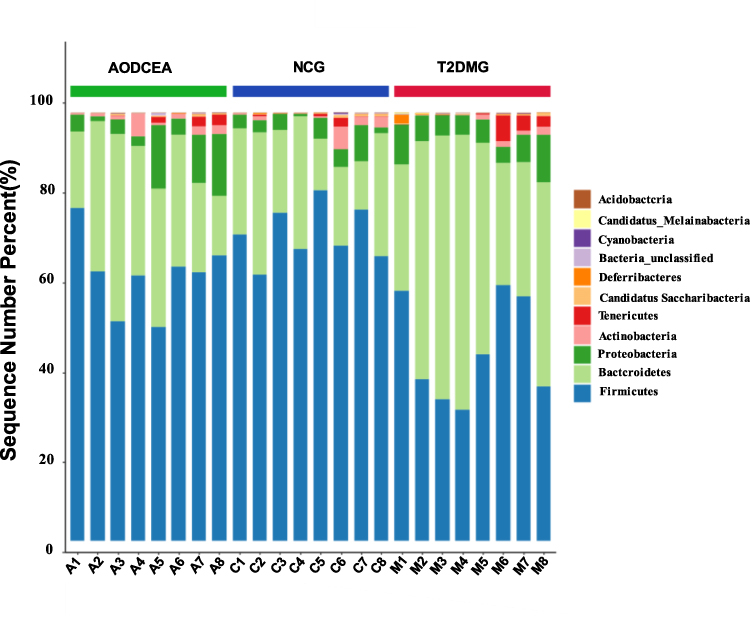 |
Figure 3 Comparison of the feces microbial community among three groups in the phylum level. |
Key Phenotypes Responding to the AODCEA Treatment in T2DM
To further explore the key phenotypes of AODCEA’s efficacy, we used multiple comparative analyses to identify specific changes in intestinal microbiota (genus level). A total of 5 bacteria showed significant changes (Figure 4A-E). Blautia and Lactobacillus were significantly reduced in the T2DM group compared with NCG. Interestingly, similar levels of these two bacteria in the NC group were observed in AODCEA group (Figure 4A and B). The other bacteria, including Alistipes, Helicobacter, and Prevotella increased significantly in the T2DM group, while they decreased significantly in the AODCEA group (Figure 4C-E).
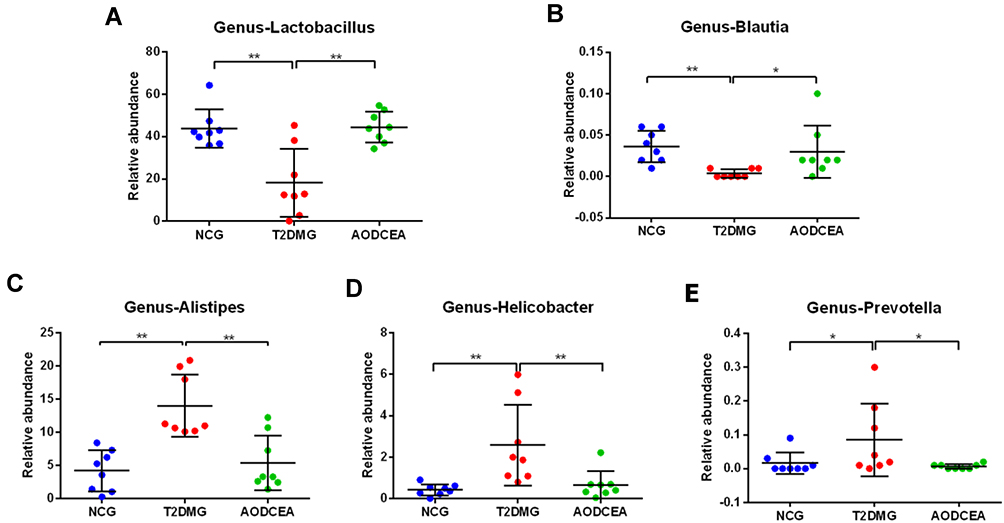 |
Figure 4 Differences in the composition of the gut microbiota at genus levels among three groups. (A) Lactobacillus, (B) Blautia, (C) Alistipes, (D) Helicobacter, (E) Prevotella. Data are shown as mean ± SD values, *P < 0.05, **P < 0.01 (n = 8). |
AODCEA Affects the Content of SCFAs Metabolized by Intestinal Flora
SCFAs, carboxylic acids defined by aliphatic tail of two to six carbons, are critical contributors to host health and gut/immune homeostasis, produced following the fermentation of dietary fiber and resistant starches by gut bacteria. SCFAs can improve the acidic environment in the colon, inhibit the growth of harmful bacteria. In recent years, studies have confirmed that SCFAs can inhibit the production of pro-inflammatory factors, which is conducive to the repair of mucosal inflammation and could depress the inflammatory reaction.18–20 In order to investigate the effect of AODCEA on the content of SCFAs metabolized by intestinal flora, GC-MS was used to detect the concentrations of acetic acid, propionic acid, butyric acid, and valeric acid (Figure 5). The results showed that the concentrations of acetic acid and butyric acid in the feces of the AODCEA group were significantly increased in contrast with those in the T2DM group (Figure 5A and C), while propionic acid and valeric acid had no significant difference among the 3 groups (Figure 5B and D). In addition, we also calculated the concentration of total SCFAs in each group. The results indicated that the concentration of total SCFAs in the T2DM group was significantly lower than that in the NCG, and this phenomenon could be improved by the AODCEA intervention (Figure 5E).
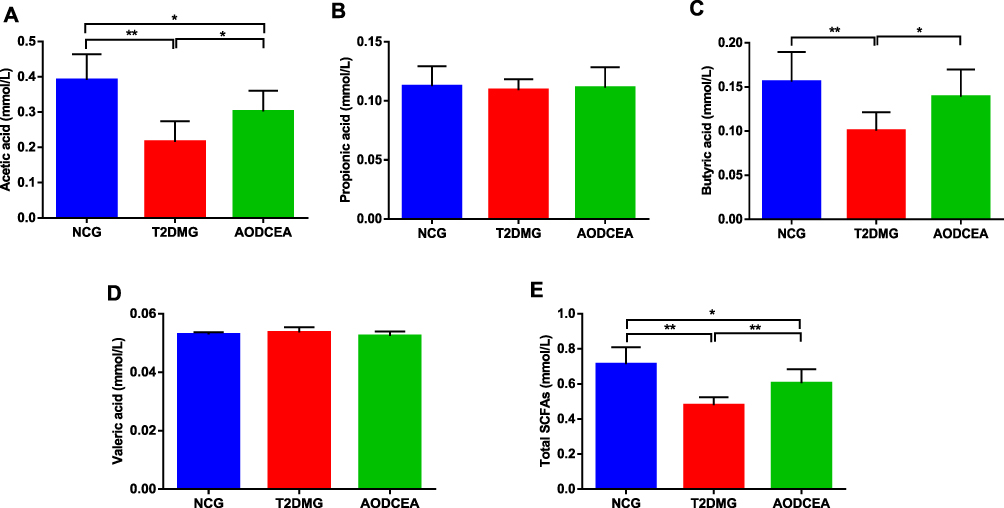 |
Figure 5 Effect of AODCEA intervention on the concentration of SCFAs in feces. (A) Acetic acid, (B) propionic acid, (C) butyric acid, (D) valeric acid, and (E) total SCFAs. Values are shown as mean ± SD values (n = 8). *P < 0.05, **P < 0.01. |
AODCEA Treatment Alleviates Inflammatory Response of db/db
The severity of colonic inflammation was evaluated by histopathological analysis. In the T2DM group mice, colon tissue presented obvious mucosal inflammatory, goblet cells and epithelial damage, while colons from the AODCEA‐treated group showed markedly less histological damage (Figure 6A). In addition, serum LPS and IL-6 levels were also measured in each group to estimate systemic inflammation. Compared with NCG, T2DMG had notably higher serum concentrations of LPS and IL-6, but AODCEA intervention remarkably decreased the associated inflammatory markers, and alleviated systematic inflammation (Figure 6B and C).
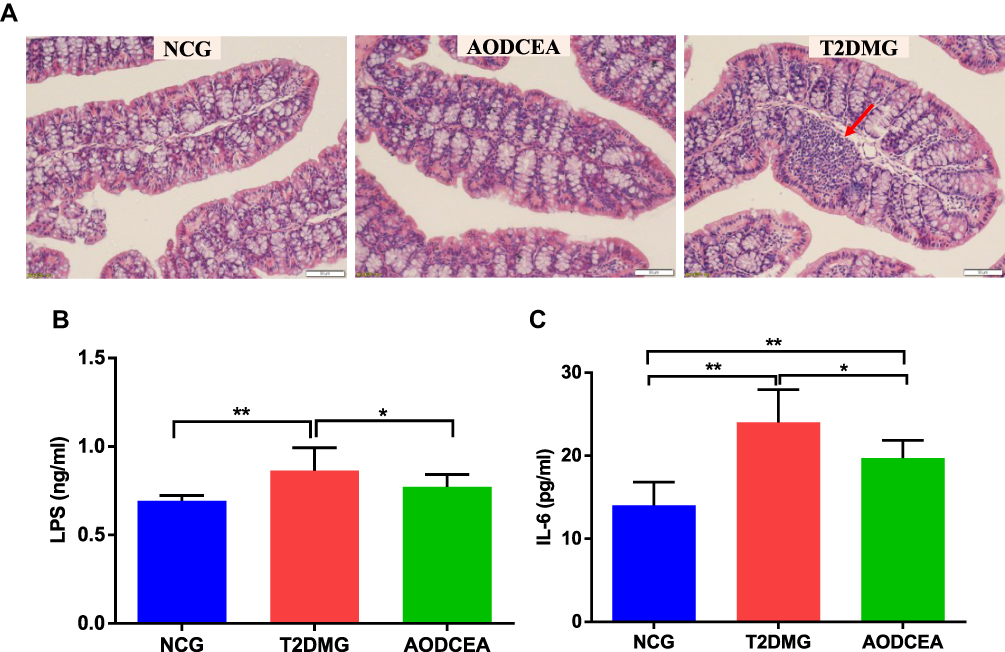 |
Figure 6 Influence of AODCEA interventation on inflammation. (A) Inflammatory infiltration of the intestinal was identified by HE staining, and a significant inflammatory infiltrate is shown as the red arrow. Serum LPS (B) and IL-6 (C) were detected by ELISA kit. Data are shown as means ± SEM of three independent experiments and were evaluated by ANOVA with LSD post hoc tests. *p < 0.05, **p < 0.01 (n = 8). |
Correlation of Gut Microbiota with Metabolic Parameters of T2DM
Correlation heatmap analysis was applied to assess the association between gut microbiota and T2DM-related indicators, including body weight, FBG, 2-hour blood glucose of OGTT, FINS, HOMA-IR, HOMA-β, TG, LDL-C (Figure 7). Based on this heatmap, we found that Blautia and Lactobacillus were negatively correlated with metabolic indexes (except HOMA-β), while the other bacteria (including Alistipes, Helicobacter, and Prevotella) were positively associated with metabolic indexes (except HOMA-β).
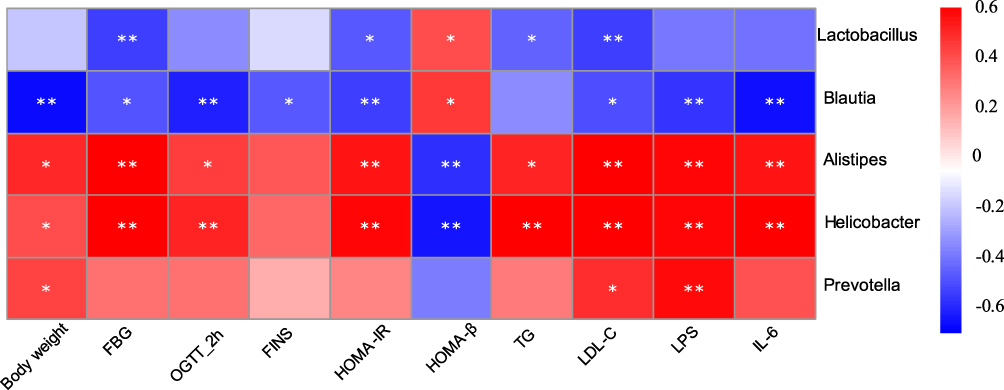 |
Figure 7 Correlation analysis between gut microbiota and T2DM-related biomedical factors in mice. Heatmap of correlation between the alterations in gut microbial population and the changes in host parameters related to FBG, blood lipid, LPS, and inflammatory factor. Pearson correlation values were used for the matrix. Significant correlations were noted by *p < 0.05, and **p < 0.01. |
Discussion
Although various experimental models are used in the study of T2DM, db/db mice are confirmed as a rodent model due to their similar symptoms to clinical T2DM.21 Transplant of db/db mouse feces into pseudo-germ-free mice led to increase body weight, blood sugar, food and water intake,22 demonstrating the effect of a disturbance of intestinal flora on T2DM. Therefore, it is reasonable for us to use db/db mice as the research object to explore the mechanism about gut microbiota in the efficacy of acupuncture on T2DM.
Obesity, hyperglycemia, and dyslipidemia are typical symptoms of T2DM. In our study, AODCEA reduced the body weight and FBG of db/db mice (Figure 1A and B). Moreover, it can ameliorate the dyslipidemia by reducing TG and LDL-C (Figure 1H and I). Meanwhile, the results from OGTT showed the ability of AODCEA for improving glucose tolerance in db/db mice (Figure 1C). Insulin resistance is one of the most important determinants in T2DM pathogenesis.23–25 AODCEA significantly reduced the HOMA-IR index of db/db mice, indicating that AODCEA therapy has an improvement effect on insulin resistance (Figure 1F), which is in good agreement with the reports in a number of animal and clinical trials.26,27
The intestinal flora, which is considered to be a new, complex organ composed of 500–1000 species and 1014 bacteria,28 participates in the metabolism of food, drugs, and other substances of the host, and plays an important role in maintaining the biological function of the host.29 However, its beneficial effect depends on maintaining a proper balance between potentially pathogenic bacteria and numerous nonpathogenic microorganisms.30 In this study, the composition of intestinal flora tested by 16S sequencing showed that the α-diversity were decreased in both the NCG and AODCEA groups compared with that in the T2DM group (Figure 2A and B). Further, the result of PCoA revealed that AODCEA treatment could affect the intestinal flora structure of T2DM, which was closer to the intestinal flora structure of NCG (Figure 2D).
The normal intestinal flora is mainly composed of anaerobic bacteria, which can be divided into 6 phyla, Firmicutes (Lactobacillus, Enterococcus, Clostridium), Bacteroidetes, Proteobacteria (Enterobacteria), Actinobacteria (Bifidobacterium), Fusobacteria, and Verrucomicrobia, and the first four phyla accounts for 98% of the total intestinal flora, the percentages of the four former phyla are 64%, 23%, 8%, and 3% respectively.31 Studies have shown that in overweight and T2DM people or mice, Firmicutes is decreased while Bacteroidetes is increased.32–36 By AODCEA theraphy, intestinal Bacteroidetes clearly decreased, and Firmicutes obviously increased (Figure 3). More importantly, the two most prevalent phyla belong to different groups in clinical classification in accordance with Gram staining, i.e, Firmicutes are Gram-positive and Bacteroidetes are Gram-negative bacteria. Lactobacillus, the dominant bacteria in Firmicutes, is also a well-known intestinal probiotic. Feeding diabetic animals Lactobacillus has reduced oxidative stress.37 In one randomized controlled clinical trial, the administration of Lactobacillus casei (belonged to Lactobacilllus) has improved hyperglycemia in patients with T2DM,38 and another randomized controlled clinical trial also showed that the administration of probiotics (including a large number of Lactobacillus) has improved HOMA-IR and reduced abdominal fat in T2DM patients.39 In our study, Lactobacillus levels in experimental animals were increased after AODCEA treatment (Figure 4), and the bacteria were significantly negatively correlated with FBG, HOMA-IR index, TG and LDL-C (Figure 7).
Blautia, belonging to the family Lachnospiraceae of phylum Firmicutes, could ferment carbohydrates and produce acetate and butyrate, and then produce energy for the organism.40,41 Many studies have shown that Blautia is negatively correlated with age, obesity, and T2DM.42–44 We found that the abundance of Blautia was significantly increased after AODCEA treatment of T2DM (Figure 4), in accordance with the report that Blautia has a clear benefit for diabetes.45 Similar to Lactobacillus, Blautia was found to be negatively correlated with blood glucose, HOMA-IR, body weight, TG, and LDL-C (Figure 7). In comparison with the diabetic group, the AODCEA could significantly reduce the abundance of these opportunity-pathogenic bacteria (Figure 4).
Lower levels of SCFAs in the intestinal tract lead to a weakened inhibition of histone deacetylase (HDAC), increased activity of nuclear transcription factor NF-κB, and the incremental release of inflammatory factors such as IL-6, IL-8, and TNF-α by neutrophils and macrophages.46 Other groups also have reported that SCFAs have significant anti-inflammatory effects in human macrophages47 and human peripheral blood mononuclear cells.48 In our study results, acetic acid, butyric acid, and total SCFAs in the AODCEA group were significantly increased (Figure 5A, C, and E), probably resulting from the increased Lactobacillus and Blautia that can produce acetic acid and butyric acid.
Low-grade inflammation is an important factor for insulin resistance.49,50 Blocking inflammation can improve insulin sensitivity.51 IL-6, in particular, has a strong positive correlation with T2DM in a meta-analysis.52 Blocking IL-6 and IL-6 signaling pathways to prevent inflammatory diseases may be an effective strategy for the treatment of insulin resistance and T2DM.53 LPS is a major component of gram-negative bacterial outer membranes.54 The binding of LPS to TLR4 can activate an extensive cell signaling pathway that induces the inflammatory response and cytokine expression and secretion (including IL-6), thereby promoting insulin resistance.55 In our study, AODCEA greatly improved macroscopic inflammatory infiltration observed in the intestinal tissue of T2DM mice, and conspicuously decreased LPS and IL-6 levels in circulation (Figure 6B and C). Furthermore, our study suggested that Alistipes, Helicobacter, and Prevotella were positively correlated with LPS and IL-6 (Figure 7), in perfect agreement with the results as previously reported.56–58
Conclusion
In conclusion, AODCEA can regulate the structure of intestinal flora, mainly by upregulating the abundance of Firmicutes (Gram-positive) and down-regulating Bacteroidetes (Gram-negative). Reshaping intestinal microflora structure further increased intestinal SCFAs, affected the circulating LPS level, and reduced the inflammatory response, leading to treatment of T2DM. Consequently, this study opens the way to a more rational treatment of T2DM by AODCEA technology.
Abbreviations
AODCEA, adjusting internal organs and dredging channel; ANOVA, analysis of variance; AUC, the area under the curves; ELISA, enzyme-linked immune sorbent assay; FBG, fasting blood glucose; FINS, fasting insulin; GC-MS, gas chromatography-mass spectrometry; HOMA-IR, homeostatic model index-insulin resistant; IL-6, interleukin-6; IL-8, interleukin-8; LDL-C, low-density lipoprotein cholesterol; LPS, lipopolysaccharide; NCG, normal control group; OGTT, oral glucose tolerance test; OTUs, operational taxonomic units; PCoA, principal coordinates analysis; PCR, polymerase chain reaction; qPCR, real-time quantitative polymerase chain reaction; SCFAs, short-chain fatty acids; SPSS, Statistical Product and Service Solutions; T2DM, type 2 diabetes mellitus; T2DMG, type 2 diabetic model group; TG, triglycerides; TNF-α, tumor necrosis factor-α.
Data Sharing Statement
The 16S rRNA gene data generated in this study were submitted to NCBI GenBank database under the accession number MW667592-MW668459.
Funding
This work was supported by the National Natural Science Foundation of China (Grant Nos. 81874502 and 82074548).
Disclosure
The authors declare no conflicts of interest for this work.
References
1. Cho N,H, Shaw JE, Karuranga S, et al. IDF Diabetes Atlas: global estimates of diabetes prevalence for 2017 and projections for 2045. Diabetes Res Clin Pract. 2018;138:271–281. doi:10.1016/j.diabres.2018.02.023
2. Song S, Lee JE. Dietary patterns related to triglyceride and high-density lipoprotein cholesterol and the incidence of Type 2 diabetes in Korean Men and Women. Nutrients. 2018;11:8.
3. Jeon J, Jang J, Park K. Effects of consuming calcium-rich foods on the incidence of Type 2 diabetes mellitus. Nutrients. 2019;11:31.
4. Noureldein MH, Bitar S, Youssef N, Azar S, Eid AA. Butyrate modulates diabetes-linked gut dysbiosis: epigenetic and mechanistic modifications. J Mol Endocrinol. 2020;64:29–42.
5. Saad MJ, Santos A, Prada PO. Linking gut microbiota and inflammation to obesity and insulin resistance. Physiology (Bethesda). 2016;31:283–293.
6. Ma Q, Li Y, Li P, et al. Research progress in the relationship between type 2 diabetes mellitus and intestinal flora. Biomed Pharmacother. 2019;117:109138.
7. Salguero MV, Al-Obaide MAI, Singh R, Siepmann T, Vasylyeva TL. Dysbiosis of Gram-negative gut microbiota and the associated serum lipopolysaccharide exacerbates inflammation in type 2 diabetic patients with chronic kidney disease. Exp Ther Med. 2019;18:3461–3469.
8. Brar PC, Kohn B. Use of the microbiome in the management of children with type 2 diabetes mellitus. Curr Opin Pediatr. 2019;31:524–530.
9. Yu F, Han W, Zhan G, et al. Abnormal gut microbiota composition contributes to the development of type 2 diabetes mellitus in db/db mice. Aging (Albany NY). 2019;23:10454–10467.
10. Zhang PP, Li LL, Han X, et al. Fecal microbiota transplantation improves metabolism and gut microbiome composition in db/db mice. Acta Pharmacol Sin. 2020;41:678–685.
11. Chen C, Liu J, Sun M, Liu W, Han J, Wang H. Acupuncture for type 2 diabetes mellitus: a systematic review and meta-analysis of randomized controlled trials. Complement Ther Clin Pract. 2019;36:100–112.
12. Liu M, Chen J, Ren Q, et al. Acupuncture and related techniques for type 2 diabetes mellitus: a systematic review protocol. Medicine (Baltimore). 2019;98:e14059.
13. Liang F, Koya D. Acupuncture: is it effective for treatment of insulin resistance? Diabetes Obes Metab. 2010;12:555–569.
14. Pan H, Huang H, Zhang L, Ma S, Yang H, Wang H. “Adjusting internal organs and dredging channel” electroacupuncture treatment prevents the development of diabetic peripheral neuropathy by downregulating glucose-related protein 78 (GRP78) and caspase-12 in streptozotocin-diabetic rats. J Diabetes. 2019;11:928–937.
15. Hong J, Chen J, Kan J, Liu M, Yang D. Effects of acupuncture treatment in reducing sleep disorder and gut microbiota alterations in PCPA-induced insomnia mice. Evid Based Complement Alternat Med. 2020;2020:3626120.
16. Jang JH, Yeom MJ, Ahn S, et al. Acupuncture inhibits neuroinflammation and gut microbial dysbiosis in a mouse model of Parkinson’s disease. Brain Behav Immun. 2020;89:641–655.
17. Liu S, Guo R, Liu F, Yuan Q, Yu Y, Ren F. Gut microbiota regulates depression-like behavior in rats through the neuroendocrine-immune-mitochondrial pathway. Neuropsychiatr Dis Treat. 2020;16:859–869.
18. Tolhurst G, Heffron H, Lam YS, et al. Short-chain fatty acids stimulate glucagon-like peptide-1 secretion via the G-protein-coupled receptor FFAR2. Diabetes. 2012;61:364–371.
19. Koh A, De Vadder F, Kovatcheva-Datchary P, Bäckhed F. From dietary fiber to host physiology: short-chain fatty acids as key bacterial metabolites. Cell. 2016;65:1332–1345.
20. Sawicki CM, Livingston KA, Obin M, Roberts SB, Chung M, McKeown NM. Dietary fiber and the human gut microbiota: application of evidence mapping methodology. Nutrients. 2017;9:125.
21. Li K, Zhang L, Xue J, et al. Dietary inulin alleviates diverse stages of type 2 diabetes mellitus via anti-inflammation and modulating gut microbiota in db/db mice. Food Funct. 2019;10:1915–1927.
22. Yu F, Jiang R, Han W, et al. Gut microbiota transplantation from db/db mice induces diabetes-like phenotypes and alterations in Hippo signaling in pseudo germ-free mice. Aging (Albany NY). 2020;12:24156–24167.
23. Patel TP, Rawal K, Bagchi AK, et al. Insulin resistance: an additional risk factor in the pathogenesis of cardiovascular disease in type 2 diabetes. Heart Fail Rev. 2016;21:11–23.
24. Wiweko B, Indra I, Susanto C, Natadisastra M, Hestiantoro A. The correlation between serum AMH and HOMA-IR among PCOS phenotypes. BMC Res Notes. 2018;11:114.
25. Neth BJ, Insulin Resistance CS. Alzheimer’s disease: bioenergetic linkages. Front Aging Neurosci. 2017;9:345.
26. Li J, Wu W, Stener-Victorin E, et al. A prospective pilot study of the effect of acupuncture on insulin sensitivity in women with polycystic ovary syndrome and insulin resistance. Acupunct Med. 2020;38:310–318.
27. Wu L, Chen X, Liu Y, et al. Role of acupuncture in the treatment of insulin resistance: a systematic review and meta-analysis. Complement Ther Clin Pract. 2019;37:11–22.
28. Salgaço MK, Oliveira LGS, Costa GN, Bianchi F, Sivieri K. Relationship between gut microbiota, probiotics, and type 2 diabetes mellitus. Appl Microbiol Biotechnol. 2019;103:9229–9238.
29. Ballet C, Correia MSP, Conway LP, et al. New enzymatic and mass spectrometric methodology for the selective investigation of gut microbiota-derived metabolites. Chem Sci. 2018;9:6233–6239.
30. Hooper LV, Gordon JI. Commensal host-bacterial relationships in the gut. Science. 2001;292:1115–1118.
31. Tremaroli V, Bäckhed F. Functional interactions between the gut microbiota and host metabolism. Nature. 2012;489:242–249.
32. Carvalho BM, Guadagnini D, Tsukumo DML, et al. Modulation of gut microbiota by antibiotics improves insulin signalling in high-fat fed mice. Diabetologia. 2012;55:2823–2834.
33. Collado MC, Isolauri E, Laitinen K, Salminen S. Distinct composition of gut microbiota during pregnancy in overweight and normal-weight women. Am J Clin Nutr. 2008;88:894–899.
34. Larsen N, Vogensen FK, van den Berg FW, et al. Gut microbiota in human adults with type 2 diabetes differs from non-diabetic adults. PLoS One. 2010;5:e9085.
35. Henao-Mejia J, Elinav E, Jin C, et al. Inflammasome-mediated dysbiosis regulates progression of NAFLD and obesity. Nature. 2012;482:179–185.
36. Schwiertz A, Taras D, Schäfer K, et al. Microbiota and SCFA in lean and overweight healthy subjects. Obesity (Silver Spring). 2010;18:190–195.
37. Zeng Z, Yuan Q, Yu R, Zhang J, Ma H, Chen S. Ameliorative effects of probiotic lactobacillus paracasei NL41 on insulin sensitivity, oxidative stress, and beta-cell function in a Type 2 DIABETES MELLITUS RAT MODEL. Mol Nutr Food Res. 2019;63:e1900457.
38. Khalili L, Alipour B, Asghari JM, et al. The effects of lactobacillus casei on glycemic response, Serum Sirtuin1 and Fetuin-A levels in patients with Type 2 diabetes mellitus: a randomized controlled trial. Iran Biomed J. 2019;23:68–77.
39. Sabico S, Al-Mashharawi A, Al-Daghri NM, et al. Effects of a multi-strain probiotic supplement for 12 weeks in circulating endotoxin levels and cardiometabolic profiles of medication naïve T2DM patients: a randomized clinical trial. J Transl Med. 2017;15:249.
40. Park SK, Kim MS, Bae JW. Blautia faecis sp. nov Isolated from Human Faeces. Int J Syst Evol Microbiol. 2013;63:599–603.
41. Park SK, Kim MS, Roh SW, Bae JW. Blautia stercoris sp. nov. Isolated from Human. Faeces Int J Syst Evol Microbiol. 2012;62:776–779.
42. Kasai C, Sugimoto K, Moritani I, et al. Comparison of the gut microbiota composition between obese and non-obese individuals in a Japanese population, as analyzed by terminal restriction fragment length polymorphism and next-generation sequencing. BMC Gastroenterol. 2015;15:100.
43. Rondanelli M, Giacosa A, Faliva MA, Perna S, Allieri F, Castellazzi AM. Review on microbiota and effectiveness of probiotics use in older. World J Clin Cases. 2015;3:156–162.
44. Inoue R, Ohue-Kitano R, Tsukahara T, et al. Prediction of functional profiles of gut microbiota from 16S rRNA metagenomic data provides a more robust evaluation of gut dysbiosis occurring in Japanese type 2 diabetic patients. J Clin Biochem Nutr. 2017;61:217–221.
45. Murri M, Leiva I, Gomez-Zumaquero JM, et al. Gut microbiota in children with type 1 diabetes differs from that in healthy children: a case-control study. BMC Med. 2013;11:46.
46. Tan J, McKenzie C, Potamitis M, Thorburn AN, Mackay CR, Macia L. The role of short-chain fatty acids in health and disease. Adv Immunol. 2014;121:91–119.
47. Kendrick SF, O’Boyle G, Mann J, et al. Acetate, the key modulator of inflammatory responses in acute alcoholic hepatitis. Hepatology. 2010;51:1988–1997.
48. Usami M, Kishimoto K, Ohata A, et al. Butyrate and trichostatin A attenuate nuclear factor kappaB activation and tumor necrosis factor alpha secretion and increase prostaglandin E2 secretion in human peripheral blood mononuclear cells. Nutr Res. 2008;28:321–328.
49. Xu L, Kitade H, Ni Y, Ota T. Roles of chemokines and chemokine receptors in obesity-associated insulin resistance and nonalcoholic fatty liver disease. Biomolecules. 2015;5:1563–1579.
50. Almuraikhy S, Kafienah W, Bashah M, et al. Interleukin-6 induces impairment in human subcutaneous adipogenesis in obesity-associated insulin resistance. Diabetologia. 2016;59:2406–2416.
51. Ghorpade DS, Ozcan L, Zheng Z, et al. DPP4 in obesity promotes adipose inflammation and insulin resistance. Nature. 2018;555:673–677.
52. Liu C, Feng X, Li Q, Wang Y, Li Q, Adiponectin HM. TNF-α and inflammatory cytokines and risk of type 2 diabetes: a systematic review and meta-analysis. Cytokine. 2016;86:100–109.
53. Rehman K, Akash MSH, Liaqat A, Kamal S, Qadir MI, Rasul A. Role of interleukin-6 in development of insulin resistance and Type 2 diabetes mellitus. Crit Rev Eukaryot Gene Expr. 2017;27:229–236.
54. Satoh T, Akira S. Toll-like receptor signaling and its inducible proteins. Microbiol Spectr. 2016;4.
55. Medzhitov R, Horng T. Transcriptional control of the inflammatory response. Nat Rev Immunol. 2009;9:692–703.
56. Kang Y, Li Y, Du Y, et al. Konjaku flour reduces obesity in mice by modulating the composition of the gut microbiota. Int J Obes (Lond). 2019;43:1631–1643.
57. Yuan L, Li X, He S, Gao C, Wang C, Shao Y. Effects of natural flavonoid isoorientin on growth performance and gut microbiota of mice. J Agric Food Chem. 2018;66:9777–9784.
58. Pedersen HK, Gudmundsdottir V, Nielsen HB, et al. Human gut microbes impact host serum metabolome and insulin sensitivity. Nature. 2016;535:376–381.
 © 2021 The Author(s). This work is published and licensed by Dove Medical Press Limited. The full terms of this license are available at https://www.dovepress.com/terms.php and incorporate the Creative Commons Attribution - Non Commercial (unported, v3.0) License.
By accessing the work you hereby accept the Terms. Non-commercial uses of the work are permitted without any further permission from Dove Medical Press Limited, provided the work is properly attributed. For permission for commercial use of this work, please see paragraphs 4.2 and 5 of our Terms.
© 2021 The Author(s). This work is published and licensed by Dove Medical Press Limited. The full terms of this license are available at https://www.dovepress.com/terms.php and incorporate the Creative Commons Attribution - Non Commercial (unported, v3.0) License.
By accessing the work you hereby accept the Terms. Non-commercial uses of the work are permitted without any further permission from Dove Medical Press Limited, provided the work is properly attributed. For permission for commercial use of this work, please see paragraphs 4.2 and 5 of our Terms.