")
Back to Journals » Journal of Asthma and Allergy » Volume 13
Action of 1,25(OH)2D3 on Human Asthmatic Bronchial Fibroblasts: Implications for Airway Remodeling in Asthma
Authors Plesa M , Gaudet M, Mogas A, Olivenstein R, Al Heialy S, Hamid Q
Received 7 May 2020
Accepted for publication 11 July 2020
Published 12 August 2020 Volume 2020:13 Pages 249—264
DOI https://doi.org/10.2147/JAA.S261271
Checked for plagiarism Yes
Review by Single anonymous peer review
Peer reviewer comments 3
Editor who approved publication: Dr Amrita Dosanjh
Maria Plesa,1 Mellissa Gaudet,1 Andrea Mogas,1 Ronald Olivenstein,1,2 Saba Al Heialy,1,3 Qutayba Hamid1,2,4
1Translational Research in Respiratory Diseases, Meakins-Christie Laboratories, Research Institute of the McGill University Health Center, Montréal, QC, Canada; 2Faculty of Medicine, McGill University, Montréal, QC, Canada; 3Mohammed Bin Rashid University of Medicine and Health Sciences, College of Medicine, Dubai, United Arab Emirates; 4College of Medicine, University of Sharjah, Sharjah, United Arab Emirates
Correspondence: Qutayba Hamid
Translational Research in Respiratory Diseases, Meakins-Christie Laboratories, Research Institute of the McGill University Health Centre, 1001 Boulevard Decarie, Montréal, QC H4A 3J1, Canada
Tel +1-514-934-1934 ext 76121
Email [email protected]
Background: Airway fibroblasts are major contributors to the histopathological feature of airway remodeling in asthma by their implication in the cell invasiveness and profibrogenic secretory phenotype observed in subepithelial fibrosis. 1,25 Dihydroxy vitamin D3 (1,25(OH)2D3) is an important therapeutic agent that blocks many features of airway remodeling induced by profibrogenic mediators, such as transforming growth factor beta 1 (TGF-β 1) or T helper type 1 inflammatory cytokines.
Objective: We hypothesized that 1,25(OH)2D3 opposes the TGF-β 1 or tumor necrosis factor alpha (TNF-α)-Interleukin 1 beta (IL-1β) stimulation on airway fibroblast profibrogenic secretory phenotype observed in severe asthmatic patients. Our aim was to investigate the anti-fibrogenic effect of 1,25(OH)2D3 in TGF-β 1 or TNF-α-IL-1β-stimulated human bronchial fibroblast cells (HBFCs) from severe asthmatic compared with non-asthmatic subjects.
Patients and Methods: All experiments were performed on primary HBFCs from asthmatic (DHBFCs, n=4) and non-asthmatic subjects (NHBFCs, n=4). mRNA expression and protein quantification of key fibrogenic markers were analyzed by RT-qPCR and ELISA, comparing HBFCs from asthmatic and non-asthmatic subjects. Vitamin D receptor (VDR) mRNA expression and its functionality in HBFCs were assessed by RT-qPCR. HBFCs proliferation was assessed by flow cytometry using BrdU-FITC/7AAD bivariate staining, while HBFCs apoptosis by Annexin V-FITC/7AAD.
Results: VDR is constitutively expressed in HBFCs and the addition of 1,25(OH)2D3 significantly increased mRNA expression of CYP24A1 (a direct VDRs’ target gene) in both HBFCs groups. DHBFCs cultured in the presence of TGF-β 1 or TNF-α-IL-1β showed increased mRNA expression and protein secretion of fibrogenic markers when compared to NHBFCs. Additionally, we observed decreased mRNA expression of FN 1, LUM, BGN, MMP2, COL5A1, TIMP1 and CC-chemokines (CCL2, CCL5, CCL11) in response to 1,25(OH)2D3 addition to the TGF-β 1 or TNF-α-IL-1β-stimulated HBFCs. Cell culture media obtained from TGF-β 1 or TNF-α-IL-1β-stimulated DHBFCs showed decreased protein secretion (fibronectin 1, lumican, MCP1, RANTES and eotaxin-1) in response to 1,25(OH)2D3 when compared to NHBFCs. 1,25(OH)2D3 inhibited proliferation in TGF-β 1-stimulated HBFCs through G0/G1 cell cycle arrest and these effects were not correlated with the induction of apoptosis.
Conclusion: DHBFCs under TGF-β 1 or TNF-α-IL-1β stimulation showed higher fibrogenic capacity when compared to NHBFCs. 1,25(OH)2D3 significantly blocked these effects and highlight 1,25(OH)2D3 as a possible therapeutic target for severe asthma.
Keywords: 1,25(OH)2D3, 1,25 dihydroxy vitamin D3 or calcitriol, asthma airway remodeling, fibrogenic markers, human airway fibroblasts, cell proliferation, apoptosis
Introduction
Airway remodeling observed in patients with severe asthma causes airflow limitations due to irreversible structural changes to the airway wall. Subepithelial layer and the reticular basement membrane thickening due to extracellular matrix (ECM) deposition are the most airway structural changes described in airway remodeling.1
An increased number of fibroblasts were observed in the submucosal region of the airway in patients with asthma and they are actively involved in subepithelial fibrosis manifesting an invasive proliferative and secretory phenotype increasing the ECM deposition. TGF-β1 and TNF-α are key profibrogenic mediators and they are abundantly produced in airway remodeling environment.2,3 In vitro studies have demonstrated that TGF-β1 stimulation triggers fibroblast proliferation and together with TNF-α promote fibroblasts’ transformation into fibrogenic and highly secretory myofibroblasts.4 Additionally, it has been shown that TNF-α exerts an either direct or indirect CC-chemokine secretory action which promotes the recruitment of inflammatory cells into the airways.5
1,25(OH)2D3 and derivatives have been the focus of considerable research efforts in airway remodeling due to their combined anti-inflammatory and anti-fibrotic actions.6–8 Considering the large number of inflammatory genes regulated by 1,25(OH)2D3, most of the known biological actions of 1,25(OH)2D3 in asthma are likely mediated by the vitamin D receptor (VDR).9 VDR is constitutively expressed by airway cells7 and is only capable of binding to its biologically active form, 1,25(OH)2D3.10 Upon ligand binding, VDR exerts either direct or indirect immunomodulatory effects on varied cellular processes, such as inflammation, cell growth, proliferation, differentiation, and apoptosis.11
The antifibrotic effects of 1,25(OH)2D3 have been described in animal models of asthma12 and several potential pathways have been described.13,14 Most of the described pathways demonstrated a potential effect of 1,25(OH)2D3 on signaling mechanisms mediated by TGF-β1 or TNF-α, such as smad2 phosphorylation, mitogen-activated protein kinase (MAPK) or nuclear factor-kappa B (NF-kB) pathways,14–16 therefore blocking the expression of many inflammatory genes and the upregulation of fibrogenic markers. Numerous studies have documented that 1,25(OH)2D3 derivatives could also have an effect on the cell proliferation/cycle progression and induce apoptosis in varied normal and diseased cells.17–19 Pro-apoptotic effects of 1,25(OH)2D3 had been observed in peripheral blood mononuclear cells (PBMCs) isolated from inflammatory bowel disease (IBD) patients,18 as well in various cancer cell lines.19,20 By contrast, an anti-apoptotic effect of 1,25(OH)2D3 has been reported in PBMCs isolated from systemic lupus erythematosus (SLE) patients and in liver hepatocytes of rat allografts.17,21
The effect of 1,25(OH)2D3 in HBFCs in the context of TGF-β1 induced airway remodeling has not yet been described. Herein, we investigated the antifibrotic effect of 1,25(OH)2D3, in TGF-β1 or TNF-α-IL-1β-stimulated human bronchial fibroblast cells (HBFCs) isolated from asthmatic (DHBFCs) and non-asthmatic (NHBFCs) subjects. We hypothesized that TGF-β1 or TNF-α-IL-1β would stimulate the mRNA expression and protein secretion of fibrogenic markers in cultured HBFCs and 1,25(OH)2D3 addition opposes these effects. Among the fibrogenic markers upregulated by TGF-β1 and TNF-α mediators,5,8,22,23 we investigated the effect of 1,25(OH)2D3 on mRNA expression of specific gene signatures, such as FN1 (fibronectin 1), LUM (lumican), BGN (biglycan), COL5A1 (Collagen Type V Alpha 1 Chain), MMP2 (matrix metallopeptidase 2), TIMP1 (Metallopeptidase Inhibitor 1), CCL2 (chemokine (C-C motif) ligand 2, gene encoding monocyte chemoattractant (MC) protein 1), CCL5 (chemokine (C-C motif) ligand 5, also referred to as RANTES) and CCL11 (chemokine (C-C motif) ligand 11, also referred to as eotaxin-1). At the protein level, we investigated a subset of class-related fibrogenic markers (ECM proteins, proteoglycans, or CC-chemokines), such as fibronectin, lumican, MCP1, RANTES and eotaxin-1. We further performed a series of in vitro experiments to investigate whether 1,25(OH)2D3 might directly modulate cell proliferation and apoptosis in HBFCs. Our results suggest a decreased rate of in vitro induced fibrosis, and the potential of 1,25(OH)2D3 to protect against airway tissue remodeling in vivo.
Patients and Methods
Human Sample Characteristics
The DHBFCs (n=4) were isolated from bronchial biopsies of severe asthmatic patients. The isolation of the fibroblast cells from bronchial biopsies was part of the Fibroblast Bank approved by the RI-MUHC Research Ethics Board (12–279 BMA). All asthmatic patients signed a written informed consent form to participate in the Fibroblast Bank. This study has been conducted in accordance with the Declaration of Helsinki. The asthmatic patients were classified as severe asthmatics according to the ERS/ATS guidelines24 and presented the following clinical characteristics: age = 41 ± 9.7 years, male/female = 2/2; forced expiratory volume at 1 s (FEV1)-PRE (L/%) = 2.38 ± 0.65/73 ± 17, forced vital capacity (FVC)-POST (L/%) = 3.35 ± 0.46/85 ± 8.08, FEV1/FVC = 0.71 ± 0.13. Like medication, all asthmatic patients received Ventolin, nasal steroids, Alvesco, Advair Diskus 500 or Advair HFA 250 and they had no smoking history. The NHBFCs (n=4) were commercially purchased (LONZA, CC-2512; ScienCell, CP3420; ATCC, CCD-8Lu and CCD-16Lu) and isolated from non-asthmatic which presented the following clinical characteristics: age 37 ± 9.6 years, male/female = 2/2, and with no history of any respiratory illness.
Isolation and Characterization of DHBFCs
Briefly, each bronchial biopsy was rinsed with phosphate‐buffered saline (PBS), then covered with a sterile glass coverslip and sealed with vacuum grease to a 10 cm Petri dish. Then, Roswell Park Memorial Institute (RPMI) medium supplemented with 20% fetal bovine serum (FBS) and 1% antibiotic antimycotic solution (100 U/mL penicillin G sodium, 100 U/mL streptomycin, and 0.25 g/mL amphotericin B) was added to cover the biopsy and placed at 37° C in a humidified 5% CO2–95% atmosphere to allow the cells to explant and populate the Petri dish. Culture media was changed every 2 or 3 days with fresh 20% FBS/RPMI supplemented with 24.4 mM (Minimum Essential Media) MEM Sodium Pyruvate (Gibco, Cat 11,360–070), 2.4 mM MEM Non-essential Amino acids (Gibco, Cat 11,140–050), 48.4 mM L-Glutamine (Gibco, Cat 35,050–061), 0.24 M HEPES (Gibco, Cat 15,630–080), 1.2 mg.mL Gentamicin (Gibco, Cat 15,750—60), and 1.3 mM β-Mercaptoethanol (VWR, Cat CA-EM6010). When 80–90% confluence has been reached, the cells were trypsinized and subculture into flasks using 20% FBS/MEM to favor fibroblasts proliferation. The cell growth morphology of the spindle-shaped fibroblasts was monitored under a light microscope for about 4 to 5 weeks and the fibroblasts’ isolation protocol was performed as previously described.25 When the DHBFCs reached confluence, the adherent cells were trypsinized with 0.02% Trypsin (Sigma-Aldrich, USA) and seeded into flasks for cell expansion; the cells were passaged up to passage 4. DHBFCs were seeded onto glass 8-chamber slides (20,000 cells per chamber) in 10% FBS/DMEM and allowed to reach 60% to 80% confluence before conducting ICC experiments, as previously described.25 The primary antibodies (Abs), anti-vimentin (BD Biosciences, Cat # 562,337), anti-cytokeratin (BD Biosciences, Cat # 349,205) or anti-αSMA (alpha smooth muscle actin)(abcam, ab32575) have been used according to manufacturer’s instructions. Appropriate isotype controls were prepared by replacing the primary Abs with a non-specific mouse or rabbit immunoglobulin G (IgG) at the same concentration. The biotinylated secondary Abs, rabbit anti-mouse or swine anti-rabbit (DAKO) were used in a dilution of 1:200. The cells were stained with 3,3ʹ-diaminobenzidine (DAB) chromogen (brown) and nuclei were counterstained with hematoxylin (blue). Target proteins were visualized and analyzed by microscopy (Olympus BX51, Olympus) using ImagePro software.
Cell Culture and Treatment Conditions
HBFCs from passages two to five were grown in Dulbecco’s modified Eagle medium (DMEM) (Gibco-BRL Inc. Carlsbad, USA) with 10% FBS and 1% antibiotic antimycotic solution to reach 60% confluence. To stimulate the expression of fibrogenic markers, HBFCs were grown in DMEM-serum free or supplemented with low FBS concentrations (as indicated for each experiment), in the presence of the appropriate test reagents: 1,25(OH)2D3 (Sigma-Aldrich Int, USA), recombinant human cytokines TGF-β1, TNF-α and IL-1β (R&D Systems, Minneapolis, USA and PeproTech). To mimic in vivo airway environment (in which fibrogenic mediators are present before treatment), we simultaneously stimulated and treated HBFCs with TGF-β1 or TNF-α-IL-1β (10 ng/mL each cytokine) and 1,25(OH)2D3 or vehicle ethyl alcohol (EtOH) vehicle. The stock solution of 1,25(OH)2D3 was prepared according to the manufacturer’s instructions (Sigma-Aldrich, Cat # D1530-10UG) and as previously described.26 The cytotoxicity of 1,25(OH)2D3 and/or EtOH vehicle was determined by using 3-[4,5-dimethylthiazol-2-yl]-2,5 diphenyl tetrazolium bromide (MTT) kit, according to the manufacturer’s instructions (Abcam). Briefly, cells were plated at 2 x 10³ cells/well (96-well) in 0.2 mL 10% FBS/DMEM media and allowed to attach overnight, at 37° C in a humidified 5% CO2–95% atmosphere. On the following day, 2% FBS/DMEM, supplemented with 1,25(OH)2D3 (50 nM or 100 nM) or ethyl alcohol (EtOH) vehicle (0.2% or 0.4%) was added to the cells and incubated for 24 hours. Three hours prior to the end of the incubation period, treatment media was discarded and serum-free colorless DMEM/MTT reagent (1:1) was added. The conversion of MTT into formazan by metabolic active cells was measured by reading absorbance at OD 590 nm on a microtiter plate reader (Epoch Spectrophotometer System). The absorbance was proportional to the number of viable cells. Data were normalized to vehicle-untreated HBFCs and cell viability percentage was calculated according to the manufacturer’s instructions (Abcam).
Semi-Quantitative RT-PCR
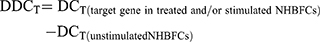
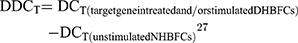
HBFCs (n=4, each group) were seeded at the density of 1 x 10⁵ cells/well (12 well) or 2 x 10⁵ cells/well (6-well) in 2 mL 10% FBS/DMEM. At 60% confluence, HBFCs were starved in serum-free DMEM during the day (8 hours) prior stimulation; then, TGF-β1 (10 ng/mL) or TNF-α-IL-1β (10 ng/mL each cytokine) and/or 1,25(OH)2D3 (50 nM) were simultaneously added to DMEM-serum free media and incubated for 24 hours. EtOH vehicle (0.2%) was added to unstimulated HBFCs. Doses of 50 nM or 100 nM of 1,25(OH)2D3 derivatives were previously reported as optimal to induce efficient biological response.17 To determine the optimal 1,25(OH)2D3 concentration and whether HBFCs express functional vitamin D receptors, HBFCs (60% confluency) were starved for 8 hours prior stimulation; then, 1,25(OH)2D3 (50 nM or 100 nM) was added to DMEM-serum free media and incubated for 24 hours. EtOH vehicle (0.2% or 0.4%) was added to unstimulated HBFCs. Total RNA from cell lysates was extracted using Trizol reagent (Thermo Fisher). One microgram of total RNA was treated with DNase Removal kit and reverse transcribed in cDNAs using the 5X All-In-One Reverse Transcriptase Master mix, according to the manufacturer’s instructions (Applied Biological Materials (ABM) Inc.). Relative levels of targeted genes’ mRNA were analyzed using 2 x BrightGreen qPCR mix following the manufacturer’s protocol (ABM). Each sample was tested in duplicates in a total reaction volume per well of 10 μL and the qPCR amplification was performed using a BioRad CFX96 thermal cycler according to the manufacturer’s protocol (ABM). Gene specific primer sequences are listed in Table 1. Primers were designed using NCBI Primer3/BLAST software and synthesized by Life Technology (Invitrogen). The 2−∆∆CT method was used to determine the expression of gene targets in stimulated and/or treated NHBFCs or DHBFCs relative to unstimulated NHBFCs, which was prior normalized to the reference Glyceraldehyde 3-phosphate Dehydrogenase (GAPDH) gene. The cycle threshold (CT) values were calculated as follows:

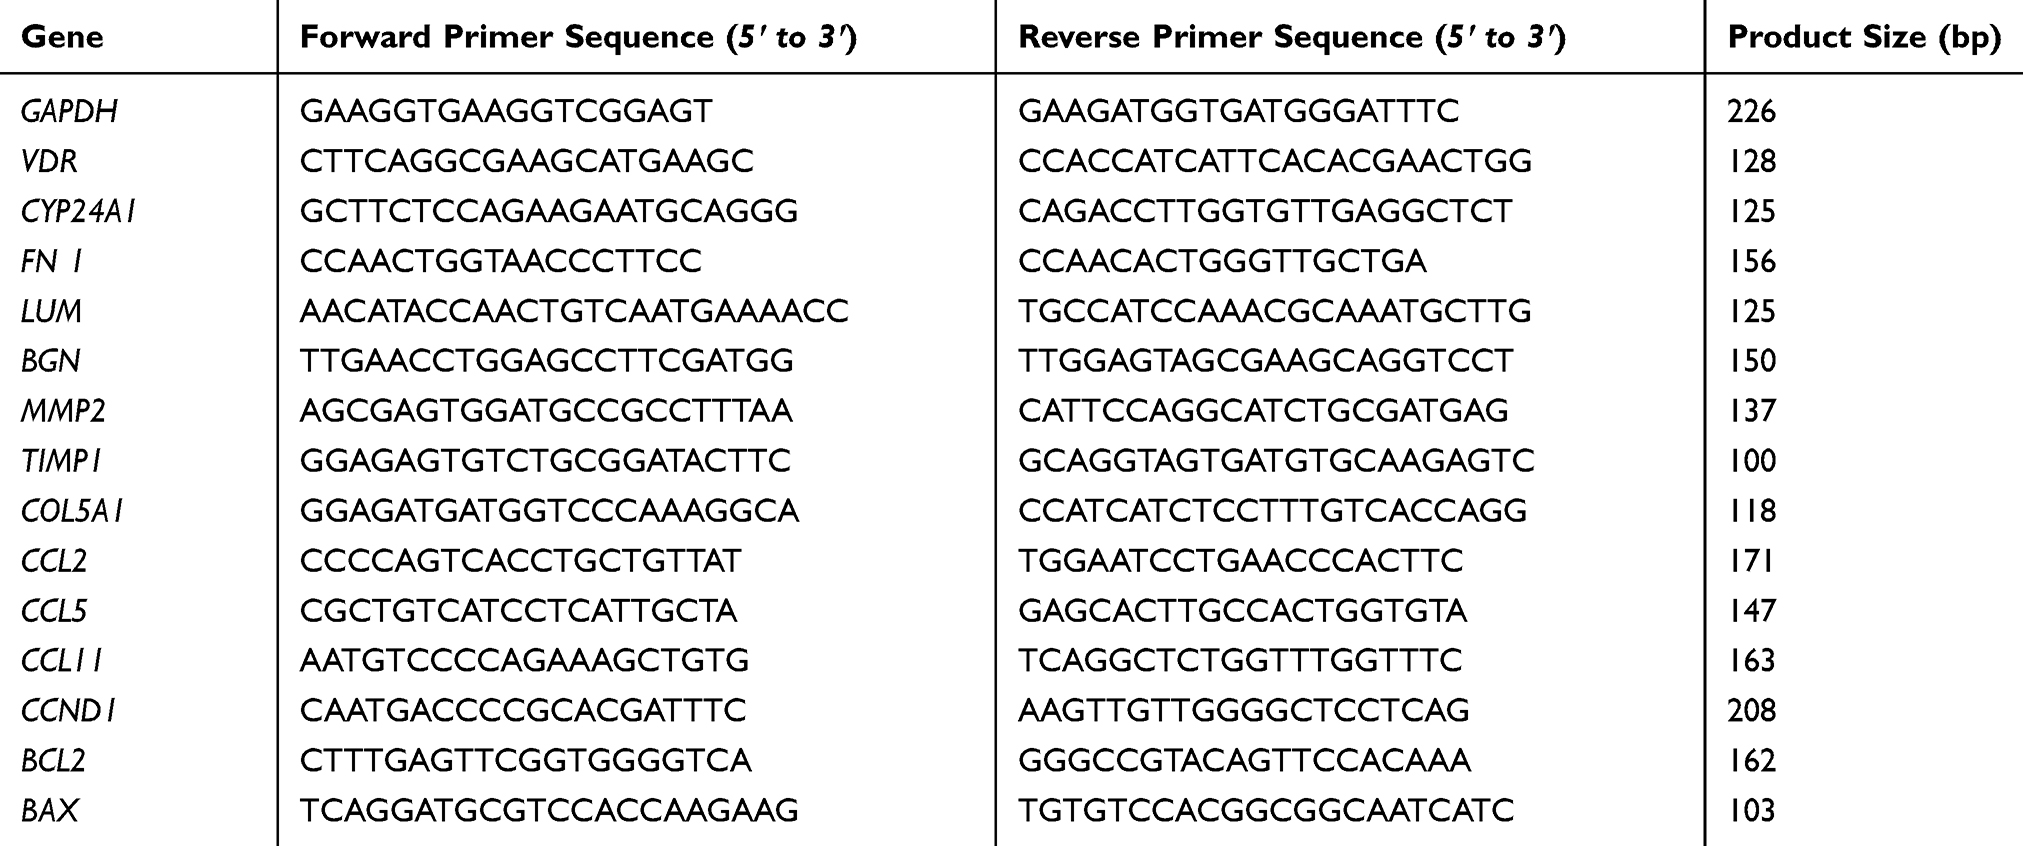 |
Table 1 Primers Used for Semi-Quantitative RT-PCR |
Since we observed no expression baseline differences between the NHBFCs and DHBFCs groups, the DDCT was calculated as a fold change from just unstimulated NHBFCs, as such:
The results were expressed as fold changes in expression of fibrogenic gene markers in NHBFCs or DHBFCs, respectively.
Enzyme-Linked Immunosorbent Assay (ELISA)
Cell culture media collected from the HBFCs (n=4, each group) subjected to either TGF-β1 or TNF-α-IL-1β and/or 1,25(OH)2D3 (50 nM) stimulation for 24 hours, was used for ELISA assays to determine the protein concentration of secreted fibrogenic proteins. The ELISA kits for MCP1 (DY279-05), RANTES (DY278-05), eotaxin-1 (300–21), lumican (DY2846-05) and fibronectin 1 (DY1918-05) were used according to the manufacturer’s instructions (R&D Systems and PeproTech). The limits of detection for all ELISAs’ kits were in low picogram range (>4 pg/mL), except for fibronectin 1 ELISA’s kit for which the limit of detection was in low nanogram range (>0.1 ng/mL).
Cell Proliferation Assay
The distribution of DNA content in the cell cycle was determined by flow cytometry using 5-bromo-2ʹ-deoxyuridine conjugated to fluorescein isothiocyanate (BrdU-FITC) (Millipore, MAB3262F) and 7-aminoactinomycin D (7-AAD) dye (Sigma-Aldrich Int, USA) dual staining as described previously,28,29 with some modifications. Briefly, HBFCs (n=4, each group) were seeded at the density of 2 x 10⁵ cells/well (6-well) in 2 mL 10% FBS/DMEM. At 60% confluence, HBFCs were starved in serum-free DMEM during the day (8 hours) to arrest growth prior stimulation; then, TGF-β1 (10 ng/mL) and/or 1,25(OH)2D3 (50 nM) were simultaneously added to 0.5% FBS/DMEM media and incubated for 24 hours. EtOH vehicle (0.2%) was added to unstimulated HBFCs. BrdU (10 nM) (Sigma-Aldrich Int, USA) was added 4 hours before harvesting. Cells were fixed with 95% EtOH for 2 days at 4°C and treated with 2 N HCl/0.5% Triton X-100. HBFCs were washed with phosphates-citric acid buffer and the cells were incubated for 5 minutes at 85°C to induce partial denaturation of DNA. HBFCs (105 cell suspension/sample) were stained with anti-BrdU-FITC, according to the manufacturer’s instructions (Millipore, MAB3262F) and incubated in the dark for 30 minutes, at room temperature. The 7-AAD dye was added according to the manufacturer’s instructions (BD Pharmingen) to each sample, 20 minutes before FACS measurements. The samples were kept on ice and analyzed by flow cytometry within an hour. The cells were gated on forward scatter (FSC) and side scatter (SSC) dot plot, such that single events captured by the flow cytometer form a horseshoe-shaped arc, centered at 50 and 150 (arbitrary units) on the X-axis and between 103 to 105 on Y-axis displayed as a logarithmic scale.28 For each sample, 1×10⁴ single-cell events were acquired by flow cytometry (FACSCanto II, BD Biosciences, USA) and analyzed by FlowJo software.
Apoptosis Assay
To determine if 1,25(OH)2D3 treatment might induce apoptosis/necrosis in HBFCs, an Annexin V conjugated to fluorescein isothiocyanate (Annexin V-FITC) (Invitrogen) and 7-AAD dye dual staining by flow cytometry was performed. HBFCs (n=4, each group) were seeded at the density of 1 x 10⁵ cells/well (12 well) in 1.2 mL 10% FBS/DMEM. At 60% confluence, HBFCs were incubated with 1,25(OH)2D3 (50 nM) in 2% FBS/DMEM medium for 24 hours. EtOH vehicle (0.2%) was added to unstimulated HBFCs. HBFCs were detached from the culture dishes with trypsin/EDTA and pelleted at 1500 rpm for 5 minutes. HBFCs were resuspended in 10% FBS/DMEM and incubated 30 minutes, at 37° C in a humidified 5% CO2–95% atmosphere for cell membrane repair. HBFCs (105 cell suspension/sample) were washed with PBS and stained with Annexin V-FITC, according to the manufacturer’s instructions (Invitrogen) and incubated in the dark for 15 minutes. 7-AAD dye was added according to the manufacturer’s instructions (BD Pharmingen) 20 minutes prior to FACS measurements. The samples were kept on ice and analyzed by flow cytometry within an hour. FITC and 7-AAD were compensated according to the manufacturer’s instructions. Untreated and unstained samples served as control for viable cells. Heat-induced necrotic cells and H2O2-induced apoptotic cells30 were used as positive populations to be added to the FACS controls (unstained, FITC- or 7-AAD-single stained cells). 1 x 10⁴ single-cell events were collected by FACSCanto II and further analyzed with FlowJo software. The cells were gated on forward scatter (FSC) and side scatter (SSC) dot plot and assigned to different populations: quadrant 1 (Q1) shows necrotic cells, Annexin V negative and 7AAD positive; Q2 shows late apoptotic cells, Annexin V positive and 7AAD positive; Q3 contains early apoptotic cells, Annexin V positive and 7AAD negative and Q4 contains living intact cells, Annexin V negative and 7AAD negative.31 For each sample, 1×10⁴ single-cell events were acquired by flow cytometry (FACSCanto II, BD Biosciences, USA) and analyzed by FlowJo software.
Statistical Analysis
One-way analysis of variance (ANOVA) coupled with Newman‐Keuls post hoc test was performed using GraphPad Prism (GraphPad Software Inc, USA) to determine whether there are any statistically significant differences between the mean values of NHBFCs and DHBFCs groups for the gene expression, protein levels, cell proliferation or apoptosis. The Student’s t-test (variances assumed equally by ANOVA) was used to determine the difference between two groups under a given experiment or treatment. A p-value <0.05 was considered statistically significant.
Results
Characterization of DHBFCs
Under the light microscope, the cells showed a fibroblast-like spindle-shaped morphology and no cell with epithelial-like morphology was detected. Additionally, DHBFCs showed strong immunoreactivity for vimentin, the most frequently found intermediate filament in fibroblasts.32 DHBFCs showed faint immunoreactivity for anti-αSMA (myofibroblast marker) and were negative for anti-cytokeratin (intermediate elements found in epithelial cells) polyclonal antibodies, Figure S1, supplementary data.
The Cytotoxic Effect of 1,25(OH)2D3 on HBFCs’ Growth
We observed no significant difference in HBFCs viability when cells were exposed to 1,25(OH)2D3 (50 nM or 100 nM) or EtOH vehicle (0.2% or 0.4%), as the absorbance values were not significantly different than the absorbance values of control (untreated HBFCs in 2% FBS/DMEM media), as shown in Figure S2, supplementary data.
HBFCs Express Functional VDR Receptors
To determine whether HBFCs express functional vitamin D receptors, the relative expression of Cytochrome P450 family 24 subfamily A member 1 (CYP24A1) and VDR were tested by semi-quantitative RT-PCR, as a response to 1,25(OH)2D3 (50 nM or 100 nM) stimulation. After 24 h of HBFCs treatment with 1,25(OH)2D3, the VDR mRNA expression increased by 3-fold compared with untreated HBFCs and with the same stimulation, the CYP24A1 mRNA expression increased by 9000-fold (Figure 1A and B). We found no significant difference in mRNA expression levels of VDR and CYP24A1 in presence of 50 nM 1,25(OH)2D3 when compared to 100 nM 1,25(OH)2D3 (p > 0.05, Figure 1A and B). Therefore, 50 nM 1,25(OH)2D3 was considered as the optimal concentration for the subsequent experiments in the present study.
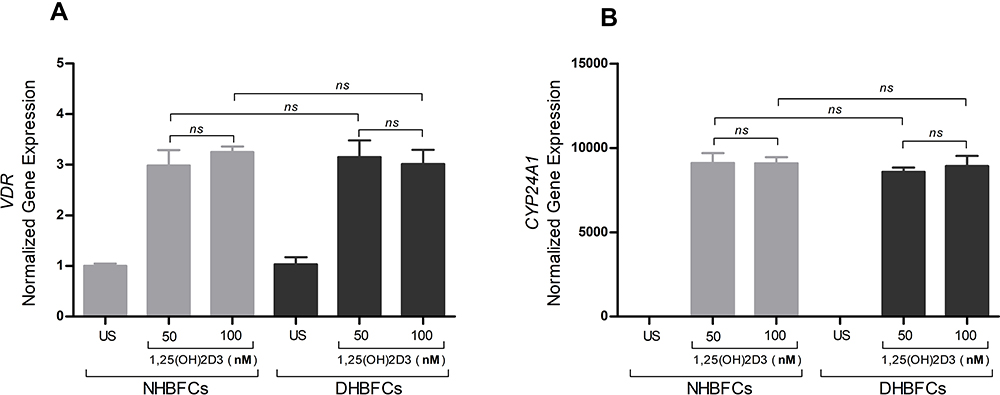 |
Figure 1 mRNA expression of VDR (A) and CYP24A1 (B) in NHBFCs or DHBFCs as a response to 1,25(OH)2D3 (50 nM or 100 nM) treatment. Student t-test was applied to compare the fold change difference in mRNA expression between two experimental conditions and associated p- values are indicated. (ns) p > 0.05, no significant difference in mean fold change mRNA expression. Data were expressed as mean ± standard error (SE) from duplicate values of two independent experiments. NHBFCs (n=4), DHBFCs (n=4). |
1,25(OH)2D3 Inhibits TGF-β1 or TNF-α-IL-1β-Induced Fibrogenic Effect in HBFCs
Inter-Groups’ NHBFCs Vs DHBFCs Comparisons
We determined the effect of TGF-β1 or TNF-α-IL-1β stimulation of NHBFCs compared to DHBFCs, in the presence or absence of 1,25(OH)2D3, as demonstrated in Figure 2A–I. We first determined the basal mRNA expression of fibrogenic markers in HBFCs from asthmatic and non-asthmatic subjects. We observed no difference in baseline mRNA expression of unstimulated NHBFCs when compared with unstimulated DHBFCs. Therefore, we determined the expression of gene targets in stimulated and/or treated DHBFCs relative to unstimulated NHBFCs, like we described in Methods’ section. The differences observed between the expression of gene targets (fibrogenic markers or CC-chemokines) and their related p values are listed in Table 2. Although we observed a higher overall mRNA expression of fibrogenic markers and CC-chemokines in TGF-β1 or TNF-α-IL-1β-stimulated DHBFCs, the difference was not significant when compared with NHBFCs, except for BGN (p < 0.045, Figure 2C), CCL5 (p = 0.02, Figure 2E) and CCL11 (p = 0.04, Figure 2F). When 1,25(OH)2D3 was added to TGF-β1 or TNF-α-IL-1β-stimulated-DHBFCs from asthmatic patients, 1,25(OH)2D3 significantly altered mRNA expression of BGN, CCL2, CCL5 and CCL11 when compared to -NHBFCs from non-asthmatic subjects (p < 0.05, Figure 2C, G–I). For TIMP1, we observed a slight increase in TIMP1 mRNA expression in TGF-β1-treated DHBFCs from asthmatic patients when compared with TGF-β1-treated NHBFCs from non-asthmatic subjects and this effect was increased in a synergistic manner by the addition of 1,25(OH)2D3 (p < 0.05, Figure 2F and Table 2).
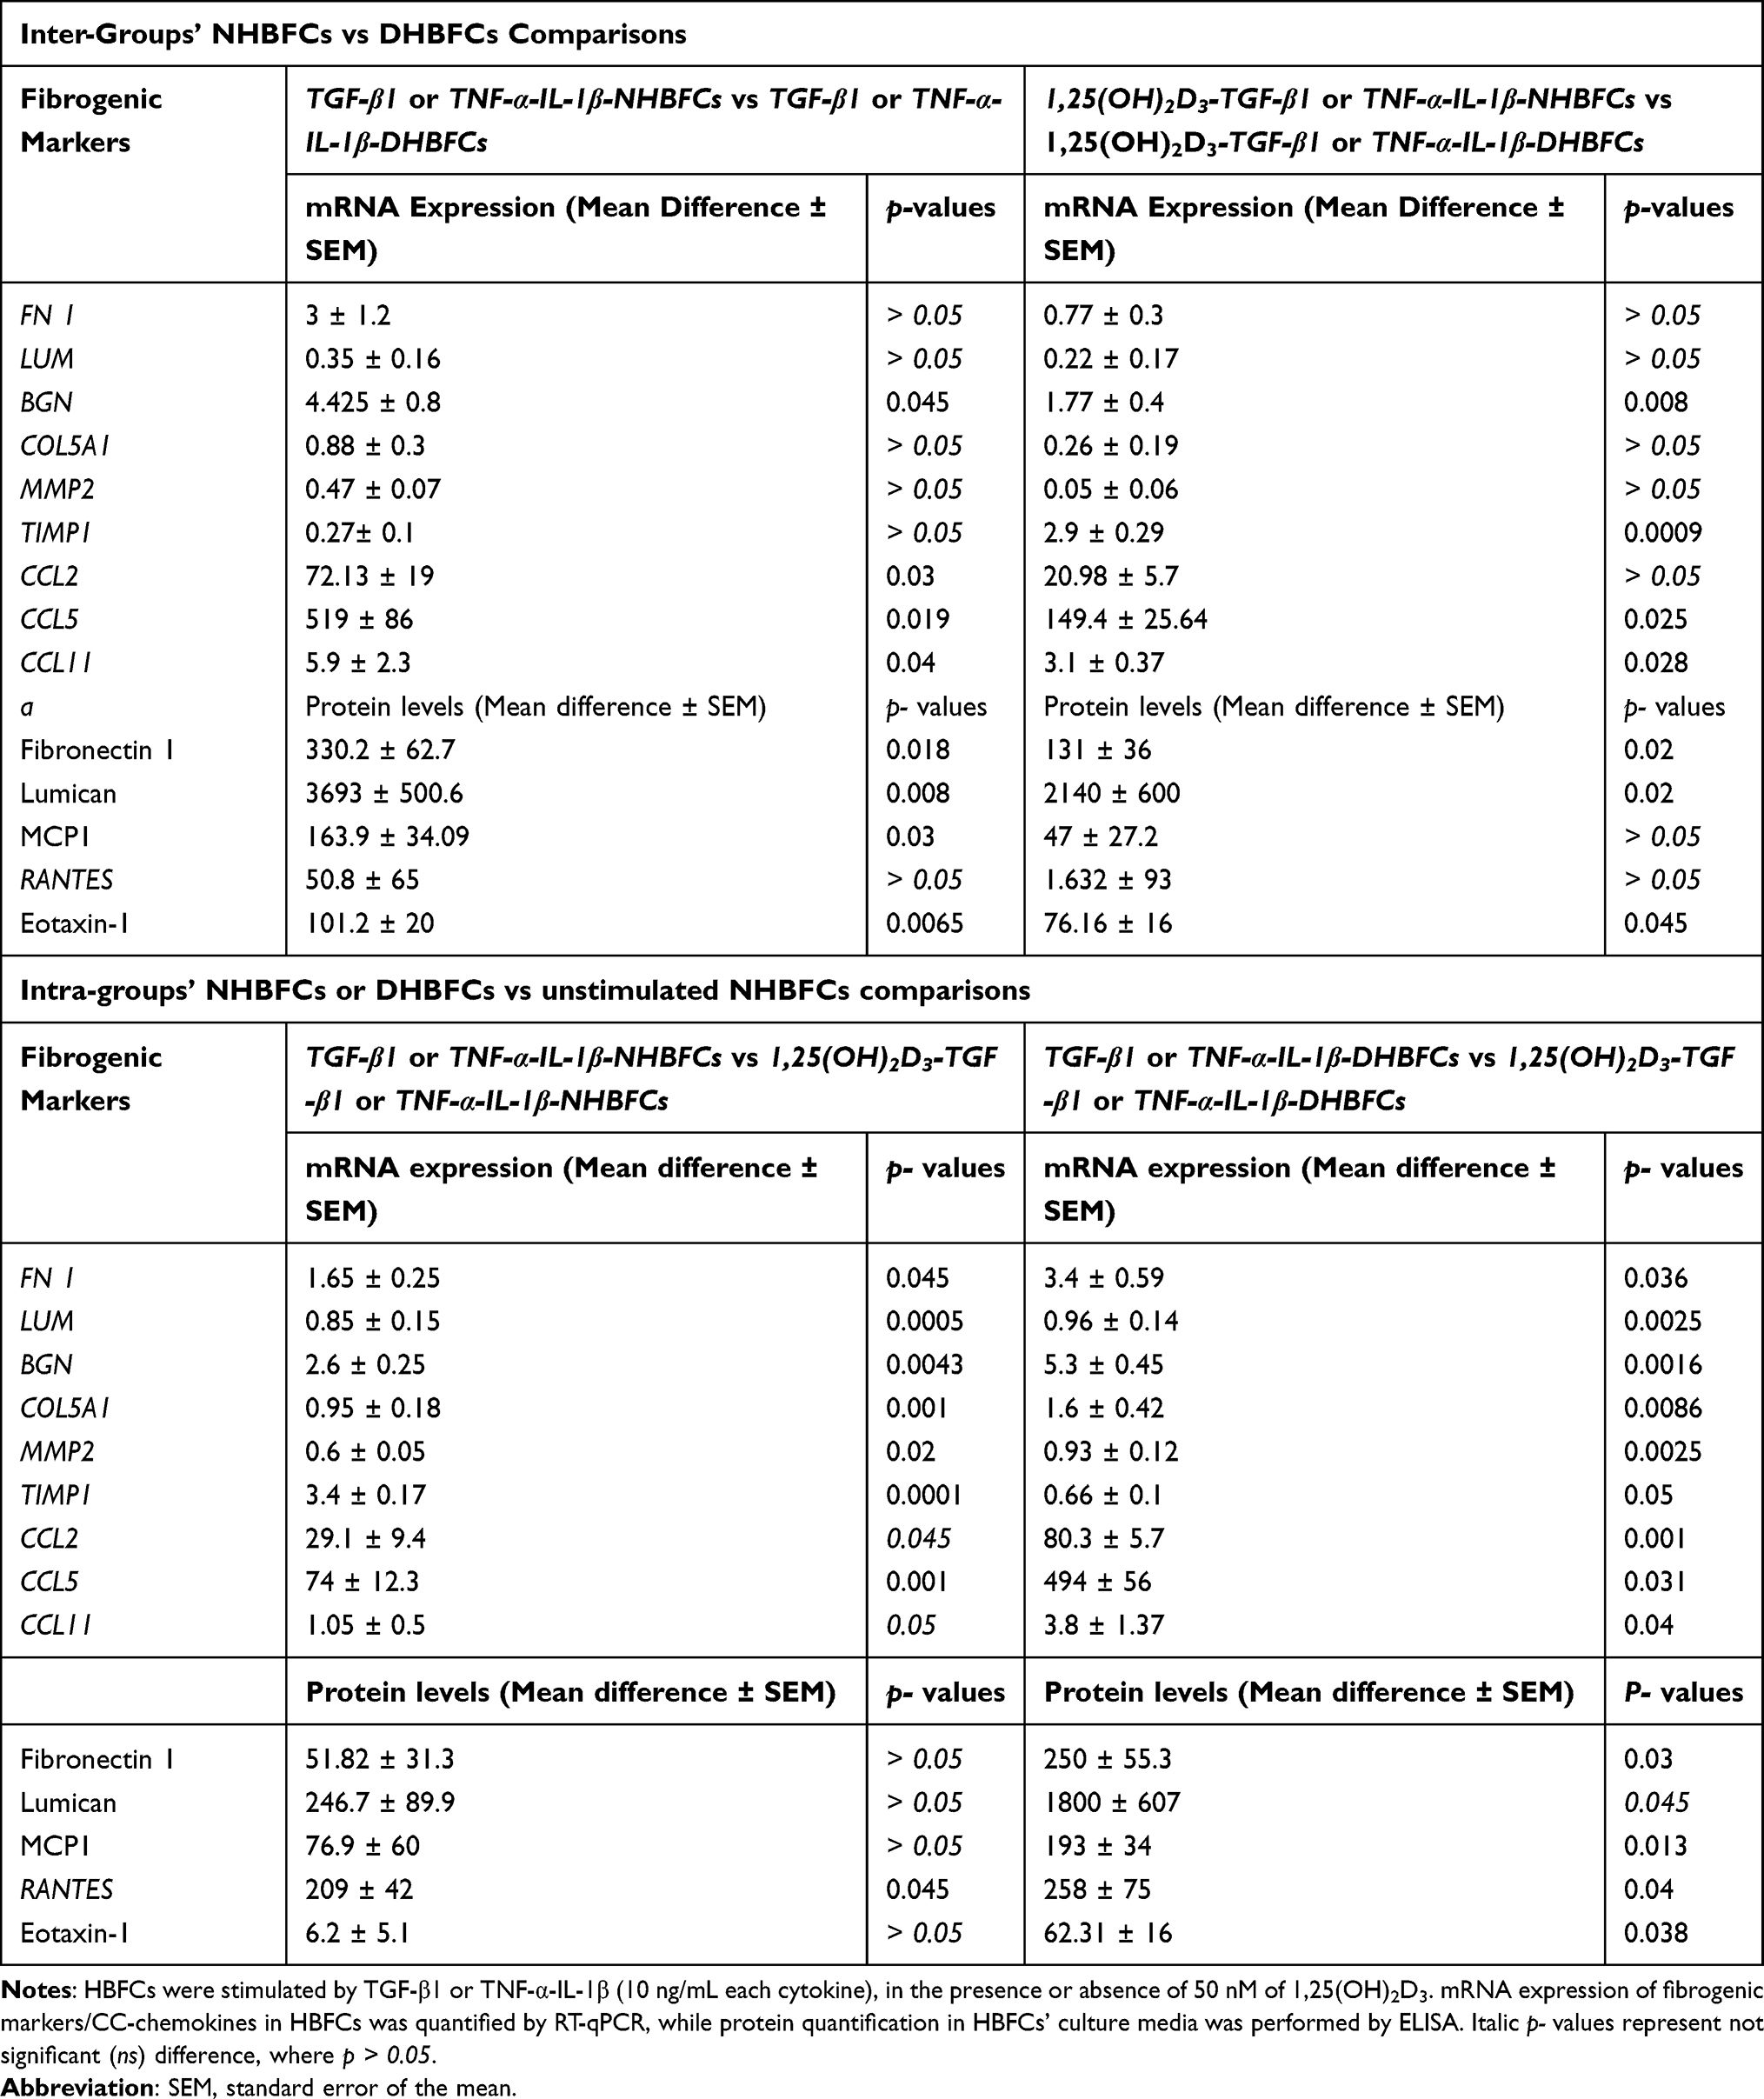 |
Table 2 The mRNA Expression and Protein Level of Fibrogenic Markers and CC-Chemokines, Intra-and Inter-Groups’ Comparisons |
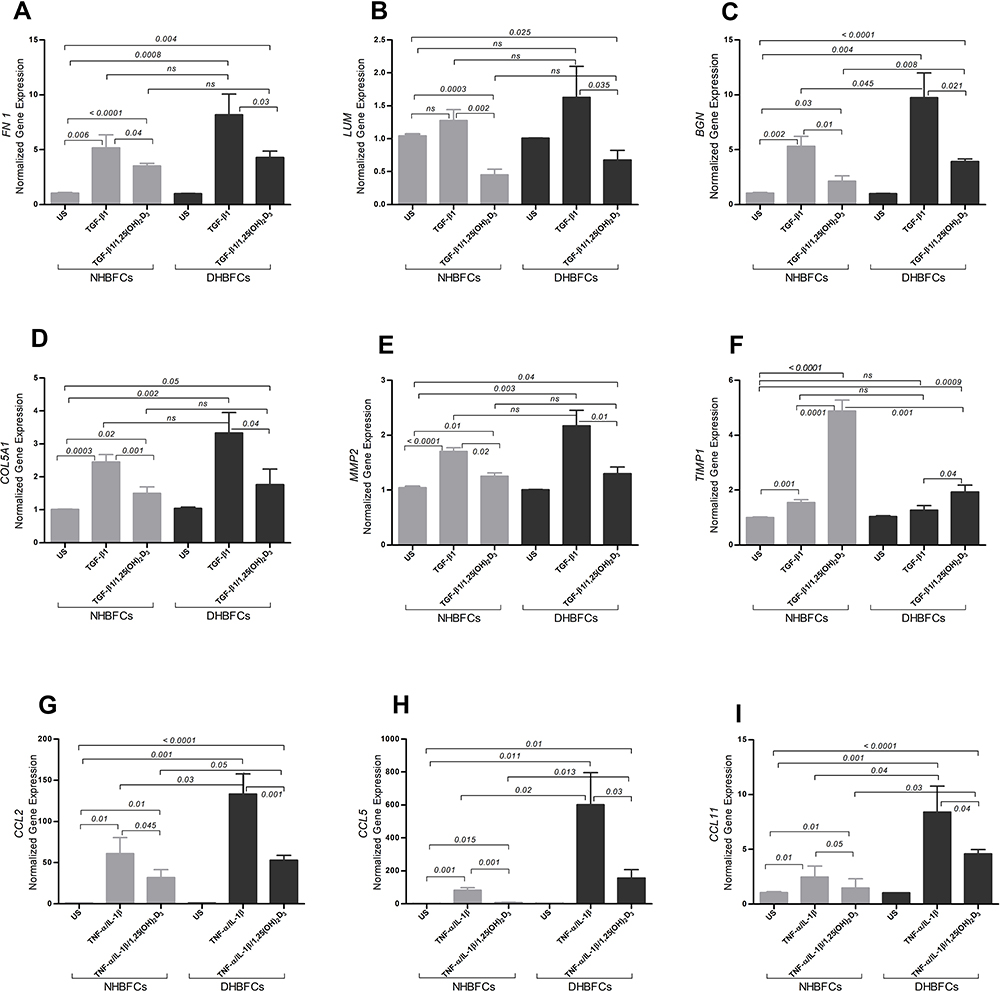 |
Figure 2 mRNA expression of TGF-β1 or TNF-α-IL-1β-induced fibrogenic markers/CCL-chemokines in NHBFCs or DHBFCs in response to 1,25(OH)2D3 (50 nM) treatment: FN 1 (A), LUM (B), BGN (C), COL5A1 (D), MMP2 (E), TIMP1 (F), CCL2 (G), CCL5 (H) and CCL11 (I). The Student’s t-test (variances assumed equally by ANOVA) was used to determine the difference between NHBFCs and DHBFCs under a given treatment and associated p- values are indicated. (ns) p > 0.05, no significant difference in mean fold change mRNA expression. Data were expressed as mean ± standard error (SE) from duplicate values of two independent experiments. NHBFCs (n=4), DHBFCs (n=4). |
Intra-Groups’ NHBFCs or DHBFCs vs Unstimulated NHBFCs Comparisons
We further determined whether 1,25(OH)2D3 addition to TGF-β1- or TNF-α-IL-1β -NHBFCs/-DHBFCs influences mRNA expression of stimulated fibrogenic markers and CC-chemokines. Therefore, we determined the expression of gene targets in stimulated and/or treated HBFCs relative to unstimulated HBFCs from each group, using the 2−ΔΔCT method as a fold change from just unstimulated HBFCs from each group, as we described in methods’ section. The differences observed between the expression of gene targets (fibrogenic markers or CC-chemokines) and their related p values are listed in Table 2. We observed that 1,25(OH)2D3 added to TGF-β1 or TNF-α-IL-1β-stimulated DHBFCs or NHBFCs significantly decreased the overall mRNA expression of stimulated fibrogenic markers and CC-chemokines (p < 0.05, Figure 2A–I and Table 2).
To confirm these findings, ELISA assay was performed on conditioned media to measure protein levels of fibronectin 1, lumican, MCP1, RANTES and eotaxin-1 (Figure 3A–E). We observed slight differences in baseline protein levels of unstimulated NHBFCs when compared with unstimulated DHBFCs. On the contrary, a significant increase in protein levels in TGF-β1 or TNF-α-IL-1β-stimulated-DHBFCs when compared to -NHBFCs and 1,25(OH)2D3 addition significantly altered mRNA expression of fibronectin 1, lumican, and eotaxin-1 (p < 0.05, Figure 3A–E and Table 2). While for intra-group comparisons, when 1,25(OH)2D3 was added to TGF-β1 or TNF-α-IL-1β-stimulated DHBFCs or NHBFCs, a significant decrease in the overall protein secretion of stimulated fibrogenic markers and CC-chemokines was observed (p < 0.05, Figure 3A–E, and Table 2).
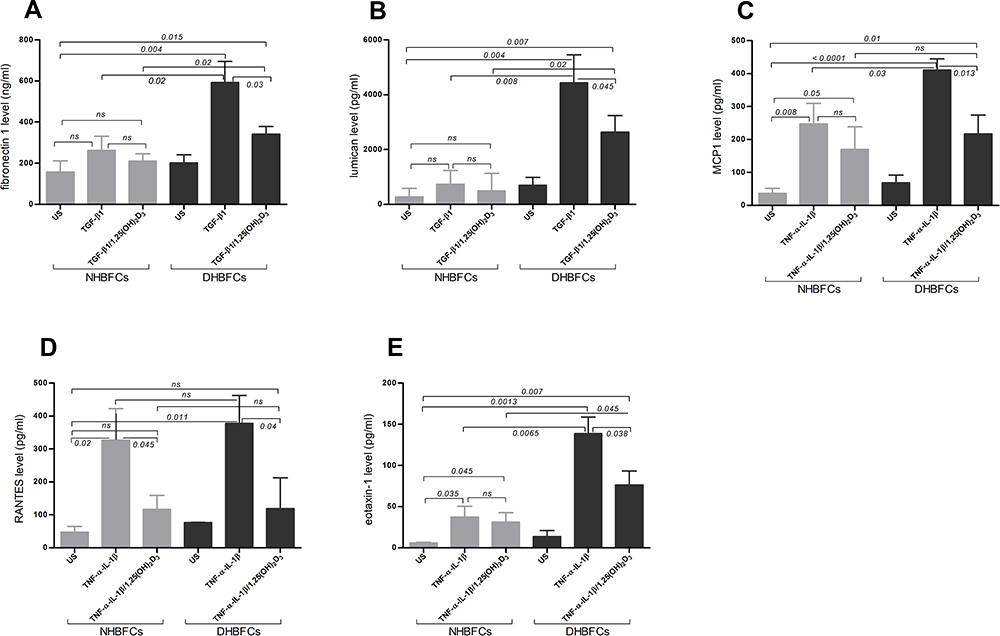 |
Figure 3 Protein levels of TGF-β1 or TNF-α-IL-1β-induced fibrogenic markers/CCL-chemokines in NHBFCs or DHBFCs in response to 1,25(OH)2D3 (50 nM): fibronectin 1 (A), lumican (B), MCP1 (C), RANTES (D) and eotaxin-1 (E). The Student’s t-test (variances assumed equally by ANOVA) was used to determine the difference between NHBFCs and DHBFCs under a given treatment and associated p- values are indicated. (ns) p > 0.05, no significant difference. Data were expressed as mean ± standard error (SE) from duplicate values of two independent experiments. NHBFCs (n=4), DHBFCs (n=4). |
Decreased HBFCs Proliferation and Cell Cycle Arrest in Response to 1,25(OH)2D3
We examined the effect of 1,25(OH)2D3 on HBFCs proliferation using BrdU-7AAD incorporation assay by flow cytometry. Once cells have been measured for BrdU and 7AAD content, they were analyzed and assigned to the G0/G1 or G2/M phases by drawing gates around the two 7AAD positive populations, G0/G1 and G2/M, centered at 50 and 150 (arbitrary units) on the X-axis. Everything above these boxes was included in a single gate that measures the BrdU positive population (S-phase), centered between 103 to 105 (logarithmic scale) on Y-axis, as demonstrated in Figure 4A–F. The cells outside the G0/G1, S or G2M gates were not included in the analysis. Stimulation of HBFCs for 24 hours with TGF-β1 induced an overall cell proliferation with 30 ± 1.1% when compared with unstimulated HBFCs, and 1,25(OH)2D3 addition significantly decreased the overall mean cell proliferation (Figure 4A–G). Intra-group comparisons, the mean number of DHBFCs in the G0/G1 phase of 1,25(OH)2D3-treated DHBFCs were significantly higher compared with that obtained in untreated DHBFCs; this increasing proportion of DHBFCs in the G0/G1 phase was accompanied by a concomitant reduced number of cells at the S-phase in 1,25(OH)2D3-treated DHBFCs (p = 0.004, Figure 4G). 1,25(OH)2D3 exerted similar effects on TGF-β1 stimulated NHBFCs, added to TGF-β1-stimulated NHBFCs significantly decreased the number of cells in S-phase (p = 0.012, Figure 4G). While for inter-group comparisons, we observed a significant difference in the mean number of cells in S-phase or G2M phases in 1,25(OH)2D3-treated DHBFCs when compared with 1,25(OH)2D3-treated NHBFCs (p < 0.05, Figure 4G). Within the same experiment, we also evaluated the mRNA expression of CCND1 gene, a key cell cycle regulatory protein. We observed a significant increase in mRNA expression in TGF-β1-stimulated DHBFCs when compared with TGF-β1-stimulated NHBFCs and 1,25(OH)2D3 addition significantly blocked the effects of TGF-β1 (p = 0.006, Figure 4H).
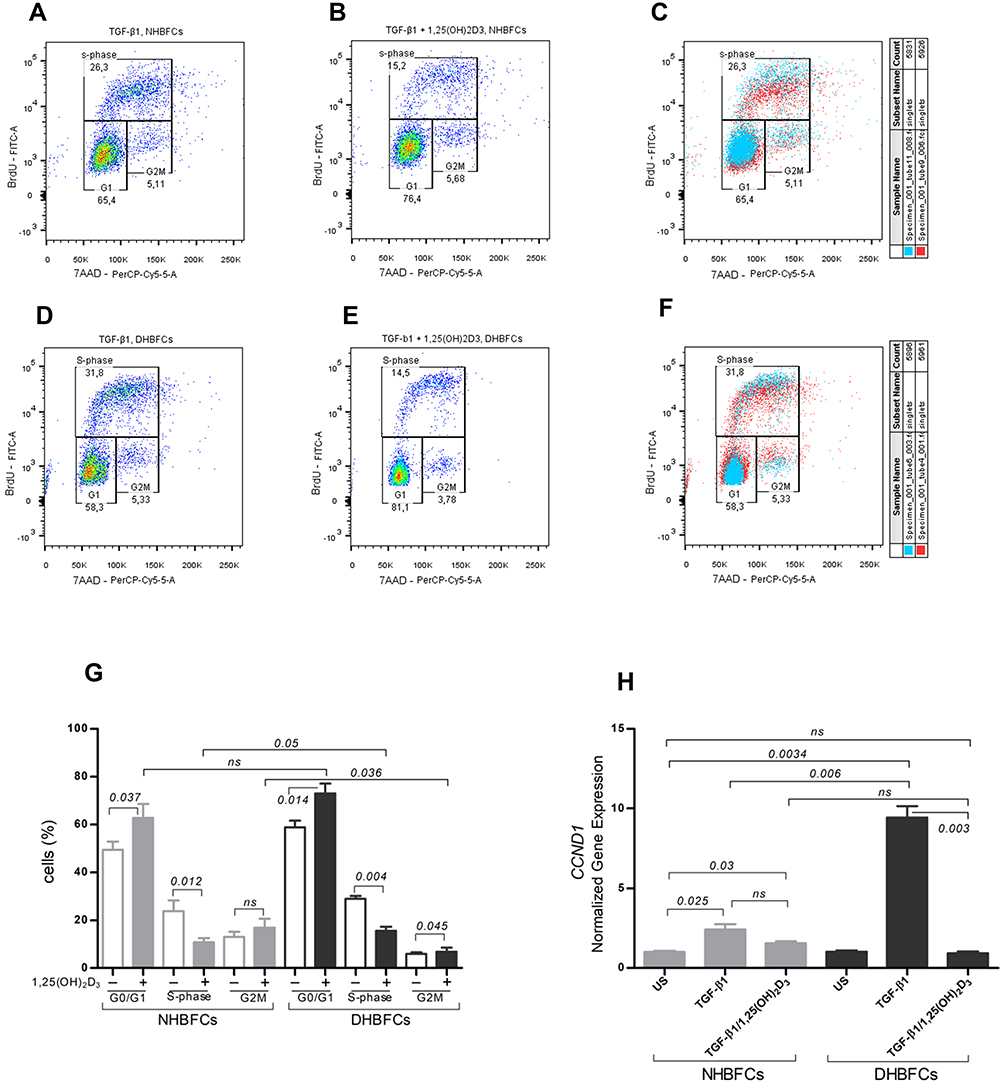 |
Figure 4 Effect of 1,25(OH)2D3 (50 nM) on HBFCs proliferation using flow cytometry (A–G). HBFCs have been measured for 7AAD or BrdU content and were assigned to the G0/G1, S or G2/M phases by drawing gates, as demonstrated in each panel: TGF-β1-treated NHBFCs (A), 1,25(OH)2D3-TGF-β1-treated NHBFCs (B), TGF-β1-treated NHBFCs vs 1,25(OH)2D3-TGF-β1-treated NHBFCs, overlapped data (C), TGF-β1-treated DHBFCs (D), 1,25(OH)2D3-TGF-β1-treated DHBFCs (E), TGF-β1-treated DHBFCs vs 1,25(OH)2D3-TGF-β1-treated DHBFCs, overlapped data (F). The percentage of cells in each gate represents the relative number of NHBFCs or DHBFCs in G0/G1, S, and G2/M. (G) Graphic quantitation of the respective cell cycle phases using GraphPad. (H) mRNA expression of CCND1 in TGF-β1-induced-DHBFCs or NHBFCs in response to 1,25(OH)2D3 (50 nM) treatment. The Student’s t-test (variances assumed equally by ANOVA) was used to determine the difference between NHBFCs and DHBFCs under a given treatment and associated p- values are indicated. (ns) p > 0.05, no significant difference. Data were expressed as mean ± standard error (SE) from duplicate values of two independent experiments. NHBFCs (n=4), DHBFCs (n=4). |
Increased Early Apoptotic HBFCs in Response to 1,25(OH)2D3 Treatment
HBFCs treated with 1,25(OH)2D3 for 24 hours, in 2% FBS/DMEM were stained with Annexin V (marker for apoptosis) and 7AAD dye (marker for late apoptosis/necrosis) and the relative proportions of apoptotic cells were quantitatively assessed by flow cytometry. The cells have been measured for Annexin V and 7AAD content and assigned to different cell populations by drawing gates as demonstrated in Figure 5A–F. Treatment of HBFCs with 50 nM of 1,25(OH)2D3 increased the overall mean number of early apoptotic cells from 5.8 ± 1.4 to 9.9 ± 1.6% when compared to unstimulated HBFCs (Figure 5A–G). We observed no significant difference in the mean number of cells in early or late apoptosis between 1,25(OH)2D3-treated-DHBFCs when compared to 1,25(OH)2D3-treated-NHBFCs (p > 0.05, Figure 5G). Within the same experiment, we also evaluated the mRNA expression of apoptosis-related genes, BCL2 (anti-apoptotic) and BAX (pro-apoptotic). Under our experimental conditions, BCL2 gene was not expressed in HBFCs, while BAX gene was well expressed by the cells, and 1,25(OH)2D3 addition had no modulator effect on their mRNA expression, (p > 0.05, Figure 5H).
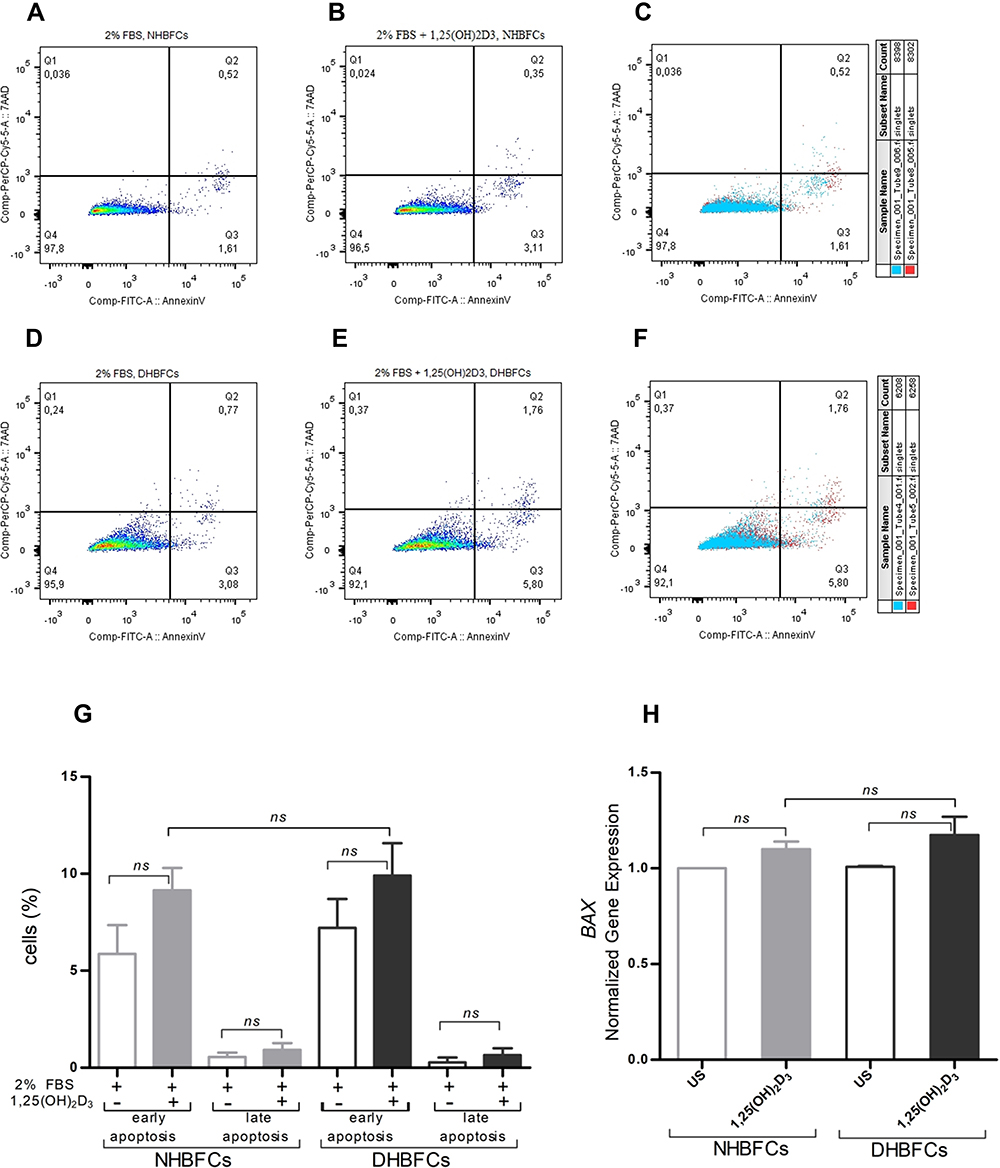 |
Figure 5 Effect of 1,25(OH)2D3 (50 nM) on HBFCs apoptosis using flow cytometry (A–G). HBFCs have been measured for Annexin V-FITC or 7AAD content and assigned to different cell populations by drawing gates, as demonstrated in each panel: Q1 (necrotic cells), Q2 (late apoptotic cells), Q3 (early apoptotic cells) and Q4 (living intact cells). TGF-β1-treated NHBFCs (A), 1,25(OH)2D3-TGF-β1-treated NHBFCs (B), TGF-β1-treated NHBFCs vs 1,25(OH)2D3-TGF-β1-treated NHBFCs, overlapped data (C), TGF-β1-treated DHBFCs (D), 1,25(OH)2D3-TGF-β1-treated DHBFCs (E), TGF-β1-treated DHBFCs vs 1,25(OH)2D3-TGF-β1-treated DHBFCs, overlapped data (F). The population percentage in each quadrant is also indicated. (G) Graphic quantitation of the respective cell populations using GraphPad. (H) mRNA expression of BAX in 1,25(OH)2D3 (50 nM) treated HBFCs. The Student’s t-test (variances assumed equally by ANOVA) was used to determine the difference between NHBFCs and DHBFCs under a given treatment and associated p- values are indicated. (ns) p > 0.05, no significant difference. Data were expressed as mean ± standard error (SE) from duplicate values of two independent experiments. NHBFCs (n=4), DHBFCs (n=4). |
Discussion
Airway remodeling remains one of the most challenging features of asthma and has been shown to be related to the severity of the disease.33 Airway subepithelial fibrosis in asthma whereby TGF-β1 and inflammatory cytokines stimulate airway fibroblasts invasion and ECM deposition in subepithelial layer has been previously described.34
The beneficial role of 1,25(OH)2D3 derivatives in blocking airway subepithelial fibrosis has been previously described in animal models,7 but there are no studies on its fibrogenic regulatory effect on HBFCs. In the present study, we show that airway fibroblasts isolated from patients with severe asthma stimulated with TGF-β1 or TNF-α-IL-1β overexpressed and secreted profibrogenic markers at a significantly greater extent than airway fibroblasts isolated from non-asthmatic control subjects. We also show that TGF-β1 mediator is required for stimulation of ECM fibrogenic markers, while TNF-α-IL-1β chemotaxis mediators are required for CC-chemokine expression and release in culture media, contributing together to the subepithelial fibrosis process.35 Although the cells were exposed to the same stimulatory conditions, we observed higher mRNA and protein levels in airway fibroblasts from asthmatic patients than from non-asthmatic subjects. These results reflect a higher grade of activation and different degrees to respond to the external stimuli of DHBFCs compared with NHBFCs. One possible explanation for the difference in response to profibrotic mediators maybe that airway fibroblasts from asthmatic patients are more prone to develop a synthetic secretory phenotype in presence of environmental mediators than airway fibroblasts from non-asthmatic subjects. Also, it is possible that TGF-β1 or TNF-α-IL-1β induced fibrogenic markers in airway fibroblasts may result in phenotypic transition of the fibroblasts to myofibroblasts, which have been described in other studies.4
Our data also highlight that 1,25(OH)2D3 significantly attenuated the profibrogenic effects of TGF-β1 or TNF-α-IL1β-stimulated airway fibroblasts from asthmatic patients compared with that observed in non-asthmatic control subjects. VDR implication in most of 1,25(OH)2D3 actions has been demonstrated in a variety of cells and tissues.11 To demonstrate VDR functionality in HBFCs, we also quantified the mRNA expression of VDR and CYP24A1 in 1,25(OH)2D3-treated and untreated cells. We observed significantly increased mRNA expression of VDR and CYP24A1 in 1,25(OH)2D3-treated HBFCs when compared to untreated cells. Moreover, we observed no difference in mRNA expression of VDR or CYP24A1 between HBFCs groups which indicate that VDR activity and functionality were similar among airway fibroblasts groups.
Along with an increased ECM deposition, the amount and activity of various MMPs are also enhanced in airway bronchial tissue from asthmatic subjects.36 MMP2 is unregulated in bronchial asthma36 and is considered as a key profibrotic mediator with proliferative effect on cultured human airway resident cells.37 MMPs activity is regulated by the tissue inhibitors of metalloproteinase (TIMPs), which are also present in higher levels in bronchoalveolar lavage fluid and sputum from asthmatic patients.23,36 It is important to mention that in normal airway tissue, there is an inverse correlation between MMPs/TIMPs levels: an increase in MMPs is associated with a decrease in TIMPs36 and that an imbalance between MMPs/TIMPs expression was frequently observed in airways of asthmatic patients.23 We hypothesized that the upregulation of MMP2 and TIMP1 genes expression in TGF-β1-stimulated HBFCs correlates with a potential increase in bronchial remodeling. As we expected, under TGF-β1 stimulation, the mRNA expression of MMP2 was significantly increased in airway fibroblasts from asthmatic patients compared with non-asthmatic subjects, but not the mRNA expression of TIMP1. Although TGF-β1 independently did not significantly increase TIMP1 mRNA expression, we observed a significant increase, in synergistic manner in TIMP1 mRNA levels upon 1,25(OH)2D3 addition, and this effect was more evident in airway fibroblasts from non-asthmatic control subjects. Our results are in line with Britt et al38 findings in which they demonstrated that 1,25(OH)2D3 increases TIMP1 mRNA expression in TNF-α-stimulated human fetal airway smooth muscle (ASM) cells.38 These results may suggest crosstalk between VDR receptor and TGF-β1 or TNF-α signaling pathways in Britt et al38 study, since either agent treatment independently did not significantly increase TIMP1 mRNA expression. Additionally, the overexpression of TIMP1 mRNA in airway fibroblasts from non-asthmatic control group than in asthmatic group reflects once again the differences in defense mechanisms against fibrogenic markers overexpression among the two groups. It has been reported that MMPs deregulation in a remodeling environment is also correlated with a reduced capacity of asthmatic bronchial fibroblasts to degrade collagen.39 Given the increased proteoglycans and collagen deposition in airways subepithelial layer of asthmatic patients, we also examined the effect of 1,25(OH)2D3 and TGF-β1 on mRNA expression of LUM, BGN and COL5A1. Our data demonstrated that TGF-β1 significantly increased their expression in airway fibroblasts from asthmatic patients, suggesting that TGF-β1 may be a critical mediator in airway remodeling signaling pathways and 1,25(OH)2D3 significantly opposes these effects. Interactions between chemokines and cytokines play important roles in regulating tissue repair after injury. It was previously shown that increased levels of CC-chemokines in bronchoalveolar lavage of airways of asthmatics contribute to the increased airway inflammation that can, therefore, lead to increased airway remodeling.40 Our findings corroborate with those of Banerjee et al41 where they reported that 1,25(OH)2D3 inhibits TNF-α-induced CC-chemokine secretion in human ASM cell cultures.41 We reported here that TNF-α-IL-1β, as inflammatory cytokines, are also critical mediators by their additive role in increased airway remodeling observed in airways from severe asthmatic patients.
The proliferative capacity of airway fibroblasts was described by other groups to be correlated with increased airway remodeling in asthma. Beside their fibrogenic properties, TGF-β1 and TNF-α-IL-1β are also key regulators of cell growth and differentiation.35,42 We investigated cell proliferation using dual labeling with BrdU-FITC/7AAD that detects the incorporation of BrdU (thymine analogues) into recently synthesized DNA, as well as the proportion of cells in each cell cycle phase. The advantage of using these dyes is that, inside the cell, they bind DNA with similar stoichiometry and this approach allowed for a clear separation of cells in G0/G1 from S phase or G2/M. Therefore, we quantified the cell cycle phases and confirmed that 1,25(OH)2D3 inhibits HBFCs proliferation, leading to an accumulation of cells in G0/G1 phase. Our results correspond to previously reported studies in which 1,25(OH)2D3 derivatives exerted anti-proliferative effects on numerous cell types,17,43 and this effect was exerted by VDR-transcriptional regulation of several checkpoint proteins in the cell cycle.42 We also highlight a significant difference in cell growth between HBFCs groups, where under the same stimulatory conditions, airway fibroblasts from asthmatic patients exert a higher proliferative capacity than airway fibroblasts from non-asthmatic controls subjects.
So far, the studies on the effects of 1,25(OH)2D3 derivatives on apoptosis are contradictory,19,43 demonstrating once more the complexity of the mechanism behind this action, as well the importance of the experimental conditions and the cellular model applied. It has been proposed that similar regulatory factors control cell proliferation and cell death/apoptosis and that cells can undergo apoptosis after the initial growth arrest.20 We used a well-defined flow cytometry dual staining assay using Annexin V-FITC/7AAD dyes to evaluate the effect of 1,25(OH)2D3 as a possible inducer of apoptosis in HBFCs. Our data showed that the number of early apoptotic HBFCs increased slightly upon the addition of 1,25(OH)2D3, but we observed no difference in late apoptosis in 1,25(OH)2D3-treated HBFCs compared with untreated HBFCs, suggesting that most of the cells preserved their plasma membrane integrity upon 1,25(OH)2D3 treatment. The lack of constitutive expression of BCL2 gene in HBFCs and that 1,25(OH)2D3 addition had no modulatory effects on BAX mRNA let us conclude that 1,25(OH)2D3 anti-proliferative effect observed in HBFCs is not correlated with the induction of apoptosis. Differential expression of BCL2 was also observed in other types of cells17 and our results support Artaza et al43 findings, in which they demonstrated that 1,25(OH)2D3 derivative inhibits mesenchymal multipotent cell proliferation by promoting the cell cycle arrest without inducing apoptosis.43
In conclusion, we have demonstrated that TGF-β1 or TNF-α-IL-1β significantly stimulates mRNA expression and protein secretion of fibrogenic markers and CC-chemokine in human asthmatic airway fibroblasts compared with that observed for normal control subjects. 1,25(OH)2D3 treatment significantly blocked fibrogenic mediators’ effects in HBFCs. Although airway fibroblasts from subjects with asthma expressed similar levels of fibrogenic markers at baseline compared with airway fibroblasts from normal control subjects, our data demonstrated a differential response of airway fibroblasts under mediators’ stimulation. We also demonstrated that under TGF-β1 stimulation, both airway fibroblasts’ groups manifested increased proliferative characteristics. Additionally, 1,25(OH)2D3 exerted inhibitory effects on airway fibroblasts’ growth by mechanisms involving VDR interactions with TGF-β1 fibrogenic signaling pathways and is not associated with the induction of apoptotic cell death. These findings have important clinical significance, identification of 1,25(OH)2D3 interfering TGF-β1/TNF-α stimulatory effects in airway remodeling is thus a great therapeutic interest, particularly in severe asthma resistant to corticosteroid therapies.
Data Sharing Statement
The data that supports the findings of this study are available from the corresponding author upon reasonable request.
Acknowledgments
We would like to thank C Fugere for providing the human bronchial biopsies from asthmatic subjects and to F Zamzameer for DHBFCs isolation and phenotypic characterization. We would also like to acknowledge V Zismanov, S Bhattarai and Q Li for the expert assistance in flow cytometry data acquisition.
Author Contributions
MP performed experiments, results analysis and drafted manuscript; AM and MG participated in the revision of the manuscript; RO performed the bronchial biopsies in patients with severe asthma; SAH advised throughout the course of the study and participated in the revision of the manuscript; QH, as principal investigator, was involved in the project, experimental design and participated in the revision of the manuscript. All authors contributed to data analysis, drafting, or revising the article, gave final approval of the version to be published, and agree to be accountable for all aspects of the work.
Disclosure
Ronald Olivenstein reports personal fees from GSK, outside the submitted work. The authors report no other potential conflicts of interest in this work.
References
1. Al-Muhsen S, Johnson JR, Hamid Q. Remodeling in asthma. J Allergy Clin Immunol. 2011;128(3):
2. Berry M, Brightling C, Pavord I, Wardlaw A. TNF-alpha in asthma. Curr Opin Pharmacol. 2007;7(3):279–282. doi:10.1016/j.coph.2007.03.001
3. Halwani R, Al-Muhsen S, Al-Jahdali H, Hamid Q. Role of transforming growth factor-β in airway remodeling in asthma. Am J Respir Cell Mol Biol. 2011;44(2):127–133. doi:10.1165/rcmb.2010-0027TR
4. Michalik M, Wójcik-Pszczoła K, Paw M, et al. Fibroblast-to-myofibroblast transition in bronchial asthma. Cell Mol Life Sci. 2018;75(21):3943–3961.
5. Teran LM, Mochizuki M, Bartels J, et al. Th1- and Th2-type cytokines regulate the expression and production of eotaxin and RANTES by human lung fibroblasts. Am J Respir Cell Mol Biol. 1999;20(4):777–786.
6. Baeke F, Takiishi T, Korf H, Gysemans C, Mathieu C. Vitamin D: modulator of the immune system. Curr Opin Pharmacol. 2010;10(4):482–496. doi:10.1016/j.coph.2010.04.001
7. Ramirez AM, Wongtrakool C, Welch T, Steinmeyer A, Zügel U, Roman J. Vitamin D inhibition of pro-fibrotic effects of transforming growth factor beta1 in lung fibroblasts and epithelial cells. J Steroid Biochem Mol Biol. 2010;118(3):142–150. doi:10.1016/j.jsbmb.2009.11.004
8. Artaza JN, Norris KC. Vitamin D reduces the expression of collagen and key profibrotic factors by inducing an antifibrotic phenotype in mesenchymal multipotent cells. J Endocrinol. 2009;200(2):207–221. doi:10.1677/JOE-08-0241
9. Wang TT, Tavera-Mendoza LE, Laperriere D, et al. Large-scale in silico and microarray-based identification of direct 1,25-dihydroxyvitamin D3 target genes. Mol Endocrinol. 2005;19(11):2685–2695. doi:10.1210/me.2005-0106
10. Wootton AM. Improving the measurement of 25-hydroxyvitamin D. Clin Biochem Rev. 2005;26(1):33–36.
11. Carlberg C, Seuter S. A genomic perspective on vitamin D signaling. Anticancer Res. 2009;29(9):3485–3493.
12. Lai G, Wu C, Hong J, Song Y. 1,25-dihydroxyvitamin D(3) (1,25-(OH)(2)D(3)) attenuates airway remodeling in a murine model of chronic asthma. J Asthma. 2013;50(2):133–140. doi:10.3109/02770903.2012.738269
13. Berraies A, Hamzaoui K, Hamzaoui A. Link between vitamin D and airway remodeling. J Asthma Allergy. 2014;7:23–30. doi:10.2147/JAA.S46944
14. Chen Y, Zhang J, Ge X, Du J, Deb DK, Li YC. Vitamin D receptor inhibits nuclear factor κB activation by interacting with IκB kinase β protein. J Biol Chem. 2013;288(27):19450–19458. doi:10.1074/jbc.M113.467670
15. Xie S, Sukkar MB, Issa R, Khorasani NM, Chung KF. Mechanisms of induction of airway smooth muscle hyperplasia by transforming growth factor-beta. Am J Physiol Lung Cell Mol Physiol. 2007;293(1):L245–L253. doi:10.1152/ajplung.00068.2007
16. Sullivan DE, Ferris M, Pociask D, Brody AR. Tumor necrosis factor-alpha induces transforming growth factor-beta1 expression in lung fibroblasts through the extracellular signal-regulated kinase pathway. Am J Respir Cell Mol Biol. 2005;32(4):342–349. doi:10.1165/rcmb.2004-0288OC
17. Tabasi N, Rastin M, Mahmoudi M, et al. Influence of vitamin D on cell cycle, apoptosis, and some apoptosis related molecules in systemic lupus erythematosus. Iran J Basic Med Sci. 2015;18(11):1107–1111.
18. Martinesi M, Treves C, d’Albasio G, Bagnoli S, Bonanomi AG, Stio M. Vitamin D derivatives induce apoptosis and downregulate ICAM-1 levels in peripheral blood mononuclear cells of inflammatory bowel disease patients. Inflamm Bowel Dis. 2008;14(5):597–604. doi:10.1002/ibd.20354
19. Morales O, Samuelsson MK, Lindgren U, Haldosén LA. Effects of 1alpha,25-dihydroxyvitamin D3 and growth hormone on apoptosis and proliferation in UMR 106 osteoblast-like cells. Endocrinology. 2004;145(1):87–94. doi:10.1210/en.2003-0718
20. McGuire TF, Trump DL, Johnson CS. Vitamin D(3)-induced apoptosis of murine squamous cell carcinoma cells. Selective induction of caspase-dependent MEK cleavage and up-regulation of MEKK-1. J Biol Chem. 2001;276(28):26365–26373. doi:10.1074/jbc.M010101200
21. Zhang A, Wang Y, Xie H, Zheng S. Calcitriol inhibits hepatocyte apoptosis in rat allograft by regulating apoptosis-associated genes. Int Immunopharmacol. 2007;7(8):1122–1128. doi:10.1016/j.intimp.2007.03.007
22. Doherty T, Broide D. Cytokines and growth factors in airway remodeling in asthma. Curr Opin Immunol. 2007;19(6):676–680. doi:10.1016/j.coi.2007.07.017
23. Suzuki R, Kato T, Miyazaki Y, et al. Matrix metalloproteinases and tissue inhibitors of matrix metalloproteinases in sputum from patients with bronchial asthma. J Asthma. 2001;38(6):477–484. doi:10.1081/JAS-100105868
24. Chung KF, Wenzel SE, Brozek JL, et al. International ERS/ATS guidelines on definition, evaluation and treatment of severe asthma. Eur Respir J. 2014;43(2):343–373. doi:10.1183/09031936.00202013
25. Baglole CJ, Reddy SY, Pollock SJ, et al. Isolation and phenotypic characterization of lung fibroblasts. Methods Mol Med. 2005;117:115–127. doi:10.1385/1-59259-940-0:115
26. Geilen CC, Bektas M, Wieder T, Kodelja V, Goerdt S, Orfanos CE. 1alpha,25-dihydroxyvitamin D3 induces sphingomyelin hydrolysis in HaCaT cells via tumor necrosis factor alpha. J Biol Chem. 1997;272(14):8997–9001. doi:10.1074/jbc.272.14.8997
27. Yu Y, Lin D, Cai X, et al. Enhancement of chemokine mRNA expression by toll-like receptor 2 stimulation in human peripheral blood mononuclear cells of patients with atopic dermatitis. Biomed Res Int. 2020;2020:1497175. doi:10.1155/2020/1497175
28. Cecchini MJ, Amiri M, Dick FA. Analysis of cell cycle position in mammalian cells. J Vis Exp. 2012;59:e3491.
29. Darzynkiewicz Z, Juan G. Analysis of DNA content and BrdU incorporation. Curr Protoc Cytom. 2001;Chapter 7:
30. Xiang J, Wan C, Guo R, Guo D. Is hydrogen peroxide a suitable apoptosis inducer for all cell types? Biomed Res Int. 2016;2016:7343965. doi:10.1155/2016/7343965
31. Kim HA, Kim MC, Kim NY, Kim Y. Inhibition of hedgehog signaling reduces the side population in human malignant mesothelioma cell lines. Cancer Gene Ther. 2015;22(8):387–395. doi:10.1038/cgt.2015.31
32. Pirzad Jahromi G, Ghanei M, Hosseini SK, et al. Characterization of lung fibroblasts more than two decades after mustard gas exposure. PLoS One. 2015;10(12):e0145148. doi:10.1371/journal.pone.0145148
33. Chetta A, Foresi A, Del Donno M, Bertorelli G, Pesci A, Olivieri D. Airways remodeling is a distinctive feature of asthma and is related to severity of disease. Chest. 1997;111(4):852–857. doi:10.1378/chest.111.4.852
34. Ingram JL, Huggins MJ, Church TD, et al. Airway fibroblasts in asthma manifest an invasive phenotype. Am J Respir Crit Care Med. 2011;183(12):1625–1632. doi:10.1164/rccm.201009-1452OC
35. Tufvesson E, Westergren-Thorsson G. Alteration of proteoglycan synthesis in human lung fibroblasts induced by interleukin-1beta and tumor necrosis factor-alpha. J Cell Biochem. 2000;77(2):298–309. doi:10.1002/(SICI)1097-4644(20000501)77:2<298::AID-JCB12>3.0.CO;2-D
36. Cataldo DD, Gueders M, Munaut C, et al. Matrix metalloproteinases and tissue inhibitors of matrix metalloproteinases mRNA transcripts in the bronchial secretions of asthmatics. Lab Invest. 2004;84(4):418–424. doi:10.1038/labinvest.3700063
37. Johnson S, Knox A. Autocrine production of matrix metalloproteinase-2 is required for human airway smooth muscle proliferation. Am J Physiol. 1999;277(6):L1109–L1117. doi:10.1152/ajplung.1999.277.6.L1109
38. Britt RD, Faksh A, Vogel ER, et al. Vitamin D attenuates cytokine-induced remodeling in human fetal airway smooth muscle cells. J Cell Physiol. 2015;230(6):1189–1198. doi:10.1002/jcp.24814
39. Laliberté R, Rouabhia M, Bossé M, Chakir J. Decreased capacity of asthmatic bronchial fibroblasts to degrade collagen. Matrix Biol. 2001;19(8):743–753. doi:10.1016/S0945-053X(00)00120-7
40. Lamkhioued B, Renzi PM, Abi-Younes S, et al. Increased expression of eotaxin in bronchoalveolar lavage and airways of asthmatics contributes to the chemotaxis of eosinophils to the site of inflammation. J Immunol. 1997;159(9):4593–4601.
41. Banerjee A, Damera G, Bhandare R, et al. Vitamin D and glucocorticoids differentially modulate chemokine expression in human airway smooth muscle cells. Br J Pharmacol. 2008;155(1):84–92. doi:10.1038/bjp.2008.232
42. Damera G, Fogle HW, Lim P, et al. Vitamin D inhibits growth of human airway smooth muscle cells through growth factor-induced phosphorylation of retinoblastoma protein and checkpoint kinase 1. Br J Pharmacol. 2009;158(6):1429–1441. doi:10.1111/j.1476-5381.2009.00428.x
43. Artaza JN, Sirad F, Ferrini MG, Norris KC. 1,25(OH)2vitamin D3 inhibits cell proliferation by promoting cell cycle arrest without inducing apoptosis and modifies cell morphology of mesenchymal multipotent cells. J Steroid Biochem Mol Biol. 2010;119(1–2):73–83. doi:10.1016/j.jsbmb.2010.01.001
 © 2020 The Author(s). This work is published and licensed by Dove Medical Press Limited. The full terms of this license are available at https://www.dovepress.com/terms.php and incorporate the Creative Commons Attribution - Non Commercial (unported, v3.0) License.
By accessing the work you hereby accept the Terms. Non-commercial uses of the work are permitted without any further permission from Dove Medical Press Limited, provided the work is properly attributed. For permission for commercial use of this work, please see paragraphs 4.2 and 5 of our Terms.
© 2020 The Author(s). This work is published and licensed by Dove Medical Press Limited. The full terms of this license are available at https://www.dovepress.com/terms.php and incorporate the Creative Commons Attribution - Non Commercial (unported, v3.0) License.
By accessing the work you hereby accept the Terms. Non-commercial uses of the work are permitted without any further permission from Dove Medical Press Limited, provided the work is properly attributed. For permission for commercial use of this work, please see paragraphs 4.2 and 5 of our Terms.