")
Back to Journals » International Journal of General Medicine » Volume 14
Acoustic Characteristics of Voice in Patients with Chronic Kidney Disease
Authors Abd El-gaber FM, Sallam Y , Mohammed Eid El Sayed H
Received 21 February 2021
Accepted for publication 20 May 2021
Published 11 June 2021 Volume 2021:14 Pages 2465—2473
DOI https://doi.org/10.2147/IJGM.S307684
Checked for plagiarism Yes
Review by Single anonymous peer review
Peer reviewer comments 2
Editor who approved publication: Dr Scott Fraser
Fatma Mohammed Abd El-gaber,1 Yossra Sallam,2 Hanaa Mohammed Eid El Sayed3
1Otorhinolaryngology Department, Faculty of Medicine for Girls, Al-Zahraa Hospital, Al Azhar University, Cairo, Egypt; 2Phoniatrics, Otorhinolaryngology Department, Faculty of Medicine for Girls, Al-Zahraa Hospital, Al Azhar University, Cairo, Egypt; 3Internal Medicine Department, Faculty of Medicine for Girls, Al-Zahraa Hospital, Al Azhar University, Cairo, Egypt
Correspondence: Fatma Mohammed Abd El-gaber
Otorhinolaryngology Department, Faculty of Medicine for Girls, Al-Zahraa Hospital, Al Azhar University, 12 Ibrahim-Nagy Street, Nasr, Cairo 11824, Egypt
Tel +20 11-2445-4762
Email [email protected]
Purpose: To investigate the multifactorial effects of chronic kidney disease (CKD) and hemodialysis (HD) on subjects’ voices by examining correlations between laboratory investigations, respiratory function, and acoustic voice parameters.
Methods: This case–control study was conducted on 60 participants aged 18− 50 years, divided equally into three groups: controls (no health problems or voice disorders), cCKD (stage 3– 5, no HD HD]), HD, and CKD stage 5. The study took 21 months. All participants underwent general and otolaryngological examinations, followed by laboratory investigations (hemoglobin, uric acid, HCO3, estimated glomerular filtration rate, urea, urea-reduction ratio, and creatinine), respiratory function tests, and acoustic voice analysis.
Results: There were significant differences between the control and HD groups for jitter, shimmer, and harmonic:noise (HNR) ratio (P=0 and between the control and CKD groups for shimmer and HNR (P=0), with no significant difference between HD and CKD. There were statistically significant correlations between duration of HD and HNR, jitter percentage, and shimmer percentage (P=0.
Conclusion: Systemic effects of CKD and HD were found to impair the acoustic characteristics of voice in both groups. Regression analysis revealed that hemoglobin, uric acid, and expiratory time were the most significant predictors of impaired acoustic characteristics.
Keywords: CKD, hemodialysis, voice changes, pulmonary functions, eGFR
Introduction
Normal voice production requires interactions among the power source, vibrator, and resonators. The power source (adequate respiratory support) compresses air and forces it toward the larynx. The vocal folds close and open, permitting small bursts of air to escape through them to produce mucosal vibrations.1 This complex dynamic process requires harmony between the respiratory and laryngeal muscles.
The lungs and kidneys are connected physiologically and pathologically in healthy individuals and patients with CKD, whether on hemodialysis (HD) or not.2 Chronic kidney disease (CKD) is a beyond-repair condition that impedes the function of various body systems, particularly the respiratory system. The potency of the respiratory and laryngeal muscles, among generalized muscle weakness, is extensively impaired.3
CKD may also be complicated by pulmonary edema, pleurisy with subsequent chest pain and fibrothorax, predisposition to such infections as tuberculosis, pulmonary calcifications, and/or urinothorax.4 In addition, patients on HD often suffer generalized muscle weakness and fatigue that may affect muscles of respiration and phonation, which in turn will affect respiratory support and strongly impair voice quality.5 With an estimated prevalence of 15.2% among patients on HD, the etiology of dysphonia among these patients should be completely unveiled.6
Objectives
This study aimed to investigate the multifactorial effects of CKD and HD on subjects’ voices by examining correlations between laboratory investigations, respiratory function, and acoustic voice parameters.
Methods
This was a case–control study conducted on 60 participants presenting to the otorhinolaryngology and internal medicine outpatient clinics at Al-Zahraa University Hospital from September 2018 to June 2020.
participants were aged 18−50 years, and they were divided equally into three groups:
- Control group: free from any systemic disorder or voice disorders.
- CKD group: CKD stage 3–5 not on HD. They were diagnosed by nephrologists with clinical and laboratory investigations and estimated glomerular filtration rate (eGFR) using the Modification of Drugs in Renal Disease equation:7eGFR (mL/min per 1.73 m2) = 175 × serum creatinine – 1.154 × age – 0.203 × 1.212 (if patient is black) × 0.742 (if female)
- HD group (CKD stage 5): patients had been on HD >1 year. They underwent three sessions of HD per week, and every session took 4 hours.
All cases underwent full history-taking, general examination(weight and height, and head and neck examination, including, nose, pharynx, and larynx)laryngeal examination using rigid a 70° endoscope (Karl Storz),acoustic analysis of the voice including (fundamental frequency [f0], shimmer percentage [S%], jitter percentage [J%], and harmonic:noise ratio [HNR]) using a PreSonus Audio Electronics voice analyzerpulmonary function tests (vital capacity [VC], forced VC[FVC]forced expiratory volume in 1 second [FEV1]forced expiratory flow[FEF25%FEF75%], expiratory time, and FEV1/FVC)and laboratory investigations (hemoglobin, uric acid, HCO3eGFR,urea, urea-reduction ratio and creatinine). Cases with a history of functional or organic voice disorders (eg, vocal abuse, nodules, or polyps), systemic diseases (bronchial asthma), smokers, females on hormonal therapy, and those who refused to participate were all excluded.
Statistical Analysis
Data were collected, revised, coded and entered into SPSS 20.8 Qualitative data are presented as numbers and percentages and quantitative data as means ± SD and ranges when their distribution was parametric. Comparisons between two groups with qualitative data were done using #x1D712;2 tests. Comparisons between two independent groups with quantitative data and parametric distribution was done using independent t-tests. ANOVA was used to analyze differences between means of the three studied groups. Post hoc tests were run to confirm differences between groups on one-way ANOVA showed statistically significant differences in group means. Pearson’s correlation coefficient was used to measure correlations between quantitative variables. Linear regression analysis was done for prediction of acoustic parameters. The CI was set to 95% and the margin of error accepted set to 5%. P<0.05was considered significant.
Results
Figures 1 and 2 show that the groups were matched regarding age and sex(P=0.069 and 0.714, respectively).
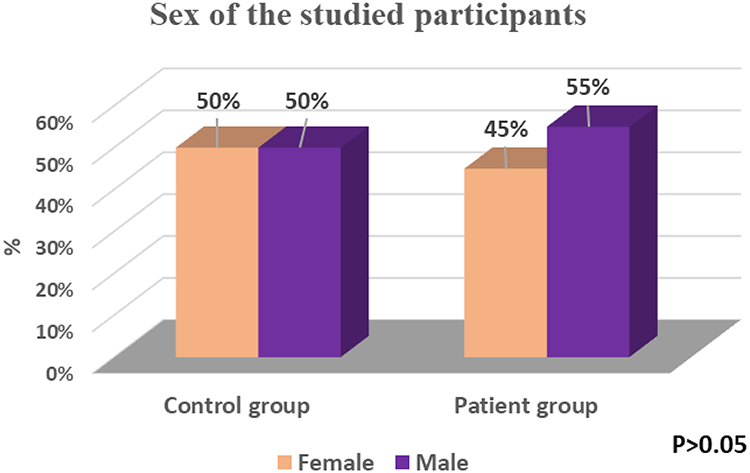 |
Figure 1 Sex of participants. |
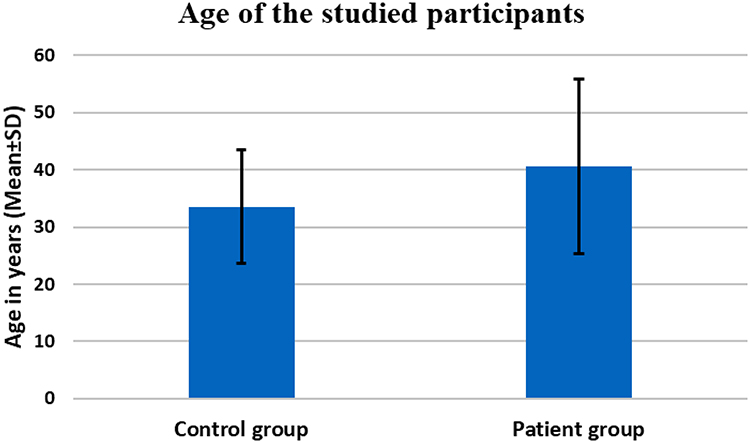 |
Figure 2 Age of participants. Abbreviation: SD, Standard deviation. |
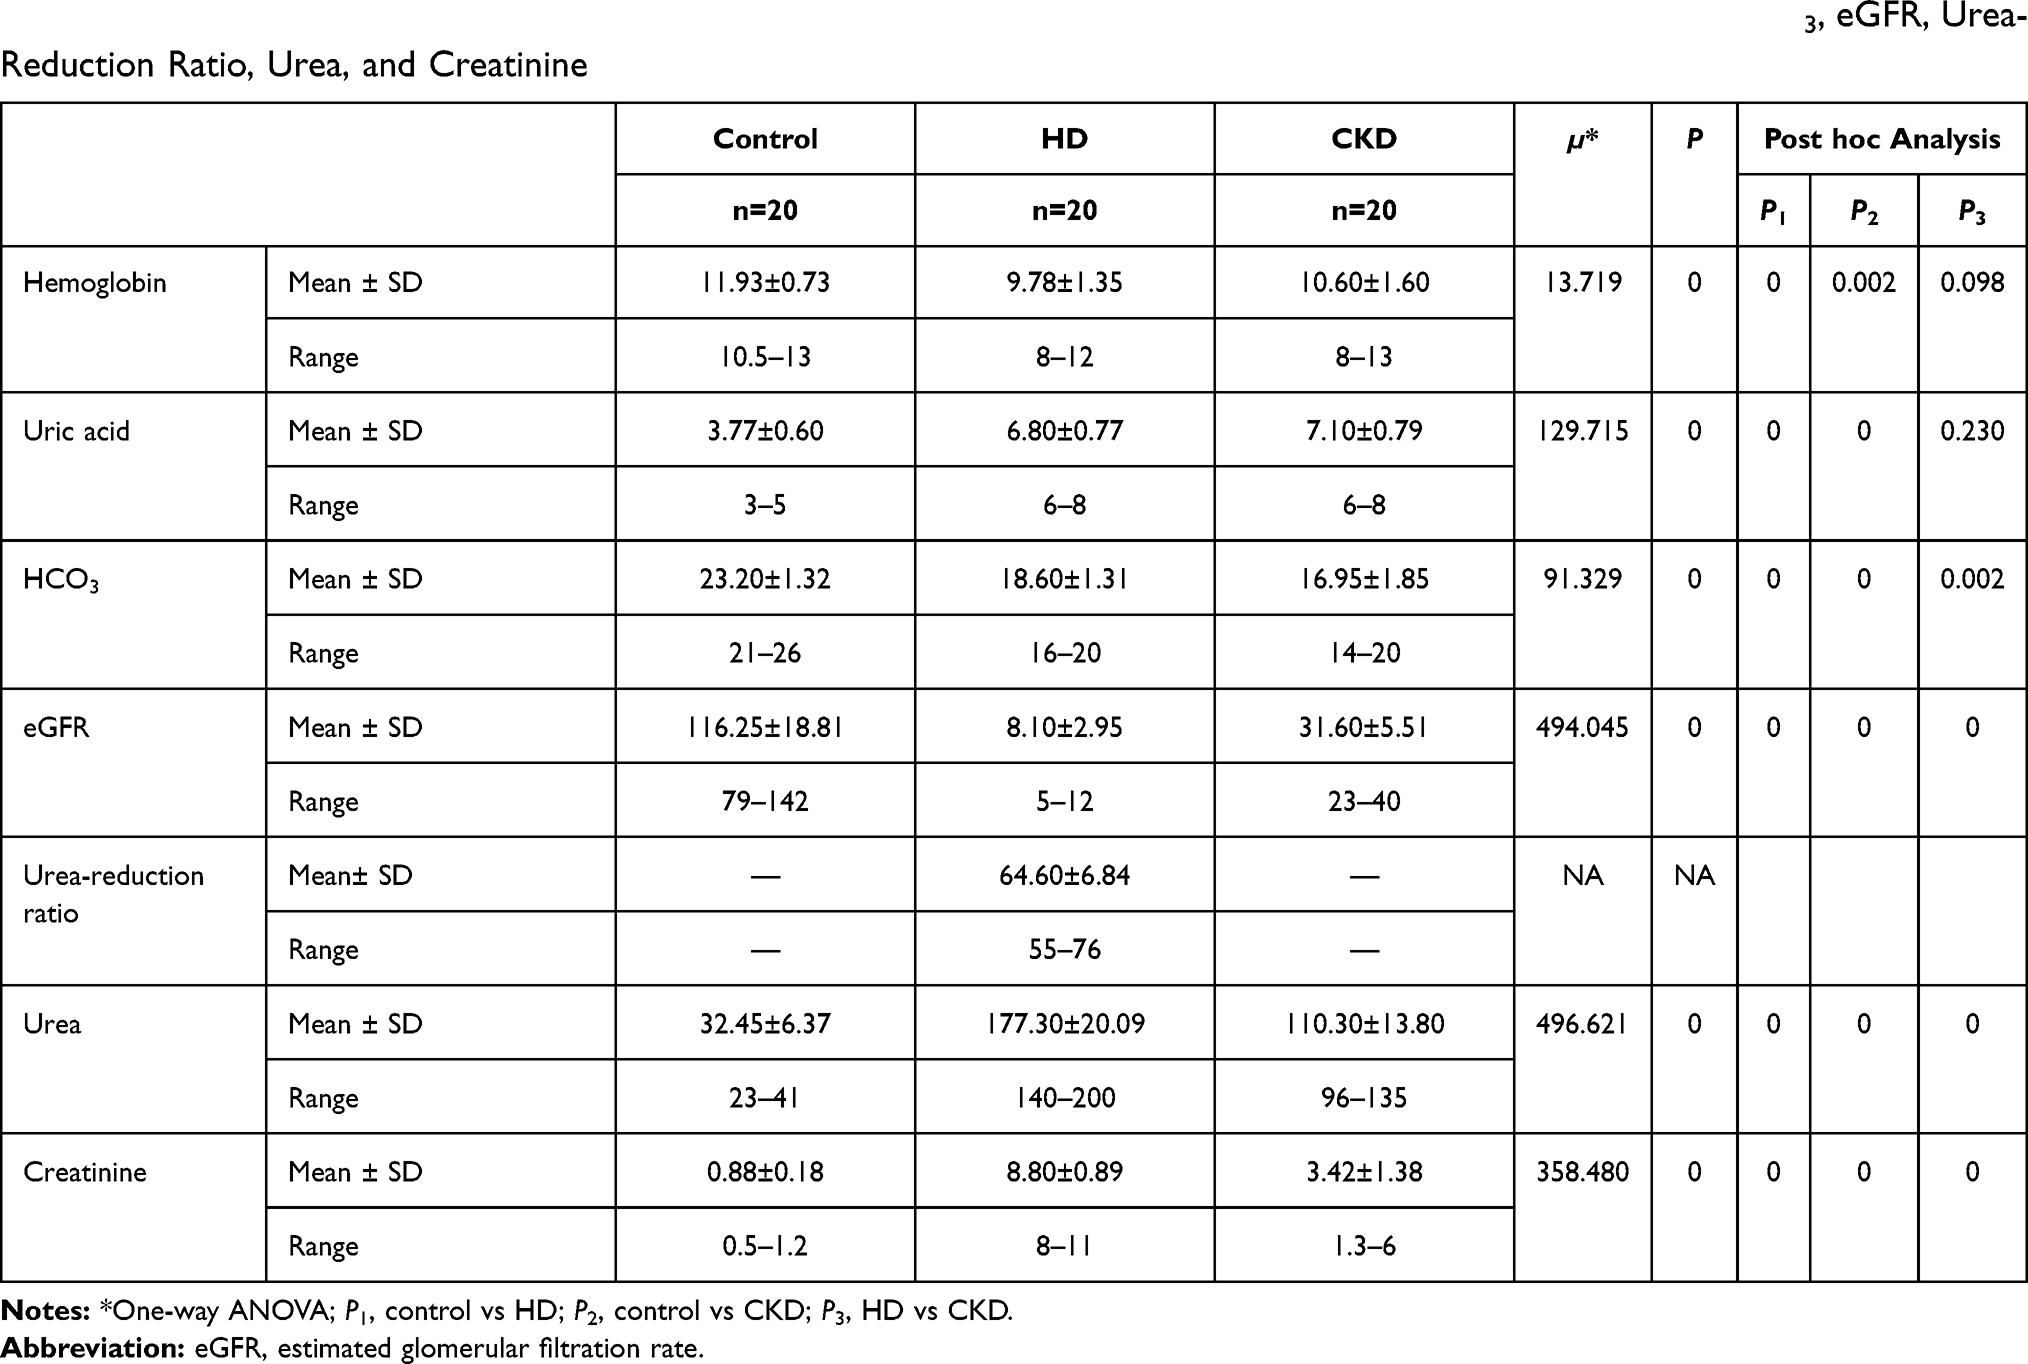 |
Table 1 Comparisons Among Control (n=20), HD (n= 20), and CKD (n=20) groups on Hemoglobin, Uric Acid, HCO3, eGFR, Urea-Reduction Ratio, Urea, and Creatinine |
Table 2 shows that there were statistically significant differences among the three groups for VC (P=0), FVC (P=0), FEV1 (P=0), FEV1/FVC (P=0), FEF FEF25% (P=0), and FEF75% (P=0). Post hoc analysis showed significant differences between the control and HD groups on all parameters (P=0, 0, 0, 0.030, 0, and 0 for VC, FVC, FEV1, FEV1/FVC, FEF25%, and FEF75%, respectively) except expiratory time (P=0.907) and significant differences between the control and CKD groups on all parameters (P=0, 0, 0, 0, 0.010, 0, and 0 for VC, FVC, FEV1, FEV1/FVC, FEF25%, and FEF75%, respectively) except expiratory time (P=0.606). The HD and CKD groups showed nonsignificant differences on all parameters (P=0.550, 0.037, 0.130, 0.026, 0.777, 0.176, and 0.498 for expiratory time, VC, FVC, FEV1, FEV1/FVC, FEF25%, and FEF75%, respectively).
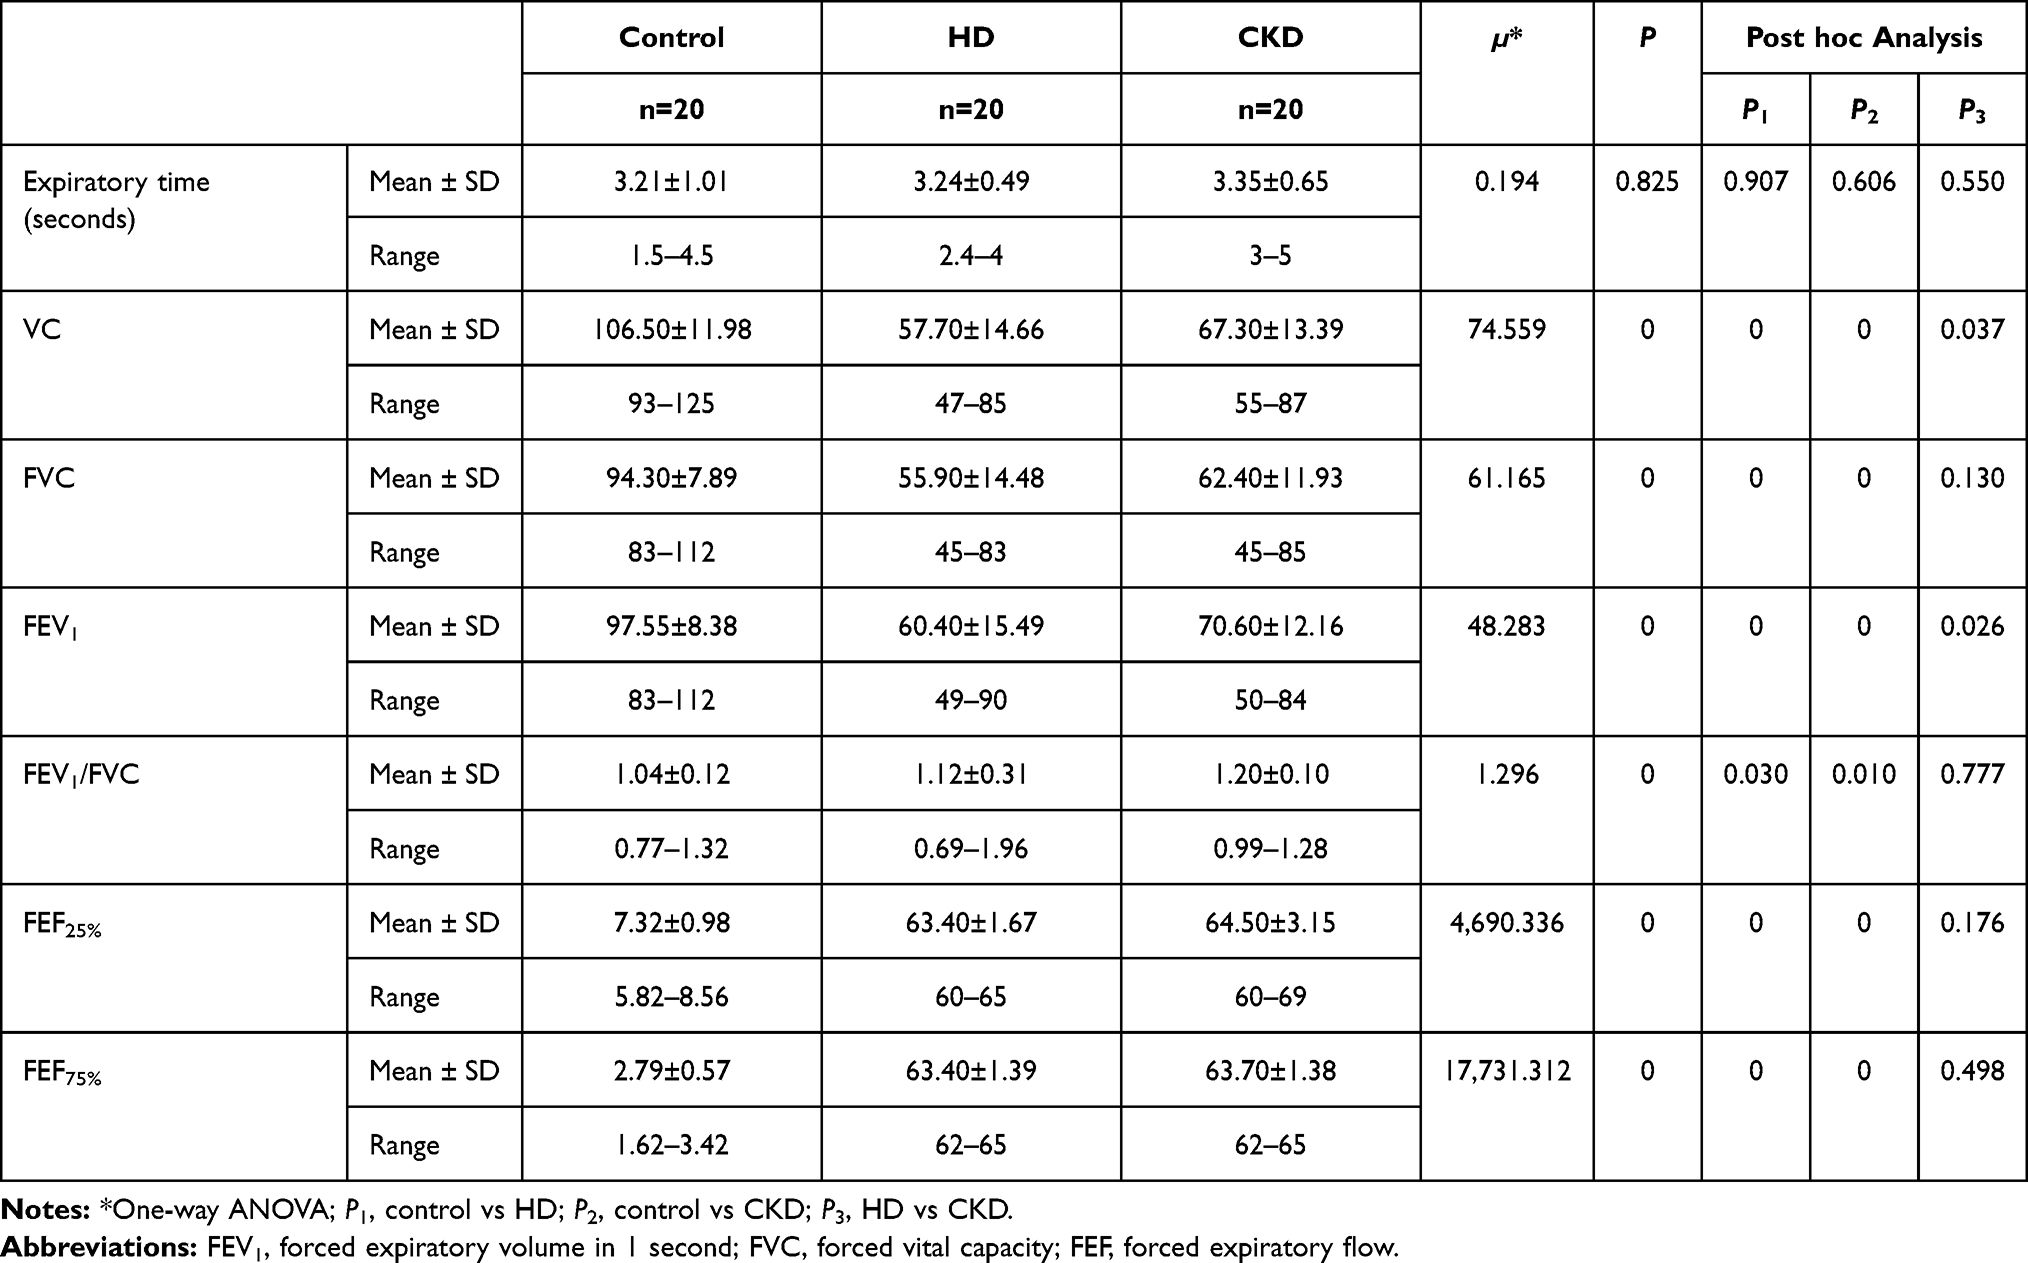 |
Table 2 Comparisons Among Control (n=20), HD (n= 20), and CKD (n=20) Groups on Respiratory Function Tests |
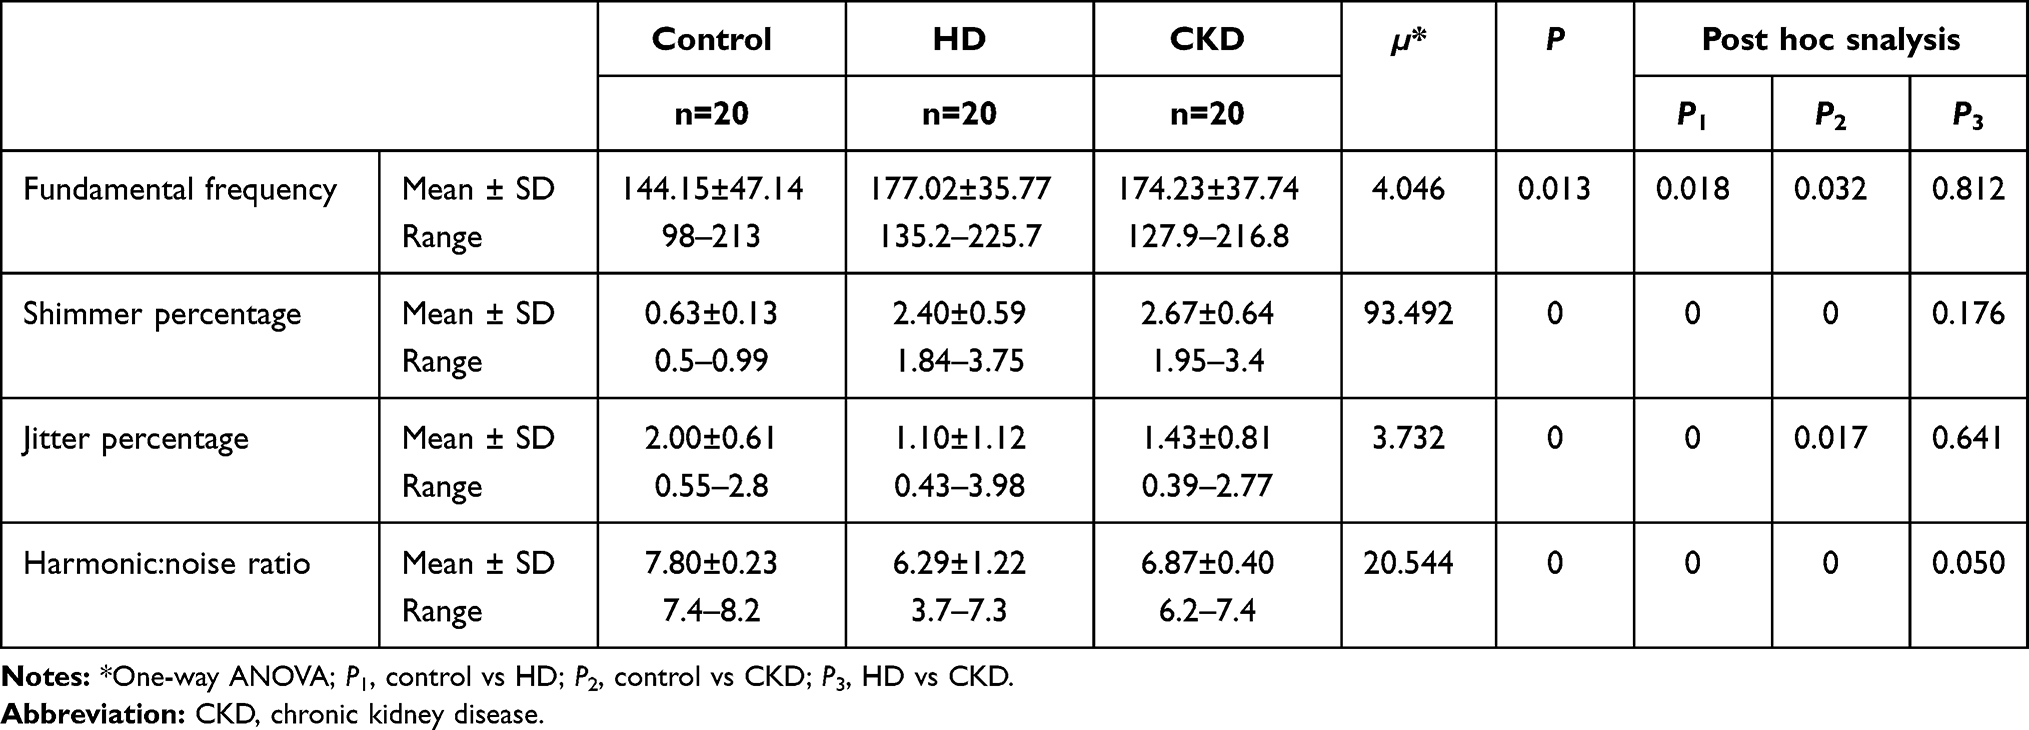 |
Table 3 Comparisons Among Control (n=20), HD (n= 20), and CKD (n=20) Groups on Acoustic Parameters |
Table 4 shows that there was a statistically significant positive correlation between duration of HD and HNR (P=0 and statistically significant negative correlation between duration of HD and S% (P=0) and duration of HD and J%(P=0).
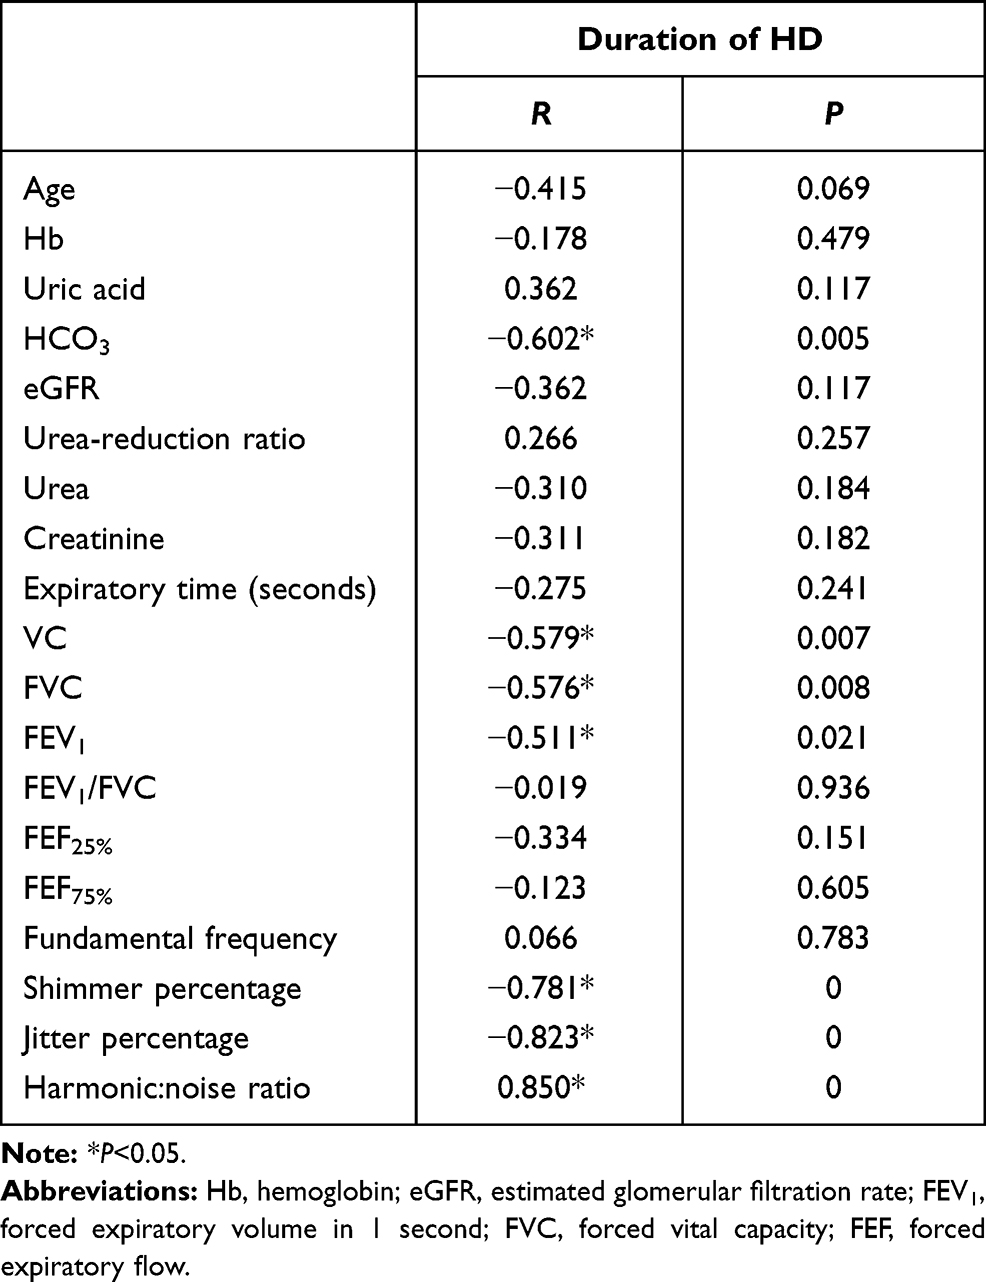 |
Table 4 Correlations between duration of HD and demographic data, laboratory tests, respiratory function tests, and acoustic parameters |
Table 5 shows that in the HD group, there were statistically significant positive correlations between creatinine and f0, Sh%, and J%percent (P=0.002, 0.014, and 0.004 respectively) and a statistically significant negative correlation between creatinine and HNR (P=0.044). There was statistically significant positive correlations between expiratory time, VC, FVC, and FEV1 and J%(P=0.024, 0.001, 0.001, and 0 respectively) and between FEV1 and S% and FEF25% and S% (P=0.002 and 0.009, respectively). There was statistically significant negative correlations between VC, FVC, FEV1, and FEF25% and HNR (P=0.037, 0.040, 0, and 0.022, respectively).
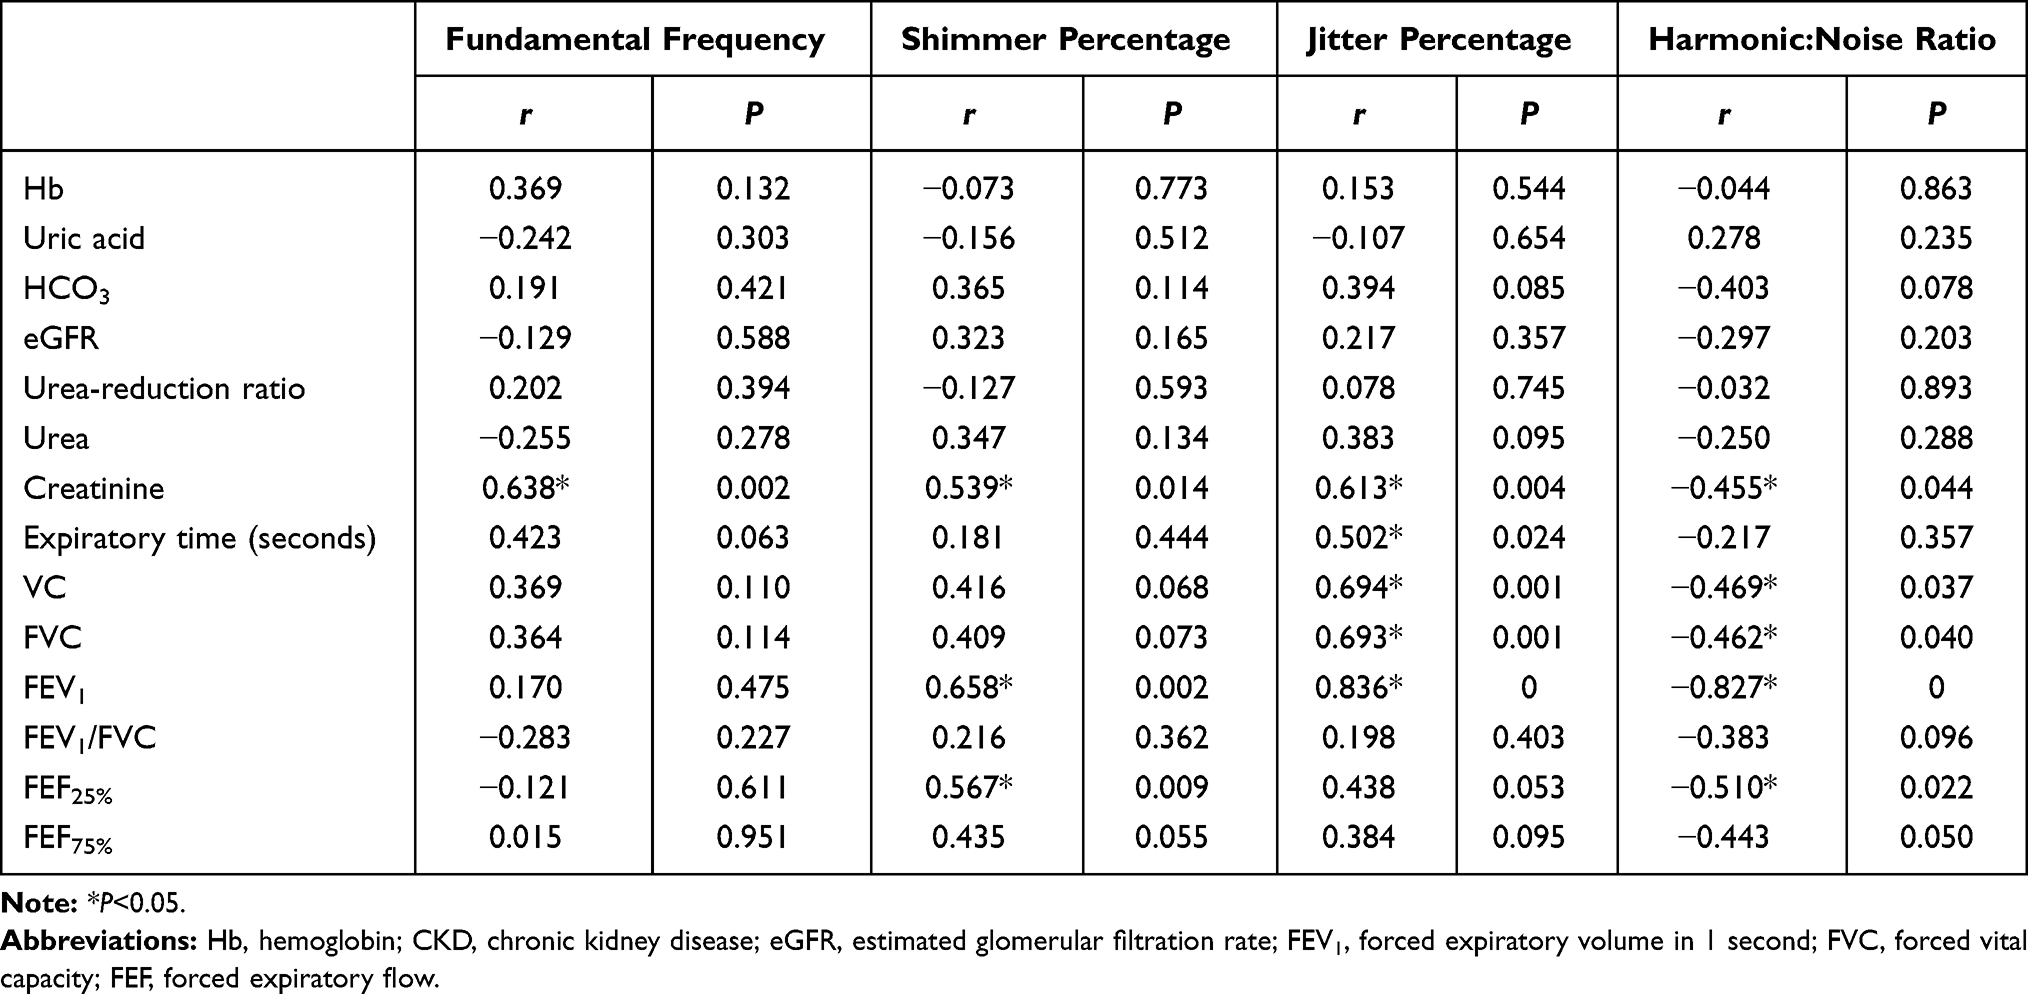 |
Table 5 Correlations Between Laboratory Tests and Respiratory Function Tests Against Acoustic Parameters in the HD Group |
Table 6 shows that in the CKD group, there were statistically significant positive correlations between hemoglobin, eGFR, FVC and FEV1 and HNR (P=0.002, 0, 0.019, and 0.022 respectively), and statistically significant negative correlations between both urea and creatinine and HNR ratio (P=0 and 0.001, respectively). It also reveals a statistically significant negative correlation between HCO3 and f0 (P=0.020), and between expiratory time and J% (P=0.037). In addition to statistically significant negative correlation between FEF25% and S% and between FEF75% and J% (P=0.029 and 0.024 respectively).
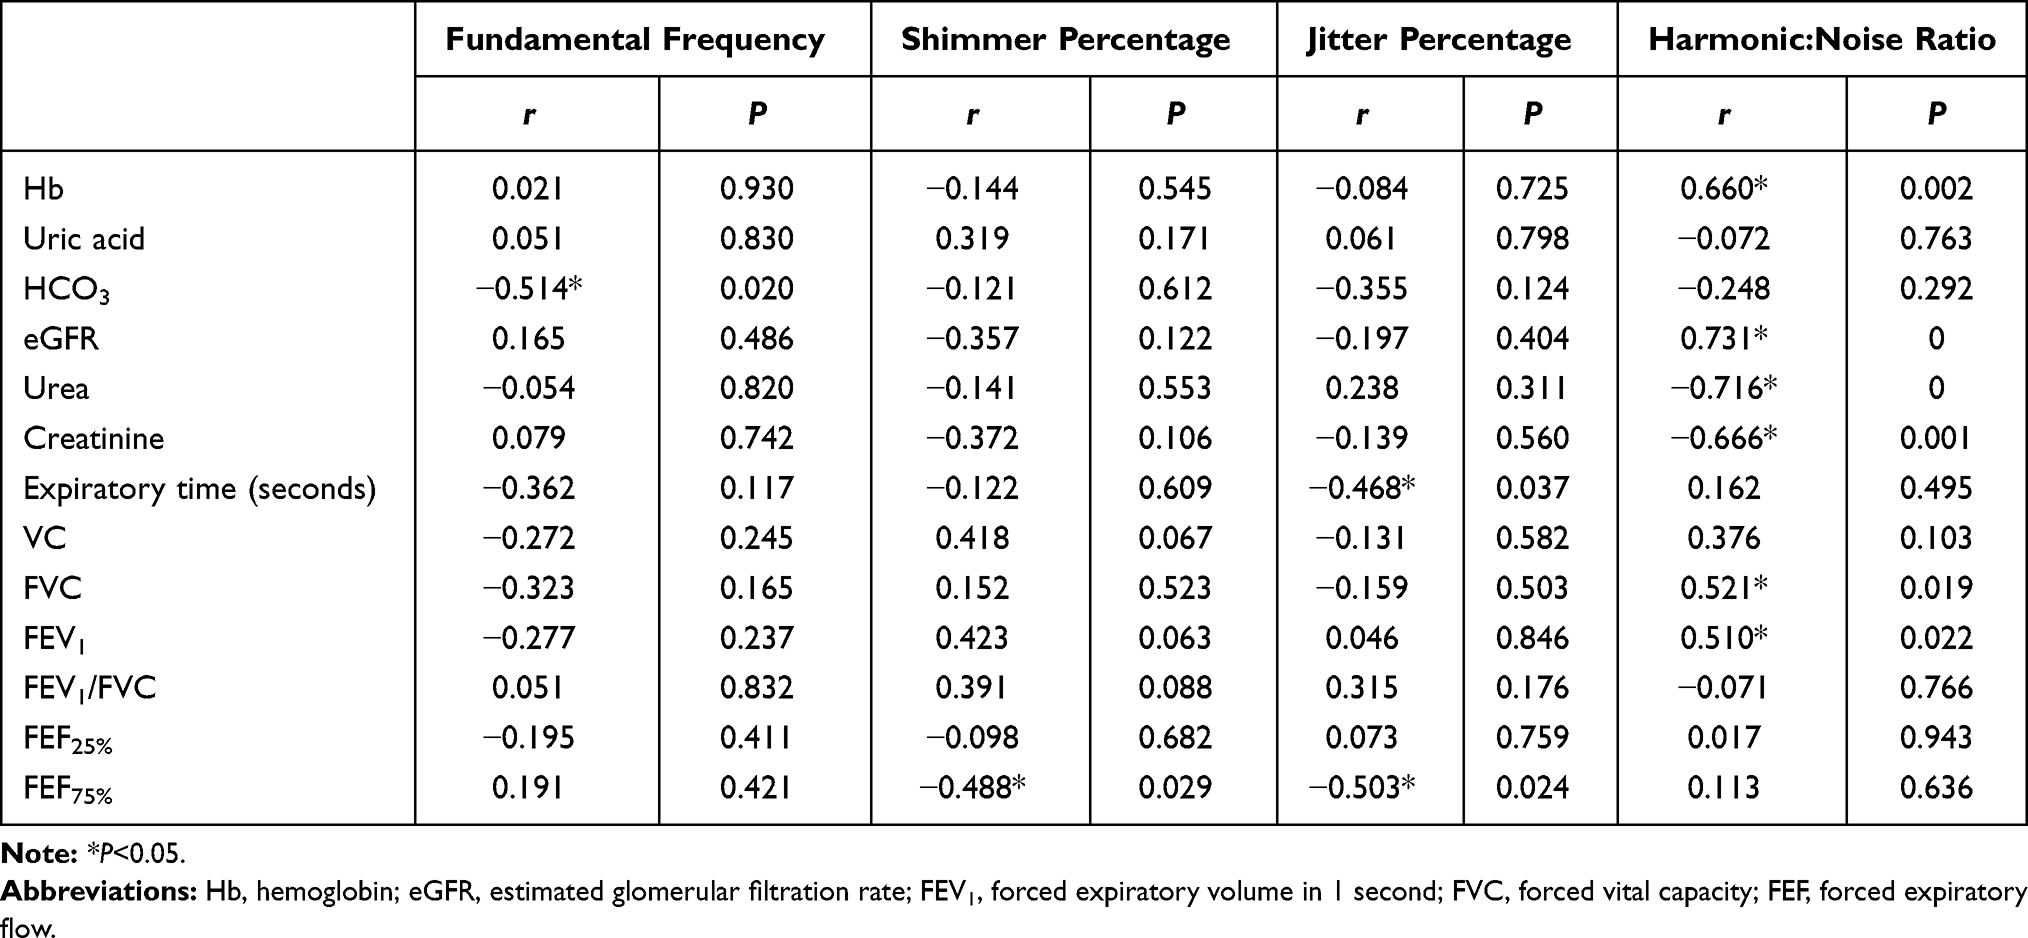 |
Table 6 Correlations between Laboratory Tests and Respiratory Function Tests Against Acoustic Parameters in the CKD Group |
Table 7 shows that the most relevant significant factors predicting f0 were Hb, uric acid, eGFR, urea-reduction ratio, urea, expiratory time, and FVC and the most relevant significant factors predicting J% were Hb, uric acid, HCO3, urea-reduction ratio, creatinine, expiratory time, VC, and FEF25%. It also shows that the most relevant significant factors predicting S% were uric acid, eGFR, urea-reduction ratio, urea, expiratory time, FVC, FEV1/FEV5, and FEF75% and the most relevant significant factors predicting HNR were Hb, HCO3, eGFR, creatinine, FVC, FEV1/FEV5, FEF25%, andFEF25%. Regression analysis revealed that hemoglobin, uric acid, and expiratory time were the most significant predictors for impaired acoustic characteristics.
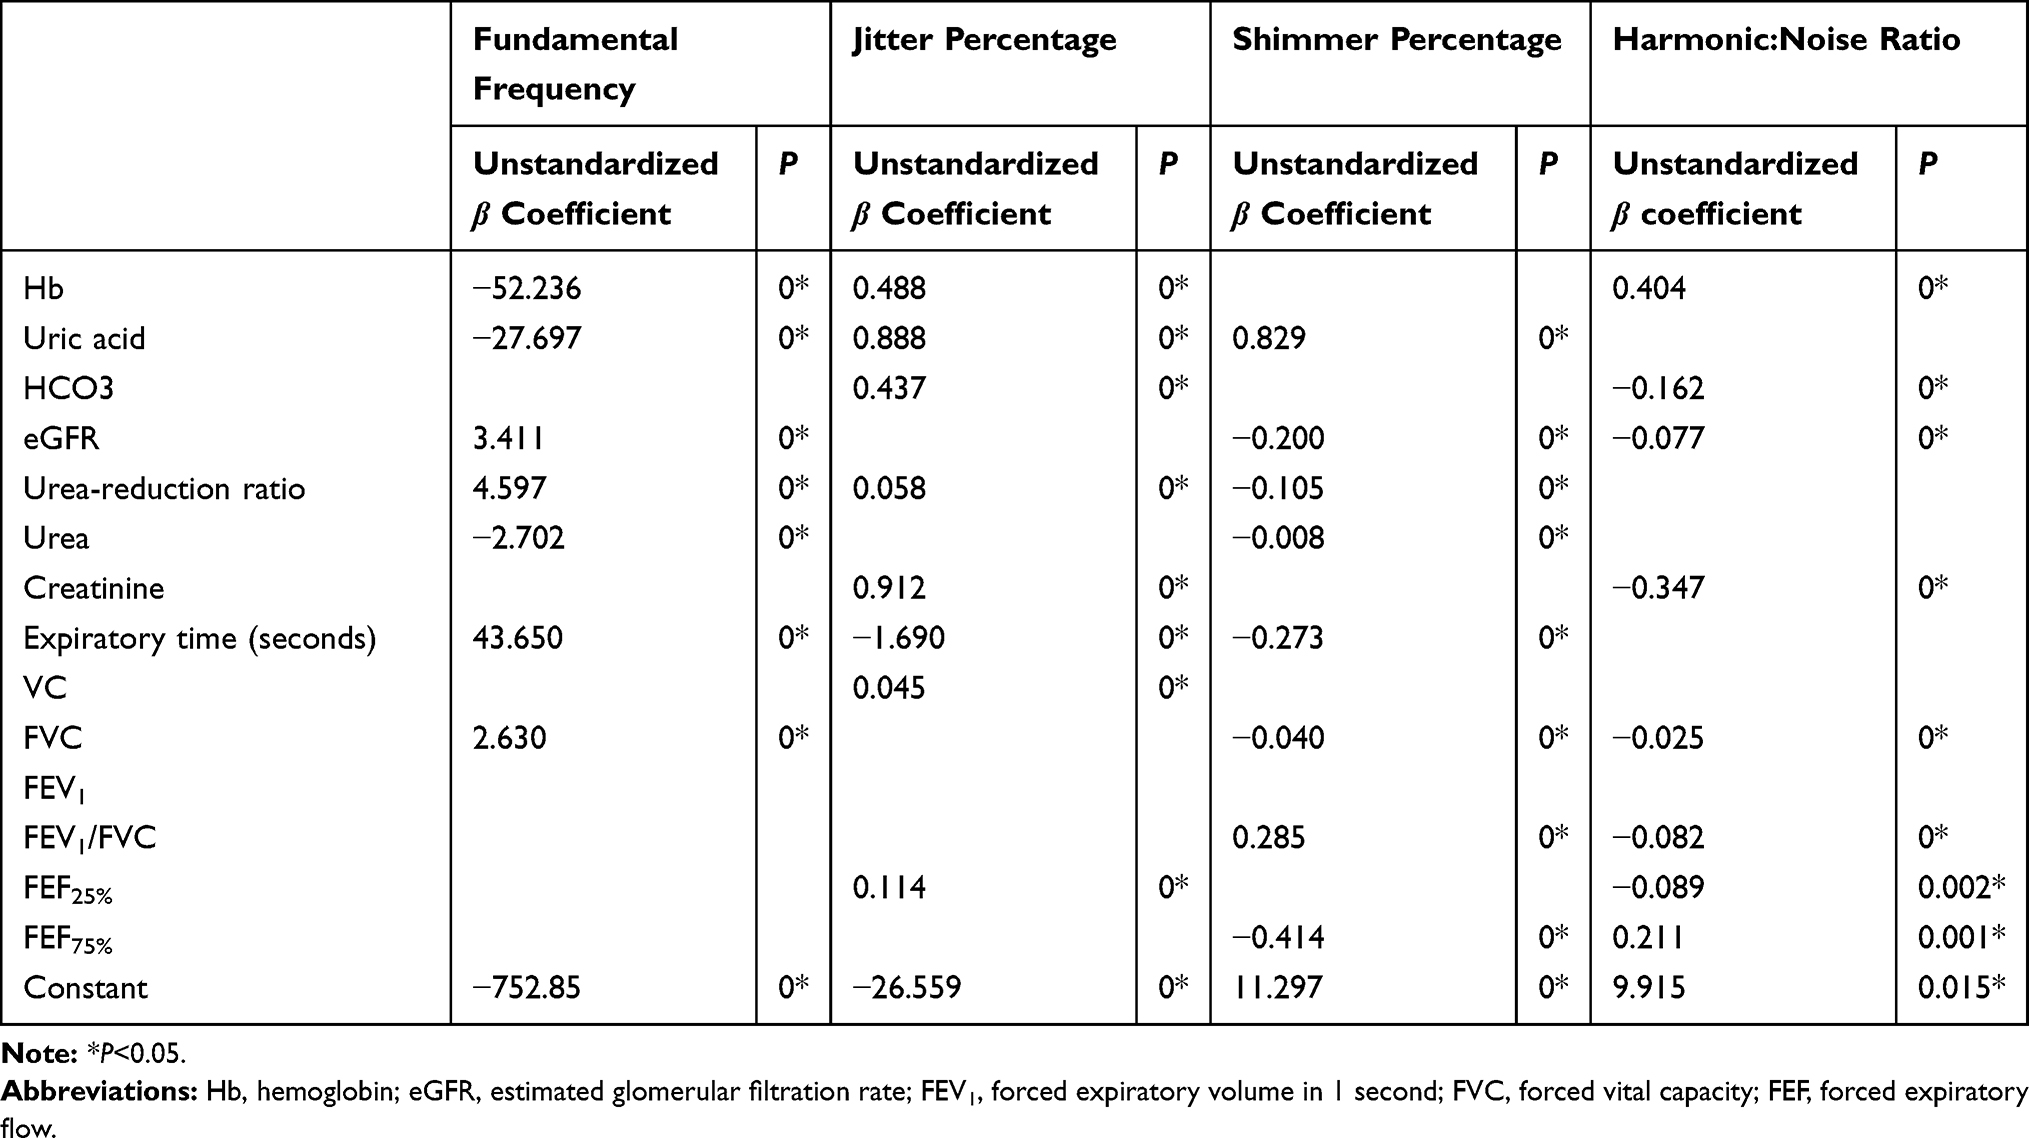 |
Table 7 Linear Regression for Predictors of Changes of Acoustic Parameters |
Discussion
Dysphonia has been reported among chronic kidney disease and hemodialyzed patients. However, its exact etiology has been little discussed. For optimal vibration to occur, the vocal folds need sufficient hydration, both systemic within the tissues of the larynx and superficial to its lumen. The kidneys play the major role in maintaining and balancing hydration within the human body, and their impairment will in turn affect voice production. Sivasankar and Leydon assumed that vocal hygiene and phonatory competence improved with adequate hydration.9
All patients in the current study underwent laboratory investigations and respiratory function tests. Laboratory investigations were Hb, uric acid, HCO3, eGFR, urea-reduction ratio, urea, and creatinine. Urea-reduction ratio was used to assess the efficiency of HD before voice analysis. If the HD had been inefficient, the voice analysis would be postponed. eGFR was used to assess residual kidney function in HD patients because it is more convenient than isotope scans. The results of the current study showed significant increases in uric acid, urea, and creatinine and significant decreases in Hb, HCO3, and eGFR in all patients in comparison to the normal group. The increases in urea and creatinine were responsible for increases in f0 and S%, in patients on HD, and increase in urea and creatinine together with decreases in Hb and eGFR were responsible for the reduction in HNR in patients with CKD. Similarly, Sagiroglu and Doganer declared that increases uric acid, creatinine, and Na+ are most probably responsible for changes in vocal parameters in patients with renal failure, particularly after HD.10
Cases et al reported that patients with reduced eGFR frequently suffer from anemia.11 They proposed that anemia may be responsible in part for the generalized muscle weakness and fatigue in those patients. In addition, HCO3 reflects the degree of regulation of extracellular fluid buffering. The lungs and kidneys cooperate to maintain this system.12 Reduction in HCO3 induces hyperventilation (respiratory alkalosis) and subsequently impairs respiratory function.13 Patients in the current study showed significant restrictive patterns in respiratory function (reduced FVC, increased mean FEV1/FVC, and increased mean FEF), with nonsignificant difference between those with CKD and those on HD. Mukai et al postulated that 36%–79% of patients with CKD may show restrictive respiratory patterns.14 Hassan performed acoustic and aerodynamic analysis of the voices of patients with CKD.15 She found that they exhibited higher f0 and S% and lower HNR and maximal phonation time than normal. Maximal phonation time is affected by reductions in respiratory and/or glottal efficiency; however, it cannot differentiate between them. In the current study, FEV1 was found to be responsible for increased J% and Sh% and decreased HNR in patients on HD. Reduced VC and FVC were responsible for increased J% in patients on HD. On the contrary, Kumar and Clark noted that increased f0 in male patients may occur due to reduced testosterone levels as a result of CKD.16
Acoustic voice analysis is the least invasive and most convenient and objective valid measure of vocal parameters. Any change in the vocal fold mass and tension affects the acoustic characteristics of voice.
All patients in the current study showed significant changes in all acoustic parameters when compared to the control group (increase in f0, S%, J%, and reduction in HNR: P=0.013, 0, 0, and 0, respectively). Differences between patients with CKD and patients on HD was nonsignificant on all acoustic parameters (P=0.812, 0.176, 0.641, and 0.050, respectively). Similarly, Unver et al studied the effect of HD on voice quality and found that all patients had significant increases in f0 and HNR after HD.17 They attributed these findings to ultrafiltration and changes in extracellular fluid volume. According to Raphael et al, changes in the vibratory patterns of vocal folds after HD could be attributed to changes in their length, mass, and tension.18 They proposed that the muscles function normally after HD. On the other hand, Nesić et al recorded no changes in f0 after HD.19
The results of the current study show that the changes in voice observed in patients with CKD and patients on HD resulted from a combination of impaired hydration, acid–base imbalance, circulating toxins, and weakness of the muscles of respiration and phonation. They also reveal that HD has a detrimental effect on voice quality, both instantly after the session and in the long term, as this effect increases with the duration of HD.
Conclusion
The systemic effect of CKD and HD were found to impair the acoustic characteristics of voice in both groups. Regression analysis revealed that Hb, uric acid, and expiratory time were the most significant predictors of impaired acoustic characteristics.
Ethics Approval and Informed Consent
This study was approved by the Research Ethics Committee of the Faculty of Medicine, Al Azhar University. All participants were informed about the study, and written informed consent was obtained. The study was conducted in accordance with the Declaration of Helsinki.
Funding
There was no funding provided.
Disclosure
The authors report no conflict of interest in this work.
References
1. Sivasankar M, Erickson E. Short‐duration accelerated breathing challenges affect phonation. Laryngoscope. 2009;119(8):1658–1663. doi:10.1002/lary.20530
2. Adrogué HE, Adrogue HJ. Acid-base physiology. Respir Care. 2001;46(4):328–341.
3. Karacan Ö, Tutal E, Colak T, Sezer S, Eyüboğlu FÖ, Haberal M Pulmonary function in renal transplant recipients and end-stage renal disease patients undergoing maintenance dialysis. In
4. Pierson DJ. Respiratory considerations in the patient with renal failure. Respir Care. 2006;51(4):413–422.
5. Hamdan AL, Medawar W, Younes A, Bikhazi H, Fuleihan N. The effect of hemodialysis on voice: an acoustic analysis. J Voice. 2005;19(2):290–295. doi:10.1016/j.jvoice.2004.01.011
6. Zumrutdal A. An overlooked complication of hemodialysis: Hoarseness. Hemodial Int. 2013;17(4):633–638. doi:10.1111/hdi.12028
7. Levey AS, Coresh J, Greene T, et al. Using standardized serum creatinine values in the modification of diet in renal disease study equation for estimating glomerular filtration rate. Ann Intern Med. 2006;145:247–254. doi:10.7326/0003-4819-145-4-200608150-00004
8. IBM Corp. IBM SPSS Statistics for Windows, Version 27.0. Armonk, NY: IBM Corp; 2020.
9. Sivasankar M, Leydon C. The role of hydration in vocal fold physiology. Curr Opin Otolaryngol Head Neck Surg. 2010;18(3):171. doi:10.1097/MOO.0b013e3283393784
10. Sagiroglu S, Doganer A. The effect of electrolyte balance on the voice in hemodialysis patients. Eur Arch Otorhinolaryngol. 2018;275(11):2755–2761. doi:10.1007/s00405-018-5098-x
11. Cases A, Egocheaga MI, Tranche S, et al. Anemia of chronic kidney disease: protocol of study, management and referral to Nephrology. Nefrología (English Edition). 2018;38(1):8–12. doi:10.1016/j.nefroe.2018.01.007
12. Uchino S, Kellum JA, Bellomo R, et al. Acute renal failure in critically ill patients: a multinational, multicenter study. JAMA. 2005;294(7):813–818. doi:10.1001/jama.294.7.813
13. Li H, Li N. Pulmonary function tests and blood gas analysis. In: Li H, Li N, editors. Radiology of Influenza A (H1N1). Dordrecht: Springer; 2013:19–22. doi:10.1007/978-94-007-6162-9_7
14. Mukai H, Ming P, Lindholm B, et al. Lung dysfunction and mortality in patients with chronic kidney disease. Kidney Blood Press Res. 2018;43(2):522–535. doi:10.1159/000488699
15. Hassan ES. Effect of chronic renal failure on voice: an acoustic and aerodynamic analysis. Egypt J Otolaryngol. 2014;30(1):53–57. doi:10.4103/1012-5574.127207
16. Kumar P, Clark M. Clinical Medicine: A Textbook for Medical Students and Doctors.
17. Unver S, Hardal U, Esertas K, Sezen A, Celikbilek F, Altundag A. Objective analysis of voice changes in a hemodialysis session and its correlation with ultrafiltration. Ren Fail. 2015;37(2):268–272. doi:10.3109/0886022X.2014.988108
18. Raphael LJ, Borden GJ, Harris KS. Speech Science Primer: Physiology, Acoustics, and Perception of Speech.
19. Nesić M, Veljković S, Obrenović J, Cekić S, Velicković D, Radenković M. Voice frequencies in patients treated with chronic hemodialysis. Srp Arc Celok Lek. 1996;124:99–101.
 © 2021 The Author(s). This work is published and licensed by Dove Medical Press Limited. The full terms of this license are available at https://www.dovepress.com/terms.php and incorporate the Creative Commons Attribution - Non Commercial (unported, v3.0) License.
By accessing the work you hereby accept the Terms. Non-commercial uses of the work are permitted without any further permission from Dove Medical Press Limited, provided the work is properly attributed. For permission for commercial use of this work, please see paragraphs 4.2 and 5 of our Terms.
© 2021 The Author(s). This work is published and licensed by Dove Medical Press Limited. The full terms of this license are available at https://www.dovepress.com/terms.php and incorporate the Creative Commons Attribution - Non Commercial (unported, v3.0) License.
By accessing the work you hereby accept the Terms. Non-commercial uses of the work are permitted without any further permission from Dove Medical Press Limited, provided the work is properly attributed. For permission for commercial use of this work, please see paragraphs 4.2 and 5 of our Terms.