")
Back to Journals » OncoTargets and Therapy » Volume 13
ACAT2 Promotes Cell Proliferation and Associates with Malignant Progression in Colorectal Cancer
Authors Weng M, Zhang H, Hou W, Sun Z, Zhong J, Miao C
Received 17 November 2019
Accepted for publication 5 April 2020
Published 24 April 2020 Volume 2020:13 Pages 3477—3488
DOI https://doi.org/10.2147/OTT.S238973
Checked for plagiarism Yes
Review by Single anonymous peer review
Peer reviewer comments 3
Editor who approved publication: Dr Jianmin Xu
Meilin Weng, 1, 2,* Hao Zhang, 1– 3,* Wenting Hou, 1, 2,* Zhirong Sun, 1, 2 Jing Zhong, 1– 3 Changhong Miao 1– 3
1Department of Anesthesiology, Fudan University Shanghai Cancer Center, Shanghai 200032, People’s Republic of China; 2Department of Oncology, Shanghai Medical College, Fudan University, Shanghai 200032, People’s Republic of China; 3Department of Anesthesiology, Zhongshan Hospital, Fudan University, Shanghai 200032, People’s Republic of China
*These authors contributed equally to this work
Correspondence: Changhong Miao; Jing Zhong
Department of Anesthesiology, Floor 3, Building 3, No. 270 Dongan Road, Shanghai 200032 Tel +8618017317731
Email [email protected]; [email protected]
Background and Aims: Colorectal cancer (CRC) is a major disease that threatens human health. It has been reported that the acyl-coenzyme A (CoA): cholesterol acyltransferase 2 (ACAT2) gene can promote the progression of hepatocellular carcinoma, but its function in CRC is still unclear. In this study, we aimed to elucidate the function of ACAT2 in CRC.
Methods: Western blot and qPCR were used to detect the relative level of ACAT2 in CRC tissue and adjacent non-cancerous tissues, and then the association between ACAT2 expression and the clinicopathological features and survival of CRC patients were assessed. The expression of ACAT2 in CT26 and DLD1 cells was down-regulated by siRNA, and the effects of ACAT2 knockdown on cell proliferation were examined. The inhibitory effects of ACAT2 knockdown were further confirmed by tumor growth assays in vivo.
Results: Our data showed that the expression of ACAT2 in CRC tissues was markedly higher than in adjacent non-cancerous tissues. The high expression of ACAT2 was significantly associated with tumor size, lymph node metastasis and clinical stage. The increased expression of ACAT2 was also significantly associated with worse 5-year overall survival of CRC patients. siRNA-mediated ACAT2 knockdown strongly inhibited CT26 and DLD1 cells proliferation and induced G0/G1 phase cell cycle arrest and apoptosis in these cells. Knockdown of ACAT2 expression suppressed the growth of CRC and inhibited the expression of Ki67 in vivo.
Conclusion: Our study demonstrated that ACAT2 played a positive role in regulating the proliferation of CRC and may be useful as a potential biomarker and therapeutic target for this disease.
Keywords: ACAT2, cell proliferation, malignant progression, colorectal cancer
Corrigendum for this paper has been published
Introduction
Colorectal cancer (CRC) is one of the most lethal diseases worldwide, ranking second in cancer mortality and third in cancer morbidity globally, with more than 1.8 million new cases in 2018.1 The incidence has stabilized or shown a downward trend in the United States and some other developed countries, but its morbidity and mortality are rising in other developing countries, such as Spain and China.2,3 Although great progress has been made in cancer treatment and surgical technique for CRC, the 5-year survival of CRC patients has not improved significantly in the past decade.4,5 Therefore, there is an urgent need to find new biomarkers and potential therapeutic targets to improve the prognosis of patients with CRC.
Acyl-coenzyme A (CoA): cholesterol acyltransferase (ACAT) is a membrane-bound enzyme localized in the endoplasmic reticulum which catalyzes cholesterol and long chain fatty acyl-CoA to produce cholesteryl ester.6 These cholesterol esters are then stored as lipid droplets within the cell. The ACAT family includes two isoforms, ACAT1 and ACAT2. ACAT1 produces steryl esters that are integrated into cellular lipid droplets and is widely expressed in almost all human tissues examined.7 ACAT2 is mainly expressed in intestine and fetal liver, which provides cholesteryl esters for lipoprotein assemblies.8,9 These two genes share extensive structural homology in their phosphorylation sites and transmembrane domains. ACAT1 localizes in the endoplasmic reticulum (ER), while ACAT2 localizes in cytoplasm. They are similar in some ways, but they are still different. Many important novel studies have suggested that ACAT1 is a potential new anticancer target.10 But we are still unclear about the role of ACAT2 in different human cancers. Yue et al11 found that abnormal cholesteryl ester accumulation occurred in advanced prostate cancers, in which case the loss of Phosphatase and Tension Homolog (PTEN) function resulted in the up-regulation of ACAT1 and ACAT2 by activating the phosphatidylinositol-3-kinases (PI3K)/protein-serine-threonine kinase (AKT) signaling pathway. Furthermore, this study showed that inhibition of cholesterol esterification reduced prostate cancer invasiveness. But Zhao et al12 elucidated that ACAT2 were downregulated in clear cell renal cell carcinoma. And their decreased expression were associated with worse prognosis of patients’ survival. So, there are still some controversies about this lipid metabolism enzyme in cancer studies. And the expression profile and function of ACAT2 in CRC remains largely unclear.
In the present study, we aim to compare the expression of ACAT2 in CRC tissues and matched adjacent non-cancerous tissues to explore the relationship between ACAT2 expression and the clinicopathological features and survival of CRC patients. We also studied the biological role of ACAT2 in CRC cell proliferation. Targeted knockdown of ACAT2 in CT26 and DLD1 cells was carried out with small interfering RNA (siRNA) to study the effect of ACAT2 knockdown on cell proliferation and colony formation. In addition, the impact of ACAT2 knockdown on the cell cycle and apoptosis was also evaluated. The inhibitory effect of ACAT2 knockdown was confirmed by tumor growth assays in vivo. Based on these results, we speculated that increased expression of ACAT2 may play an important role in CRC malignant progression and suggest ACAT2 as a potential biomarker and therapeutic target for CRC.
Materials and Methods
Clinical Samples
The CRC and paired non-cancerous tissues were collected from 100 patients who underwent surgical resection at Fudan University Shanghai Cancer Center from 2013 to 2014. These patients did not receive prior preoperative radiotherapy or chemotherapy. Informed consent was obtained from each patient and the Fudan University Shanghai Cancer Center’s ethics committee approved the study, which was in compliance with the Declaration of Helsinki. All tissues were frozen at −125°C until use. The patients were followed up after surgery every 4 months.
RNA Isolation and Quantitative Real-Time PCR (qPCR)
Total RNA was extracted with TRIzol reagent (Invitrogen). The cDNA was synthesized by reverse transcription with a Takara PrimeScriptTM RT reagent kit. The expression of candidate genes and GAPDH were quantitatively detected by the ABI7900HT real-time fluorescence PCR system (Applied Biosystems). The specific primer sequences used are presented in Supplementary Table 1.
Cells and Reagents
The CRC cell lines CT26, DLD1, HCT116, SW620, SW480 and the human CRC mucosal epithelial cell line NCM460 were obtained from the American Type Culture Collection (ATCC; Shanghai) and cultured in DMEM (Biological Industries, USA) with 10% fetal bovine serum (Gibco, USA). All media contained 100 U/mL penicillin and 100 mg/mL streptomycin and cells were cultured at 37°C in a moist atmosphere containing 5% CO2.
The siRNA Transfection
In order to silence the expression of ACAT2 in CRC cells, we used siRNA-mediated silencing to suppress the expression of ACAT2. siRNAs for mouse cell line were 5ʹ-GCAUGGAGAAUAUGAGCAA-3ʹ/5ʹ-UUGCUCAUAUUCUCCAUGC-3ʹ, 5ʹ-CCACUUUGACAAGGAGAUU-3ʹ/5ʹ-AAUCUCCUUGUCAAAGUGG-3ʹ, and 5ʹ-GCGGAUGCUGAAACCUUUA-3ʹ/5ʹ-UAAAGGUUUCAGCAUCCGC-3ʹ, respectively (Proteintech, Shanghai). siRNAs for human cell line were 5ʹ-CCAGCCAUAAAGCAAGCUGUUdTdT-3ʹ/5ʹ-AACAGCUUGCUUUAUGGCUGGdTdT-3ʹ, 5ʹ-CCAGCCAAUGCUUCAGGAAUAdTdT-3ʹ/5ʹ-UAUUCCUGAAGCAUUGGCUGGdTdT-3ʹ, 5ʹ-GCUCUUAUGAAGAAGUUAGAAdTdT-3ʹ/5ʹ-UUCUAACUUCUUCAUAAGAGCdTdT-3ʹ, respectively (Proteintech, Shanghai). Lipofectamine2000 (Invitrogen, USA) was used to transfect ACAT2 siRNA duplexes into CRC cells in serum-free medium according to the manufacturers’ directions.
Protein Extraction and Western Blot Analysis
Briefly, total protein was extracted, quantified by BCA protein assay reagent, and then resolved by SDS-PAGE followed by immunoblotting with antibodies raised against ACAT2 (#ab168342; Abcam), caspase 3 (#9662; Cell Signaling Technology), caspase 9 (#9502; Cell Signaling Technology), cyclin D1 (#ab16663; Abcam), CDK2 (#ab32147; Abcam), Bcl-2 (#ab32124; Abcam), Bax (#ab32503; Abcam) and β-actin (#3700; Cell Signaling Technology).
Cell Proliferation Assay
Cell proliferation was detected using Cell Counting Kit-8 (CCK8) assays (Dojindo Laboratories, Japan). Cell suspensions (3×10³/well) were inoculated in 96-well culture plates and incubated for 5 days. CCK-8 solution (10uL) was added to each well and the cells were cultured for 4 h. The optical density was measured at OD 450nm using a microplate reader.
Colony Formation Assay
Cells were inoculated in 6-well plates at a density of 500 cells/well. Single colonies contained more than 50 cells were counted 14 days later. Cells were fixed in 4% paraformaldehyde at room temperature for 20 mins, stained with 4 mg/mL Crystal Violet for 15 mins and counted under a light microscope (Leica DM IL; Germany).
Cell Cycle and Apoptosis Analysis
Cell-cycle analysis was performed following the manufacturer’s protocols for propidium iodine (PI) staining (#CA002; Signalway). Apoptosis was detected using a PE Annexin V apoptosis detection kit I (#559763; BD Biosciences) according to the manufacturers’ protocol. The cells were analyzed by flow cytometry (Cell Lab Quanta, Beckman Coulter, USA).
Lentivirus Particles Transfection and Stable Cell Line Selection
ACAT-2 short hairpin RNA (shRNA) (mouse) lentiviral particles were purchased from (SANTA CRUZ BIOTECHNOLOGY, #sc-61909-V) and used to express the ACAT2 shRNA constructs in cells. Stable cell lines were obtained by infection with the lentiviral particles followed by puromycin selection. The efficiency of transfection was examined using real-time PCR and Western blotting.
Animal Model
BALB/c mice (female, 4 to 6-weeks-old, 18–20 g; Shanghai SLAC Laboratory Animal Co., Ltd) were housed in a specific pathogen-free (SPF) environment. Injection were performed with 2×10⁵ cells (CT26 or CT26 shRNA-ACAT2) subcutaneously into the right flank of the mice (n=4, per group). Tumor growth was examined every 3 days for 3 weeks. Tumor volume was calculated according to the following equation: volume=length×width×height×0.5. All animal experiments were conducted according to procedures approved by the Institutional Animal Care and Use Committee of Fudan University, following its guidelines and regulations. We confirm that ethical and legal approval was obtained prior to the commencement of the study.
Immunohistochemical (IHC) Staining
IHC staining of paraffin-embedded tissues was performed with antibodies against ACAT2 (#ab131215; Abcam) and Ki67 (#ab8191; Abcam) and scored according to standard procedures. The staining score was determined by two independent pathologists at our center.
Statistical Analysis
Each Experiment was repeated at least three times. All data are presented as means±SD. The data were analyzed by SPSS 17.0 software (IBM, USA) and GraphPad Prism 7.0 software. Two-tailed unpaired Student’s t-tests, Chi-square test and one-way analysis of variance were used to analyze the data. Differences were considered statistically significant at P<0.05.
Results
ACAT2 Is Upregulated in CRC Tissues and Cell Lines
In order to compare the expression of ACAT2 in 100 cases of CRC tissues and their matched adjacent non-cancerous tissues, qPCR was performed. Our data showed that relative expression of ACAT2 mRNA in CRC tissues was significantly higher than in adjacent non-cancerous tissues (P<0.0001; Figure 1A and B). In addition, Western blot analysis showed an increased level of ACAT2 protein in CRC tissues compared to matched adjacent non-cancerous tissues (Figure 1C).
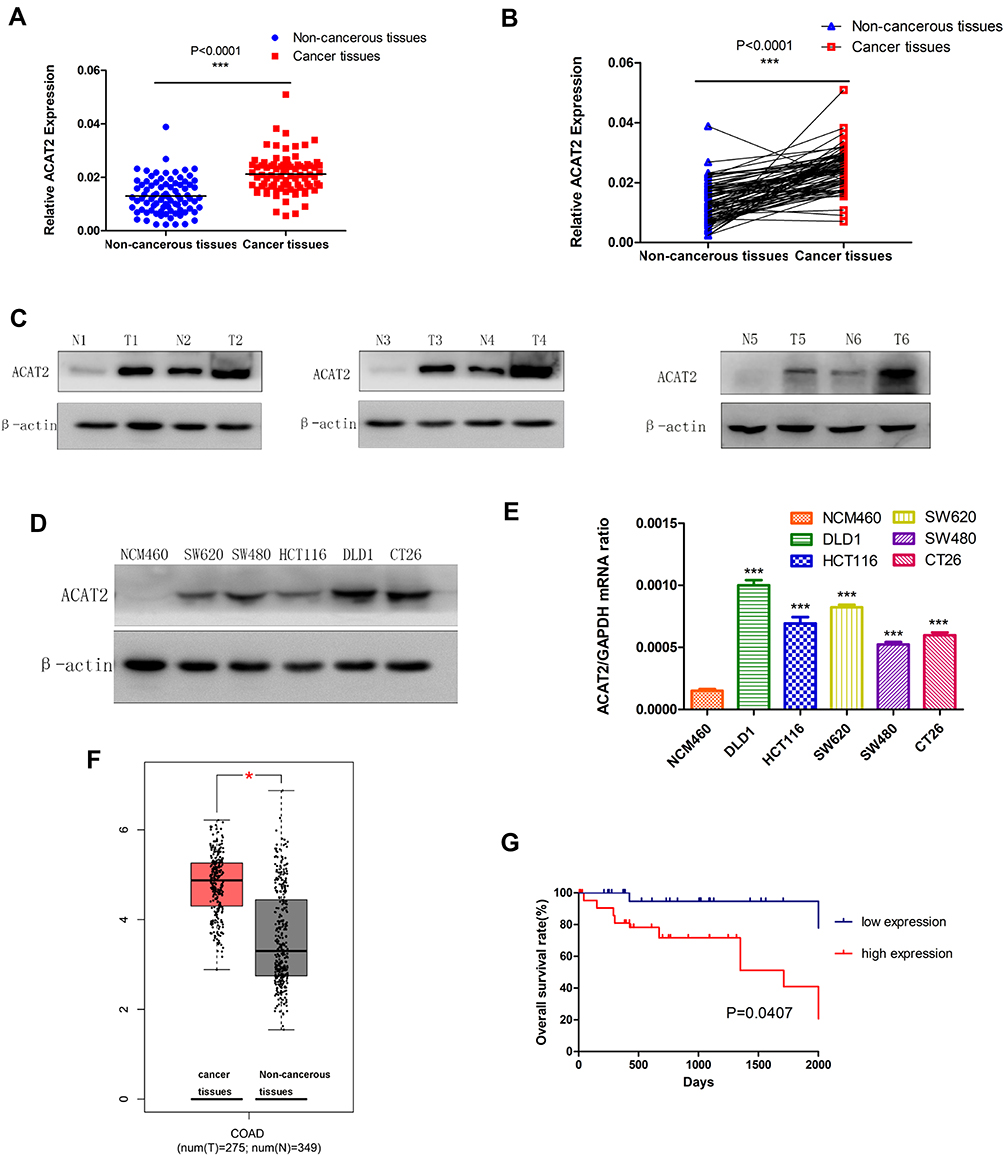 |
Figure 1 ACAT2 is upregulated in CRC tissues and cell lines. (A and B) The relative expression of ACAT2 mRNA in CRC tissues and adjacent noncancerous tissues (n=100) was detected by qPCR. (C) The expression of ACAT2 protein level in 6 pairs of CRC tissue and matched adjacent non-cancerous tissues. (D and E) The expression of ACAT2 in CRC cell lines (including DLD1, SW620, HCT116, SW480, and CT26) and in the colorectal mucosal epithelial cell line NCM460 was detected by Western blot and qPCR. (F) ACAT2 gene expression was upregulated in CRC as determined using the GEPIA database (http://gepia.cancer-pku.cn/). (G) Kaplan–Meier curve of overall survival in CRC patients with high expression of ACAT2 (n=51) and low expression of ACAT2 (n=49; P=0.0407, Log rank test). The data are mean ± SD from three independent experiments. *P<0.05, ***P<0.001, compared with the control group. |
We further detected ACAT2 expression in CRC cell lines (DLD1, SW620, SW480, HCT116 and CT26) and in the colorectal mucosa epithelial cell line NCM460 by qPCR and Western blot. As expected, the expression of ACAT2 in CRC cell lines was markedly higher than in NCM460 cells (Figure 1D and E).
Moreover, to further verify the role of ACAT2 in CRC, we used the Gene Expression Profiling Interactive Analysis (GEPIA) databases to analyze The Cancer Genome Atlas (TCGA) datasets. The GEPIA database (http://gepia.cancer-pku.cn/) showed that ACAT2 gene expression was upregulated in CRC (Figure 1F). Taken together, these results indicated that expression of ACAT2 was upregulated in CRC tissues and cell lines.
The Up-Regulation of ACAT2 Is Related to Malignant Progression and Survival of CRC Patients
To further reveal the role of ACAT2 in CRC, we evaluated the relationship between its expression and the clinicopathological features of CRC. The median expression level of ACAT2 was used as the dividing value. High expression of ACAT2 was significantly correlated with tumor size (P=0.0001), lymph node metastasis (P=0.038) and clinical stage (P=0.003), but not with the age, sex, tumor location, carcinoembryonic antigen (CEA), histological type or histological grade (all P>0.05; Table 1).
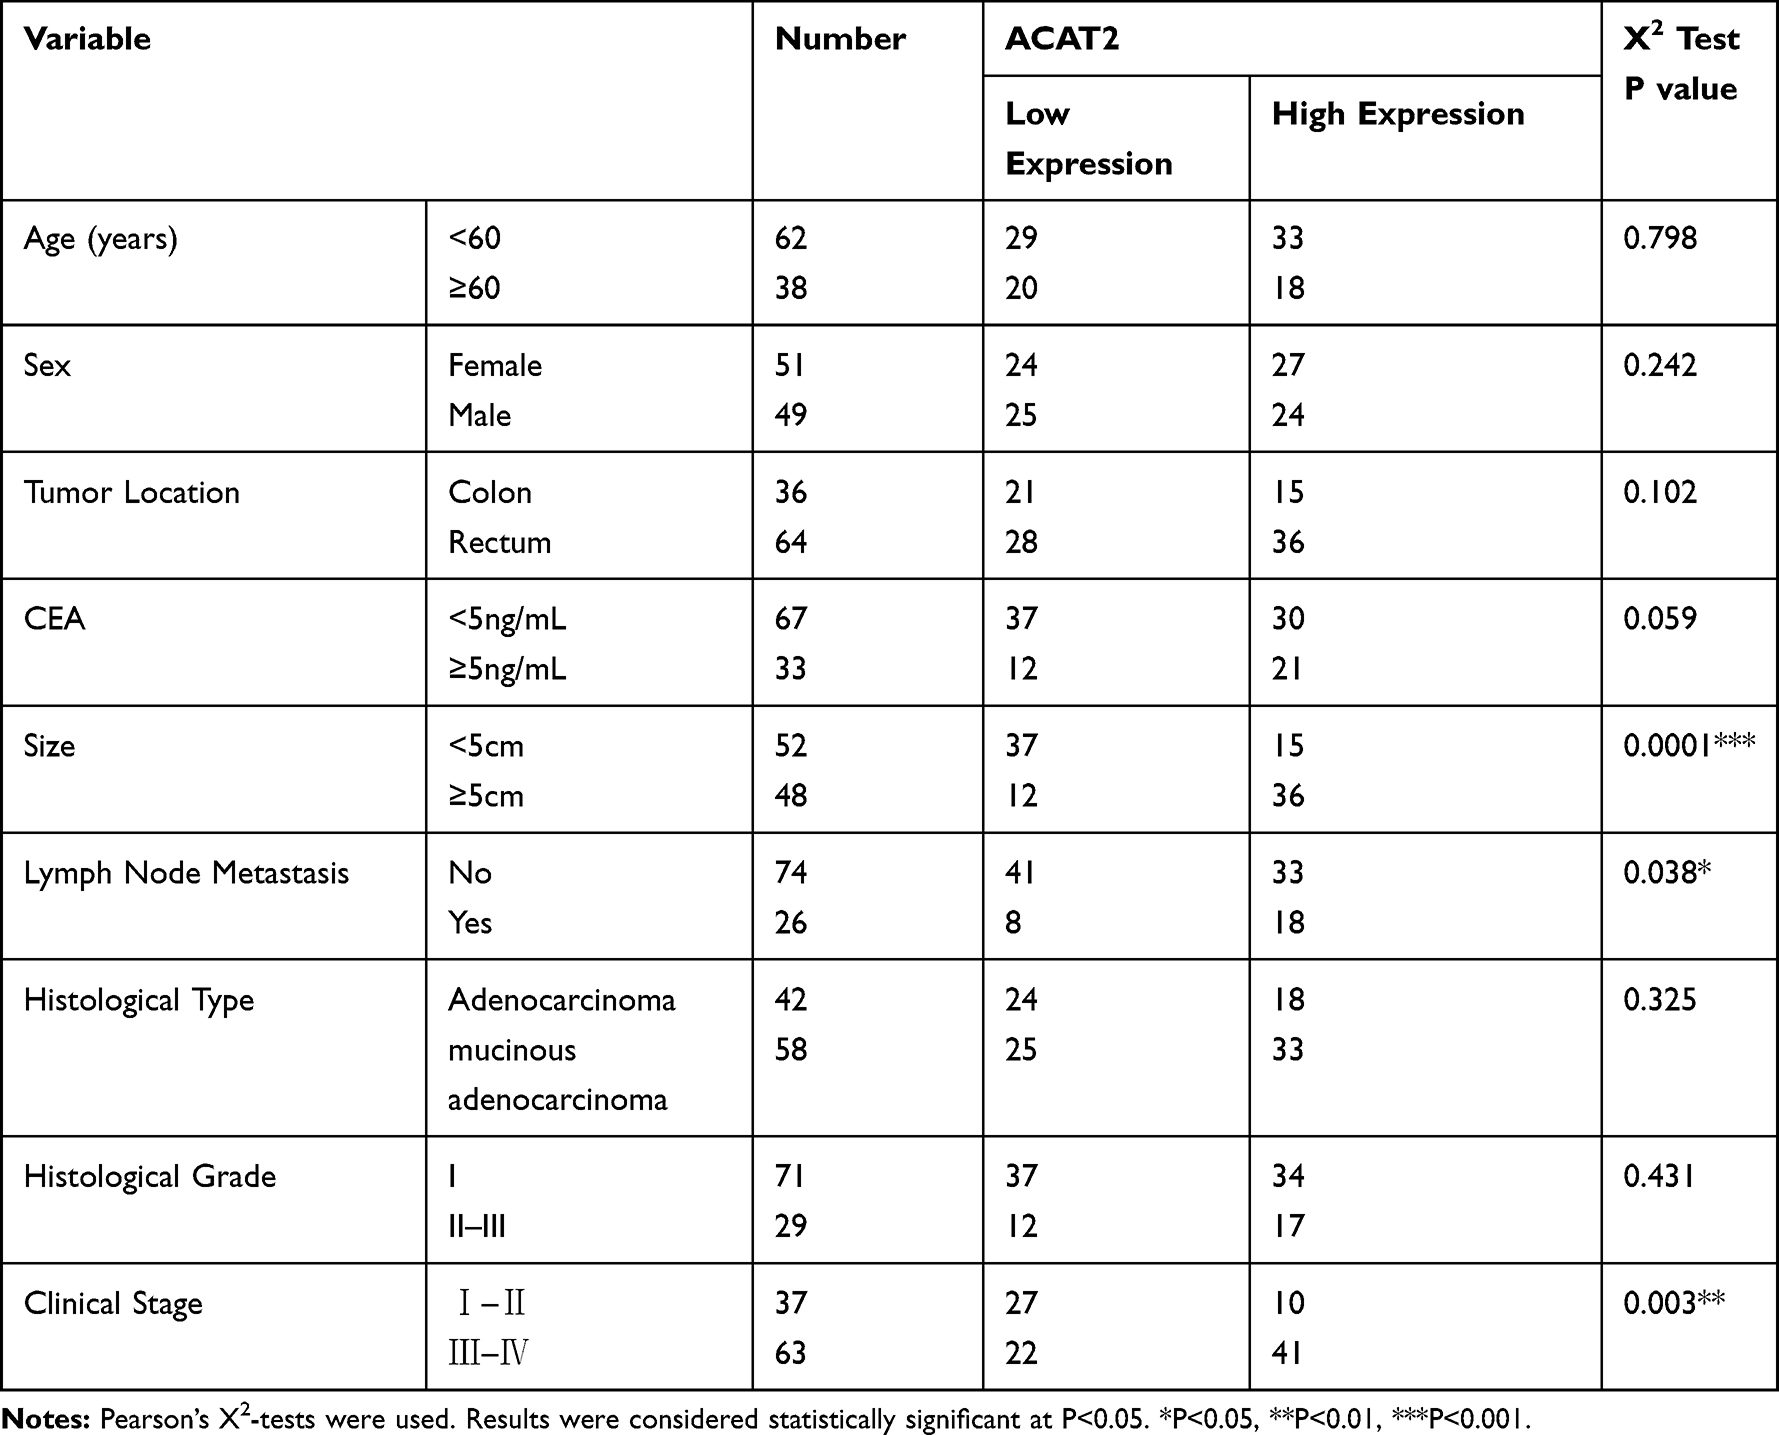 |
Table 1 The Relationship Between ACAT2 Expression and Clinicopathological Features in 100 Colorectal Patients from FUSCC |
We further evaluated the correlation between ACAT2 expression and the prognosis of CRC patients in our Cancer Center. From Kaplan–Meier survival analysis, we observed that patients with high expression of ACAT2 had a significantly poorer prognosis than patients with low levels (P=0.0407, Log rank test; Figure 1G). In summary, these results suggested that the high expression of ACAT2 was related to malignant progression and survival of CRC patients.
ACAT2 Can Positively Regulate the Proliferation of CRC
In order to evaluate the biological function of ACAT2 in CRC, we knocked down expression of ACAT2 in CT26 and DLD1 cells by siRNA. The efficiency of ACAT2 knockdown in CT26 and DLD1 cells was verified by Western blot and qPCR (P<0.001; Figures 2A, B and 3A, B).
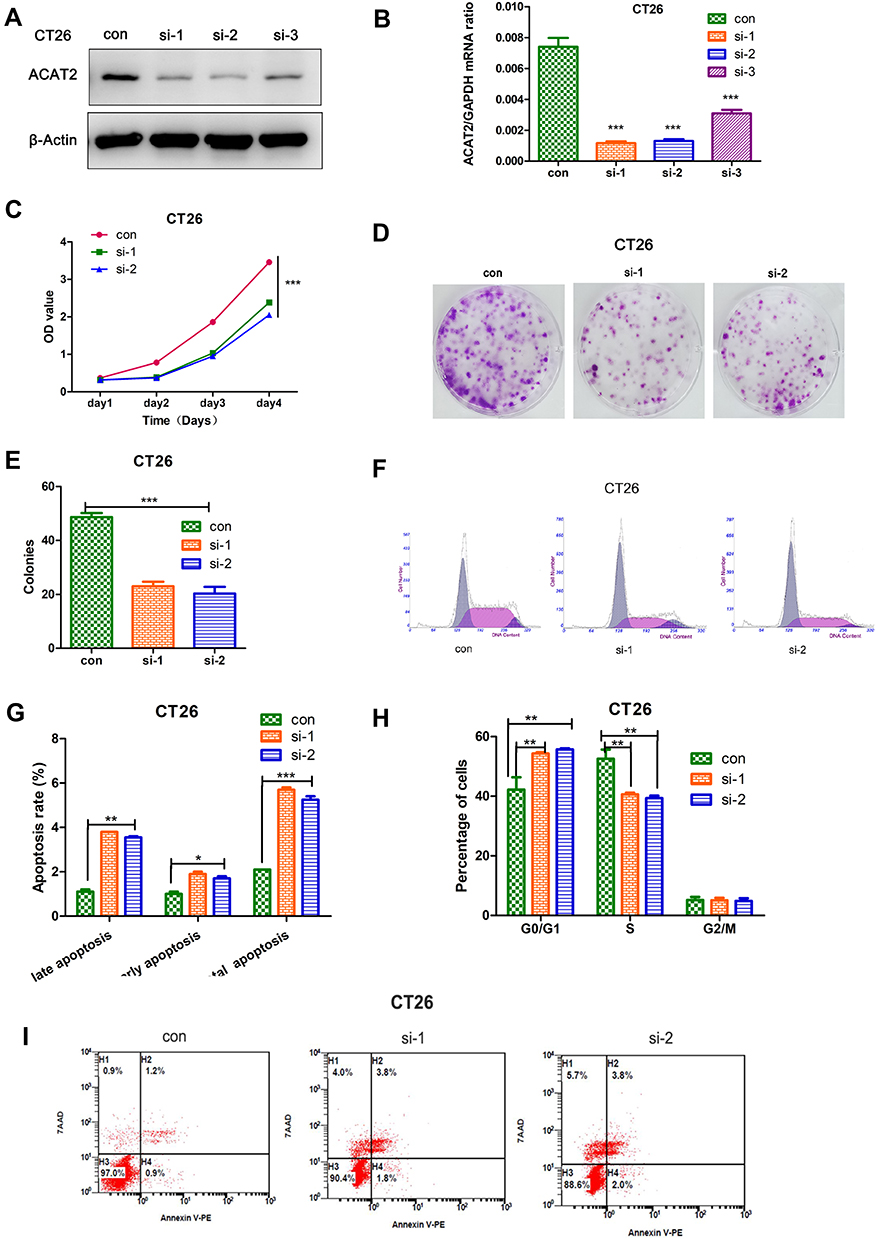 |
Figure 2 ACAT2 can positively regulate the proliferation of CRC cell (CT26). (A and B) The efficiency of ACAT2 knockdown in CT26 cells was detected by qPCR and Western blotting. (C) ACAT2 knockdown inhibited CT26 cell proliferation as detected by CCK8 assay. (D) ACAT2 knockdown decreased colony forming capacity of CT26 cells as measured by colony formation assay. (E) The lower graph below shows the statistical results of colony formation assays. (F, H) The cell cycle distribution in the control group, si-1 and si-2 group was analyzed by flow cytometry. In the si-1 and si-2 groups, the percentage of cells in the G0/G1 phase was increased, but the percentage of cells in the S phases was decreased. (G, I) Cell death was detected by annexin V/7AAD staining and flow cytometry. In the si-1 and si-2 groups, the percentage of cells in early and late apoptosis and the total percentage of apoptotic cells were significantly increased. The data are mean ± SD from three independent experiments. *P<0.05, **P<0.01, ***P<0.001 compared with the control group. |
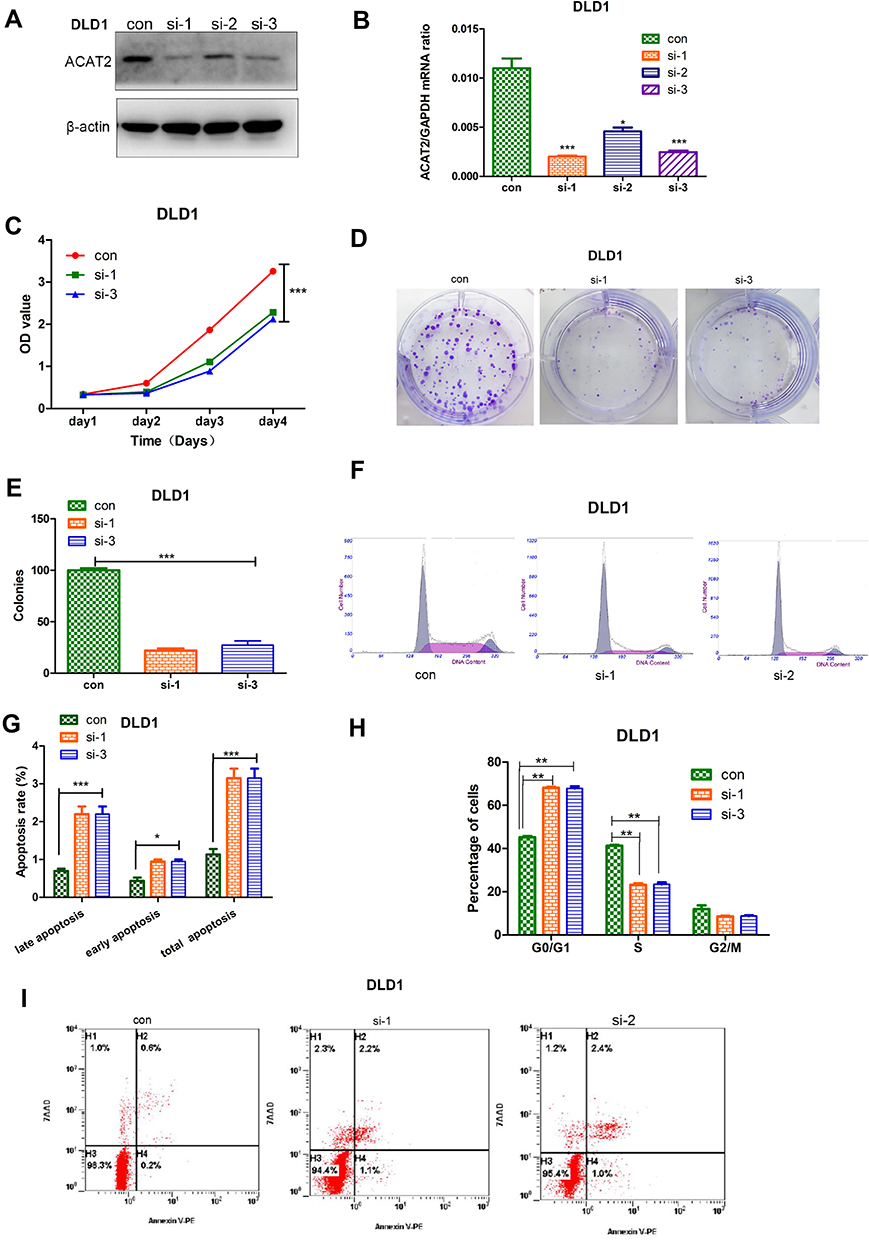 |
Figure 3 ACAT2 can positively regulate the proliferation of CRC cell (DLD1). (A, B) The efficiency of ACAT2 knockdown in DLD1 cells was detected by qPCR and Western blotting. (C) ACAT2 knockdown inhibited DLD1 cell proliferation as detected by CCK8 assay. (D) ACAT2 knockdown decreased colony-forming capacity of DLD1 cells as measured by colony formation assay. (E) The lower graph below shows the statistical results of colony formation assays. (F, H) The cell cycle distribution in the control group, si-1 and si-2 group was analyzed by flow cytometry. In the si-1 and si-2 groups, the percentage of cells in the G0/G1 phase was increased, but the percentage of cells in the S phases was decreased. (G, I) Cell death was detected by annexin V/7AAD staining and flow cytometry. In the si-1 and si-2 groups, the percentage of cells in early and late apoptosis and the total percentage of apoptotic cells were significantly increased. The data are mean ± SD from three independent experiments. *P<0.05, **P<0.01, ***P<0.001 compared with the control group. |
To further study the effect of ACAT2 on cell proliferation, CCK8 and colony formation assays were carried out. ACAT2 knockdown inhibited CT26 and DLD1 cell proliferation significantly in CCK8 assays (P<0.001; Figure 2C; Figure 3C). Also, ACAT2 knockdown reduced the clonal formation capacity of CT26 and DLD1 cells (P<0.001; Figure 2D and E; Figure 3D and E). In addition, to elucidate the effect of ACAT2 on cell cycle and apoptosis distribution, flow cytometry was performed. ACAT2 knockdown induced cell cycle arrest at the G0/G1 phase (P<0.01; Figures 2F, H and 3F, H) and promoted apoptosis in CT26 and DLD1 cells (P<0.001, Figures 2G and I and 3G and I).
To investigate the molecular mechanism cell cycle arrest induced by ACAT2 knockdown in CT26 and DLD1 cells, we evaluated cell cycle-related proteins cyclin D1 and cyclin-dependent kinases 2 (CDK2) which especially regulate G0/G1 phase. Knockdown of ACAT2 decreased the expression of cyclin D1 and CDK2 by Western blot (Figure 4A). Our results demonstrated that ACAT2 knockdown in CT26 and DLD1 could lead cell cycle arrest at G0/G1 phase, possibly through decreasing the expression of cell cycle-related proteins cyclin D1 and CDK2.
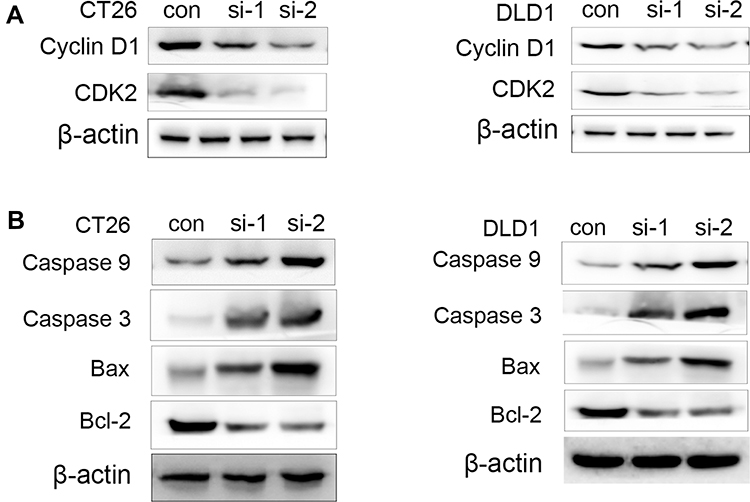 |
Figure 4 The regulation of some apoptotic marker in CT26 and DLD1 cells by ACAT2 knockdown. (A) The expression of cyclin D1 and CDK2 in CT26 or CT26 cells transfected with siRNA-ACAT2 (DLD1 or DLD1 cells transfected with siRNA-ACAT2). (B) The expression of caspase 3, caspase 9, Bcl-2 and Bax in CT26 or CT26 cells transfected with siRNA-ACAT2 (DLD1 or DLD1 cells transfected with siRNA-ACAT2). |
In order to further clarify the mechanisms of apoptosis induced by ACAT2 knockdown in CT26 and DLD1 cells, the expression of caspase 3 and caspase 9 were detected by Western blot. The levels of both enzymes were increased after ACAT2 knockdown. Meanwhile, knockdown of ACAT2 decreased the expression of B-cell lymphoma 2 (Bcl-2), but increased the expression of Bcl-2-associated X protein (Bax) by Western blot (Figure 4B). These results suggested that ACAT2 knockdown in CT26 and DLD1 cells could induce apoptosis. Taken together, ACAT2 knockdown inhibited cell proliferation most likely by inducing cell cycle arrest at the G0/G1 phase and promoting apoptosis.
Knockdown of ACAT2 Expression Suppresses CRC Growth and Inhibits Ki-67 Expression in vivo
To investigate the effects of ACAT2 in vivo, lentivirus-mediated knockdown of ACAT2 were performed in CT26. The efficiency of ACAT2 knockdown were indicated by the qPCR and Western blot (Figure 5A and B). Then, tumor growth assays were performed. Consistent with the in vitro results, ACAT2 knockdown in implanted cancer cells substantially suppressed tumor growth compared to the control group (Figure 5C and D; P<0.01). The final tumor weight and volume were significantly smaller in the ACAT2-knockdown group than in the control group (Figure 5E and F; P<0.01). Subsequently, qPCR analysis also showed that expression of ACAT2 was greatly diminished in the ACAT2 knockdown group compared to the control group (Figure 5G; P<0.01). Moreover, the cell proliferation marker Ki-67 was significantly decreased in the ACAT2 knockdown group compared to the control group by qPCR (Figure 5H; P<0.01). The protein expression of ACAT2 and Ki67 in dissected tumor samples was markedly decreased in ACAT2 knockdown group compared to the control group by IHC (Figure 5I-K).
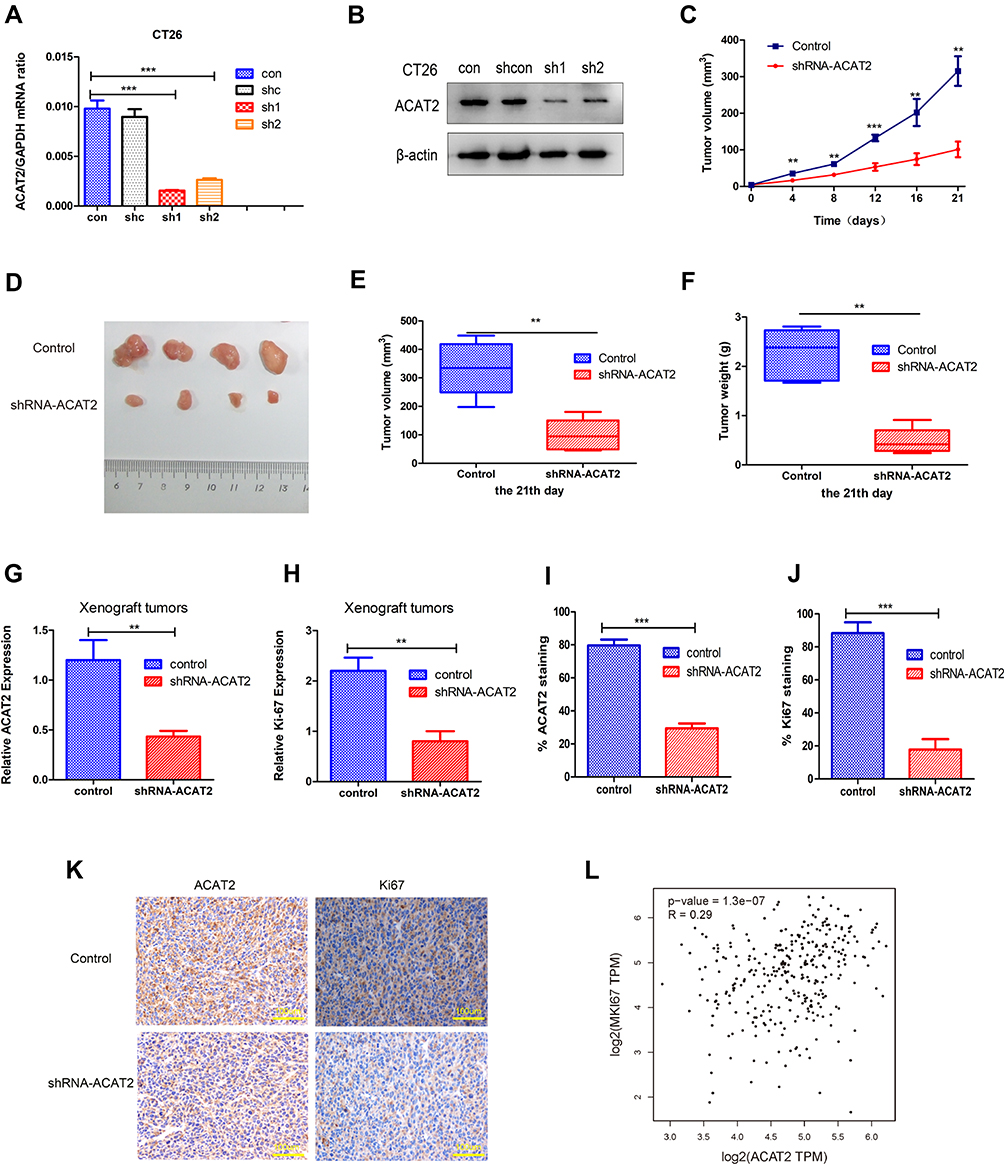 |
Figure 5 Knockdown of ACAT2 expression suppresses CRC growth and inhibits Ki-67 expression in vivo. (A, B) The efficiency of ACAT2 knockdown in CT26 cells was measured by qPCR and Western blotting. (C, D) CT26 cells or shRNA-ACAT2 CT26 cells were injected into BALB/c mice. Photograph of dissected tumors (upper: control group; lower: shRNA-ACAT2 group; n=4; P<0.01). The tumor volumes were measured every 3 days. The shRNA-ACAT2 in CT26 cells attenuated tumor growth in mice. (E, F) Tumor volumes and tumor weights on the 21st day (P<0.01). (G, H) The expression of ACAT2 and Ki-67 in tissues was detected by qPCR (P<0.01). (I, J) the graph shows the quantitative analysis of ACAT2 and Ki67 staining. (K) The protein expression ACAT2 and Ki67 in dissected tumor samples were evaluated by IHC. Scale bar: 100um. (L) Based on TCGA dataset analysis, ACAT2 expression was positively correlated with Ki-67 expression in CRC (P=1.3×10⁻⁷). **P<0.01, ***P<0.001; compared with the control group. |
We also analyzed the correlation between ACAT2 and Ki-67 expression in TCGA datasets. Consistent with the results of previous studies, a strong correlation was observed between ACAT2 and Ki-67 expression (Figure 5L; P=1.3×10⁻⁷). Therefore, these observations support the hypothesis that ACAT2 positively regulates CRC cell proliferation in vivo.
Discussion
ACAT is a membrane-bound enzyme that uses long-chain fatty acyl-CoA and cholesterol as its substrates to catalyze the biosynthesis of cholesteryl esters.13 These cholesterol esters are then stored as lipid droplets within the cell. The major function of ACATs is to prevent unnecessary free cholesterol within the cell membranes.14 Therefore, the expression of ACAT is associated with many diseases such as hypercholesterolemia, atherosclerosis,15,16 Alzheimer’s,17–19 and possibly cancer.11,20,21 For these reasons, ACAT has been a therapeutic target to treat these major diseases.22 ACAT1 is a resident enzyme in the endoplasmic reticulum and is widely expressed in almost all human tissues examined.23 ACAT2 localizes in cytoplasm, which is mainly expressed in the intestines and hepatocytes and plays an important role in intestinal cholesterol absorption.24,25 They share extensive structural homology in their phosphorylation sites and transmembrane domains, but they are still different. There have been some reports about the function of ACAT1 in CRC.10 Chen et al reported that insulin could promote the progression of CRC by increasing ACAT1 activity, suggesting ACAT1 may be a potential therapeutic target for CRC.26 Ye et al27 also observed that Toll-like receptor 4 siRNA could suppress the progression of CRC cells by inhibiting ACAT1 expression. However, the expression profile and function of ACAT2 in CRC has not yet been studied.
In the present study, we examined the expression of ACAT2 in CRC tissues and their matched adjacent non-cancerous tissues. Western blot and qPCR data showed that the relative expression of ACAT2 was significantly upregulated in CRC tissue compared to adjacent non-cancerous tissues. In addition, its expression level was also increased in four CRC cell lines compared to a colorectal mucosa epithelial cell line. Therefore, ACAT2 was upregulated in CRC tissues and cell lines. Further investigation indicated that high expression of ACAT2 was significantly correlated with tumor size, lymph node metastasis and clinical stage, but not with the age, sex, tumor location, CEA, histological type or histological grade. siRNA effectively suppressed the expression level of ACAT2 and ACAT2 knockdown significantly inhibited cell proliferation by inducing cell cycle arrest at the G0/G1 phase and by promoting apoptosis in CT26 and DLD1cells. Additionally, knockdown of ACAT2 expression suppresses CRC growth and inhibited Ki-67 expression in vivo. The Ki-67 assay is a standard method to evaluate the proliferative activity of tumor cells.28 Many studies have shown that the high expression of Ki-67 is related to the malignant progression of cancer. In agreement, our study showed that there was a strong correlation between ACAT2 expression and Ki-67 expression. Taken together, these observations indicated that ACAT2 may function as an oncogene which can positively regulate the proliferation of CRC.
Shan et al20 stated that DLAT and ACAT2 can upregulate 6-phosphogluconate dehydrogenase (6PGD) by acetylation at K76 and K294 to promote human tumor growth. Huang et al21 reported that leptin can promote the progression of breast cancer by upregulating the PI3K/AKT/Sterol regulatory element binding protein-2 (SREBP2) signal pathway. Leptin/ACAT2 may thus be a promising therapeutic target for breast cancer. Song et al29 found that ACAT2 is increased by elevated Caudal Type Homeobox 2 (CDX2) expression in Hepatocellular carcinoma. Lu et al30 demonstrated that inhibition of ACAT2 could lead to the accumulation of unesterified oxysterols within cells and inhibit the growth of hepatocellular carcinoma cell lines and their xenograft tumors. Thus, ACAT2 may have potential therapeutic applications in patients with hepatocellular carcinoma. But Zhao et al12 elucidated that ACAT2 were downregulated in clear cell renal cell carcinoma. And their decreased expression were associated with poorer prognosis of patients’ survival. Locke et al31 found that ACAT1 expression was increased by androgen agonist, but ACAT2 expression was not affected in prostate cancer-3 (androgen-independent) cells. So, there are still some controversies about this lipid metabolism enzyme in cancer studies. The mechanism underlying ACAT2 mediated malignant progression of CRC remained elusive. Little is known about ACAT2 expression and function in CRC. In our study, we showed that ACAT2 is upregulated in CRC tissues and cell lines. Its increased expression was related to malignant progression and survival of CRC. ACAT2 knockdown suppressed the proliferation of CRC cells which indicates that ACAT2 may be a new therapeutic target for CRC.
Conclusions
Our study suggested that ACAT2 may function as a critical regulator involved in the proliferation of CRC. It may therefore be a novel therapeutic target for CRC. More researches on ACAT2 will be required to reveal the potential molecular mechanisms involved and to evaluate ACAT2 as a therapeutic target for CRC.
Acknowledgments
This study was supported by the National Natural Science Foundation of China (No. 81873948, No. 81971868, No. 81601712), the State Key Basic Research Program (973) project (2015CB553404), the Shanghai Anticancer EYAS PROJECT (No.SACA-CY1B07), the Industry-University-Research Program of Shanghai Science and Technology Committee (STCSM) (16DZ1911107 and 16DZ1930304), the Shanghai Pujiang Program (17PJD008), the Program of Shanghai Subject Chief Scientist (No. 16XD1400900), and the 2018 Xin Chen Cup Young Anesthesiologist Training grant.
Author Contributions
MLW, JZ and CHM designed the study; MLW, HZ, ZRS and WTH performed the experiments and analyzed the data; and MLW and JZ wrote the paper. All authors contributed to data analyses, drafting or revising the article, gave final approval of the version to be published, and agree to be accountable for all aspects of the work.
Disclosure
These authors declare no competing financial interests.
References
1. Bray F, Ferlay J, Soerjomataram I, Siegel RL, Torre LA, Jemal A. Global cancer statistics 2018: GLOBOCAN estimates of incidence and mortality worldwide for 36 cancers in 185 countries. CA Cancer J Clin. 2018;68(6):394–424. doi:10.3322/caac.21492
2. Brenner H, Kloor M, Pox CP. Colorectal cancer. The Lancet. 2014;383(9927):1490–1502. doi:10.1016/S0140-6736(13)61649-9
3. Global Burden of Disease Cancer C. Global, regional, and national cancer incidence, mortality, years of life lost, years lived with disability, and disability-adjusted life-years for 32 cancer groups, 1990 to 2015: a systematic analysis for the global burden of disease study. JAMA Oncol. 2017;3(4):524–548. doi:10.1001/jamaoncol.2016.5688
4. Dekker E, Rex DK. Advances in CRC prevention: screening and surveillance. Gastroenterology. 2018;154(7):1970–1984. doi:10.1053/j.gastro.2018.01.069
5. Schreuders EH, Ruco A, Rabeneck L, et al. Colorectal cancer screening: a global overview of existing programmes. Gut. 2015;64(10):1637–1649. doi:10.1136/gutjnl-2014-309086
6. Bemlih S, Poirier MD, El Andaloussi A. Acyl-coenzyme A: cholesterol acyltransferase inhibitor Avasimibe affect survival and proliferation of glioma tumor cell lines. Cancer Biol Ther. 2010;9(12):1025–1032. doi:10.4161/cbt.9.12.11875
7. Sakashita N, Miyazaki A, Takeya M, et al. Localization of human acyl-coenzyme A: cholesterol acyltransferase-1 (ACAT-1) in macrophages and in various tissues. Am J Pathol. 2000;156(1):227–236. doi:10.1016/S0002-9440(10)64723-2
8. Anderson RA, Joyce C, Davis M, et al. Identification of a form of acyl-CoA: cholesterol acyltransferase specific to liver and intestine in nonhuman primates. J Biol Chem. 1998;273(41):26747–26754. doi:10.1074/jbc.273.41.26747
9. Sakashita N, Miyazaki A, Chang CC, et al. Acyl-coenzyme A: cholesterol acyltransferase 2 (ACAT2) is induced in monocyte-derived macrophages: in vivo and in vitro studies. Lab Invest. 2003;83(11):1569–1581. doi:10.1097/01.LAB.0000095687.17383.39
10. Goudarzi A. The recent insights into the function of ACAT1: A possible anti-cancer therapeutic target. Life Sci. 2019;232:116592. doi:10.1016/j.lfs.2019.116592
11. Yue S, Li J, Lee SY, et al. Cholesteryl ester accumulation induced by PTEN loss and PI3K/AKT activation underlies human prostate cancer aggressiveness. Cell Metab. 2014;19(3):393–406. doi:10.1016/j.cmet.2014.01.019
12. Zhao Z, Lu J, Han L, Wang X, Man Q, Liu S. Prognostic significance of two lipid metabolism enzymes, HADHA and ACAT2, in clear cell renal cell carcinoma. Tumor Biol. 2015;37(6):8121–8130. doi:10.1007/s13277-015-4720-4
13. Rogers MA, Liu J, Song BL, Li BL, Chang CC, Chang TY. Acyl-CoA:cholesterol acyltransferases (ACATs/SOATs): enzymes with multiple sterols as substrates and as activators. J Steroid Biochem Mol Biol. 2015;151:102–107. doi:10.1016/j.jsbmb.2014.09.008
14. Chang TY, Chang CC, Lin S, Yu C, Li BL, Miyazaki A. Roles of acyl-coenzyme A: cholesterol acyltransferase-1 and −2. Curr Opin Lipidol. 2001;12(3):289–296. doi:10.1097/00041433-200106000-00008
15. Bocan TM, Mueller SB, Uhlendorf PD, Newton RS, Krause BR. Comparison of CI-976, an ACAT inhibitor, and selected lipid-lowering agents for antiatherosclerotic activity in iliac-femoral and thoracic aortic lesions. A biochemical, morphological, and morphometric evaluation. Arteriosclerosis Thrombosis. 1991;11(6):1830–1843. doi:10.1161/01.ATV.11.6.1830
16. Miyazaki A, Sakashita N, Lee O, et al. Expression of ACAT-1 protein in human atherosclerotic lesions and cultured human monocytes-macrophages. Arterioscler Thromb Vasc Biol. 1998;18(10):1568–1574. doi:10.1161/01.ATV.18.10.1568
17. Hutter-Paier B, Huttunen HJ, Puglielli L, et al. The ACAT inhibitor CP-113,818 markedly reduces amyloid pathology in a mouse model of Alzheimer’s disease. Neuron. 2004;44(2):227–238. doi:10.1016/j.neuron.2004.08.043
18. Bryleva EY, Rogers MA, Chang CC, et al. ACAT1 gene ablation increases 24(S)-hydroxycholesterol content in the brain and ameliorates amyloid pathology in mice with AD. Proc Natl Acad Sci U S A. 2010;107(7):3081–3086. doi:10.1073/pnas.0913828107
19. Bhattacharyya R, Barren C, Kovacs DM. Palmitoylation of amyloid precursor protein regulates amyloidogenic processing in lipid rafts. J Neurosci. 2013;33(27):11169–11183. doi:10.1523/JNEUROSCI.4704-12.2013
20. Shan C, Elf S, Ji Q, et al. Lysine acetylation activates 6-phosphogluconate dehydrogenase to promote tumor growth. Mol Cell. 2014;55(4):552–565. doi:10.1016/j.molcel.2014.06.020
21. Huang Y, Jin Q, Su M, et al. Leptin promotes the migration and invasion of breast cancer cells by upregulating ACAT2. Cell Oncol (Dordr). 2017;40(6):537–547. doi:10.1007/s13402-017-0342-8
22. Garcia-Bermudez J, Birsoy K. Drugging ACAT1 for cancer therapy. Mol Cell. 2016;64(5):856–857. doi:10.1016/j.molcel.2016.11.023
23. Chang CC, Miyazaki A, Dong R, et al. Purification of recombinant acyl-coenzyme A: cholesterol acyltransferase 1 (ACAT1) from H293 cells and binding studies between the enzyme and substrates using difference intrinsic fluorescence spectroscopy. Biochemistry. 2010;49(46):9957–9963. doi:10.1021/bi1013936
24. Chang CC, Sakashita N, Ornvold K, et al. Immunological quantitation and localization of ACAT-1 and ACAT-2 in human liver and small intestine. J Biol Chem. 2000;275(36):28083–28092. doi:10.1074/jbc.M003927200
25. Parini P, Davis M, Lada AT, et al. ACAT2 is localized to hepatocytes and is the major cholesterol-esterifying enzyme in human liver. Circulation. 2004;110(14):2017–2023. doi:10.1161/01.CIR.0000143163.76212.0B
26. Chen X, Liang H, Song Q, Xu X, Cao D. Insulin promotes progression of colon cancer by upregulation of ACAT1. Lipids Health Dis. 2018;17(1):122. doi:10.1186/s12944-018-0773-x
27. Ye K, Wu Y, Sun Y, Lin J, Xu J. TLR4 siRNA inhibits proliferation and invasion in colorectal cancer cells by downregulating ACAT1 expression. Life Sci. 2016;155:133–139. doi:10.1016/j.lfs.2016.05.012
28. Yang Y, Li J, Jin L, et al. Independent correlation between Ki67 index and circulating tumor cells in the diagnosis of colorectal cancer. Anticancer Res. 2017;37(8):4693–4700. doi:10.21873/anticanres.11874
29. Song BL, Wang CH, Yao XM, et al. Human acyl-CoA: cholesterol acyltransferase 2 gene expression in intestinal Caco-2 cells and in hepatocellular carcinoma. Biochem J. 2006;394(Pt 3):617–626. doi:10.1042/BJ20051417
30. Lu M, Hu XH, Li Q, et al. A specific cholesterol metabolic pathway is established in a subset of HCCs for tumor growth. J Mol Cell Biol. 2013;5(6):404–415. doi:10.1093/jmcb/mjt039
31. Locke JA, Wasan KM, Nelson CC, Guns ES, Leon CG. Androgen-mediated cholesterol metabolism in LNCaP and PC-3 cell lines is regulated through two different isoforms of acyl-coenzyme A: cholesterol Acyltransferase (ACAT). Prostate. 2008;68(1):20–33. doi:10.1002/pros.20674
 © 2020 The Author(s). This work is published and licensed by Dove Medical Press Limited. The full terms of this license are available at https://www.dovepress.com/terms.php and incorporate the Creative Commons Attribution - Non Commercial (unported, v3.0) License.
By accessing the work you hereby accept the Terms. Non-commercial uses of the work are permitted without any further permission from Dove Medical Press Limited, provided the work is properly attributed. For permission for commercial use of this work, please see paragraphs 4.2 and 5 of our Terms.
© 2020 The Author(s). This work is published and licensed by Dove Medical Press Limited. The full terms of this license are available at https://www.dovepress.com/terms.php and incorporate the Creative Commons Attribution - Non Commercial (unported, v3.0) License.
By accessing the work you hereby accept the Terms. Non-commercial uses of the work are permitted without any further permission from Dove Medical Press Limited, provided the work is properly attributed. For permission for commercial use of this work, please see paragraphs 4.2 and 5 of our Terms.