")
Back to Journals » OncoTargets and Therapy » Volume 11
Absence of AIF1L contributes to cell migration and a poor prognosis of breast cancer
Authors Liu P, Li W, Hu Y, Jiang Y
Received 19 February 2018
Accepted for publication 30 May 2018
Published 5 September 2018 Volume 2018:11 Pages 5485—5498
DOI https://doi.org/10.2147/OTT.S165874
Checked for plagiarism Yes
Review by Single anonymous peer review
Peer reviewer comments 4
Editor who approved publication: Dr Jianmin Xu
Peipei Liu,1 Wenhui Li,2 Yuanyuan Hu,1 Youhong Jiang1
1Molecular Oncology Laboratory of Cancer Research Institute, The First Hospital of China Medical University, Shenyang, People’s Republic of China; 2Gastrointestinal Onco-Pathology Laboratory of Cancer Institute, The First Hospital of China Medical University, Shenyang 110001, People’s Republic of China
Background: Breast cancer is the most common fatal cancer in women worldwide. Previous studies have demonstrated that allograft inflammatory factor 1 like (AIF1L) plays a key role in mammary tumorigenesis, although the mechanism involved remains unclear.
Purpose: The purpose of this study was to assess the clinicopathological and prognostic significance of AIF1L expression levels and biological function in breast cancer.
Patients and methods: We used immunohistochemistry to detect the expression of AIF1L in breast cancer. We also analyzed the expression of AIF1L in breast cancer using the Cancer Genome Atlas (TCGA) cohort and the Cancer Cell Line Encyclopedia (CCLE). Furthermore, both in vitro assays were used to determine the effect of AIF1L on malignant behavior in breast cancer cells.
Results: We detected AIF1L expression in tissue microarrays through immunohistochemistry and found that protein expression was significantly lower in BC tissues (28.6%, 82/287) compared to tumor-adjacent tissues (58.3%, 28/48) (P=0.007). Kaplan-Meier survival analysis revealed that disease-specific survival in BC patients with low AIF1L protein expression was significantly poorer compared to normal controls (P=0.040). In the TCGA cohort, the AIF1L gene was downregulated and hypermethylated in tumor samples compared to normal controls. Bioinformatics analysis using CCLE predicted potential biological functions of AIF1L related to tight junctions, cell junctions and focal adhesion. Ectopic expression of AIF1L suppressed MDA-MB-231 migration and invasion. Further evidence confirmed that AIF1L overexpression suppressed cell spreading, altered cell shape and decreased protrusion formation, which was correlated with decreased focal adhesion kinase (FAK) and RhoA expression.
Conclusion: These findings suggest that AIF1L is a potential prognostic biomarker that plays a vital role in regulating the cytoskeleton in breast cancer.
Keywords: AIF1L, breast cancer, cytoskeleton, TCGA
Introduction
Breast cancer (BC) is the leading cause of cancer deaths among females worldwide, with an estimated >500,000 deaths occurring in 2012.1 As the incidence of BC is increasing rapidly,2 understanding the biological mechanisms involved and exploring novel targets are urgently needed.
EF-hand proteins are a large number of Ca2+-binding proteins.3,4 The EF-hand is a helix–loop–helix calcium-binding motif. They are involved in various biological processes, including inflammation, exocytosis, motility, apoptosis, tumor progression, and so on.3
Allograft inflammatory factor 1 like (AIF1L) is a protein with EF-hand motifs lacking bound Ca2+.5 AIF1L consists of 150 amino acids, and the sequence identity to AIF1 is 60%. AIF1 protein is majorly expressed in the immune cells and participates in the inflammatory response and regulation.6 AIF1 can activate the monocyte/macrophage, microglia, and lymphocyte immune cells, promote the expression of inflammatory mediators such as cytokines, chemokines, nitric oxide synthase, and boost immune cell proliferation and migration.7–9 However, AIF1L is majorly expressed in the epithelial cells, such as renal glomerulus and renal tubules, endometrial gland, mammary ductal epithelial cells, glandular epithelium of epididymis, and vascular endothelial cells of spleen.10,11 Although AIF1 and AIF1L have remarkable sequence homology and structural similarity, they show a distinct pattern of tissue specific expression, so we speculated they have different biological functions.
AIF1L co-localizes with and crosslinks filamentous actin (F-actin) with subcortical filaments and localizes to membrane ruffle-like cellular projections and adhesion structures in a Shigella invasion model.5 AIF1L deficiency, which was functionally analyzed by siRNA silencing, was shown to result in significant loss and rearrangement of F-actin stress fibers, as shown by phalloidin staining, and led to cytoskeletal injury in immortalized human podocytes.12 So far, the potential roles of AIF1L in carcinogenesis have not been well characterized.
We studied AIF1L expression levels in BC, the effects of AIF1L on migration and invasion of BC cells, and characterized an AIF1L-related signaling pathway that influences cytoskeletal modifications.
Patients and methods
Cell culture and engineering
The MDA-MB-231 BC cell line was purchased from American Type Culture Collection. Cells were cultured in L15 medium (Hyclone) supplemented with 10% fetal bovine serum (Thermo Fisher Scientific, MA USA). Adenoviruses purchased from Hanbio Biotechnology Co., Ltd. (Shanghai, People’s Republic of China) were used to overexpress human AIF1L in MDA-MB-231 cells via transient transfection.
Microarray and immunohistochemistry
A total of 287 tissue samples from primary BC patients who underwent curative resection were collected at the First Hospital of China Medical University between December 2003 and April 2007. Tissue specimens were initially paraffin embedded and processed for routine histological evaluation. Written informed consent was obtained from each patient. Clinicopathologic data, including age, gender, World Health Organization histological type, and TNM stage, as well as estrogen receptor (ER), progesterone receptor (PR), Ki67, and human epidermal growth factor receptor 2 (HER2) expression, were collected. A total of 259 BC patients with at least a 5-year follow-up were included in prognosis analysis. This study was conducted in accordance with the Declaration of Helsinki and approved by the Ethics Committee of China Medical University. All samples were evaluated by two experienced pathologists to confirm diagnosis. AIF1L expression levels were detected using a two-step immunohistochemical method (Beijing Zhongshan Golden Bridge Biotechnology Company, Beijing, People’s Republic of China). Rabbit polyclonal antibodies against human AIF1L were purchased from Abcam (Shanghai, People’s Republic of China). Tissue microarray slides were deparaffinized in xylene and hydrated with graded alcohol before incubation with 3% H2O2 and heat-induced antigen retrieval. Slides were incubated with primary antibodies overnight at 4°C and stained using a two-step detection system; counterstaining was performed with hematoxylin. All procedures were carried out according to the manufacturers’ instructions. For negative controls, sections were treated with 0.01 mol/L PBS instead of primary antibodies.
Cells expressing AIF1L proteins had visible brown granules in the cytoplasm and membrane. Immunostaining intensities were evaluated by two independent pathologists in a blinded manner. The scoring system was based on the intensity and extent of staining. Expression levels were classified as low and high, as previously described.13
Biological informatics analysis for AIF1L expression and methylation
The Cancer Genome Atlas (TCGA) RNA-sequencing database (level 3 data) included 1,100 BC samples and 112 normal controls. To identify an association between AIF1L methylation and expression, we also downloaded HumanMethylation450 data (level 3 data) for breast tumor tissues and adjacent non-tumor tissues from TCGA. The association between AIF1L mRNA expression and DNA methylation was determined by calculating the Spearman correlation coefficient. The total number of matched samples was 868. Beta-value statistics were used to measure methylation levels.14 AIF1L protein expression in BC was confirmed according to The Human Protein Atlas.50
Cancer Cell Line Encyclopedia (CCLE) data analysis
The CCLE project is an effort to conduct detailed genetic characterization of a large panel of human cancer cell lines. CCLE provides public access analysis and visualization of DNA copy number, mRNA expression, mutation data, and more for ~1,000 cancer cell lines,15,16 including 52 BC cells that were analyzed in the present study. We withdrew AIF1L co-expression genes from the CCLE database with R language, then used DAVID Bioinformatics Resources 6.7 (National Institute of Allergy and Infectious Diseases, MD, USA, National Institutes of Health [NIH]) for gene ontology and the Kyoto Encyclopedia of Genes and Genomes enrichment analyses (https://david.abcc.ncifcrf.gov/).17,18 Data from the BC cell lines were also evaluated using gene set enrichment analysis (GSEA) and GSEA2-2.2.3 software. AIF1L expression levels were dichotomized into two groups to annotate phenotype with msigdb.v5.2.symbols gene sets.19,20 All other parameters were set to default values.21,22
Transwell migration and invasion assays
Migration and invasion assays were performed as previously described.23 For the invasion assays, 50 μL Matrigel (Corning, NY, USA) was added to the well inserts and incubated overnight. Cells (5×10⁴) were suspended in serum-free culture media and seeded into Transwell inserts. Plates on the bottom received complete media and were incubated at 37°C for 24 hours. Unmigrated cells were removed using cotton swabs. Cells were fixed with 4% paraformaldehyde and stained with a 1% crystal violet solution (Sigma-Aldrich St. Louis, MO, USA). For each plate, five random fields were counted at 10× magnification. Images were processed with ImageJ software to count the number of cells in the migration and invasion assay.
Protein extraction and immunoblots
Cells were solubilized in radioimmunoprecipitation assay lysis buffer with protease inhibitors. Equal amounts of protein were resolved by sodium dodecyl sulfate-polyacrylamide gel electrophoresis and transferred to polyvinylidene fluoride membranes. Membranes were blocked with 5% nonfat milk for 2 hours and incubated overnight at 4°C with primary antibodies. Proteins were detected using an enhanced chemiluminescence kit and photographed using the ChemiDoc MP System (Bio-Rad Laboratories Inc., Hercules, CA, USA). Rabbit monoclonal antibodies against human FAK and RHOA were purchased from Abcam.
Cell spreading assays
A cell spreading assay was performed as previously described.24 MDA-MB-231 controls and AIF1L-overexpressing cells were resuspended in serum-free medium. A total of 5×10⁴ cells were added to Matrigel-coated glass coverslips. Sixty minutes after plating, cells were fixed with 4% paraformaldehyde for 20 minutes at room temperature. After washing with PBS, 0.1% Triton X-100 (in PBS) was added for 10 minutes at room temperature. Cells were blocked with 10% normal goat serum for 10 minutes at room temperature. Cells were incubated with 0.5 μM tetramethylrhodamine-phalloidin (Sigma-Aldrich) for 1 hour at room temperature and counterstained with 4′,6-diamidino-2-phenylindole to visualize nuclei. Coverslips were imaged using epifluorescence microscopy (Nikon Corporation, Tokyo Japan). Images were processed with ImageJ software to measure the areas of the cell and nucleus. Circularity and aspect ratio were used to measure cell shape as previously described.25,26 Both cell circularity and aspect ratio were used to measure the roundness of a cell. Over 50 cells were quantified per sample. The experiment was performed in three technical replicates.
Statistical analysis
Statistical analysis was performed with SPSS 17.0 (SPSS Inc., Chicago, IL, USA) or R language. Continuous data are shown as the mean ± SD or standard error of mean for normally distributed data. Chi-squared test or Fisher’s exact test was used to compare different groups. Log-rank testing was used to assess the associations between disease-free survival and disease covariates to identify prognostic factors. Two sided P<0.05 was considered statistically significant.
Results
Downregulation of AIF1L expression in BC
In this cohort, positive rates of AIF1L protein expression in BC (28.6%, 82/287) were significantly lower than in tumor-adjacent tissues (58.3%, 28/48; P=0.007; Figure 1A and B). AIF1L mRNA expression was also significantly decreased in BC compared with controls in TCGA (Figure 1E). Methylation of gene CpG island promoters is a generally accepted mechanism for silencing expression. Strong associations between methylation patterns and expression have been reported.27 HumanMethylation450 BeadChip (450 K) is based on the Illumina Technology and contains 482,421 probes, targeting 99% of genes and 96% of CpG island regions.28 Spearman correlation coefficients were calculated, which showed a negative correlation between the expression and methylation of AIF1L genes (Figure 1G). Notably, AIF1L genes were hypermethylated in tumor samples compared to normal controls (Figure 1F). Using data from Protein Atlas, AIF1L protein staining against HPA020522 and HPA056852 antibodies (rabbit polyclonal antibody; Sigma-Aldrich) was visible in both the cytoplasm and membranes. Normal breast glandular cells showed higher staining intensity for HPA020522 and medium staining intensity for HPA056852. Results of staining BC cells are as follows: medium (2/12), low (2/12), and not detected (8/12) for HPA020522 and medium (4/12), low (5/12), and not detected (3/12) for HPA056852.
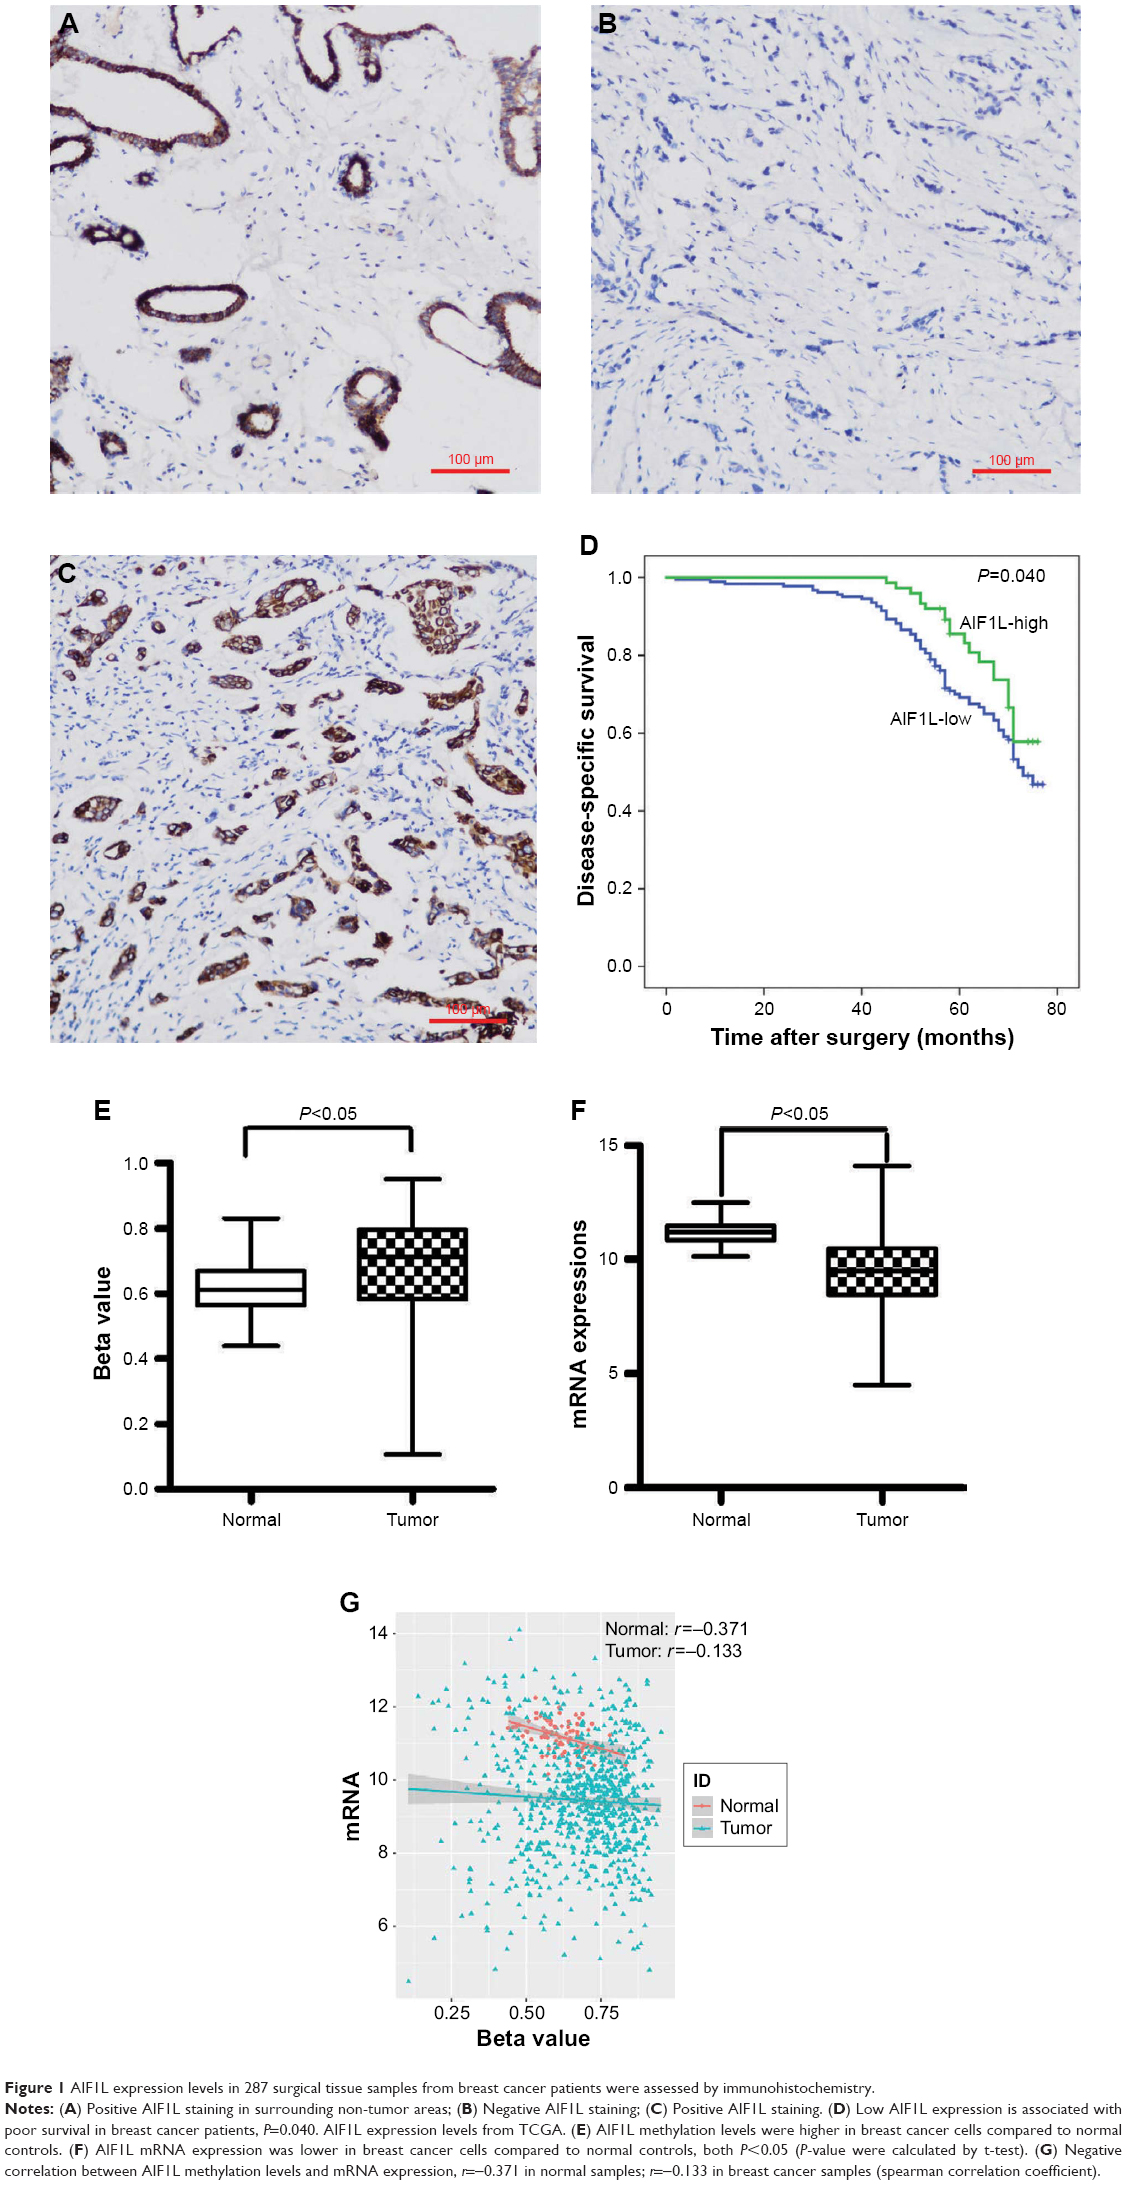 | Figure 1 AIF1L expression levels in 287 surgical tissue samples from breast cancer patients were assessed by immunohistochemistry. |
Correlation between AIF1L levels and clinicopathologic factors
Positive rates of AIF1L expression in HER2+ were significantly higher than HER2− (P=0.038). AIF1L expression was lower in triple-negative breast cancer (TNBC) compared with non-TNBC. No significant differences in AIF1L levels were detected in relation to age, T&N stage subtype, ER and PR status, and Ki67 status (Table 1).
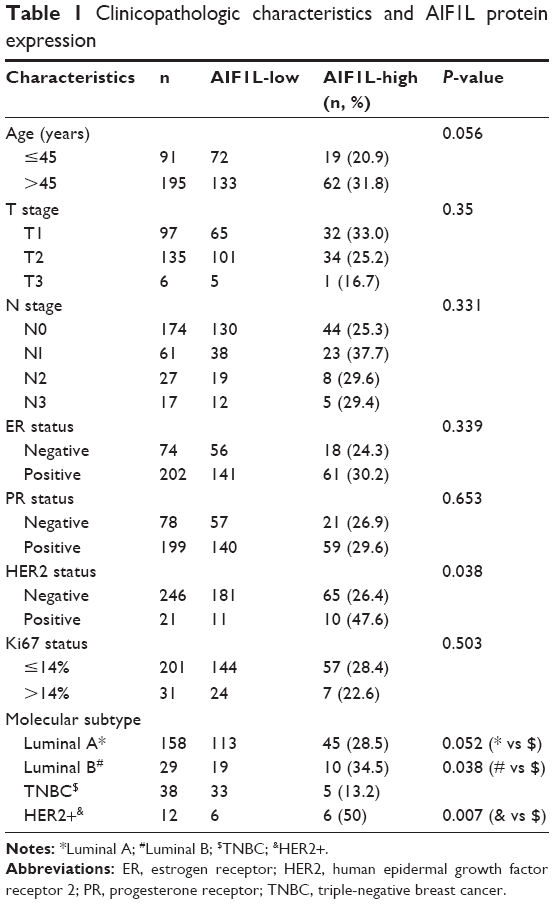 | Table 1 Clinicopathologic characteristics and AIF1L protein expression |
Low expression of AIF1L correlates with shorter disease-free survival in BC patients
Patients with low AIF1L expression showed a poor disease-free survival rate (P=0.040; Figure 1). The hazard ratio (HR) for AIF1L protein expression was 0.610 (95% CI, 0.377–0.987; P=0.044) in the AIF1L-positive group (univariate analysis). Seven baseline variables (age, T&N stage subtype, ER status, PR status, HER2 status, and Ki67 status) were evaluated with AIF1L expression using Cox regression analysis. The HR for AIF1L was not significantly changed (HR=0.724 [95% CI, 0.404–1.298]; P=0.278).
Potential biological functions of AIF1L
To explore the unique roles of AIF1L, we identified 196 AIF1L co-expression genes from the CCLE database with R language by setting the Pearson coefficient >0.6. After performing gene ontology and the Kyoto Encyclopedia of Genes and Genomes pathway analysis using DAVID tools,17 the most enriched biological themes were related to tight junctions and cell junctions (Figure 2A). To further assess the biological function of AIF1L in breast tumorigenesis, we applied GSEA to BC cells from the CCLE. Top 50 differentially expressed genes between low vs high expressions of AIF1L are shown in Table S1. Downregulation of AIF1L was significantly correlated with focal adhesion (FA; Figure 2B). Genes in the FA pathway were identified by GSEA (Figure 2C; Table S2).
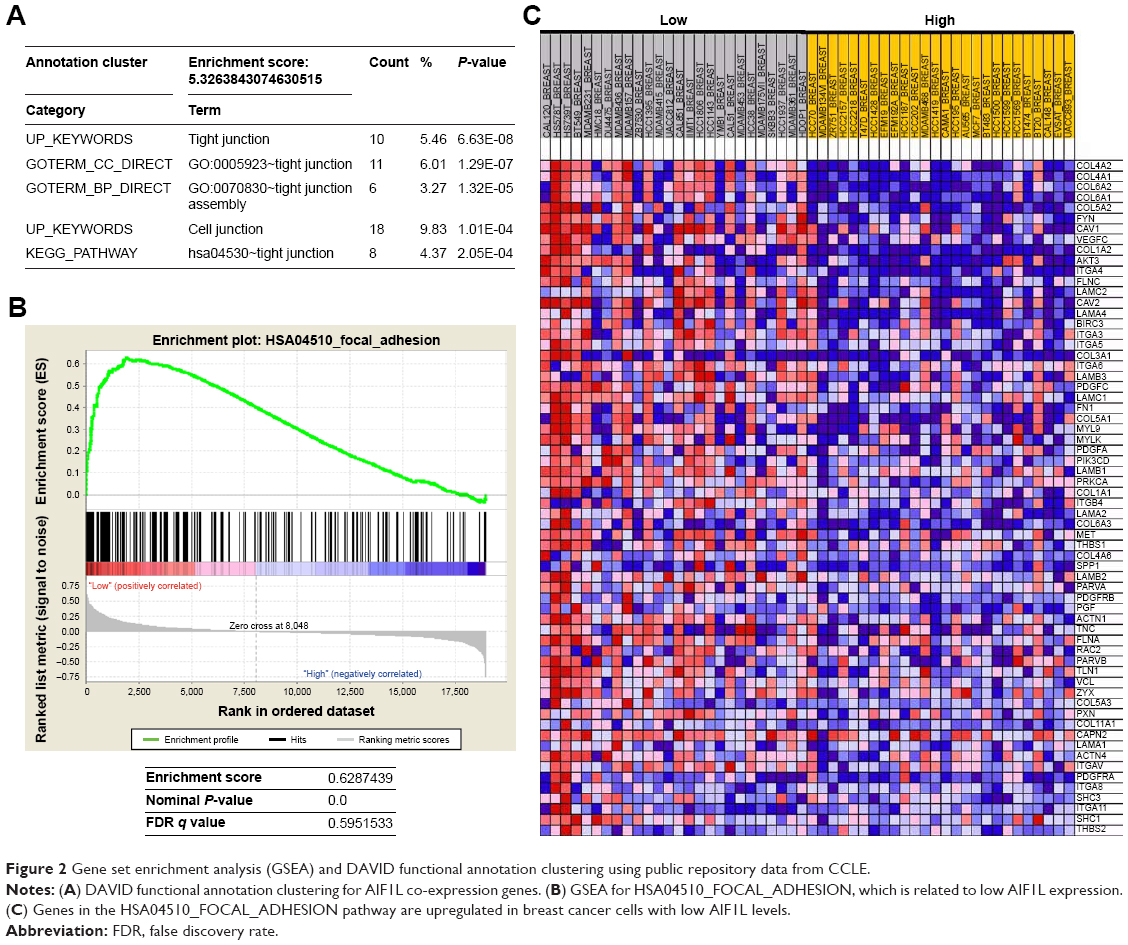 | Figure 2 Gene set enrichment analysis (GSEA) and DAVID functional annotation clustering using public repository data from CCLE. |
AIF1L inhibits migration and invasion of MDA-MB-231 BC cells
The mRNA expression levels of BC cells in CCLE are shown Figure S1. AIF1L expression of MDA-MB-231 cells was lower than that of immortalized epithelial HMEL cells. To further investigate the effect of AIF1L overexpression on cell migration and invasion, the Transwell migration and invasion assays were performed. Transwell migration and invasion assays showed that transient overexpression of AIF1L significantly suppressed migration and invasion compared to the control group (P<0.05; Figure 3).
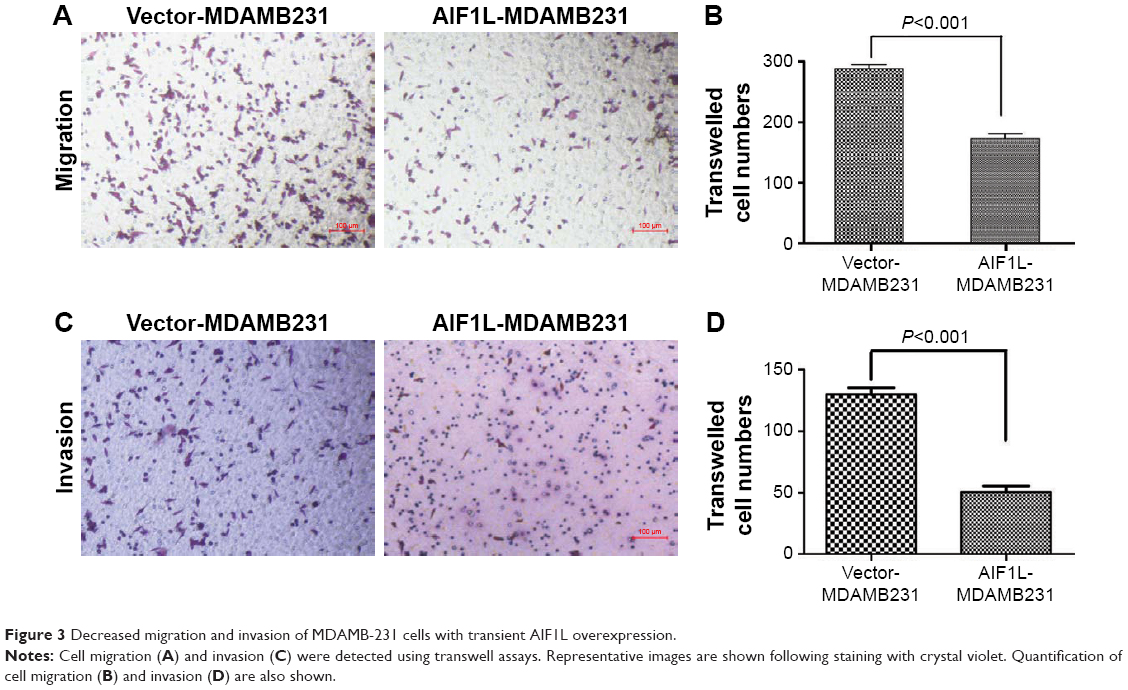 | Figure 3 Decreased migration and invasion of MDAMB-231 cells with transient AIF1L overexpression. |
AIF1L inhibits MDA-MB-231 cell spreading and mediates focal adhesion kinase (FAK) levels involved in ROCK signaling
Cell migration and spreading are initiated by global reorganization of the actin cytoskeleton and extending actin polymerization-driven lamellipodium protrusions of the cell membrane.29,30 Thirty minutes after plating, cells overexpressing AIF1L spread less efficiently than the control cells (Figure 4A, B, E) and were less elongated, as indicated by an increase in circularity and decrease in aspect ratio (Figure 4C–F). Elongated cells showed actin remodeling toward the membrane, which is equivalent to the formation of ruffles and pseudopodia (Figure 4D).
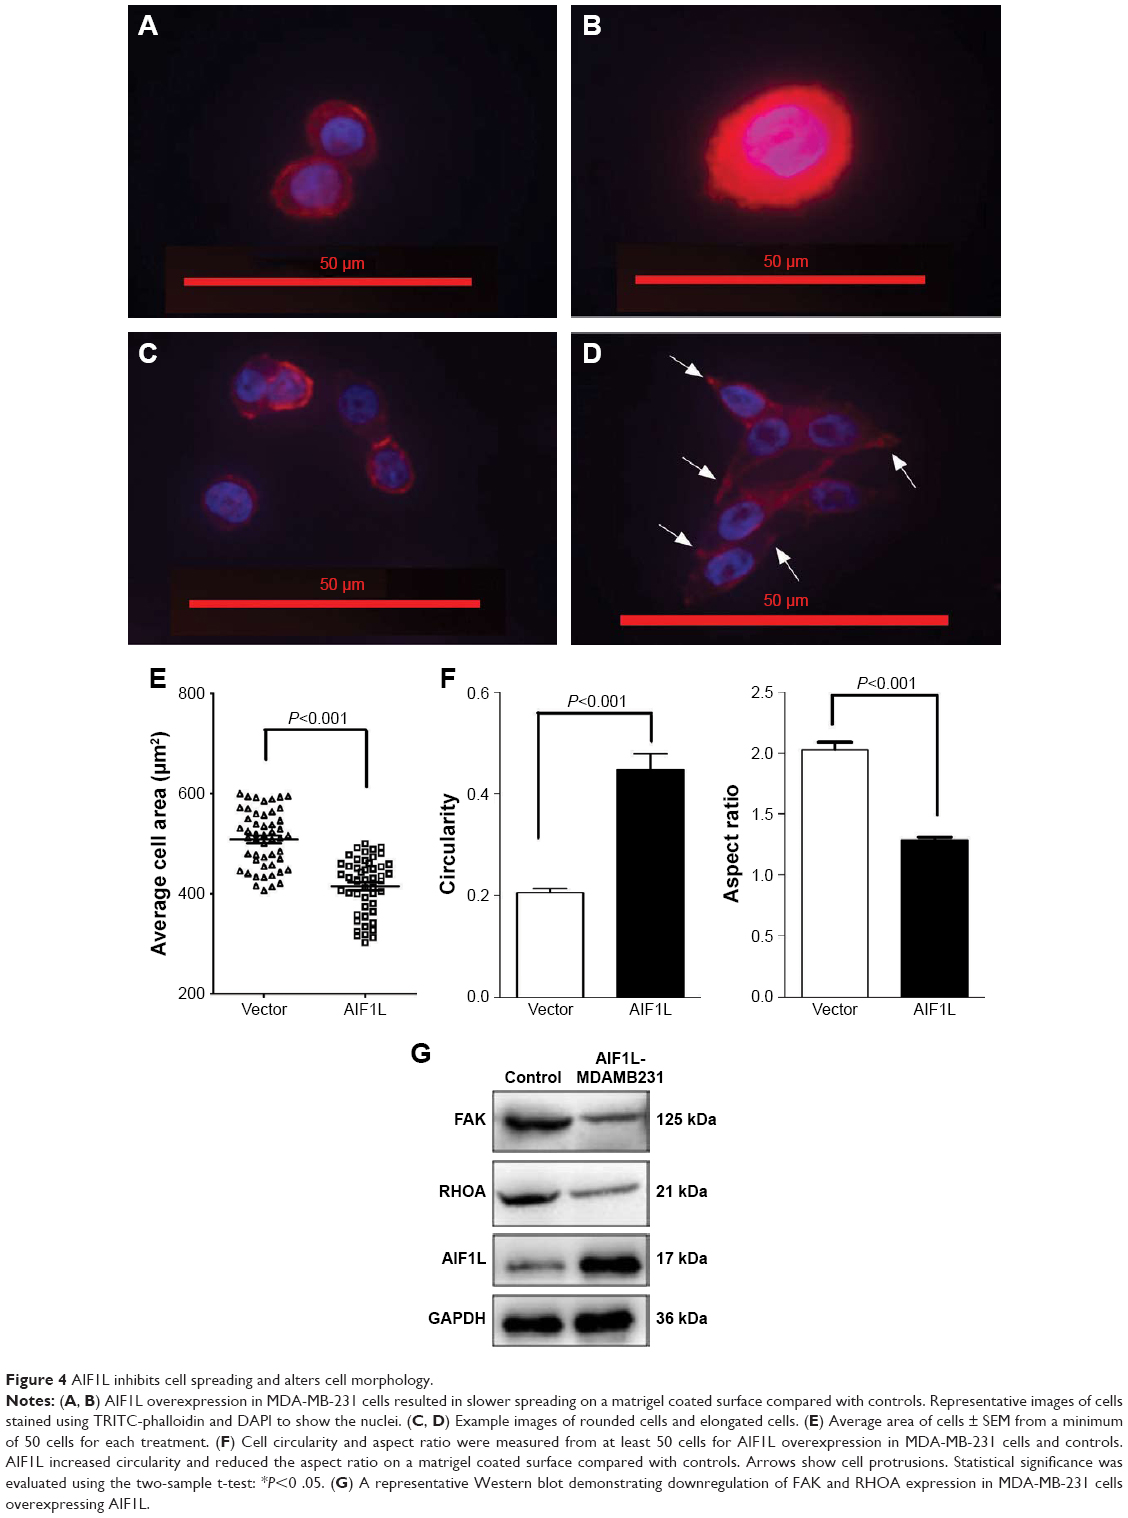 | Figure 4 AIF1L inhibits cell spreading and alters cell morphology. |
FAK is a nonreceptor tyrosine kinase that plays a central role in cell migration through regulation of lamellipodial formation and FAs.31,32 Increased FAK expression has been correlated with increased clinical progression in BC.33,34 Therefore, we assessed FAK expression in AIF1L-overexpressing MDA-MB-231 cells and controls and showed that AIF1L led to increased inhibition of FAK expression (Figure 4G). FAK is involved with activators and/or inhibitors of the small GTPase RhoA that enable FAK activity to be connected to alterations in polymerization of actin filaments during tumor cell adhesion and motility.35,36 RhoA expression was also inhibited by AIF1L overexpresssion in MDA-MB-231 cells (Figure 4G).
Discussion
In the present study, we analyzed the expression and clinicopathologic significance of AIF1L in BC. Low AIF1L protein expression was observed in 71.4% of BC samples in this cohort. AIF1L mRNA expression was also lower in patients with BC in TCGA cohort. Furthermore, AIF1L protein expression in BC was confirmed from Protein Atlas. Thus, AIF1L expression is downregulated in BC. Furthermore, we integrated AIF1L DNA methylation and gene expression from TCGA database and found that AIF1L downregulation may be due to hypermethylation of the promoter. Given that the Spearman correlation coefficient was very low, particularly with tumor tissues, we searched51 and found that no genetic alterations in AIF1L were reported in 977 sequenced patients from TCGA. We hypothesized that in addition to methylation, there might be some other reason for AIF1L downregulation, such as a posttranscriptional regulation mechanism rather than gene mutation. Low AIF1L expression was detected in TNBC and was correlated with a poor postoperative disease-specific survival. TNBC accounts for ~15%–20% of BCs and is defined by the absence of ERα, PR, and HER2 amplification, which is resistant to conventional chemotherapy, lack of targeting agents and is often associated with a poor prognosis.37,38 AIF1L could be a unique molecular target of TNBCs.
CCLE data analysis revealed AIF1L-related pathways, including cell junction, tight junction, and FA. Of the AIF1L co-expression genes, CDH1 (cadherin 1, E-cadherin) is a major component of intercellular junctions, and loss of its expression has been shown to reduce BC invasion and metastasis.39,40 FAs connect the cytoskeleton and extracellular matrix (ECM). Interplay between the actin cytoskeleton and FA dynamics results in a balance between adhesion and contraction, which greatly influences cell migration.35,41
Although AIF1L induces cytoskeletal rearrangements in HeLa cells and podocytes, whether it is involved in BC progression, especially in TNBCs, is not understood. The data reported herein show that ectopic AIF1L expression suppresses MDA-MB-231 BC cell motility and invasion by inducing cytoskeletal modifications, which are achieved through FAK/RHOA signaling. High FAK expression was correlated with shorter overall survival and progression-free survival in patients with BC, especially in TNBC patients with high FAK expression.42,43 RhoA protein is also overexpressed in BC.44,45 The actin cytoskeleton is linked to invasive and metastatic phenotypes of malignant cancer cells. Cell migration is driven by cycles of actin polymerization and is initiated by cell membrane protrusions called filopodia, lamellipodia, and invadopodia.46 These protrusions are stabilized by adhesions linking the actin cytoskeleton to ECM proteins and actomyosin contraction.35,47 Located on the inner face of the cell membrane, FAs form a vital link between the ECM and the cytoskeleton. Interplay between F-actin contractile forces and FA dynamics greatly influences cell migration capacity.35 Integrin receptor binding to ECM proteins is one of the strongest activators of FAK.48,49 In the present study, MDA-MB-231 cells transfected with AIF1L showed decreased cell spreading, more circular cell shape, and formation of fewer protrusions. GSEA also found low AIF1L expression correlated with high expression of collagens such as COL4, COL6, COL5, and COL1. AIF1L may inhibit FAK/RHOA expression through interfering in cell–ECM signaling. But the accurate molecular mechanism needs further research. These results support a role for AIF1L in regulating actin remodeling associated with cell migration.
Conclusion
This study evaluated AIF1L expression in BC and found that AIF1L downregulation may predict a poor prognosis. AIF1L suppresses BC migration and invasion through regulating actin remodeling, which is dependent on FAK/RHOA signaling. However, additional mechanisms that influence AIF1L regulation of the actin cytoskeleton should be identified and characterized in the future.
Disclosure
The authors report no conflicts of interest in this work.
References
Torre LA, Bray F, Siegel RL, Ferlay J, Lortet-Tieulent J, Jemal A. Global cancer statistics, 2012. CA Cancer J Clin. 2015;65(2):87–108. | ||
Ginsburg O, Bray F, Coleman MP, et al. The global burden of women’s cancers: a grand challenge in global health. Lancet. 2017;389(10071):847–860. | ||
Kawasaki H, Kretsinger RH. Structural and functional diversity of EF-hand proteins: Evolutionary perspectives. Protein Sci. 2017;26(10):1898–1920. | ||
Clapham DE. Calcium signaling. Cell. 2007;131(6):1047–1058. | ||
Schulze JO, Quedenau C, Roske Y, et al. Structural and functional characterization of human Iba proteins. FEBS J. 2008;275(18):4627–4640. | ||
Ito D, Imai Y, Ohsawa K, Nakajima K, Fukuuchi Y, Kohsaka S. Microglia-specific localisation of a novel calcium binding protein, Iba1. Brain Res Mol Brain Res. 1998;57(1):1–9. | ||
Yang ZF, Ho DW, Lau CK, et al. Allograft inflammatory factor-1 (AIF-1) is crucial for the survival and pro-inflammatory activity of macrophages. Int Immunol. 2005;17(11):1391–1397. | ||
Autieri MV, Kelemen S, Thomas BA, Feller ED, Goldman BI, Eisen HJ. Allograft inflammatory factor-1 expression correlates with cardiac rejection and development of cardiac allograft vasculopathy. Circulation. 2002;106(17):2218–2223. | ||
Cai H, Zhu XD, Ao JY, Jy A, et al. Colony-stimulating factor-1-induced AIF1 expression in tumor-associated macrophages enhances the progression of hepatocellular carcinoma. Oncoimmunology. 2017;6(9):e1333213. | ||
Uhlen M, Zhang C, Lee S, et al. A pathology atlas of the human cancer transcriptome. Science. 2017;357(6352):eaan2507. | ||
Uhlén M, Fagerberg L, Hallström BM, et al. Proteomics. Tissue-based map of the human proteome. Science. 2015;347(6220):1260419. | ||
Lu Y, Ye Y, Bao W, et al. Genome-wide identification of genes essential for podocyte cytoskeletons based on single-cell RNA sequencing. Kidney Int. 2017;92(5):1119–1129. | ||
Zhang H, Luo M, Jin Z, et al. Expression and clinicopathological significance of FSIP1 in breast cancer. Oncotarget. 2015;6(12):10658–10666. | ||
Du P, Zhang X, Huang CC, et al. Comparison of Beta-value and M-value methods for quantifying methylation levels by microarray analysis. BMC Bioinformatics. 2010;11:587. | ||
Barretina J, Caponigro G, Stransky N, et al. The Cancer Cell Line Encyclopedia enables predictive modelling of anticancer drug sensitivity. Nature. 2012;483(7391):603–607. | ||
Shiau CK, Gu DL, Chen CF, Lin CH, Jou YS. IGRhCellID: integrated genomic resources of human cell lines for identification. Nucleic Acids Res. 2011;39(Database issue):D520–D524. | ||
Huang da W, Sherman BT, Lempicki RA. Systematic and integrative analysis of large gene lists using DAVID bioinformatics resources. Nat Protoc. 2009;4(1):44–57. | ||
Huang da W, Sherman BT, Lempicki RA. Bioinformatics enrichment tools: paths toward the comprehensive functional analysis of large gene lists. Nucleic Acids Res. 2009;37(1):1–13. | ||
Liberzon A, Subramanian A, Pinchback R, Thorvaldsdóttir H, Tamayo P, Mesirov JP. Molecular signatures database (MSigDB) 3.0. Bioinformatics. 2011;27(12):1739–1740. | ||
Liberzon A, Birger C, Thorvaldsdóttir H, Ghandi M, Mesirov JP, Tamayo P. The Molecular Signatures Database (MSigDB) hallmark gene set collection. Cell Syst. 2015;1(6):417–425. | ||
Subramanian A, Tamayo P, Mootha VK, et al. Gene set enrichment analysis: a knowledge-based approach for interpreting genome-wide expression profiles. Proc Natl Acad Sci U S A. 2005;102(43):15545–15550. | ||
Mootha VK, Lindgren CM, Eriksson KF, et al. PGC-1alpha-responsive genes involved in oxidative phosphorylation are coordinately downregulated in human diabetes. Nat Genet. 2003;34(3):267–273. | ||
Xiong X, Wang Y, Liu C, et al. Heat shock protein 90β stabilizes focal adhesion kinase and enhances cell migration and invasion in breast cancer cells. Exp Cell Res. 2014;326(1):78–89. | ||
Humphries MJ. Cell adhesion assays. Methods Mol Biol. 2009;522:203–210. | ||
Carey SP, Kraning-Rush CM, Williams RM, Reinhart-King CA. Biophysical control of invasive tumor cell behavior by extracellular matrix microarchitecture. Biomaterials. 2012;33(16):4157–4165. | ||
Gehler S, Compere FV, Miller AM. Semaphorin 3A increases FAK phosphorylation at focal adhesions to modulate MDA-MB-231 cell migration and spreading on different substratum concentrations. Int J Breast Cancer. 2017;2017:9619734. | ||
Vanderkraats ND, Hiken JF, Decker KF, Edwards JR. Discovering high-resolution patterns of differential DNA methylation that correlate with gene expression changes. Nucleic Acids Res. 2013;41(14):6816–6827. | ||
Bibikova M, Barnes B, Tsan C, et al. High density DNA methylation array with single CpG site resolution. Genomics. 2011;98(4):288–295. | ||
Parsons JT, Horwitz AR, Schwartz MA. Cell adhesion: integrating cytoskeletal dynamics and cellular tension. Nat Rev Mol Cell Biol. 2010;11(9):633–643. | ||
Zimerman B, Volberg T, Geiger B. Early molecular events in the assembly of the focal adhesion-stress fiber complex during fibroblast spreading. Cell Motil Cytoskeleton. 2004;58(3):143–159. | ||
Mitra SK, Hanson DA, Schlaepfer DD. Focal adhesion kinase: in command and control of cell motility. Nat Rev Mol Cell Biol. 2005;6(1):56–68. | ||
Mitra SK, Schlaepfer DD. Integrin-regulated FAK-Src signaling in normal and cancer cells. Curr Opin Cell Biol. 2006;18(5):516–523. | ||
Almstedt K, Sicking I, Battista MJ, et al. Prognostic significance of focal adhesion kinase in node-negative breast cancer. Breast Care. 2017;12(5):329–333. | ||
Lark AL, Livasy CA, Dressler L, et al. High focal adhesion kinase expression in invasive breast carcinomas is associated with an aggressive phenotype. Mod Pathol. 2005;18(10):1289–1294. | ||
Fife CM, Mccarroll JA, Kavallaris M. Movers and shakers: cell cytoskeleton in cancer metastasis. Br J Pharmacol. 2014;171(24):5507–5523. | ||
Lim Y, Lim ST, Tomar A, et al. PyK2 and FAK connections to p190Rho guanine nucleotide exchange factor regulate RhoA activity, focal adhesion formation, and cell motility. J Cell Biol. 2008;180(1):187–203. | ||
Papa A, Caruso D, Tomao S, Rossi L, Zaccarelli E, Tomao F. Triple-negative breast cancer: investigating potential molecular therapeutic target. Expert Opin Ther Targets. 2015;19(1):55–75. | ||
Arnedos M, Bihan C, Delaloge S, Andre F. Triple-negative breast cancer: are we making headway at least? Ther Adv Med Oncol. 2012;4(4):195–210. | ||
Onder TT, Gupta PB, Mani SA, Yang J, Lander ES, Weinberg RA. Loss of E-cadherin promotes metastasis via multiple downstream transcriptional pathways. Cancer Res. 2008;68(10):3645–3654. | ||
Derksen PW, Liu X, Saridin F, et al. Somatic inactivation of E-cadherin and p53 in mice leads to metastatic lobular mammary carcinoma through induction of anoikis resistance and angiogenesis. Cancer Cell. 2006;10(5):437–449. | ||
Gupton SL, Waterman-Storer CM. Spatiotemporal feedback between actomyosin and focal-adhesion systems optimizes rapid cell migration. Cell. 2006;125(7):1361–1374. | ||
Golubovskaya VM, Ylagan L, Miller A, et al. High focal adhesion kinase expression in breast carcinoma is associated with lymphovascular invasion and triple-negative phenotype. BMC Cancer. 2014;14:769. | ||
Yom CK, Noh DY, Kim WH, Kim HS. Clinical significance of high focal adhesion kinase gene copy number and overexpression in invasive breast cancer. Breast Cancer Res Treat. 2011;128(3):647–655. | ||
Murakami E, Nakanishi Y, Hirotani Y, et al. Roles of Ras homolog A in invasive ductal breast carcinoma. Acta Histochem Cytochem. 2016;49(5):131–140. | ||
Bellizzi A, Mangia A, Chiriatti A, et al. RhoA protein expression in primary breast cancers and matched lymphocytes is associated with progression of the disease. Int J Mol Med. 2008;22(1):25–31. | ||
Yamaguchi H, Condeelis J. Regulation of the actin cytoskeleton in cancer cell migration and invasion. Biochim Biophys Acta. 2007;1773(5):642–652. | ||
Olson MF, Sahai E. The actin cytoskeleton in cancer cell motility. Clin Exp Metastasis. 2009;26(4):273–287. | ||
Kanchanawong P, Shtengel G, Pasapera AM, et al. Nanoscale architecture of integrin-based cell adhesions. Nature. 2010;468(7323):580–584. | ||
Horton ER, Byron A, Askari JA, et al. Definition of a consensus integrin adhesome and its dynamics during adhesion complex assembly and disassembly. Nat Cell Biol. 2015;17(12):1577–1587. | ||
Uhlén M, Fagerberg L, Hallström BM, et al. Proteomics. Tissue-based map of the human proteome. Science. 2015;347(6220):1260419. | ||
Gao J, Aksoy BA, Dogrusoz U, et al. Integrative analysis of complex cancer genomics and clinical profiles using the cBioPortal. Sci Signal. 2013;2:6(269):1. |
Supplementary materials
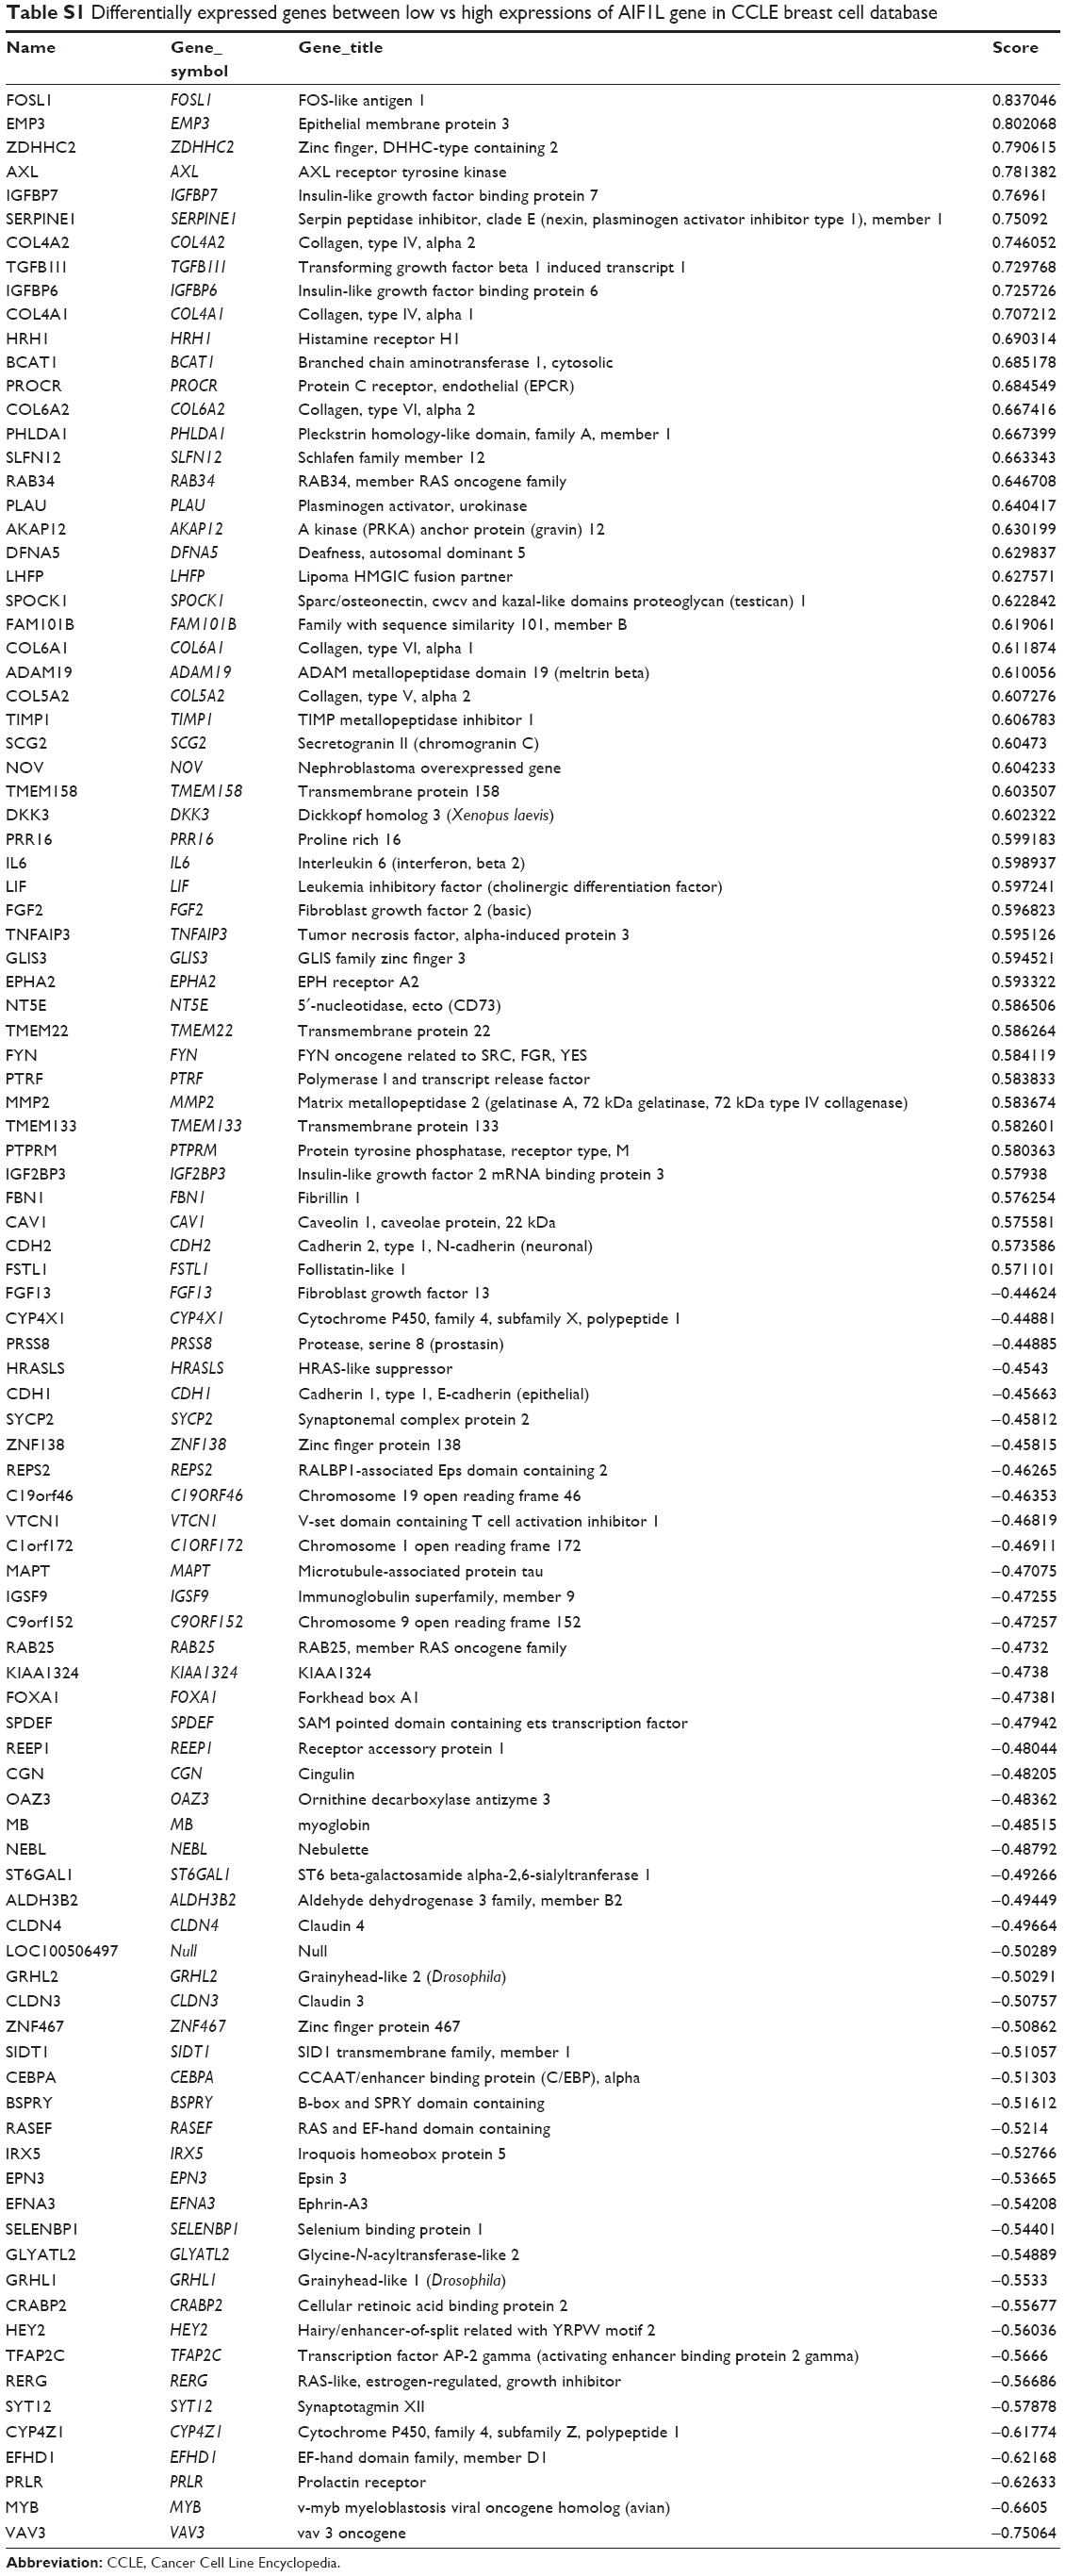 | Table S1 Differentially expressed genes between low vs high expressions of AIF1L gene in CCLE breast cell database |
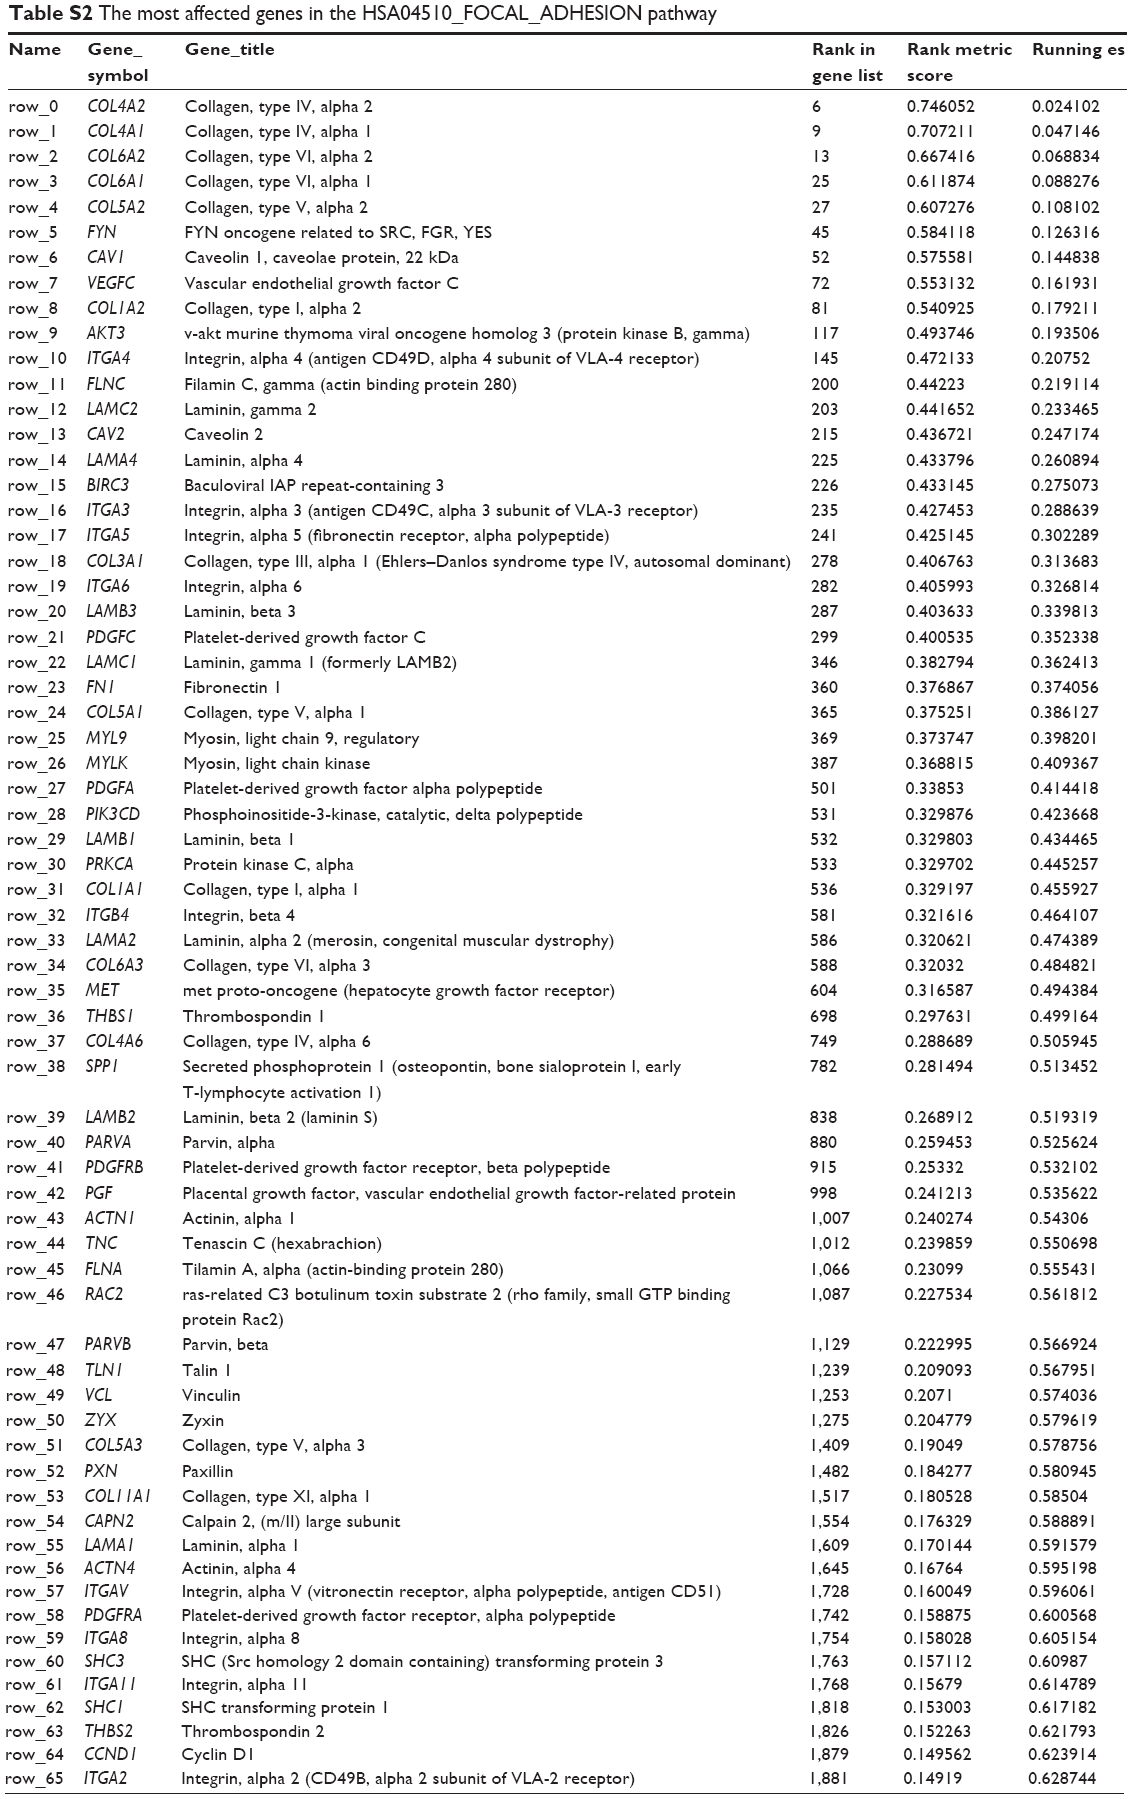 | Table S2 The most affected genes in the HSA04510_FOCAL_ADHESION pathway |
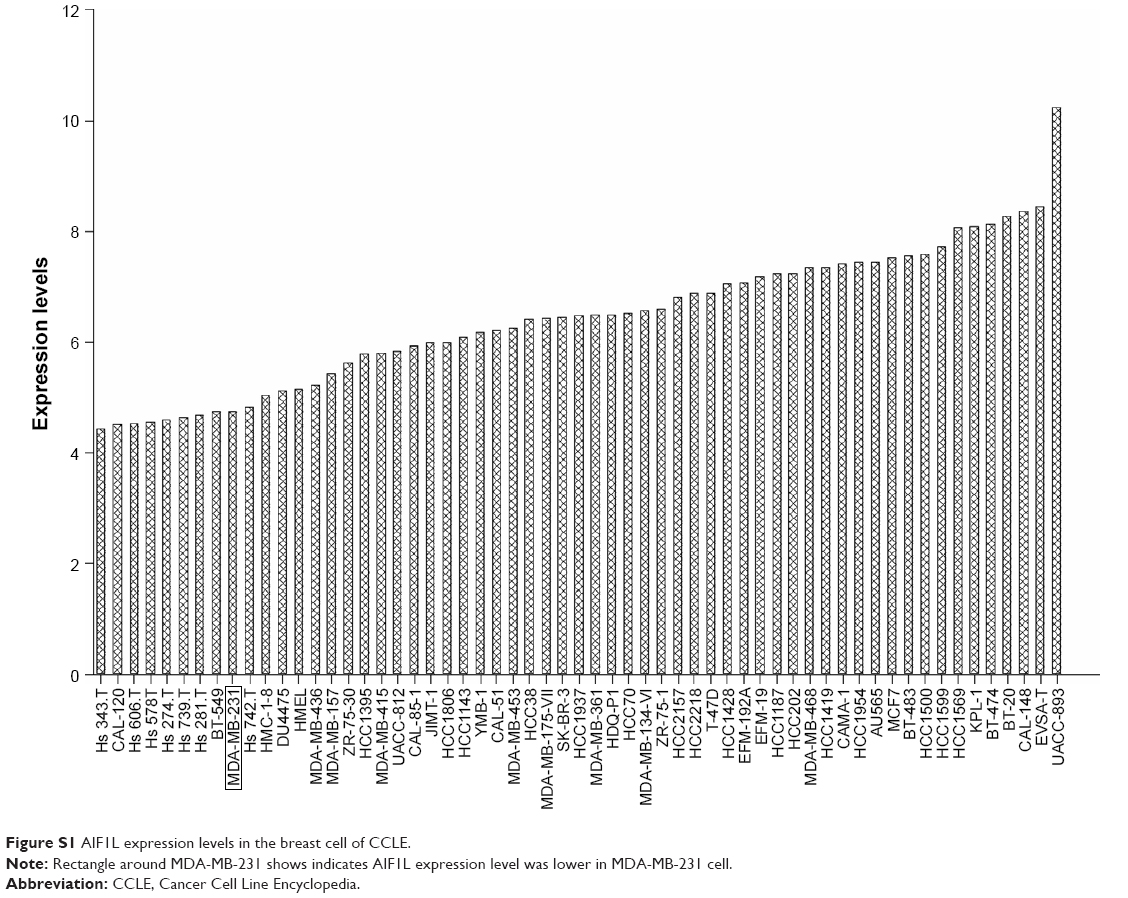 | Figure S1 AIF1L expression levels in the breast cell of CCLE. |
 © 2018 The Author(s). This work is published and licensed by Dove Medical Press Limited. The full terms of this license are available at https://www.dovepress.com/terms.php and incorporate the Creative Commons Attribution - Non Commercial (unported, v3.0) License.
By accessing the work you hereby accept the Terms. Non-commercial uses of the work are permitted without any further permission from Dove Medical Press Limited, provided the work is properly attributed. For permission for commercial use of this work, please see paragraphs 4.2 and 5 of our Terms.
© 2018 The Author(s). This work is published and licensed by Dove Medical Press Limited. The full terms of this license are available at https://www.dovepress.com/terms.php and incorporate the Creative Commons Attribution - Non Commercial (unported, v3.0) License.
By accessing the work you hereby accept the Terms. Non-commercial uses of the work are permitted without any further permission from Dove Medical Press Limited, provided the work is properly attributed. For permission for commercial use of this work, please see paragraphs 4.2 and 5 of our Terms.