")
Back to Journals » OncoTargets and Therapy » Volume 9
Abnormal expression of calcyphosine is associated with poor prognosis and cell biology function in colorectal cancer
Authors Shao W, Wang Q, Wang F, Jiang Y, Xu M, Xu J
Received 11 July 2015
Accepted for publication 9 December 2015
Published 25 January 2016 Volume 2016:9 Pages 477—487
DOI https://doi.org/10.2147/OTT.S92226
Checked for plagiarism Yes
Review by Single anonymous peer review
Peer reviewer comments 3
Editor who approved publication: Professor Daniele Santini
Weiwei Shao,* Quhui Wang,* Feiran Wang, Yasu Jiang, Meirong Xu, Junfei Xu
Department of General Surgery, Affiliated Hospital of Nantong University, Nantong, People’s Republic of China
*These authors contributed equally to this work
Abstract: The aim of this study was to investigate the calcyphosine (CAPS) expression in human colorectal cancer (CRC) and to explore its clinical and prognostic significances. CAPS expression was measured by Western blot, real-time polymerase chain reaction analysis, and immunohistochemistry. The relationships between the CAPS expression levels and the clinicopathological factors were investigated. The Kaplan–Meier method and log-rank test were used to investigate the overall survival of the patients. Moreover, the effects of CAPS on biological roles of CRC cells were also evaluated by MTT assay, colony formation assay, and transwell assay. CAPS was significantly overexpressed in cancerous tissue and CRC cell lines compared with adjacent nontumor tissue and a normal human intestinal epithelial cell line. Overexpression of CAPS was significantly associated with histological grade (P=0.004), invasive depth (P<0.001), lymph node metastasis (P=0.003), tumor node metastasis stage (P=0.017), and distant metastasis (P=0.042). Furthermore, silencing of CAPS expression in CRC cells inhibited their proliferation, colony formation, migration, and invasion. Kaplan–Meier survival analysis showed that high CAPS expression might demonstrate poor prognosis in CRC patients. Cox regression analysis revealed that CAPS expression was an independent prognostic factor of CRC. Our data suggested that the upregulation of CAPS might play a role in the carcinogenesis and progression of CRC. CAPS could be used as a potential diagnostic factor and be an independent good prognostic indicator for CRC patients.
Keywords: calcyphosine, colorectal cancer, prognosis
Introduction
Colorectal cancer (CRC) is the third most common malignancy and the fourth most common cause of cancer mortality worldwide, and more than one million new cases are diagnosed globally each year, which is a big threat to people’s health and lives.1 Despite the development of science and technology and much progress has been made in treating CRC, the overall long-term outcome of curatively resected patients has not significantly changed in recent years, and the 5-year survival rate is still poor.2 So far, the underlying molecular mechanism of development and progression of CRC is not elucidated; therefore, it is necessary to investigate and discover many novel biomarkers, which may provide new guidance for early diagnosis, treatment, and prognosis of CRC.
Calcyphosine (CAPS) is a calcium-binding protein that was initially identified in canine thyroid, and then was also isolated from human and some other mammals, such as rabbit, and even from some invertebrates such as sponge, but interestingly, it is absent in mouse and five other rodents.3 On the whole, CAPSs are divided into type-I CAPS, type-II CAPS, and CAPS 2. Among these subtypes, type-I CAPS is specific to the mammals, type-II widely exists in the metazoan species, and CAPS 2 is unique to human beings.4 CAPS is a calcium-binding protein whose synthesis and phosphorylation is upregulated by cAMP and thyrotropin in thyrocytes, which can facilitate cell proliferation and maintain the expression of the differentiated thyrocyte phenotype, and is downregulated by epidermal growth factor which represses cell differentiation.5 Similar to some other calcium-binding proteins, CAPS also has four EF-hand domains that can bind calcium.6 As a substrate, CAPS can be phosphorylated by protein kinase A.7 Although the exact function of CAPS is not understood, the calcium-binding property and phosphorylation characteristics of CAPS potentially allow it to integrate signals from both calcium and cAMP cascades.8 Previous studies have paid some attention, but not too much, to the relationship between CAPS and some diseases, including some carcinomas. For example, CAPS is overexpressed in ependymoma,9 lung cancer (LC),10 ovarian cancer,11 and endometrial cancer.12 Changes in CAPS in these carcinomas have been observed and attracted attention. Furthermore, we examined distribution of CAPS in tissues and found that it is expressed in many tissues except the prostate, spleen, and small intestine, but the expression level is higher in the colon, testis, lung, placenta, and brain.8
Until now, there has not been relative research reporting about CAPS in CRC. In this present study, to further investigate the relationship between CAPS and CRC, we studied and observed the expression of CAPS in human primary CRC tissues. In addition, we investigated its clinicopathologic significances and prognostic values in CRC. Furthermore, to explore its associated molecular mechanisms in CRC cells, we examined the effects and biological functions of downregulation of CAPS expression on cell proliferation, colony formation, migration, and invasion in vitro.
Materials and methods
Patients and tissue specimens
Paraffin-embedded samples and clinicopathological data were obtained from 105 patients who all underwent radical surgery at the General Surgery Department, Affiliated Hospital of Nantong University, from 2008 to 2009, which were retrospectively analyzed. All patients had not received preoperative chemotherapy, radiotherapy, or any other medical treatments. All the diagnosis conclusions were confirmed histologically. Moreover, fresh CRC tissues and adjacent nontumor tissue samples were obtained on the spot from 36 CRC patients who underwent surgical resection at the Affiliated Hospital of Nantong University between 2013 and 2014, and were freeze-conserved in liquid nitrogen. Fresh samples were immediately divided into two parts and stored at −80°C, one for real-time polymerase chain reaction and the other for Western blot analysis. After surgery, the follow-up clinicopathological data, including age, sex, tumor size, tumor node metastasis (TNM) stage, lymph node metastasis, invasive depth, and some other parameters, were also obtained. The tumor was staged as per the guidelines of the American Joint Committee on Cancer TNM staging system,13 and tumor grade adhered to the criteria of the World Health Organization classification. The institutional ethics committee of Nantong University approved our study, and written informed consent has been obtained from every patient before the study.
Immunohistochemistry
Immunohistochemical staining was performed on 4 μm thick sections. Tissues were paraffin-embedded and dewaxed in xylene, and dehydrated in graded alcohol. Endogenous peroxidase activity was blocked by 0.3% hydrogen peroxide for 10 minutes. Sections were processed in 10 mmol/L sodium citrate buffer (pH 6.0) and heated to 100°C for a quarter. After rinsing in phosphate-buffered saline twice for 5 minutes each time, 10% normal goat serum was applied to block nonspecific binding for an hour at room temperature. The sections were incubated at 4°C overnight with the rabbit monoclonal anti-CAPS antibody at a dilution of 1:200. After washing three times in phosphate-buffered saline for 3 minutes each time, the sections were incubated with biotin-labeled secondary antibody for an hour at room temperature. After three additional washes, peroxidase activity was visualized using diaminobenzidine. At last, the sections were counterstained with hematoxylin, dehydrated, cleared, and mounted.
The immunohistochemical staining results were independently evaluated by three observers, and similar results were obtained. The grade was designated according to the number of stained cells and the staining intensity of the individual cells. The staining intensity was scored as 0 (negative), 1 (weak), 2 (moderate), and 3 (strong). The percentage of positive stained cells was scored as follows: 0 (0%), 1 (1%–20%), 2 (21%–50%), and 3 (>50%). Multiplying every observer’s score, the total score was obtained, which theoretically ranged from 0 to 9. A total score of 0 was considered as negative (−), 1–3 was considered +, 4–6 as ++, and 7–9 as +++.
Quantitative real-time PCR
Total RNA was extracted from tissues lysate using a Trizol kit (Thermo Fisher Scientific, Waltham, MA, USA), and cDNA was subsequently synthesized from total RNA using an Omniscript RT kit (Qiagen, Hilden, Germany) following the supplier’s instructions. For detecting the mRNA level of CAPS, quantitative real-time reverse transcription-PCR (qRT-PCR) was conducted on the Mastercycler Ep Realplex (Eppendorf 2S; Eppendorf, Hamburg, Germany). A 25 μL reaction mixture contained 1 μL of cDNA from samples, 12 μL of 2× Fast EvaGreen™ qPCR Master Mix, 1 μL of primers (10 mM), and 10.5 μL of RNase/DNase-free water. PCR procedures were as follows: incubation at 96°C for 2 minutes, 40 cycles at 96°C for 15 seconds, and 60°C for 1 minute. The Ct value was defined as the cycle number at which the fluorescence intensity reached a certain threshold where amplification of each target gene was within the linear region of the reaction amplification curves. The relative expression level of each target gene was normalized by the Ct value of GAPDH (internal control) using a 2−ΔΔCt relative quantification method. The sequences of the primers used for CAPS were as follows: CAPS forward: 5′-AGGCACCTTCCACTAGCAACAG-3′; CAPS reverse: 5′-CCATGCTTGGTCTGGGCTCT-3′.
Western blot analysis
Matched cancer tissues and the adjacent nontumor tissues were treated with lysis buffer containing protease inhibitors (Promega, Fitchburg, WI, USA). The lysates were centrifuged at 12,000× g for 20 minutes at 4°C, and the supernatant was collected for determination of total protein concentration by detergent compatible-protein assay method (Bio-Rad, Hercules, CA, USA) to maintain the same loads. Equivalent amounts of proteins were separated by 10% sodium dodecyl sulfate polyacrylamide gel electrophoresis and then transferred to polyvinylidene difluoride filter membranes. After blocking with 5% nonfat milk in Tris-buffered saline with Tween 20 for 1 hour at room temperature, the membranes were incubated overnight with the primary monoclonal rabbit anti-human CAPS antibody (ab186741, 1:1,000; Abcam, Cambridge, UK) at 4°C. After washing three times in Tris-buffered saline with Tween 20, the membranes were incubated with secondary antibody, anti-goat IgG conjugated IRDye800 (1:5,000; Rockland, Gilbertsville, PA, USA), at room temperature for 2 hours, followed by scanning with an Odyssey infrared imaging system (LI-COR, Lincoln, NE, USA), and analyzed with PDQuest 7.2.0 software (Bio-Rad).
Cell culture and transfection
Human CRC cell strains of SW480, HCT116, HCT-8 and LoVo, and SW620 were purchased from a cell bank at the Chinese Academy of Sciences and grown in Dulbecco’s Modified Eagle’s Medium (DMEM) or Roswell Park Memorial Institute (RPMI)-1640 medium (Hyclone, Logan, UT, USA) supplemented with 10% fetal calf serum (Thermo Fisher Scientific). All cell lines were cultured at 37°C in a humidified atmosphere of 5% CO2. Transfection reagent Lipofectamine 3000 was purchased from Thermo Fisher Scientific. For knockdown of CAPS expression, small interfering RNA (siRNA) duplex oligonucleotides targeting CAPS mRNA (si-CAPS, RefSeq: NM_004058.3) were purchased from GenePharma (Shanghai, People’s Republic of China). The targeting sequences were: si-CAPS 1: 5′-GGACAACTTCGACTCCTCT-3′, si-CAPS 2: 5′-AGGTCACACTGGCGGAATT-3′, si-CAPS 3: 5′-GCGGAATTCCAGGACTACT-3′, and si-CAPS 4: 5′-CTGTCATCGCAGCTGCATT-3′; the target sequence for a negative control was: si-NC: 5′-CGUGGGUGGAUGCAUGGAUTT-3′. HCT-8 and SW480 cells were transfected with si-CAPS or si-NC according to the manufacturer’s instructions. Cells were collected after 48–72 hours for further experiments, and CAPS expression levels were examined via qRT-PCR. All human cell lines were cultured using protocols approved by the Ethics Committee of Affiliated Hospital of Nantong University.
Cell proliferation assay
To determine the effect of CAPS on cellular proliferation, a 3-(4,5-dimethylthiazol-2-yl)-2,5-diphenyltetrazolium bromide (MTT) assay was performed. A total of 1×10³ cells transfected with si-CAPS or si-NC were plated in each well of a 96-well plate containing 200 μL DMEM supplemented with 10% fetal bovine serum. After 1, 2, and 3 days of incubation, 20 μL MTT (5 mg/mL; Sigma-Aldrich, St Louis, MO, USA) was added, followed by 4-hour incubation at 37°C in a 5% CO2 incubator. The supernatant was removed, and 150 μL dimethyl sulfoxide was added. Culture plates were shaken for 10 minutes at room temperature to dissolve the MTT crystals. The absorbance values of each sample were read at 490 nm using a microplate reader (Model 550; Bio-Rad). Each experiment was repeated at least three times.
Cell migration and invasion assay
The cell migratory and invasion capacity was determined using transwell chambers (BD Biosciences, San Jose, CA, USA). Briefly, HCT-8 and SW480 cells were transfected with si-CAPS or si-NC. For the migration assays, cells (1×10⁵/well) were suspended in 100 μL serum-free medium and then added to the upper chamber of the inserts. For the invasion assays, cells were added into the upper chamber of the insert precoated with Matrigel (BD Biosciences). DMEM (Thermo Fisher Scientific) containing 10% fetal bovine serum (500 μL) was added to the lower chamber as the chemotactic factor. After culturing for 48 hours, non-migrated or non-invaded cells on the upper surface were gently removed with a cotton swab, and cells that migrated or invaded to the lower side of the department were fixed and dyed with 0.1% crystal violet. The numbers of migrated or invaded cells were calculated by counting five different views under the microscope. The experiment was performed in triplicate and repeated for three times.
Colony formation assay
To measure the proliferative ability of HCT-8 and SW480 cell lines in vitro, plate colony formation assays were performed. For the plate colony formation assay, 500 cells were seeded into a six-well plate and cultured in DMEM for 3 weeks at 37°C in 5% CO2 to allow colony formation. The colonies were then fixed in 70% ethanol, stained with Giemsa solution, and counted. Each assay was performed in triplicate.
Statistical analysis
The data were analyzed by SPSS 17.0 software (SPSS Inc., Chicago, IL, USA). The χ2-test was used to analyze the data differences between groups. Survival was calculated using the Kaplan–Meier method, and evaluated by the log-rank test. Multivariate analysis was performed using Cox’s regression model. The results were expressed as the mean ± standard deviation. P<0.05 was considered statistically significant.
Results
Expression of CAPS was upregulated in CRC tissues
To investigate whether CAPS might be involved in colorectal carcinogenesis, the expression levels of CAPS in CRC tissues and matched adjacent nontumor tissues were measured by immunohistochemistry staining. Immunostaining of CAPS was detected in the cytoplasm. On the whole, we found that CAPS protein was expressed at various levels in CRC tissues and the adjacent nontumor tissues (Figure 1). Among the 105 CRC samples, 63 cases showed high CAPS expression (CAPS++ or CAPS+++), whereas the remaining 42 cases displayed low CAPS expression (CAPS− or CAPS+) (Table 1). In summary, the poorly differentiated CRC tissues exhibited the strongest CAPS positive staining, while the adjacent nontumor tissues showed the CAPS negative staining (Figure 1).
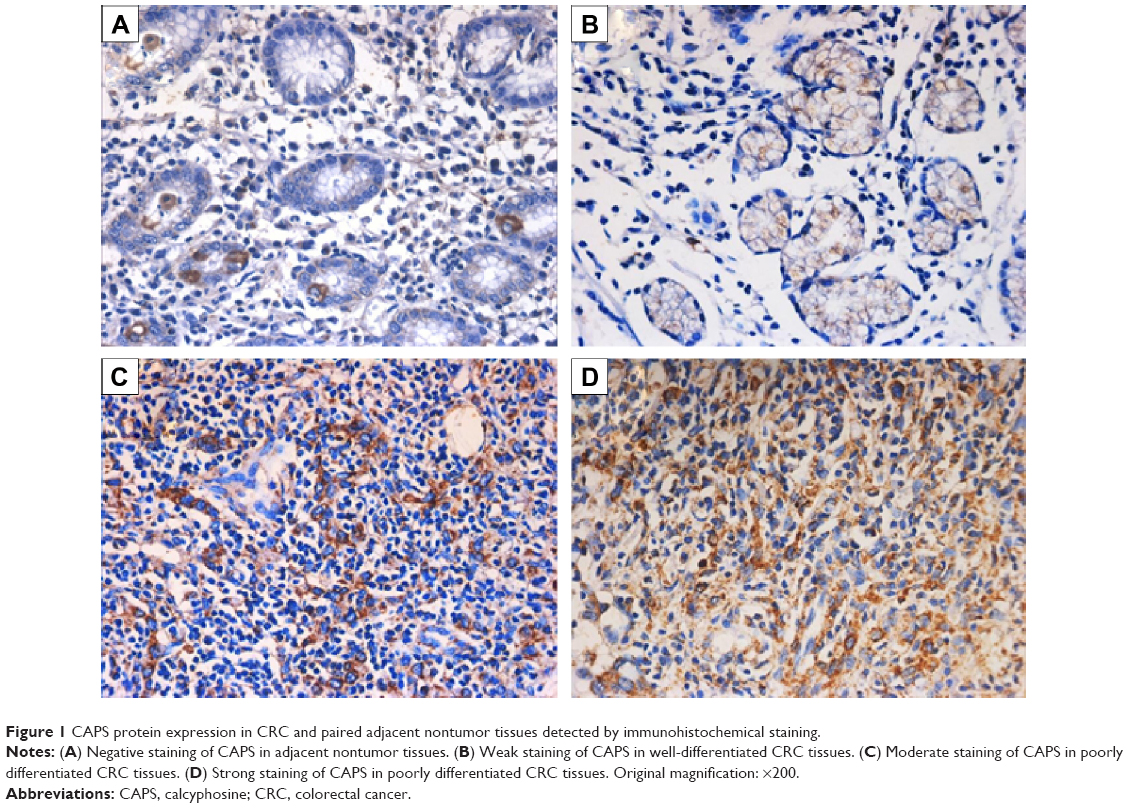 | Figure 1 CAPS protein expression in CRC and paired adjacent nontumor tissues detected by immunohistochemical staining. |
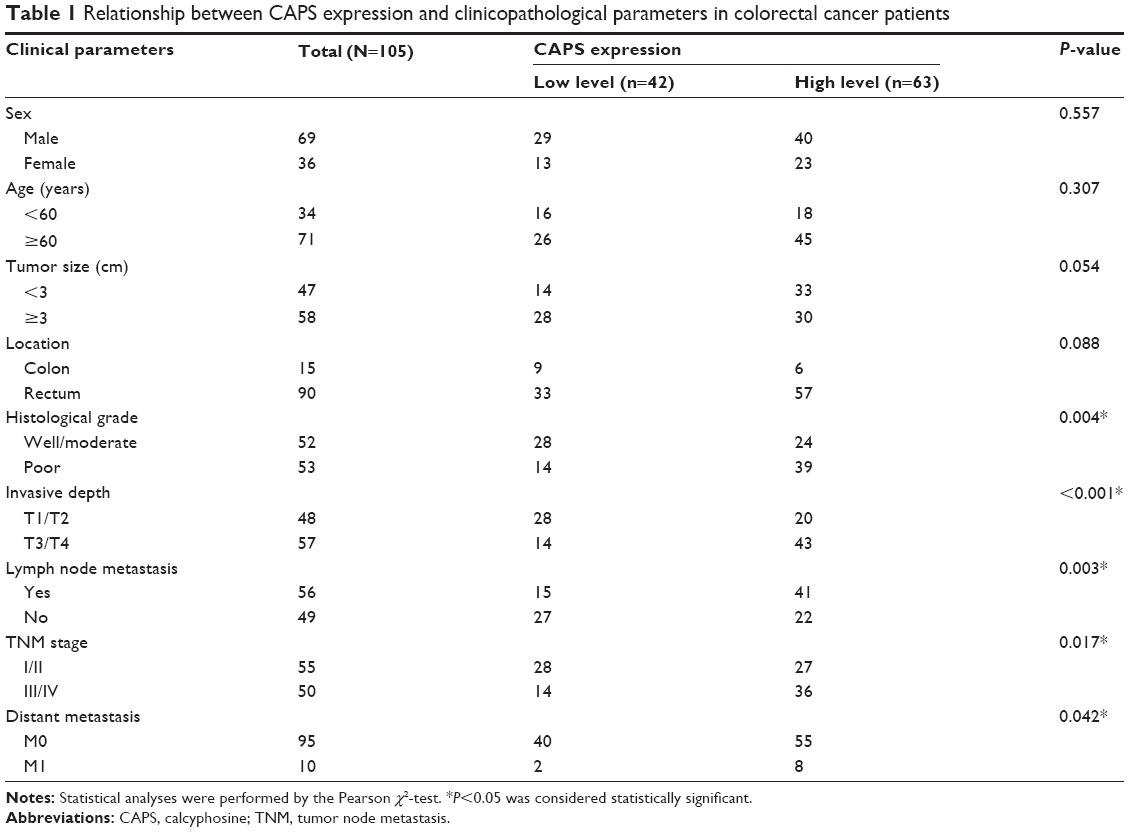 | Table 1 Relationship between CAPS expression and clinicopathological parameters in colorectal cancer patients |
The protein and mRNA levels of CAPS in these tissue samples were also analyzed by Western blot and qRT-PCR, respectively. Western blot analysis showed overexpression of CAPS in 16 out of 20 CRC tissues compared with the corresponding adjacent nontumor tissues. Among these results, four cases were shown as a representative in Figure 2A. β-Actin was used as a loading control. The average CAPS protein expression level in 20 CRC tissues was significantly higher than that in adjacent normal tissues (Figure 2B), and the difference was of statistical significance (P=0.0049). Consistent with the earlier results, the level of CAPS mRNA was upregulated in 24 out of 36 CRC tissues compared with the adjacent nontumor tissues (P=0.0011; Figure 2C). Moreover, we evaluated the protein expression levels of CAPS in the five CRC cell lines by Western blot. As shown in Figure 3A and B, the expression level of CAPS protein in HCT-8 and SW480 cell lines was higher than that in other CRC cell lines as evaluated by Western blot assay. Then, HCT-8 and SW480 cells were transfected with si-CAPS or si-NC. After transfection for 48 hours, si-CAPS 3 was effectively silenced in SW480 cells using Western blot (Figure 3C and D).
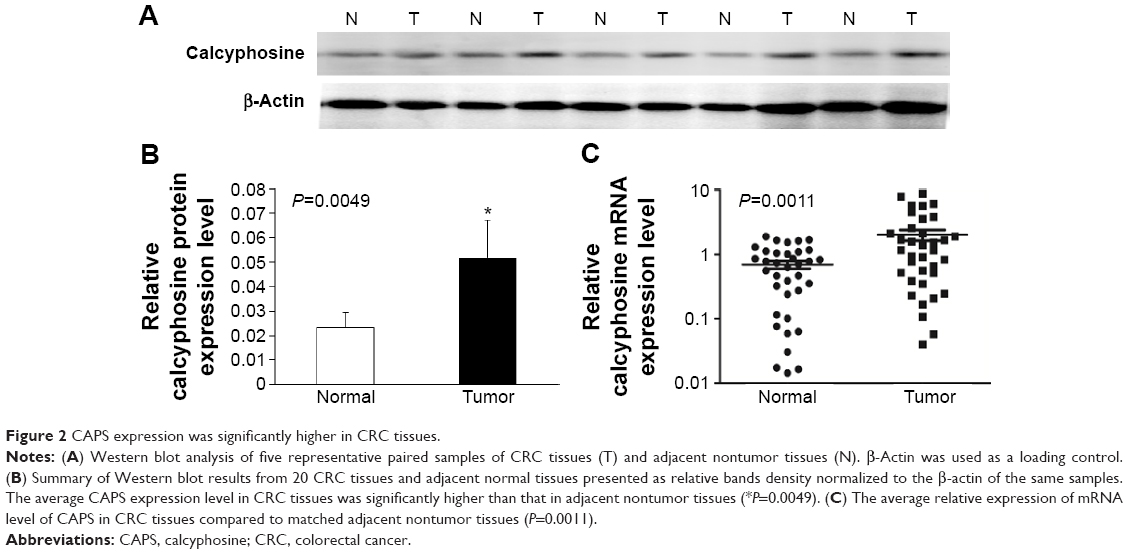 | Figure 2 CAPS expression was significantly higher in CRC tissues. |
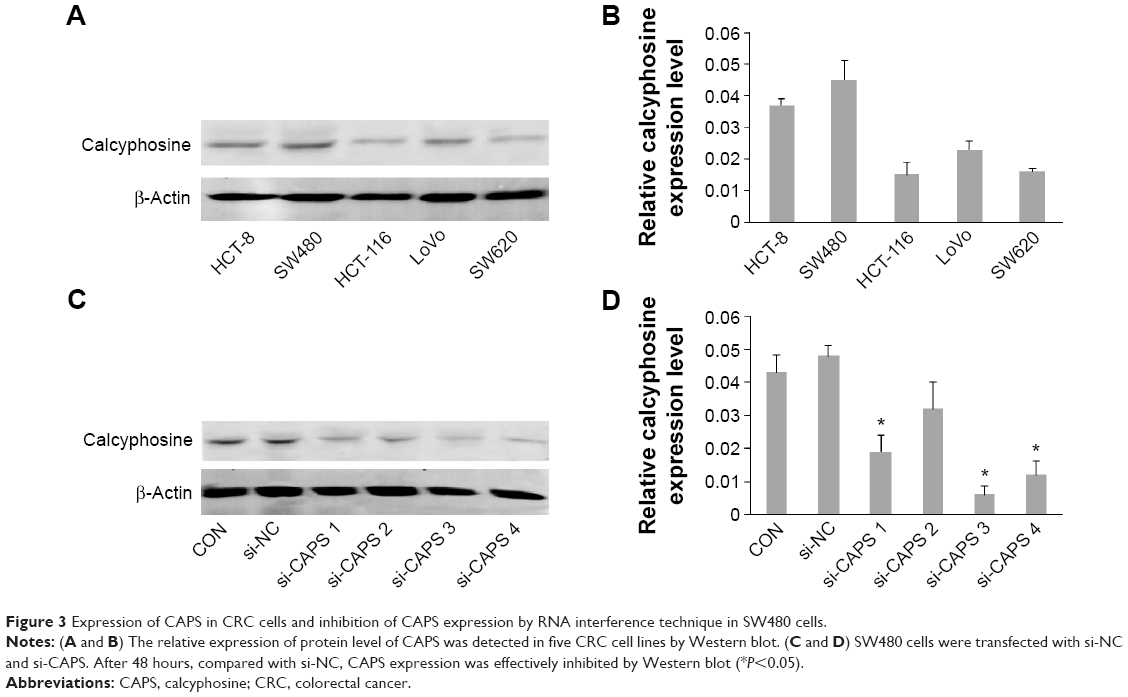 | Figure 3 Expression of CAPS in CRC cells and inhibition of CAPS expression by RNA interference technique in SW480 cells. |
Correlation of CAPS expression with clinicopathologic parameters and clinical prognostic value in CRC
To get more information of the clinical relevance of CAPS, we researched the relationship between the expression of CAPS and some clinicopathologic parameters in the CRC samples. The relevant parameters are listed in Table 1. Using χ2-test, we found that CAPS overexpression was significantly associated with histological grade (P=0.004), invasive depth (P<0.001), lymph node metastasis (P=0.003), TNM stage (P=0.017), and distant metastasis (P=0.042). However, no statistical association was found between CAPS expression and sex, age, tumor location, and tumor size (P>0.05). Furthermore, multivariate analysis using the Cox proportional hazards model for all of the significant covariates in the univariate analysis showed that CAPS expression (P=0.005), TNM stage (P<0.001), lymph node metastasis (P=0.026), distant metastasis (P=0.048), and histological grade (P=0.027) were independent prognostic factors for CRC patients (Table 2).
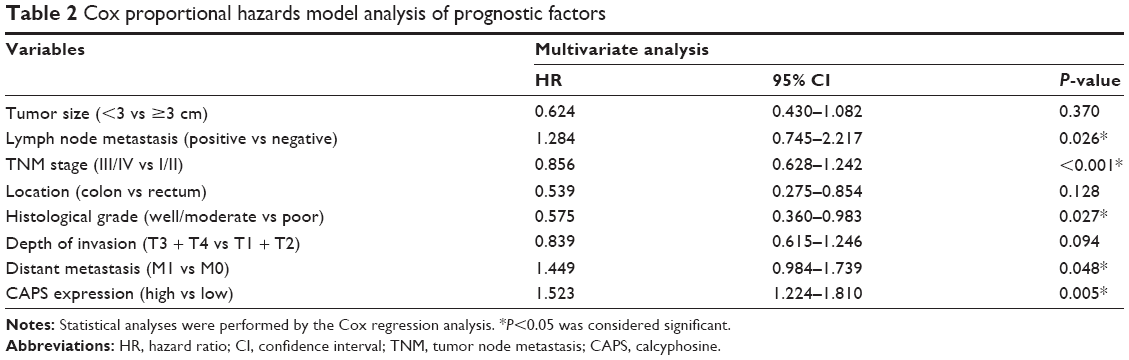 | Table 2 Cox proportional hazards model analysis of prognostic factors |
To explore whether CAPS expression was associated with prognosis in CRC patients, we investigated the overall survival and the 5-year survival rate of the patients by collecting the follow-up data. Kaplan–Meier analysis and log-rank test were employed to investigate the prognostic role of CAPS in CRC patients. Based on the immunohistochemical results, the patients were divided into two groups: CAPS low-level expression group (− to +) and CAPS high-level expression group (++ to +++). The Kaplan–Meier analysis and log-rank test showed that patients with low CAPS expression survived longer than those with high CAPS expression (P<0.001; Figure 4). These data demonstrated that the upregulation of CAPS might be relevant to development of CRC.
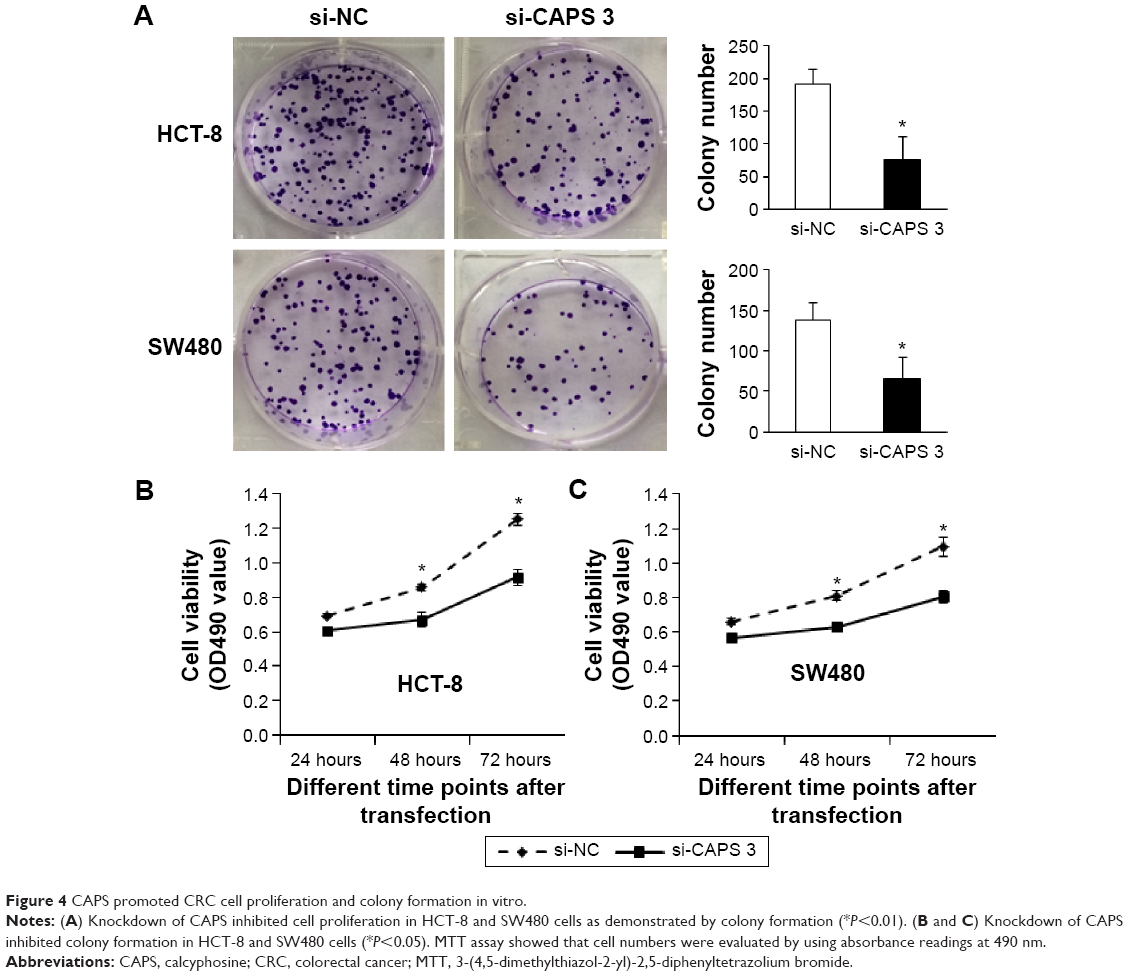 | Figure 4 CAPS promoted CRC cell proliferation and colony formation in vitro. |
Knockdown of CAPS inhibits migration and invasion of CRC cells
As the interference effect of si-CAPS 3 is strongest, knockdown of CAPS by si-CAPS 3 significantly lowered protein level in HCT-8 and SW480 cells as evaluated by Western blot (Figure 5A and B). Moreover, we sought to determine whether CAPS knockdown affected cell migration and invasion by transwell assays. Migration and invasion assays were used to further evaluate this effect of CAPS knockdown on migration and invasion of CRC cells. The results revealed that the migration and invasion abilities of HCT-8 and SW480 cells transfected with si-CAPS 3 were markedly reduced compared with si-NC (P<0.05; Figure 5C and D). These findings indicated that CAPS inhibition might be closely associated with migration and invasion of CRC cells.
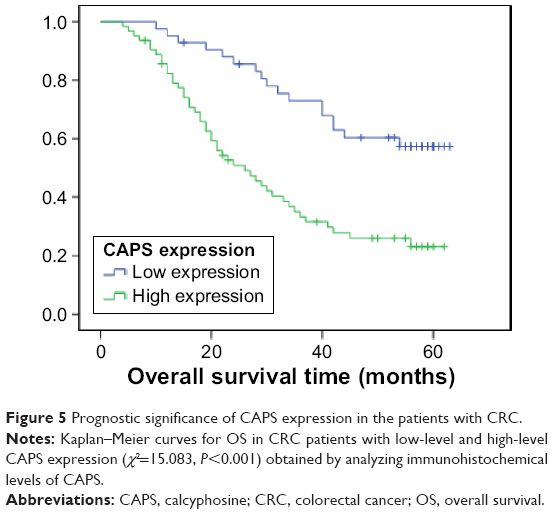 | Figure 5 Prognostic significance of CAPS expression in the patients with CRC. |
Downregulation of CAPS can inhibit CRC cells proliferation and colony formation
We determined whether CAPS could affect the cell proliferation and colony formation. The proliferation ability of HCT-8 and SW480 cells was examined after being transfected with si-CAPS 3. Cell proliferation ability in si-CAPS 3 group was significantly decreased compared with si-NC (P<0.05; Figure 6B). Consistently, plate colony formation assays were used to determine whether the downregulation of CAPS inhibited HCT-8 and SW480 cells, growth. A significant reduction in colony numbers was observed in HCT-8 and SW480 transfected with si-CAPS group, compared with control cells in plate assays (P<0.01; Figure 6A), which demonstrated that downregulation of CAPS can suppress the proliferative ability of CRC cells in vitro.
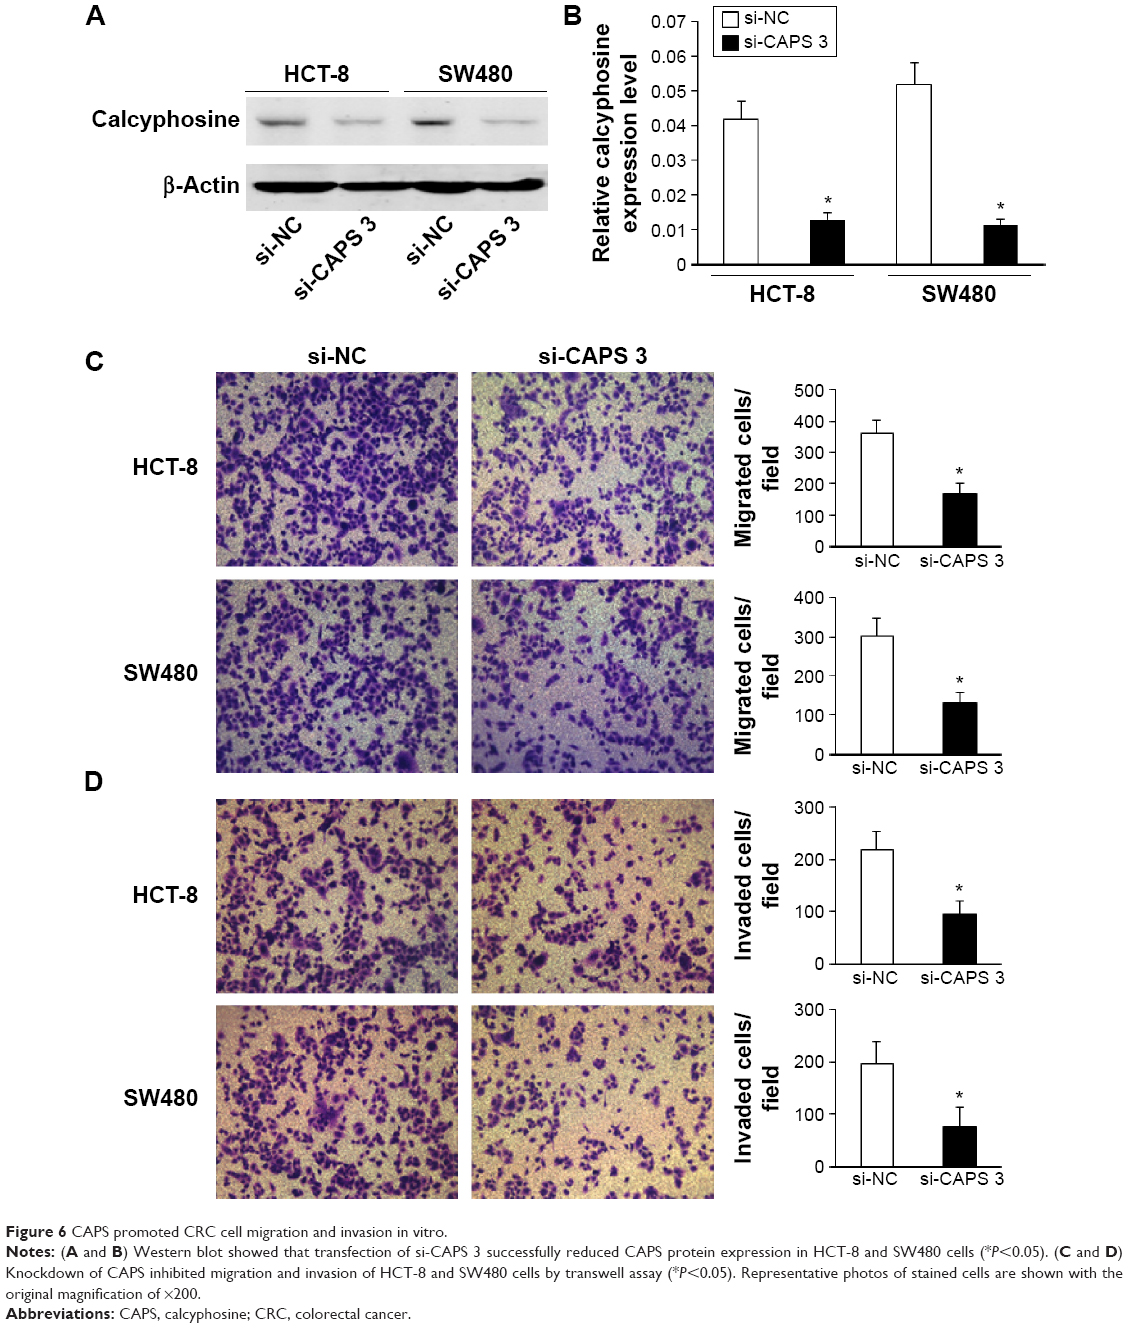 | Figure 6 CAPS promoted CRC cell migration and invasion in vitro. |
Discussion
In recent years, CRC has become a tremendous threat to the human’s health and life, among the malignant tumors. Despite advances in surgical techniques, neoadjuvant chemotherapy, and other medical approaches, the prognosis remains unsatisfactory.14 The pathogenesis and progression of CRC is a course in which multifactors are involved. Nowadays, with the development of medical technology, novel biomarkers of CRC are required for early diagnosis, targeted therapy, and prediction of prognosis. For a better therapeutic intervention to the CRC patients, new tumor prognostic markers and targeted therapies have become hot topics in current research. In this study, we found that the expression of CAPS in CRC patient specimens is closely associated with clinicopathological significances, and also that CAPS is a novel oncogene in CRC.
Over these years, CAPS, initially identified as a major phosphorylated substrate for cAMP-dependent protein kinase A after stimulation of thyroid cells by thyrotropin, has been put into deeper research.7 Some antiallergic drugs were found to bind to CAPS with high affinity in bovine lung, which was considered to show its potential antiallergic property.15 It has been proved that CAPS distributes in many tissues, such as thyroid, pancreas, nervous system, genital tract, and digestive tract.8 A previous study has reported that CAPS was significantly overexpressed in ependymoma.9 Its positivity was not related to histologic grading or localization in pediatric ependymoma but is predominantly shown in tumors with epithelial differentiation. So, CAPS might be a marker of a new subgroup of ependymoma and potential drug targets in pediatric brain tumors. In a study about COPD and LC, CAPS was upregulated in LC and LC with COPD groups as compared to the control group, so it could be used as a marker for early diagnosis of LC.10 A research in ovarian adenocarcinoma found that CAPS gene was more expressed in tumors of the subgroup of survivors with favorable tumor biology and sensitivity to treatment than in the remaining group.11 Another study says that CAPS gene was overexpressed in borderline ovarian cancer than in high-grade ovarian cancer, but interestingly, CAPS gene was also overexpressed in cancer subset relative to normal ovarian tissues.16 Thus, CAPS gene might be helpful to further classify subtypes of ovarian carcinoma and a potential marker and target for therapy. In the present study, we found that the expression of CAPS was significantly upregulated at both mRNA and protein levels in CRC in most tumor tissue samples compared to matched adjacent nontumor tissue samples. Besides, the activities of CAPS in cAMP signaling and cell proliferation and differentiation suggest that it might be involved in an important aspect of carcinogenesis.3 Consistent with these findings, in this study, we observed that siRNA knockdown of CAPS suppressed proliferation, colony formation, migration, and invasion of CRC cells.
Clinicopathological studies demonstrated that CAPS expression in endometrial carcinoma was higher than that in normal endometrium tissues and endometrial intraepithelial neoplasia tissues. Its expression level was shown to be correlated to histodifferentiation. Survival analysis indicated that CAPS might be an independent prognostic factor for endometrial carcinoma patients.12,17 In the present study, we examined CAPS expression status by immunohistochemical staining in a series of CRC tissues. Similar to the previous study, we also found that CAPS expression was correlated to the histodifferentiation of CRC tissues. As the differentiation got poorer, CAPS had a higher expression level in CRC tissues. When we investigated the correlation between CAPS expression and other clinicopathological parameters, we found that CAPS expression was significantly associated with histological grade, invasive depth, lymph node metastasis, TNM stage, and distant metastasis, but no statistical association was found between CAPS expression and age, sex, tumor size, and tumor location. Therefore, CAPS might be a potential diagnostic tumor-specific marker for CRC, and changed CAPS expression level might indicate the progression of the disease. Furthermore, in the Kaplan–Meier survival analysis and log-rank test, the overall survival of CAPS high-level expression group is significantly shorter than that of CAPS low-level expression group, which showed that a higher CAPS expression level was significantly associated with poor prognosis of CRC. In other words, CAPS might play a role in promoting the progression of CRC. Additionally, multivariate analysis using Cox proportional hazard model indicated that CAPS was independently statistically significant as a prognostic factor in survival of cancer patients.17
In recent years, CAPS has been confirmed to be involved in several cancer types. Despite all the previous reports, the mechanism of action and the exact functions of CAPS have not been clearly revealed. Therefore, further studies are needed to elucidate the functions and the mechanism of CAPS in CRC and other diseases.
Conclusion
The study demonstrated that CAPS was upregulated in CRC tissues compared with the adjacent normal tissues, and a higher CAPS expression level might indicate cancer progression. The overall survival of low CAPS expression group was significantly longer than that of high CAPS expression group. Moreover, CAPS might be an independent prognostic indicator of CRC. In summary, RNA interference-mediated CAPS gene silencing might play a role in the carcinogenesis and progression of CRC. CAPS may play a role in the diagnosis and prognosis, and meanwhile, it may be a potential diagnostic factor of CRC.
Acknowledgment
The research was supported by the National Natural Science Foundation of China (No 30771126).
Disclosure
The authors report no conflicts of interest in this work.
References
Tenesa A, Dunlop MG. New insights into the aetiology of colorectal cancer from genome-wide association studies. Nature Reviews Genetics. 2009;10:353–358. | ||
Moghimi-Dehkordi B, Safaee A. An overview of colorectal cancer survival rates and prognosis in Asia. World Journal of Gastrointestinal Oncology. 2012;4:71. | ||
Clement S, Dumont JE, Schurmans S. Loss of calcyphosine gene expression in mouse and other rodents. Biochemical and Biophysical Research Communications. 1997;232:407–413. | ||
Yuasa HJ, Nakatomi A, Suzuki T, Yazawa M. Genomic structure of the sponge, Halichondria okadai calcyphosine gene. Gene. 2002;298:21–27. | ||
Lecocq R, Lamy F, Dumont JE. Use of two-dimensional gel electrophoresis and autoradiography as a tool in cell biology: the example of the thyroid and the liver. Electrophoresis. 1990;11:200–212. | ||
Dong H, Li X, Lou Z, et al. Crystal-structure and biochemical characterization of recombinant human calcyphosine delineates a novel EF-hand-containing protein family. Journal of Molecular Biology. 2008;383:455–464. | ||
Lecocq R, Lamy F, Erneux C, Dumont JE. Rapid purification and identification of calcyphosine, a Ca(2+)-binding protein phosphorylated by protein kinase A. The Biochemical Journal. 1995;306(Pt 1): 147–151. | ||
Wang S, Chen JZ, Zhang Z, et al. Cloning, characterization, and expression of calcyphosine 2, a novel human gene encoding an EF-hand Ca(2+)-binding protein. Biochemical and Biophysical Research Communications. 2002;291:414–420. | ||
de Bont JM, den Boer ML, Kros JM, et al. Identification of novel biomarkers in pediatric primitive neuroectodermal tumors and ependymomas by proteome-wide analysis. Journal of Neuropathology and Experimental Neurology. 2007;66:505–516. | ||
Pastor MD, Nogal A, Molina-Pinelo S, et al. Identification of proteomic signatures associated with lung cancer and COPD. Journal of Proteomics. 2013;89:227–237. | ||
Partheen K, Levan K, Osterberg L, Horvath G. Expression analysis of stage III serous ovarian adenocarcinoma distinguishes a sub-group of survivors. European Journal of Cancer. 2006;42:2846–2854. | ||
Li Z, Min W, Huang C, Bai S, Tang M, Zhao X. Proteomics-based approach identified differentially expressed proteins with potential roles in endometrial carcinoma. International Journal of Gynecological Cancer. 2010;20:9–15. | ||
Edge SB, Compton CC. The American Joint Committee on Cancer: the 7th edition of the AJCC cancer staging manual and the future of TNM. Annals of Surgical Oncology. 2010;17:1471–1474. | ||
Popa F, Bratucu M, Radu P. Present and future tense in operable rectal cancer. Chirurgia. 2011;106:11–16. | ||
Oyama Y, Shishibori T, Yamashita K, et al. Two distinct anti-allergic drugs, amlexanox and cromolyn, bind to the same kinds of calcium binding proteins, except calmodulin, in bovine lung extract. Biochemical and Biophysical Research Communications. 1997;240:341–347. | ||
Skubitz AP, Pambuccian SE, Argenta PA, Skubitz KM. Differential gene expression identifies subgroups of ovarian carcinoma. Translational Research. 2006;148:223–248. | ||
Li Z, Huang C, Bai S, et al. Prognostic evaluation of epidermal fatty acid-binding protein and calcyphosine, two proteins implicated in endometrial cancer using a proteomic approach. International Journal of Cancer. 2008;123:2377–2383. |
 © 2016 The Author(s). This work is published and licensed by Dove Medical Press Limited. The full terms of this license are available at https://www.dovepress.com/terms.php and incorporate the Creative Commons Attribution - Non Commercial (unported, v3.0) License.
By accessing the work you hereby accept the Terms. Non-commercial uses of the work are permitted without any further permission from Dove Medical Press Limited, provided the work is properly attributed. For permission for commercial use of this work, please see paragraphs 4.2 and 5 of our Terms.
© 2016 The Author(s). This work is published and licensed by Dove Medical Press Limited. The full terms of this license are available at https://www.dovepress.com/terms.php and incorporate the Creative Commons Attribution - Non Commercial (unported, v3.0) License.
By accessing the work you hereby accept the Terms. Non-commercial uses of the work are permitted without any further permission from Dove Medical Press Limited, provided the work is properly attributed. For permission for commercial use of this work, please see paragraphs 4.2 and 5 of our Terms.