")
Back to Journals » Cancer Management and Research » Volume 12
Aberrant Expression of NCAPG is Associated with Prognosis and Progression of Gastric Cancer
Authors Sun DP, Lin CC, Hung ST, Kuang YY, Hseu YC, Fang CL, Lin KY
Received 10 February 2020
Accepted for publication 5 August 2020
Published 25 August 2020 Volume 2020:12 Pages 7837—7846
DOI https://doi.org/10.2147/CMAR.S248318
Checked for plagiarism Yes
Review by Single anonymous peer review
Peer reviewer comments 2
Editor who approved publication: Dr Beicheng Sun
Ding-Ping Sun,1,2 Chih-Chan Lin,3 Shih-Ting Hung,3 Yi-Yu Kuang,3 You-Cheng Hseu,4– 6 Chia-Lang Fang,7,8 Kai-Yuan Lin3,9
1Department of Surgery, Chi Mei Medical Center, Tainan, Taiwan; 2Department of Food Science and Technology, Chia Nan University of Pharmacy and Science, Tainan, Taiwan; 3Department of Medical Research, Chi Mei Medical Center, Tainan, Taiwan; 4Department of Cosmeceutics, China Medical University, Taichung, Taiwan; 5Department of Health and Nutrition Biotechnology, Asia University, Taichung, Taiwan; 6Chinese Medicine Research Center, China Medical University, Taichung, Taiwan; 7Department of Pathology, School of Medicine, College of Medicine, Taipei Medical University, Taipei, Taiwan; 8Department of Pathology, Taipei Medical University Hospital, Taipei Medical University, Taipei, Taiwan; 9Department of Biotechnology, Chia Nan University of Pharmacy and Science, Tainan, Taiwan
Correspondence: Kai-Yuan Lin; Chia-Lang Fang Tel +886-6-281-2811
; +886-2-27361661
Fax +886-6-2832639
; +886-2-23770054
Email [email protected]; [email protected]
Introduction: Gastric cancer (GC), one of the most prevalent malignancies, is the third-leading cause of cancer-related deaths globally. The aim of this study is to investigate the involvement of non-structural maintenance of chromosomes condensin I complex subunit G (NCAPG) in the prognosis of GC.
Methods: Western blotting and immunostaining were employed to measure the NCAPG level in gastric tissues and cells. Kaplan–Meier analysis was applied to analyze the prognostic value of NCAPG in GC. RNA interference was applied to investigate the influence of the NCAPG silencing on GC cell growth and spread.
Results: NCAPG overexpression was associated with several clinicopathologic characteristics, including nodal status (P = 0.0378), distant metastasis (P = 0.0088), staging (P = 0.0230), vascular invasion (P = 0.0012), and disease-free survival (P = 0.004). Kaplan–Meier analysis revealed that NCAPG overexpression was positively correlated to poor GC patients disease-free and overall survival (P = 0.004 and P < 0.001, respectively). Univariate Cox regression analysis showed that the overexpression of NCAPG was a prognostic biomarker of GC (P = 0.005). In cultured GC cells, the knockdown of NCAPG suppressed cell proliferation, migration and invasion. Meanwhile, further studies revealed that the NCAPG silencing induces the G0/G1 cell cycle arrest and accordingly represses cell division. Finally, Western blotting showed that NCPAG knockdown dysregulated cell cycle- and epithelial–mesenchymal transition-related molecules.
Conclusion: Overall, the results reveal that NCAPG overexpression is a candidate prognostic biomarker and potential therapeutic target in GC.
Keywords: NCAPG, gastric cancer, prognosis, proliferation, invasion
Introduction
Gastric cancer (GC) ranks the third cause of mortality related to cancer.1 Although the survival rate of GC has improved, the prognosis of GC is still poor. A 2019 government report showed that, in Taiwan, an estimated 3600 patients were diagnosed with GC in 2016, resulting in more than 2000 deaths. Because the underlying pathogenic mechanisms of GC are still illusive, and then few targeted drugs are developed, the treatment of patients with GC remains an extremely challenging task in clinical practice.2,3 Improvements in molecular techniques make it possible to find the dysregulated expression of molecules, which are involved in GC progression, as novel biomarkers, although the molecular carcinogenesis of GC is not fully understood.4 Several aberrantly expressed molecules could be used as prognostic biomarkers, such as CERS6, USP3, TMPO-α, Notch1 and ATAD2.5–9
During cell division, the chromatins are reorganized into mitotic chromosomes to make sure that the sister chromosomes segregate adequately. The condensin complexes are considered to be critical factors involved in the condensation of chromatins.10–13 Both condensin I and II complexes, two types of condensing complexes existed in eukaryotic cells, have non-structural maintenance of chromosomes (non-SMC) regulatory subunits. The non-SMC subunits are thought to control the DNA supercoiling and chromosome separation.13–16 Several non-SMC subunits are presented in condensing I complex, including non-SMC condensin I complex subunit G (NCAPG).17 Previous studies have reported the function of NCAPG in the stabilization and condensation of chromosomes when cells divide.18–20 Overexpression of NCAPG was found in different cancers, including renal cell carcinoma, prostate cancer, and hepatocellular carcinoma.21–23 Studies of NCAPG as a prognosticator are limited. NCAPG overexpression in renal cell carcinoma showed worse overall- and recurrence-free survival.21 Furthermore, according to a study performed by Arai et al, overexpression of NCAPG in prostate cancer was negatively correlated with disease-free survival.22 Liu et al demonstrated that high expression of NCAPG in hepatocellular carcinoma significantly predicted poor prognosis.23 To our knowledge, the prognostic impact of NCAPG in GC is still unknown.
Few studies are conducted to investigate the function of NCAPG in cancer. It was found that the NCAPG protein levels were higher in hepatocellular carcinoma cells than in normal liver cells. The knockdown of NCAPG caused tumor cell S phase cell cycle arrest.23 Similar results, presented by Gong et al, indicated a role for NCAPG in accelerating hepatocellular carcinoma cell growth and suppressing apoptosis through the PI3K/AKT pathway.24 Despite these studies, the underlying mechanism remains unclear.
Here, we examine the NCAPG level in GC and analyze the correlation of NCAPG with clinicopathologic characteristics and patient survival. We also study the effect of NCAPG knockdown on cell growth and spread.
Materials and Methods
Study Subjects
Gastric tissue specimens were collected from 135 GC patients who underwent surgical resection at Taipei Medical University Wan Fang Hospital between 1998 and 2011 for this study. Cancerous and precancerous gastric tissues were measured for NCAPG level. This study was approved by the institutional review board of Taipei Medical University Wan Fang Hospital (Approval No. 99049) and each patient provided written informed consent in advance.
Cell Culture
The human normal gastric cell line (Hs738.St/Int) was purchased from the American Type Culture Collection (Manassas, VA, USA). GC cell lines (AGS, NCI-N87, TMC-1, and TSGH 9201) were obtained from the Bioresource Collection and Research Center (Hsinchu, Taiwan). GC cell lines (SK-GT-2 and HGC-27) were purchased from the European Collection of Cell Cultures (Salisbury, UK). The GC cell line (23132/87) was obtained from Creative Bioarray (Shirley, NY, USA). Cells were cultured in DMEM (Hs738.St/Int), F-12K (AGS), RPMI-1640 (NCI-N87, TMC-1, TSGH 9201, SK-GT-2, or 23132/87), MEM (HGC-27) media supplemented with 10% fetal bovine serum, 100 U/mL penicillin G, 100 μg/mL streptomycin sulfate, and 250 ng/mL amphotericin B.
Protein Preparation and Western Blotting5,6
Cells and tissues were lysed with RIPA Buffer (Thermo). Denatured proteins were separated on 10% SDS-PAGE and transferred onto nitrocellulose membranes. Blocked membranes were probed with anti-NCAPG antibody at 4°C overnight (LifeSpan, Seattle, WA, USA). They were then reacted with peroxidase-conjugated secondary antibodies (Sigma) before being developed using enhanced chemiluminescence reagents (Thermo). Images were processed using GeneTools software (Syngene, Cambridge, UK). Protein intensities were normalized to β-actin expression.
Immunostaining5,6
Paraffin-embedded specimens were incubated with an anti-NCAPG antibody at room temperature for 45 min. A standard peroxidase-conjugated streptavidin-biotin method was used to detect immunoreactivity (Dako REAL EnVision Detection System, Dako, Carpinteria, CA, USA). Semiquantitative analysis was applied to assess NCAPG immunoreactivity. NCAPG immunoreactivity was defined as follows: sections without labeling were scored as 0; sections with <25% of labeled tissue were scored as 1; sections with 25–50% of labeled tissue were scored as 2; and sections with >50% of labeled tissue were scored as 3. Score 0 or 1 was considered low NCAPG expression, and score 2 or 3 was considered NCAPG overexpression. Clinical data collection and immunostaining were conducted by two independent investigators.
Short Hairpin RNA (shRNA) Treatment
Lentiviral vectors (two NCAPG shRNA constructs, clone IDs: TRCN0000292274, TRCN0000353026, and one control, clone ID: pLKO_TRC025, obtained from the National RNAi Core Facility, Taipei, Taiwan) were transfected into AGS and HGC-27 cells, and puromycin (Thermo)-resistant clones were screened.
Colony Formation Assay
The cells were plated into 6-well plates at a density of 500 cells per well. After incubation for 12 days, individual colonies were fixed, stained using a 1% crystal violet solution. The plates were then scanned using a Scanjet 2200c scanner (HP, Palo Alto, CA, USA). After scanning, methanol was used to solubilize the crystal violet. The optical density (OD540) was read to quantify the colony number.
Wound-Healing Assay
After the cell monolayer was grown to nearly confluent, a 200-μL pipette tip was used to scratch the monolayer. The nonadherent cells were removed by rinsing with 1× phosphate buffer saline (PBS, Corning, Manassas, VA, USA), and the cells were photographed with a Leica DMIRB microscope (100× magnification; Leica, Wetzlar, Germany). The cells were also photographed after 18 h of incubation. The number of migrated cells was measured with Image J software. For calculating the percentage of cell migration, the number of migrated wild type cells was defined as 100%.
In vitro Invasion Assay
Cell invasion assay was performed using a Cell Invasion Assay Kit (Merck Millipore, Darmstadt, Germany). The cells resuspended in serum-free medium were seeded into cell culture inserts (with 8-μm pores) precoated with ECMatrix. Complete media were loaded to 24-well plates and the cells were cultured for 24 h. After 24 h, the uninvading cells were removed and the invaded cells on the lower surface of the membranes were stained with the Staining Solution, and counted. For calculating the percentage of cell invasion, the number of invaded wild type cells was defined as 100%.
Statistical Analysis
Statistical analysis was performed using SPSS version 24.0 (IBM, Armonk, NY, USA). All of the statistic tests were 2-sided, and a P value of <0.05 was considered to indicate statistical significance. The clinicopathologic characteristics of GC examined in this study include age, gender, depth of invasion, nodal status, distant metastasis, stage, degree of differentiation, and vascular invasion. The χ2 test was applied to assessed the correlation between NCAPG expression and the clinicopathologic characteristics. Survival curves were drawn with the Kaplan-Meier method and compared with the long-rank test. The differences between two groups were evaluated using the Student’s t-tests.
Results
NCAPG is Increased in GC
The NCAPG level in gastric tissues collected from a GC patient cohort, comprising 135 patients, was measured to understand the potential significance of NCAPG in the pathological process of GC. Immunostaining revealed that NCAPG level in tumor tissues was up-regulated compared with nontumor tissues (representative photos are shown in Figure 1A). The gastric tissues were scored as 0 for 12 patients (9%), 1 for 53 patients (39%), 2 for 69 patients (51%) and 3 for 2 patients (1%). Eight gastric cell lines were used to validate the results from immunostaining. Western blotting revealed that NCAPG protein expression was markedly higher in seven GC cell lines (AGS, NCI-N87, TMC-1, TSGH 9201, SK-GT-2, HGC-27, and 23132/87) than in Hs738.St/Int cells (Figure 1B). Consistent with immunostaining, NCAPG level in tumor tissues, examined by Western blotting, was also increased compared with nontumor tissues (Figure 1B). As GC progresses, the level of NCAPG also increases: NCAPG level in tumor tissues of stage III patients was higher than in tumor tissues of stage I patients. The results clearly indicated that NCAPG level is remarkedly increased in GC, especially in advanced-stage GC.
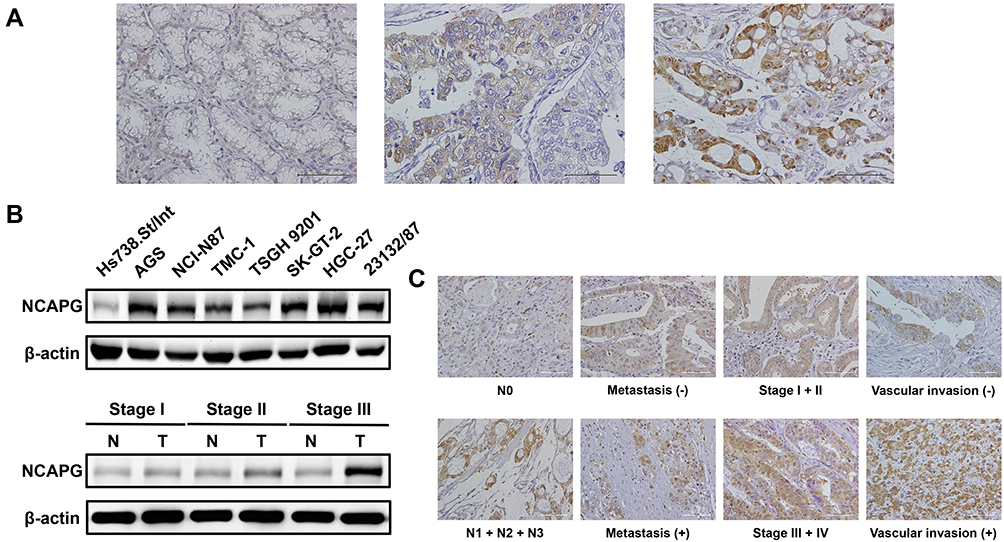 |
Figure 1 NCAPG expression in gastric tissues and cell lines. (A) GC analyzed by immunostaining with an antibody against NCAPG. Left panel shows a nontumor sample without NCAPG expression; middle panel shows a tumor sample with low NCAPG expression; right panel shows a tumor sample with high NCAPG expression. Magnification: 200×. (B) Endogenous NCAPG protein expression was remarkably increased in GC cell lines and tissues. (C) The representative NCAPG staining for different clinicopathologic characteristics. Magnification: 200×. |
NCAPG Upregulation Correlates with Clinicopathologic Features and the GC Patients Survival
Next, the immunostaining and Western blot data brought us to analyze the clinical impact of NCAPG in GC. Table 1 showed that the NCAPG level was significantly associated with nodal status, distant metastasis, staging, and vascular invasion. The data that NCAPG overexpression positively correlated with staging were consistent with the Western blotting data shown in Figure 1B. Representative photos for these clinicopathologic characteristics are shown in Figure 1C.
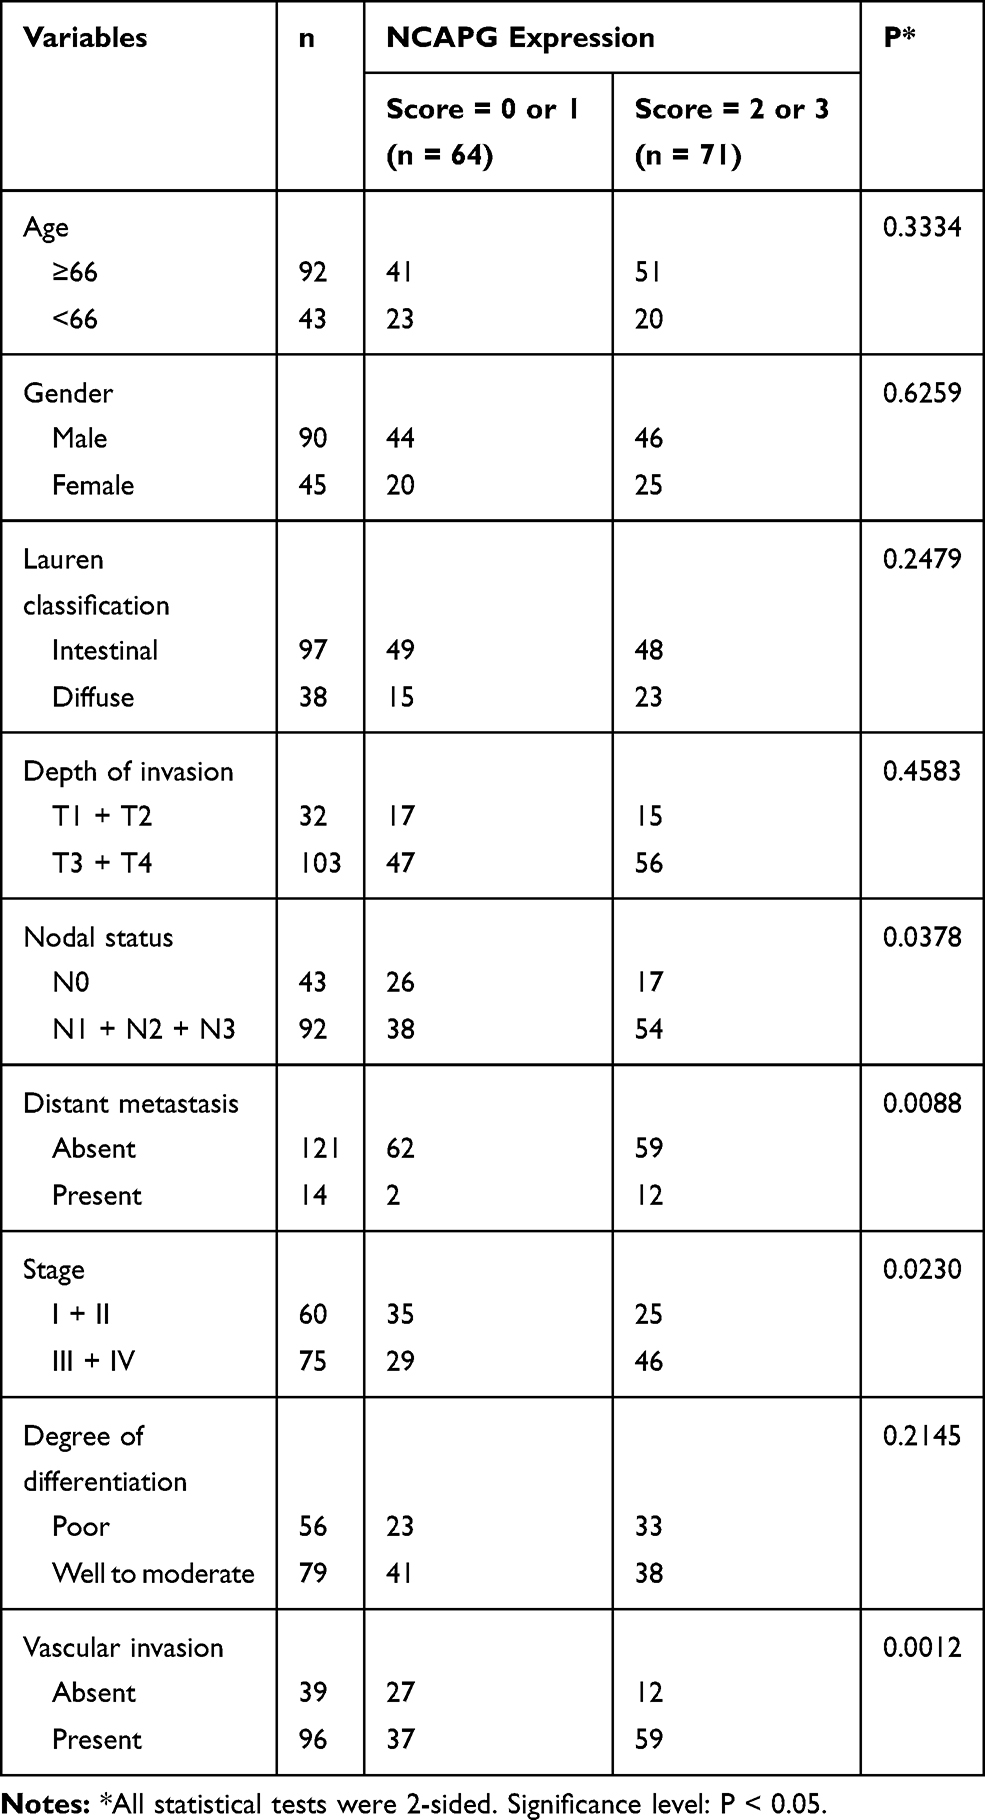 |
Table 1 NCAPG Expression in GC and Its Correlation with Clinicopathologic Characteristics |
Furthermore, survival analysis suggested a significant correlation between NCAPG overexpression and poor disease-free survival (Figure 2A). The five-year disease-free survival rate for GC patients with low NCAPG level was 0.537 (14 patients were at risk, 95% confidence interval [CI] 0.404–0.670). The five-year disease-free survival rate for GC patients with high NCAPG level was 0.259 (0 patients were at risk, 95% CI 0.098–0.420).
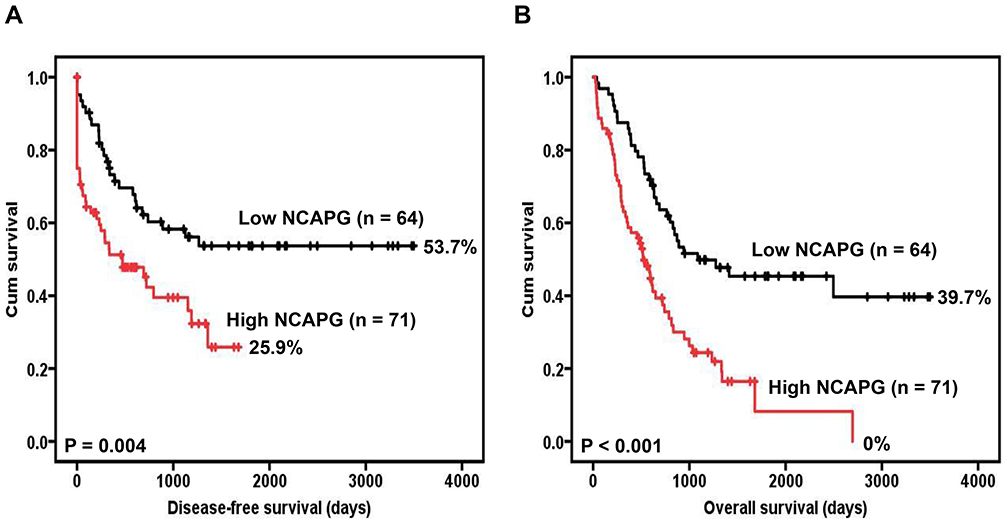 |
Figure 2 Survival analysis of GC patients stratified by NCAPG immunoreactivity. Panel (A) Shows the disease-free survival. Panel (B) Shows the overall survival. All statistical tests were 2-sided. Significance level: P < 0.05. |
Survival analysis also revealed a significant correlation between NCAPG overexpression and poor overall survival (Figure 2B). The five-year overall survival rate for GC patients with low NCAPG level was 0.454 (14 patients were at risk, 95% CI 0.325–0.583). The five-year overall survival rate for GC patients with high NCAPG level was 0.082 (1 patient was at risk, 95% CI 0–0.207).
Table 2 summarizes the univariate analysis of the prognostic biomarkers and patient survival. NCAPG overexpression (hazard ratio [HR] 2.033, 95% CI 1.232 to 3.352, P = 0.005), depth of invasion (HR 3.248, 95% CI 1.482 to 7.121, P = 0.003), nodal status (HR 4.143, 95% CI 2.103 to 8.161, P < 0.001), distant metastasis (HR 12.429, 95% CI 5.080 to 30.405, P < 0.001), stage (HR 4.351, 95% CI 2.433 to 7.781, P < 0.001), and vascular invasion (HR 2.706, 95% CI 1.443 to 5.075, P = 0.002) were significantly correlated with disease-free survival.
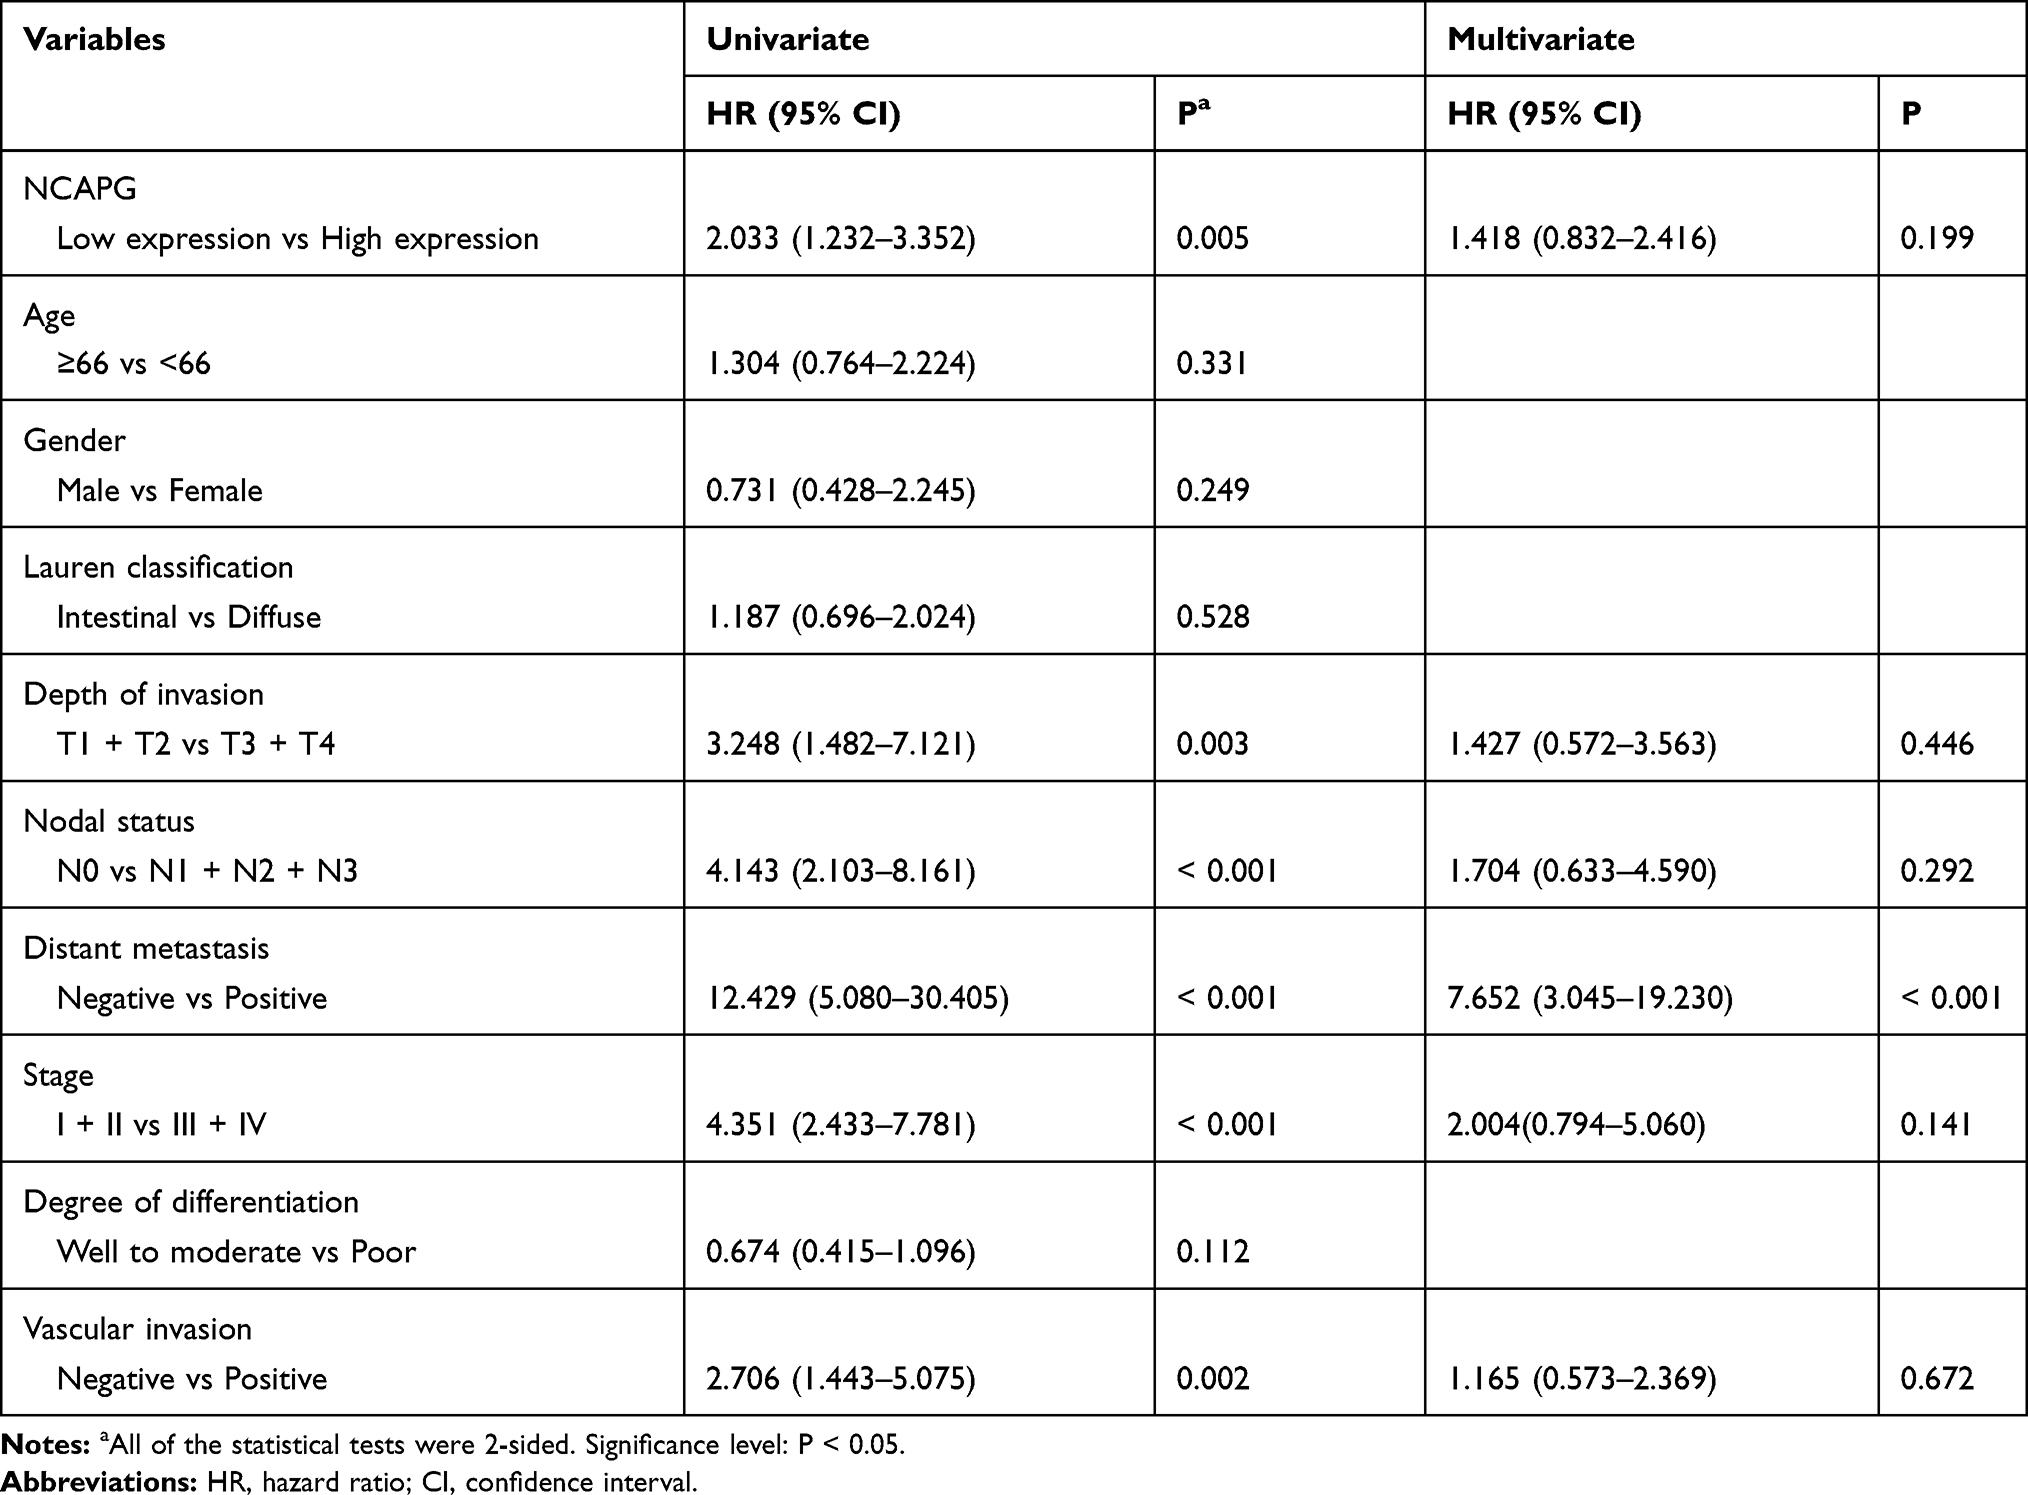 |
Table 2 Univariate and Multivariate Cox Regression Analyses of Prognostic Biomarkers and Survival in 135 GC Patients |
In the multivariate analysis, only distant metastasis (HR 7.652, 95% CI 3.045 to 19.230, P < 0.001) was prognostically independent (Table 2).
Taken together, NCAPG may be involved in the pathological process of GC, and high NCAPG level may be a biomarker for the prognosis of GC.
Silencing NCAPG Suppresses Cell Proliferation in GC Cells
Owing to their high NCAPG levels, AGS and HGC-27 cell lines were used to help us understand the involvement of NCAPG in cell proliferation. NCAPG knockdown AGS and HGC-27 cells were established by infecting AGS and HGC-27 cells with NCAPG shRNA lentiviral vectors (Figure 3A). The colony forming ability of NCAPG knockdown AGS and HGC-27 cells was lower than that of scrambled control cells (Figure 3B). The data indicate that the proliferating ability of AGS and HGC-27 cells was impaired by NCAPG knockdown.
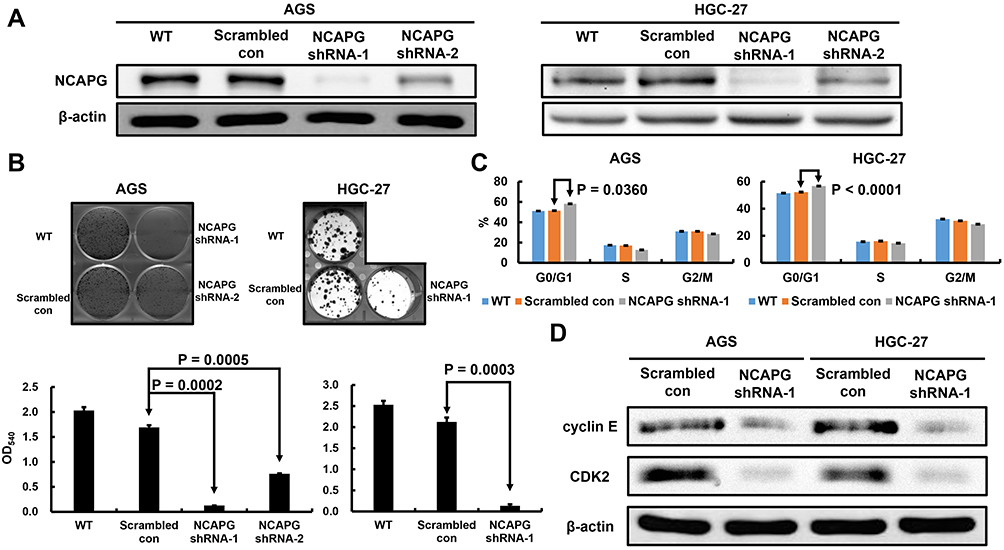 |
Figure 3 Verification of NCAPG knockdown in AGS and HGC-27 cells, and the effect of stable NCAPG knockdown on cell growth and cell cycle distribution. The Western blotting results (A) Indicate NCAPG was efficiently knockdown by shRNA treatment. (B) Stable NCAPG knockdown resulted in remarkedly decreased colony formation. (C) Stable NCAPG knockdown resulted in a sustained accumulation of cells in the G0/G1 phase. Cellular distribution (as percentages) in different phases of the cell cycle (G0/G1, S, and G2/M) is presented. (D) Stable NCAPG knockdown resulted in dysregulated expressions of G0/G1-related molecules. A typical result from three independent experiments is shown. Abbreviations: WT, non-transduced AGS and HGC-27 cells; Scrambled con, scrambled control AGS and HGC-27 cells; NCAPG shRNA, NCAPG knockdown AGS and HGC-27 cells. |
To understand the biological events that go with NCAPG-caused suppression of cell proliferation, we used flow cytometry to examine the cell cycle distribution. NCAPG knockdown AGS and HGC-27 cells inhibited the G0/G1-S transition, demonstrated by significantly increased G0/G1 proportion (Figure 3C). Therefore, these results suggested that NCAPG knockdown abrogated AGS and HGC-27 cell proliferation by interfering the G0/G1-S transition.
To identify the molecular mechanisms that govern the NCAPG knockdown-induced G0/G1 arrest, we assessed the expressions of cyclin E and CDK2, both are involved in the regulation of G1 phase, in the NCAPG knockdown GC cells. Reduced expressions of cyclin E and CDK2 was observed in the NCAPG knockdown AGS and HGC-27 cells (Figure 3D). Overall, our shRNA experiments suggest that NCAPG knockdown interferes with the G0/G1-S transition of cell-cycle progression and consequently abrogates the proliferation of GC cells.
Inhibiting NCAPG Decreased the GC Cell Invasion
Finally, we explored the effect of NCAPG silencing on the migratory and invasive abilities of GC cells. Wound-healing assay was performed and, as shown in Figure 4A, a significant delay in wound-healing was observed in NCAPG knockdown AGS and HGC-27 cells compared with the scrambled control cells. Figure 4B also showed that, compared with the scrambled control, NCAPG interference significantly abrogated AGS and HGC-27 cell invasion (Figure 4B). The role of NCAPG in cell mobility led us to examine whether NCAPG had any effect on epithelial-mesenchymal transition (EMT) in the GC cells. Immunoblotting results showed that NCAPG knockdown induced the expression of the epithelial cell marker (E‐cadherin) and reduced the expression of the mesenchymal cell marker (N‐cadherin), in AGS and HGC‐27 cells (Figure 4C). These data suggest that NCAPG regulates the EMT process, resulting in enhanced migratory ability of GC cells in vitro.
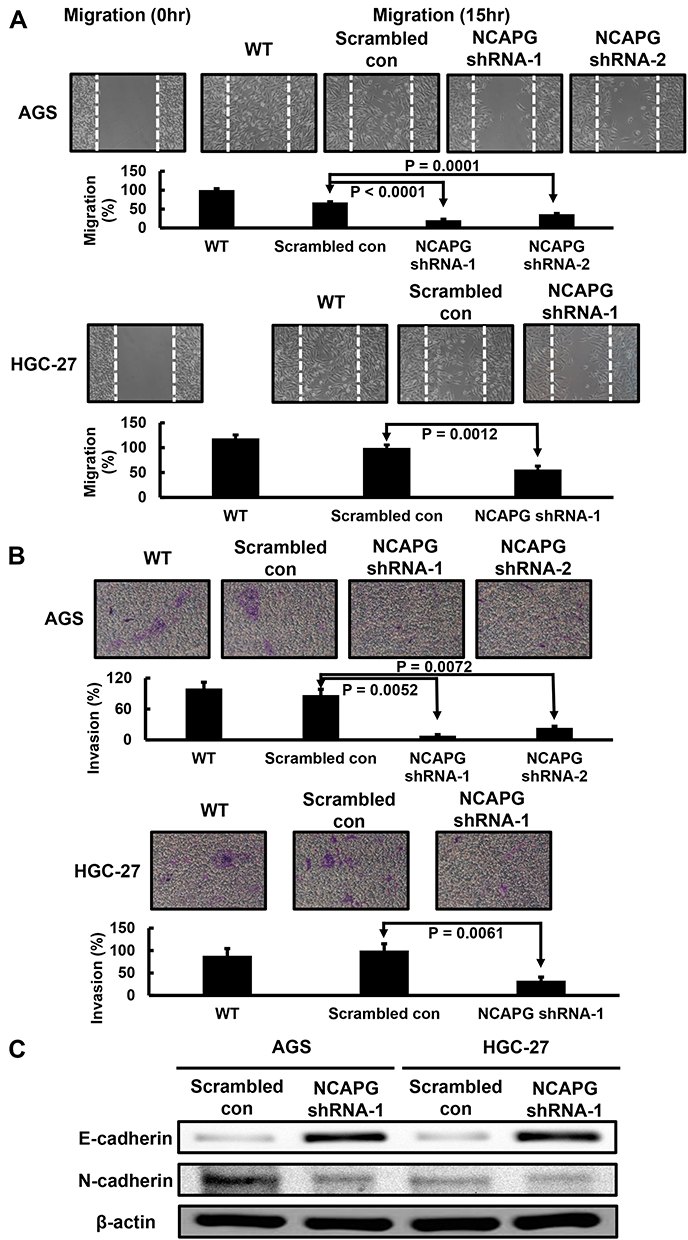 |
Figure 4 Effect of NCAPG knockdown in HGC-27 cells on cell migration and invasion. (A) Stable NCAPG knockdown markedly decreased cell migration. (B) Stable NCAPG knockdown markedly decreased cell invasion. (C) Stable NCAPG knockdown resulted in dysregulated expressions of EMT-related molecules. A typical result from three independent experiments is shown. Abbreviations: WT, non-transduced AGS and HGC-27 cells; Scrambled con, scrambled control AGS and HGC-27 cells; NCAPG shRNA, NCAPG knockdown AGS and HGC-27 cells. |
Discussion
GC remains a prevalent cancer with high incidence and mortality, and a leading cause of mortality related to cancer across the world. The different factors caused low survival rate of GC include a lack of understanding in GC progression and unsuitable prognostic biomarkers. Finding underlying molecular mechanisms has been beneficial to diagnosis and therapy of GC, and it is urgent to identify molecular biomarkers associated with diagnostic and therapeutic targets of GC.
NCAPG is cell cycle-related and is responsible for the condensation and stabilization of chromosomes during mitosis and meiosis.18–20 According to previous studies, NCAPG is overexpressed in several tumor types. However, the expression and function of NCAPG in the GC still need to be explored. Herein, we initially observed that the expression of NCAPG is higher in GC cells and tissues than in normal cells and tissues. NCAPG expression is positively correlated with nodal status, distant metastasis, staging, and vascular invasion, which is in accordance with a study conducted in hepatocellular carcinoma.25 Also, overexpression of NCAPG is associated with poor prognosis in GC. This evidence supports that NCAPG may play an oncogenic role in the pathological progression of GC.
Previous studies revealed that NCAPG could affect the proliferation of different cancer cells, such as PC3 and Huh7 cells.22,26 In this study, the influence of NCAPG silencing on GC cell proliferation was examined by using RNA interference. Using HGC-27 cells, it was observed that cell proliferation was significantly inhibited by silencing NCAPG. Flow cytometry analysis further indicated that NCAPG abrogation restrained G0/G1-S transition. Most of the GC patients are diagnosed at an advanced stage. It is well known that cell invasion plays an important role in cancer metastasis. Arai et al showed that cell migration and invasion were significantly inhibited by knockdown of NCAPG in prostate cancer cells.22 Herein, we observe that the silencing of NCAPG effectively suppressed the invasion of HGC-27 cells. The data further demonstrate the significance of NCAPG in GC progression.
The association between NCAPG overexpression and prognosis was reported in renal cell carcinoma, prostate cancer, and hepatocellular carcinoma. By performing survival analysis, it was observed that a high NCAPG level is positively correlated with poor patient disease-free and overall survival. Univariate Cox regression analysis also showed that the overexpression of NCAPG was a prognostic biomarker of GC. To our knowledge, this is the first study shows that the overexpression of NCAPG may serve as a predictive biomarker of GC patient prognosis.
To the best of our knowledge, this study is the first to examine the NCAPG level in GC, to analyze the correlation between NCAPG overexpression and clinicopathologic characteristics and prognosis of GC, and to explore the effect of NCAPG knockdown in GC cells. Our results suggest that NCAPG overexpression can be used as a prognostic biomarker of GC. As a limitation, the underlying mechanisms of NCAPG-caused suppression of GC cell growth and spread were not explored in this study. Further studies should be performed to address these issues. Another limitation of this study was the small sample size of the GC cohort. Accordingly, additional cohort studies would be helpful to confirm our findings.
Conclusion
In summary, we studied the clinical impact of NCAPG in GC, and the effect of NCAPG knockdown on the proliferative, migratory and invasive abilities of GC cells. Our findings reveal that overexpression of NCAPG can be used as a prognostic biomarker of GC, and it is a promising therapeutic target for GC.
Abbreviations
CI, confidence interval; EMT, epithelial–mesenchymal transition; GC, gastric cancer; non-SMC, non-structural maintenance of chromosomes; PBS, phosphate buffer saline; PCR, polymerase chain reaction; RIPA, radioimmunoprecipitation assay; RNAi, RNA interference; RT, reverse transcription; SDS-PAGE, sodium dodecyl sulfate polyacrylamide gel electrophoresis; shRNA, short hairpin RNA.
Data Sharing Statement
All data generated or analyzed during this study are included in this article.
Ethics Approval and Informed Consent
The institutional review board of Taipei Medical University Wan Fang Hospital approved this study (Approval No. 99049), and written informed consent was obtained from all patients before this study.
Author Contributions
All authors made substantial contributions to conception and design, acquisition of data, or analysis and interpretation of data; took part in drafting the article or revising it critically for important intellectual content; gave final approval of the version to be published; and agree to be accountable for all aspects of the work.
Disclosure
The authors declare that they have no competing interests.
References
1. Bray F, Ferlay J, Soerjomataram I, Siegel RL, Torre LA, Jemal A. Global cancer statistics 2018: GLOBOCAN estimates of incidence and mortality worldwide for 36 cancers in 185 countries. CA Cancer J Clin. 2018;68(6):394–424. doi:10.3322/caac.21492
2. Thrift AP, El-Serag HB. Burden of gastric cancer. Clin Gastroenterol Hepatol. 2020;;18(3):534–542.
3. Sun W, Yan L. Gastric cancer: current and evolving treatment landscape. Chin J Cancer. 2016;35(1):83. doi:10.1186/s40880-016-0147-6
4. Jin Z, Jiang W, Wang L. Biomarkers for gastric cancer: progression in early diagnosis and prognosis. Oncol Lett. 2015;9(4):1502–1508. doi:10.3892/ol.2015.2959
5. Uen YH, Fang CL, Lin CC, et al. Ceramide synthase 6 predicts the prognosis of human gastric cancer: it functions as an oncoprotein by dysregulating the SOCS2/JAK2/STAT3 pathway. Mol Carcinog. 2018;57(12):1675–1689. doi:10.1002/mc.22888
6. Fang CL, Lin CC, Chen HK, et al. Ubiquitin-specific protease 3 overexpression promotes gastric carcinogenesis and is predictive of poor patient prognosis. Cancer Sci. 2018;109(11):3438–3449. doi:10.1111/cas.13789
7. Sun DP, Liew PL, Lin CC, et al. Clinicopathologic and prognostic significance of thymopoietin-α overexpression in gastric cancer. J Cancer. 2019;10(21):5099–5107. doi:10.7150/jca.30738
8. Hu J, Yu J, Gan J, et al. Notch1/2/3/4 are prognostic biomarker and correlated with immune infiltrates in gastric cancer. Aging. 2020;12(3):2595–2609. doi:10.18632/aging.102764
9. Zhou X, Ji H, Ye D, et al. Knockdown of ATAD2 inhibits proliferation and tumorigenicity through the Rb-E2F1 pathway and serves as a novel prognostic indicator in gastric cancer. Cancer Manag Res. 2020;12:337–351. doi:10.2147/CMAR.S228629
10. Hirano T, Kobayashi R, Hirano M. Condensins, chromosome condensation protein complexes containing XCAP C, XCAP E and a Xenopus homolog of the Drosophila Barren protein. Cell. 1997;89(4):511–521. doi:10.1016/S0092-8674(00)80233-0
11. Gerlich D, Hirota T, Koch B, Peter JM, Ellenberg J. Condensin I stabilizes chromosomes mechanically through a dynamic interaction in live cells. Curr Biol. 2006;16(4):333–344. doi:10.1016/j.cub.2005.12.040
12. Kimura K, Cuvier O, Hirano T. Chromosome condensation by a human condensin complex in Xenopus egg extracts. J Biol Chem. 2001;276(8):5417–5420. doi:10.1074/jbc.C000873200
13. Herzog S, Nagarkar Jaiswal S, Urban E, Reimer A, Fischer S, Heidmann SK. Functional dissection of the Drosophila melanogaster condensin subunit Cap G reveals its exclusive association with condensin I. PLoS Genet. 2013;9(4):e1003463. doi:10.1371/journal.pgen.1003463
14. Seipold S, Priller FC, Goldsmith P, Harris WA, Baier H, Abdelilah-Seyfried S. Non SMC condensin I complex proteins control chromosome segregation and survival of proliferating cells in the zebrafish neural retina. BMC Dev Biol. 2009;9:40. doi:10.1186/1471-213X-9-40
15. Hirano T. At the heart of the chromosome: SMC proteins in action. Nat Rev Mol Cell Biol. 2006;7(5):311–322. doi:10.1038/nrm1909
16. Hirano T. Condensins: organizing and segregating the genome. Curr Biol. 2005;15(7):R265–R275. doi:10.1016/j.cub.2005.03.037
17. Eberlein A, Takasuga A, Setoguchi K, et al. Dissection of genetic factors modulating fetal growth in cattle indicates a substantial role of the non SMC condensin I complex, subunit G (NCAPG) gene. Genetics. 2009;183(3):951–964. doi:10.1534/genetics.109.106476
18. Jäger D, Stockert E, Jäger E, et al. Serological cloning of a melanocyte rab guanosine 5ʹ triphosphate binding protein and a chromosome condensation protein from a melanoma complementary DNA library. Cancer Res. 2000;60(13):3584–3591.
19. Lam WW, Peterson EA, Yeung M, Lavoie BD. Condensin is required for chromosome arm cohesion during mitosis. Genes Dev. 2006;20(21):2973–2984. doi:10.1101/gad.1468806
20. Sutani T, Sakata T, Nakato R, et al. Condensin targets and reduces unwound DNA structures associated with transcription in mitotic chromosome condensation. Nat Commun. 2015;6(1):7815. doi:10.1038/ncomms8815
21. Wei W, Lv Y, Gan Z, Zhang Y, Han X, Xu Z. Identification of key genes involved in the metastasis of clear cell renal cell carcinoma. Oncol Lett. 2019;17(5):4321–4328. doi:10.3892/ol.2019.10130
22. Arai T, Okato A, Yamada Y, et al. Regulation of NCAPG by miR-99a-3p (passenger strand) inhibits cancer cell aggressiveness and is involved in CRPC. Cancer Med. 2018;7(5):1988–2002. doi:10.1002/cam4.1455
23. Liu ZK, Zhang RY, Yong YL, et al. Dentification of crucial genes based on expression profiles of hepatocellular carcinomas by bioinformatics analysis. PeerJ. 2019;7:e7436. doi:10.7717/peerj.7436
24. Gong C, Ai J, Fan Y, et al. NCAPG promotes the proliferation of hepatocellular carcinoma through PI3K/AKT signaling. Onco Targets Ther. 2019;12:8537–8552. doi:10.2147/OTT.S217916
25. Liu W, Liang B, Liu H, et al. Overexpression of non‑SMC condensin I complex subunit G serves as a promising prognostic marker and therapeutic target for hepatocellular carcinoma. Int J Mol Med. 2017;40(3):731–738. doi:10.3892/ijmm.2017.3079
26. Zhang Q, Su R, Shan C, Gao C, Wu P. Non-SMC condensin I complex, subunit G (NCAPG) is a novel mitotic gene required for hepatocellular cancer cell proliferation and migration. Oncol Res. 2018;26(2):269–276. doi:10.3727/096504017X15075967560980
 © 2020 The Author(s). This work is published and licensed by Dove Medical Press Limited. The full terms of this license are available at https://www.dovepress.com/terms.php and incorporate the Creative Commons Attribution - Non Commercial (unported, v3.0) License.
By accessing the work you hereby accept the Terms. Non-commercial uses of the work are permitted without any further permission from Dove Medical Press Limited, provided the work is properly attributed. For permission for commercial use of this work, please see paragraphs 4.2 and 5 of our Terms.
© 2020 The Author(s). This work is published and licensed by Dove Medical Press Limited. The full terms of this license are available at https://www.dovepress.com/terms.php and incorporate the Creative Commons Attribution - Non Commercial (unported, v3.0) License.
By accessing the work you hereby accept the Terms. Non-commercial uses of the work are permitted without any further permission from Dove Medical Press Limited, provided the work is properly attributed. For permission for commercial use of this work, please see paragraphs 4.2 and 5 of our Terms.