")
Back to Journals » Neuropsychiatric Disease and Treatment » Volume 16
Aberrant Executive Control and Auditory Networks in Recent-Onset Schizophrenia
Authors Joo SW , Yoon W , Jo YT , Kim H , Kim Y , Lee J
Received 16 March 2020
Accepted for publication 27 May 2020
Published 22 June 2020 Volume 2020:16 Pages 1561—1570
DOI https://doi.org/10.2147/NDT.S254208
Checked for plagiarism Yes
Review by Single anonymous peer review
Peer reviewer comments 2
Editor who approved publication: Dr Taro Kishi
Sung Woo Joo,1 Woon Yoon,2 Young Tak Jo,2 Harin Kim,2 Yangsik Kim,2 Jungsun Lee2
1Medical Corps, Republic of Korea Navy 1st Fleet, Donghae, Republic of Korea; 2Department of Psychiatry, Asan Medical Center, University of Ulsan College of Medicine, Seoul, Republic of Korea
Correspondence: Jungsun Lee
Department of Psychiatry, Asan Medical Center, University of Ulsan College of Medicine, 88 Olympic-Ro 43-Gil, Songpa-Gu, Seoul 05505, Republic of Korea
Tel +82-2-3010-3422
Fax +82-2-485-8381
Email [email protected]
Purpose: Despite a large number of resting-state functional MRI (rsfMRI) studies in schizophrenia, current evidence on the abnormalities of functional connectivity (FC) of resting-state networks shows high variability, and the findings on recent-onset schizophrenia are insufficient compared to those on chronic schizophrenia.
Patients and Methods: We performed a rsfMRI in 46 patients with recent-onset schizophrenia and 22 healthy controls. Group independent component brainmap and dual regression were performed for voxel-wise comparisons between the groups. Correlation of the symptom severity, cognitive function, duration of illness, and a total antipsychotics dose with FC was evaluated with Spearman’s rho correlation.
Results: The patient group had areas with a significantly decreased FC compared to that of the control group in which it existed in the left supplementary motor cortex and supramarginal gyrus (the executive control network) and the right postcentral gyrus (the auditory network). The patient group had a significant correlation of the total antipsychotics dose with the FC of the cluster in the left supplementary motor cortex in the executive control network.
Conclusion: Patients with recent-onset schizophrenia have decreased FC of the executive control and auditory networks compared to healthy controls.
Keywords: schizophrenia, resting-state fMRI, executive control network, auditory network
Introduction
A large number of resting-state functional MRI (rsfMRI) studies have been conducted in order to investigate the intrinsic functional connectivity (FC) of the human brain by analyzing temporally correlating, low-frequency blood oxygen level-dependent signal fluctuations. Several brain networks which interact functionally during rest have been demonstrated. Smith et al demonstrated the ten resting-state networks (RSNs) and their related functions.1 Of the ten networks, the default mode network (DMN) has been mainly investigated in schizophrenia research.2 The DMN is comprised of the rostromedial prefrontal cortex, lateral parietal regions, posterior cingulate cortex/precuneus, and the hippocampi3 and is associated with episodic memory, self-referential and information processing.4–6 Previous studies have revealed abnormally increased or decreased FC of the DMN in schizophrenia.7
Alteration of other RSNs can also reflect neurobiological changes in patients with schizophrenia, given that dysconnectivity of several brain regions underlies schizophrenia pathophysiology.8 Widespread structural abnormalities in white matter tracts in schizophrenia were demonstrated9 and thus FC among brain regions through these white matter tracts can be impaired. Clinical symptoms of schizophrenia, including auditory hallucination, persecutory delusion, and cognitive impairment, may be related to an aberration of RSNs based on the consideration of their related functions such as attention control and auditory information processing. Several previous studies have reported abnormal FC of the sensorimotor, central executive, and frontoparietal-temporal networks in schizophrenia.10–12
Independent component brainmap (ICA) is a data-driven method which can decompose rsfMRI data into statistically maximally independent functional networks. Compared to a seed-based brainmap, ICA does not require a priori region of interest (ROI) and has the strength of effectively separating noises from rsfMRI data. Group ICA using the temporally concatenated rsfMRI data provides more robust identifiable networks than the template matching method on an individual level or a subject-level ICA.1,13 Dual regression is a method allowing individual-level representations of group-level spatial maps to be acquired and enabling the comparison of the individual spatial maps across groups of subjects.14 Several previous studies have used these techniques to find out alterations in the FC of RSNs in schizophrenia patients with a low or high model order.11,15
Despite a large number of rsfMRI studies in schizophrenia, consistent findings on the abnormalities of FC of RSNs have not been achieved. Functional RSNs are differentially affected in schizophrenia,16 and the direction of change in FC of each RSN in schizophrenia is inconsistent.2,17,18 High variability between studies may be owing to several factors including image acquisition and brainmap methods, sample size, and patient population.18 Compared with the amount of evidence on FC abnormalities of RSNs in first-episode and chronic schizophrenia, current evidence in recent-onset schizophrenia is relatively insufficient.17 Pu et al reported reduced FC within the salience network and its association with hallucinations in patients with early-stage of schizophrenia.19 Zhou et al showed significant differences in FC within the DMN and executive control network between healthy controls and patients having a short duration of illness.20 Though of these two previous studies, more research is needed to characterize FC abnormalities in recent-onset schizophrenia with contrast to the findings in first-episode and chronic schizophrenia. Owing to the effect of medication and illness duration on FC in schizophrenia,17 it is anticipated that the results in recent-onset schizophrenia would be different from those in first-episode or chronic schizophrenia and could be useful to gain an insight into changes of FC that occur as the illness progresses and bridge the gap between the findings in first-episode and chronic schizophrenia.
The current study aimed to investigate a change in FC of RSNs in patients with recent-onset schizophrenia using the ICA. We performed the group ICA and dual regression for revealing significant group differences in FC of RSNs between patients with recent-onset schizophrenia and healthy controls. The ten RSNs demonstrated by Smith et al1 were used to identify and extract components of interest in this study, and which were visual, default mode, cerebellum, sensorimotor, auditory, executive control, and frontoparietal networks. Correlation of the symptom severity, cognitive function, duration of illness, and a total antipsychotics dose with FC was also evaluated.
Patients and Methods
Subjects
The current study was conducted in accordance with the Declaration of Helsinki and approved by the Institutional Review Board of the Asan Medical Center. After a complete description of the study, all subjects provided written informed consent. The recruitment of subjects was conducted in the Department of Psychiatry, the Asan Medical Center. All subjects were right-handed and between 20 and 40 years of age. Through an interview by a board-certificated psychiatrist, the diagnosis of patients was confirmed as schizophrenia based on the Diagnostic and Statistical Manual of Mental Disorders-IV-Text Revision (DSM-IV-TR). We also confirmed that the patients did not have a comorbid psychiatric disorder and they had exhibited psychotic symptoms fewer than five years, intending to include a representative sample of patients with recent-onset schizophrenia.21 The control group was recruited by advertisement inside the hospital and interviewed by a board-certificated psychiatrist to confirm that they and their first-degree relatives did not have any Axis I psychiatric diagnosis according to DSM-IV-TR. The following exclusion criteria were applied to the subjects, resulting in the exclusion of 20 subjects: 1) inadequate image quality for further analyses (n=10); 2) a change from the initial diagnosis (schizophrenia) into another psychotic disorder in less than 6 months (n=8); 3) incidental lesions in the brain (n=1); 4) unable to complete neurocognitive tests (n=1). A total of 46 patients with recent-onset schizophrenia and 22 healthy controls were included in the present study.
The cognitive function and severity of psychiatric symptoms of the subjects were assessed in a week from the MRI scans. For the cognitive function, the age and sex-adjusted short form of the Wechsler Adult Intelligence Scale III (WAIS-III) was used. A board-certificated psychiatrist assessed the severity of psychiatric symptoms of the patients using the Positive and Negative Syndrome Scale (PANSS).22 The demographic and clinical details of the control and patient groups are presented in Table 1.
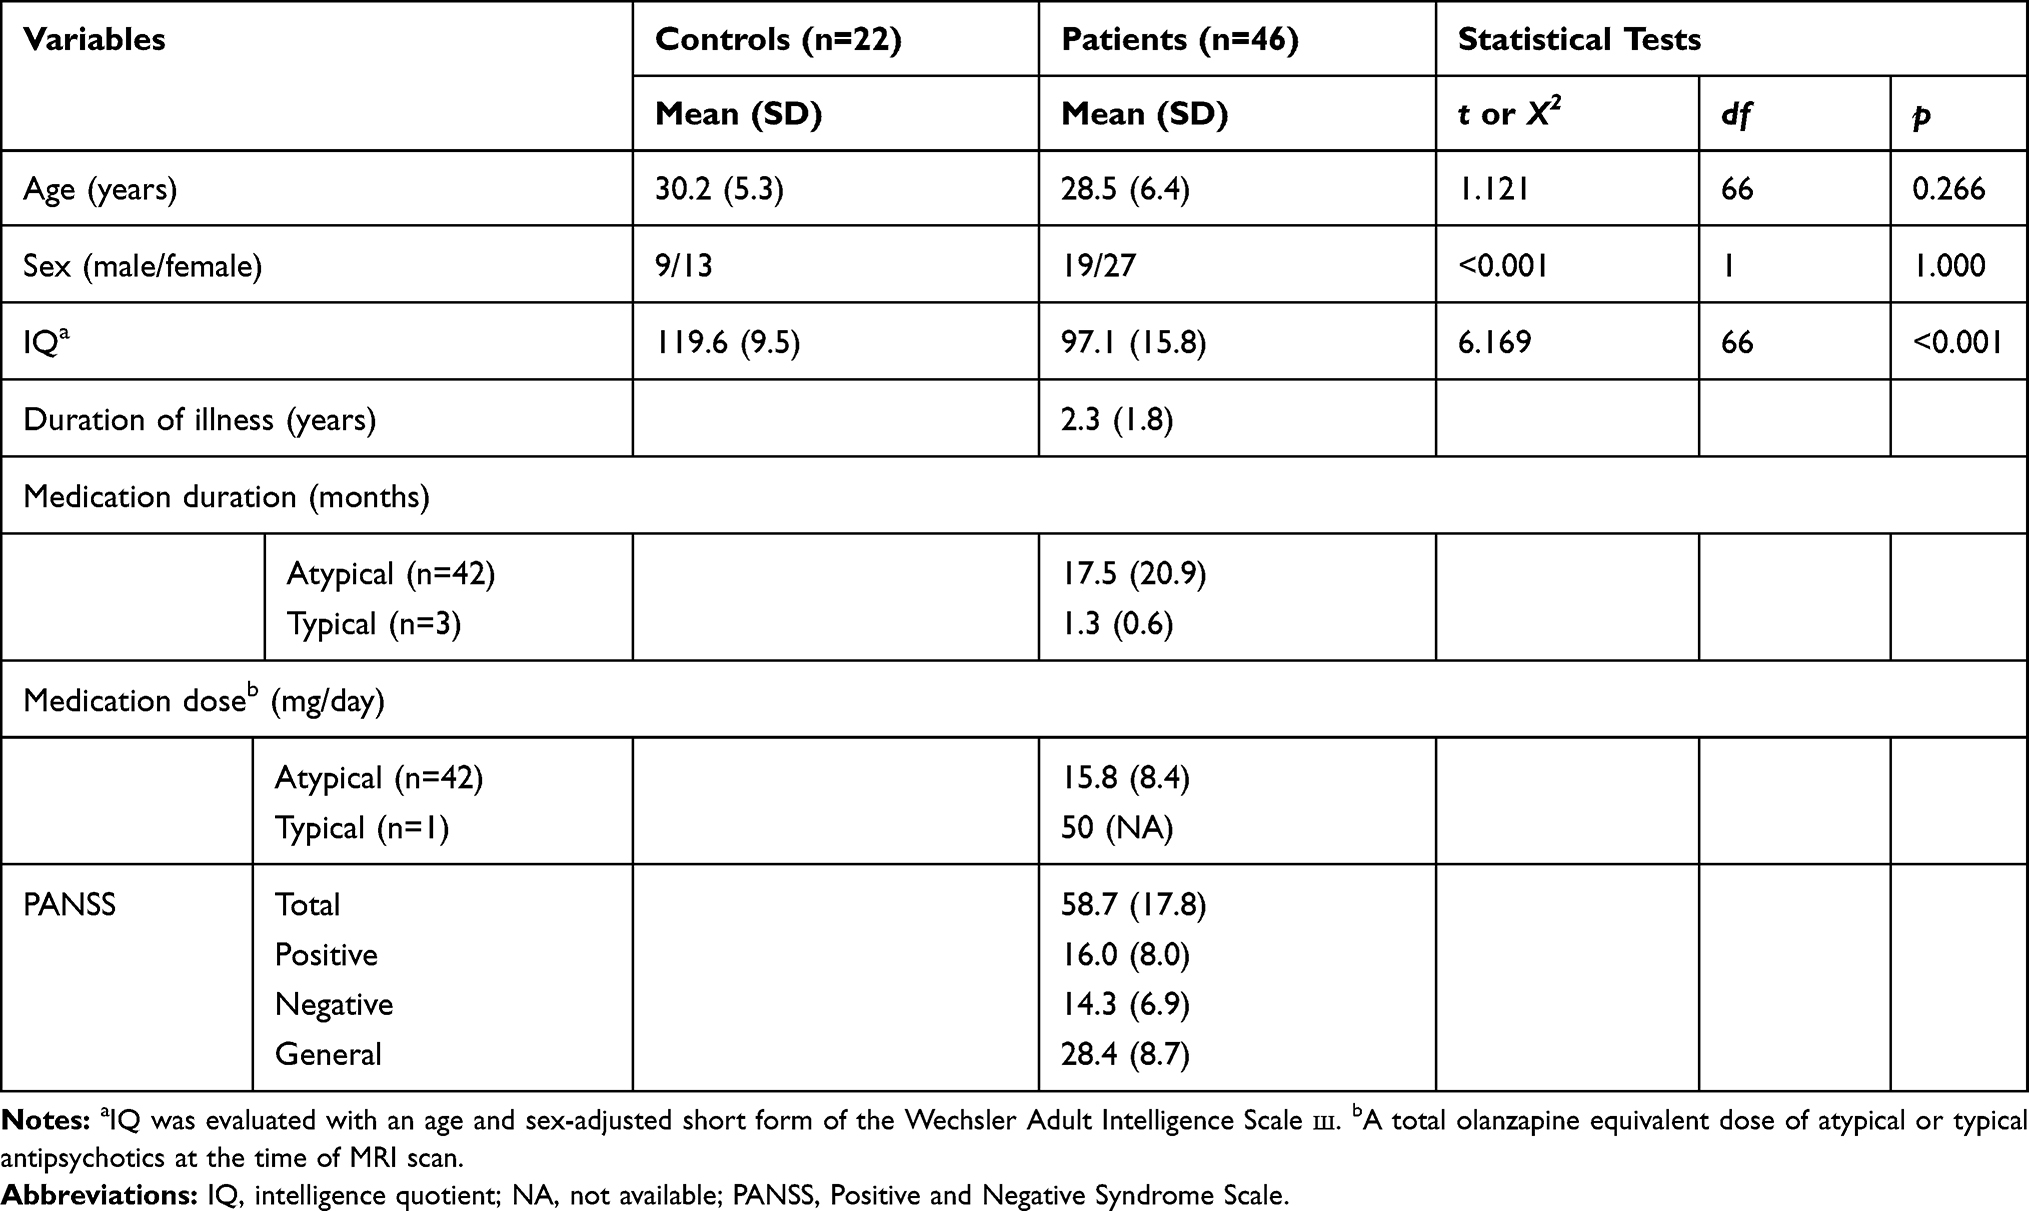 |
Table 1 Demographic and Clinical Information for Healthy Controls and Schizophrenia Patients |
Image Acquisition
An eight-channel, SENSE head coil on a 3-Tesla scanner (Philips Achieva) was used for MR scans. Structural T1 MR scans were obtained using the turbo field echo and the following scan parameters: FOV: 240*240*170; voxel size 1*1*1 mm3; TE: 4.6 ms; TR: 9 ms; and flip angle: 8°. rsfMRI volumes were collected using a whole-brain, single-shot, multi-slice BOLD echo-planar imaging (EPI) sequence (TR 3000 ms, TE 30 ms, flip angle 90°, voxel size 2*2*3 mm3, FOV 224*240*96 mm3, matrix 144*144, 32 slices per volume, 150 volumes per acquisition). All of the subjects were instructed to simply rest and not to think of anything in particular during the rsfMRI scanning.
Image Preprocessing
The FMRIB Software Library tools were used for preprocessing steps of the rsfMRI data (FSL; http://www.fmrib.ox.ac.uk/fsl).23–25 We discarded the first five volumes for magnetization equilibration. Head motion was corrected by volume-realignment to the middle volume using the MCFLIRT software.26 Slice timing correction, global 4D mean intensity normalization, and spatial smoothing using a Gaussian kernel (6 mm FWHM) were applied. The motion-corrected rsfMRI volumes were used for brain extraction with optimization of the deforming smooth surface model, as implemented in the BET software27 with threshold parameters f = 0.5 and g = 0. We visually inspected the extraction results to verify the procedure and manually extracted the tissues not removed appropriately. Registration of the rsfMRI volumes to the structural images of corresponding subjects and into the standard Montreal Neurological Institute (MNI) space template was carried out using the FMRIB Linear Image Registration Tool (FLIRT) and the Non-linear Image Registration Tool (FNIRT), respectively. Regarding the affine registration with the FLIRT, tri-interpolation was used, boundary-based registration was applied as cost function, and concerning the rotation parameters, a normal search was carried out in the [−90 90] range. A warp resolution of 10 mm was used in the nonlinear registration with the FNIRT. For computational reasons pertaining to the later brainmap steps, we applied 4-mm resolution after spatial normalization.
ICA was applied to the spatially preprocessed individual rsfMRI data with automatic dimensionality estimation as implemented in FSL 6.0.1 Multivariate Exploratory Linear Optimized Decomposition into Independent Components (MELODIC) 3.15.28 The independent component (IC) maps from a subject-level ICA were thresholded with an alternative hypothesis test based on fitting a Gaussian/gamma mixture model to the distribution of voxel intensities within spatial maps and controlling the local false-discovery rate at p<0.5.29 We used the ICA-based Automatic Removal of Motion Artifacts (ICA-AROMA) for identifying motion-related components.30 The motion-related components were removed from the rsfMRI data using the FSL fsl_regfilt tool. Then, for temporal preprocessing, highpass temporal filtering was applied to the resulting rsfMRI data using a 100 s cutoff with the FSL fslmaths tool.
Image brainmap
The preprocessed rsfMRI data were temporally concatenated across subjects and were used for group ICA brainmap with FSL 6.0.1 MELODIC 3.1528 with a model order of 30 IC maps. We selected this relatively low model order in order to map a RSN into a single IC map, ie we intended to capture the ten RSNs of interest into ten IC maps each by each. This low model order is more commonly used in early ICA-based brainmap in order to obtain an RSN of interest within a single IC map.31,32 We thresholded the group-level IC maps with an alternative hypothesis test based on fitting a Gaussian/gamma mixture model to the distribution of voxel intensities within spatial maps and controlling the local false-discovery rate at p<0.5.29
We conducted a spatial cross-correlation brainmap of the 30 components from the group ICA to the ten reference RSNs utilizing the FSL fslcc tool and the templates from http://fsl.fmrib.ox.ac.uk/analysis/brainmapþrsns. The ten components were identified when having a minimum Spearman’s rho of 0.405, which represents the nine reference RSNs except for the cerebellum network (Supplementary Figure 1). We visually inspected and confirmed the overlap of these two data sources.
For voxel-wise comparisons, dual regression was carried out. Initially, the set of spatial maps from group ICA was regressed to the individual preprocessed rsfMRI data as spatial regressors, resulting in a set of subject-specific time-course per each group-level spatial map. Then, those time-courses were regressed as temporal regressors into the same rsfMRI data, and which provided a set of subject-specific spatial maps. The dual regression was carried out with normalized signal variance. We conducted a voxel-wise test for significant group differences with the FSL randomize tool33 using 5000 permutations. In account for multiple voxel-wise comparisons, threshold-free cluster enhancement (TFCE)34 and a family-wise error correction were used. We thresholded the spatial maps at corrected p<0.05.
The temporal weight of a voxel in an IC can be regarded as a measure of FC of the IC as the temporal weight reflects the correspondence of a voxel’s time-series to the time-series of the IC. For evaluating a correlation of FC with symptom severity, cognitive function, duration of illness, and a total antipsychotics dose, we extracted and averaged the z-scores of temporal weights from the cluster of the IC in which a significant group difference existed.
Statistical Analysis
Comparisons of demographic and clinical variables between the groups were conducted using the Student’s t-test and the Chi-square test. Relationship between the FC of the cluster with a significant group difference, and symptom severity, cognitive function, duration of illness, and total antipsychotics dose at the MRI scan which were converted into olanzapine equivalent dose35 was examined using the Spearman’s rho correlation. The correlation with cognitive function was examined in the patient and control groups separately and the p-value was adjusted with the Bonferroni correction because of multiple comparisons. The correlations with symptom severity, duration of illness, and the total antipsychotics dose were only evaluated in the patient group. All statistical analyses were performed using R packages (version 3.4.1).36 A two-tailed p<0.05 was regarded to be significant.
Results
Although there were no areas in which the patient group showed significantly increased FC than the control group, the executive control and auditory networks had regions in which the control group had significantly increased FC than the patient group (Table 2, Figures 1 and 2). In the executive control network, two areas showed significant group differences in FC in the left supplementary motor cortex and supramarginal gyrus. In the auditory network, areas with a significant group difference in FC existed in the right postcentral gyrus.
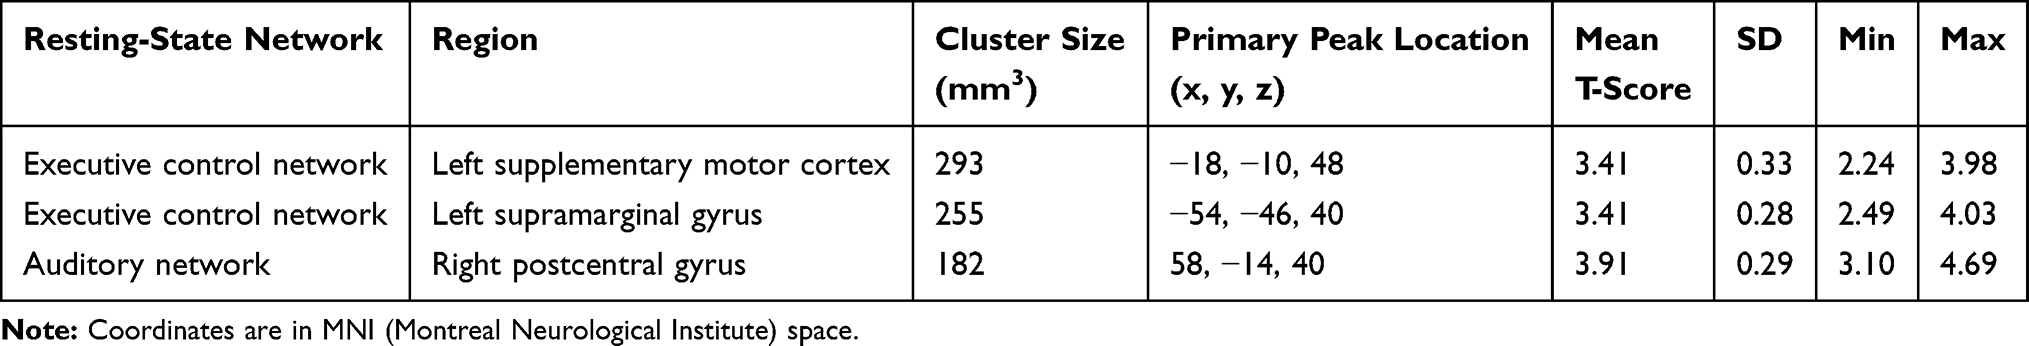 |
Table 2 Significant Clusters in the Resting-State Network Maps |
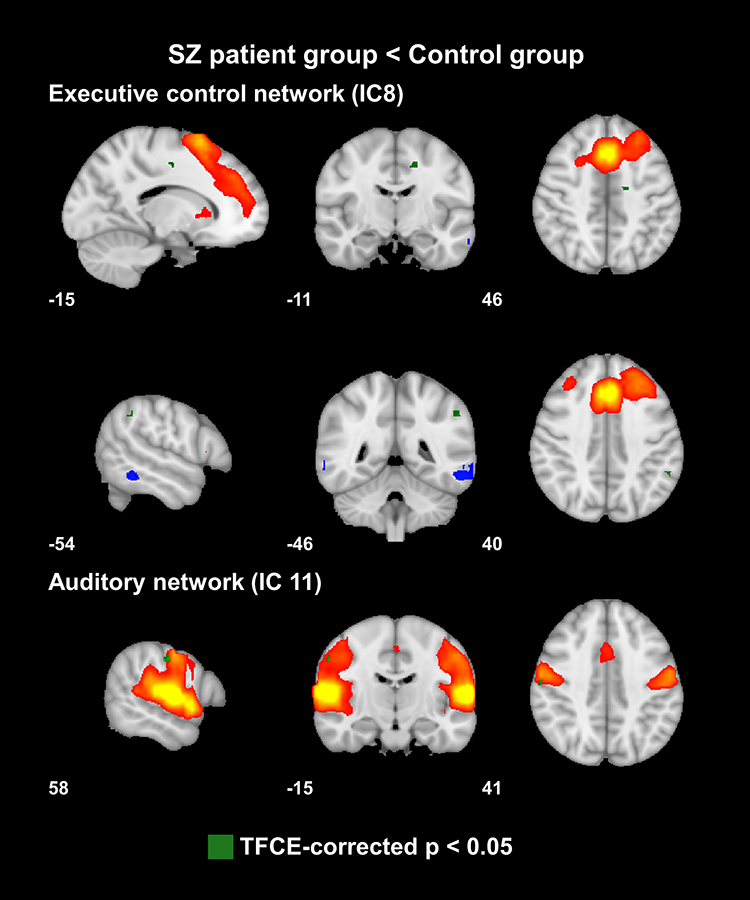 |
Figure 1 Independent components (ICs) with a significant increase in functional connectivity in the control group compared to that of the patient group. The IC maps are superimposed on the Montreal Neurological Institute (MNI) 152 standard space template and are encoded in red-yellow and blue-light blue colors with a 3 < z-score < 8 thresholds. The voxels with a significant group difference in functional connectivity are shown in green color. |
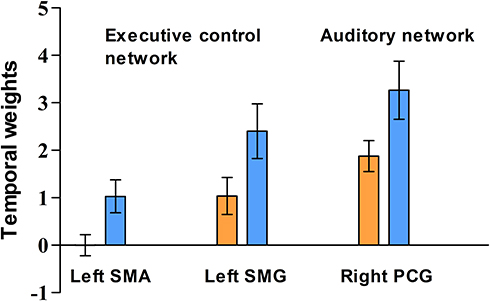 |
Figure 2 The mean z-scores of the temporal weights from the clusters with a significant group difference in functional connectivity. Blue and orange bars indicate means of the values in the control and patient groups, respectively. Error bars indicate 95% confidence interval of the value. Abbreviations: SMA, supplementary motor area; SMG, supramarginal gyrus; PCG, postcentral gyrus. |
For the executive control network, we created two separate masks for calculating the mean of z-scores of temporal weights from the clusters in the left supplementary motor cortex and supramarginal gyrus. While we did not find any significant correlation of the FC with the symptom severity and duration of illness, a significant negative correlation of the total antipsychotics dose with the FC of the cluster in the left supplementary motor cortex in the executive control network was found (Table 3). There were several correlations between the FC and the WAIS-3 subtest scores, which did not remain the significance after correction for multiple comparisons. In the patient group, for the cluster in the right postcentral gyrus in the auditory network, there was a positive correlation between the FC and the block design subtest score (r=0.337, uncorrected p=0.022). In the control group (Supplementary Table 1), the digit symbol subtest score showed positive and negative associations with the FC of the regions in the left supplementary motor cortex (r=0.521, uncorrected p=0.013) and left supramarginal gyrus (r=−0.441, uncorrected p=0.04) in the executive control network, respectively. The vocabulary subtest score had a negative correlation with the FC of the region in the right postcentral gyrus in the auditory network (r==−0.552, uncorrected p=0.008).
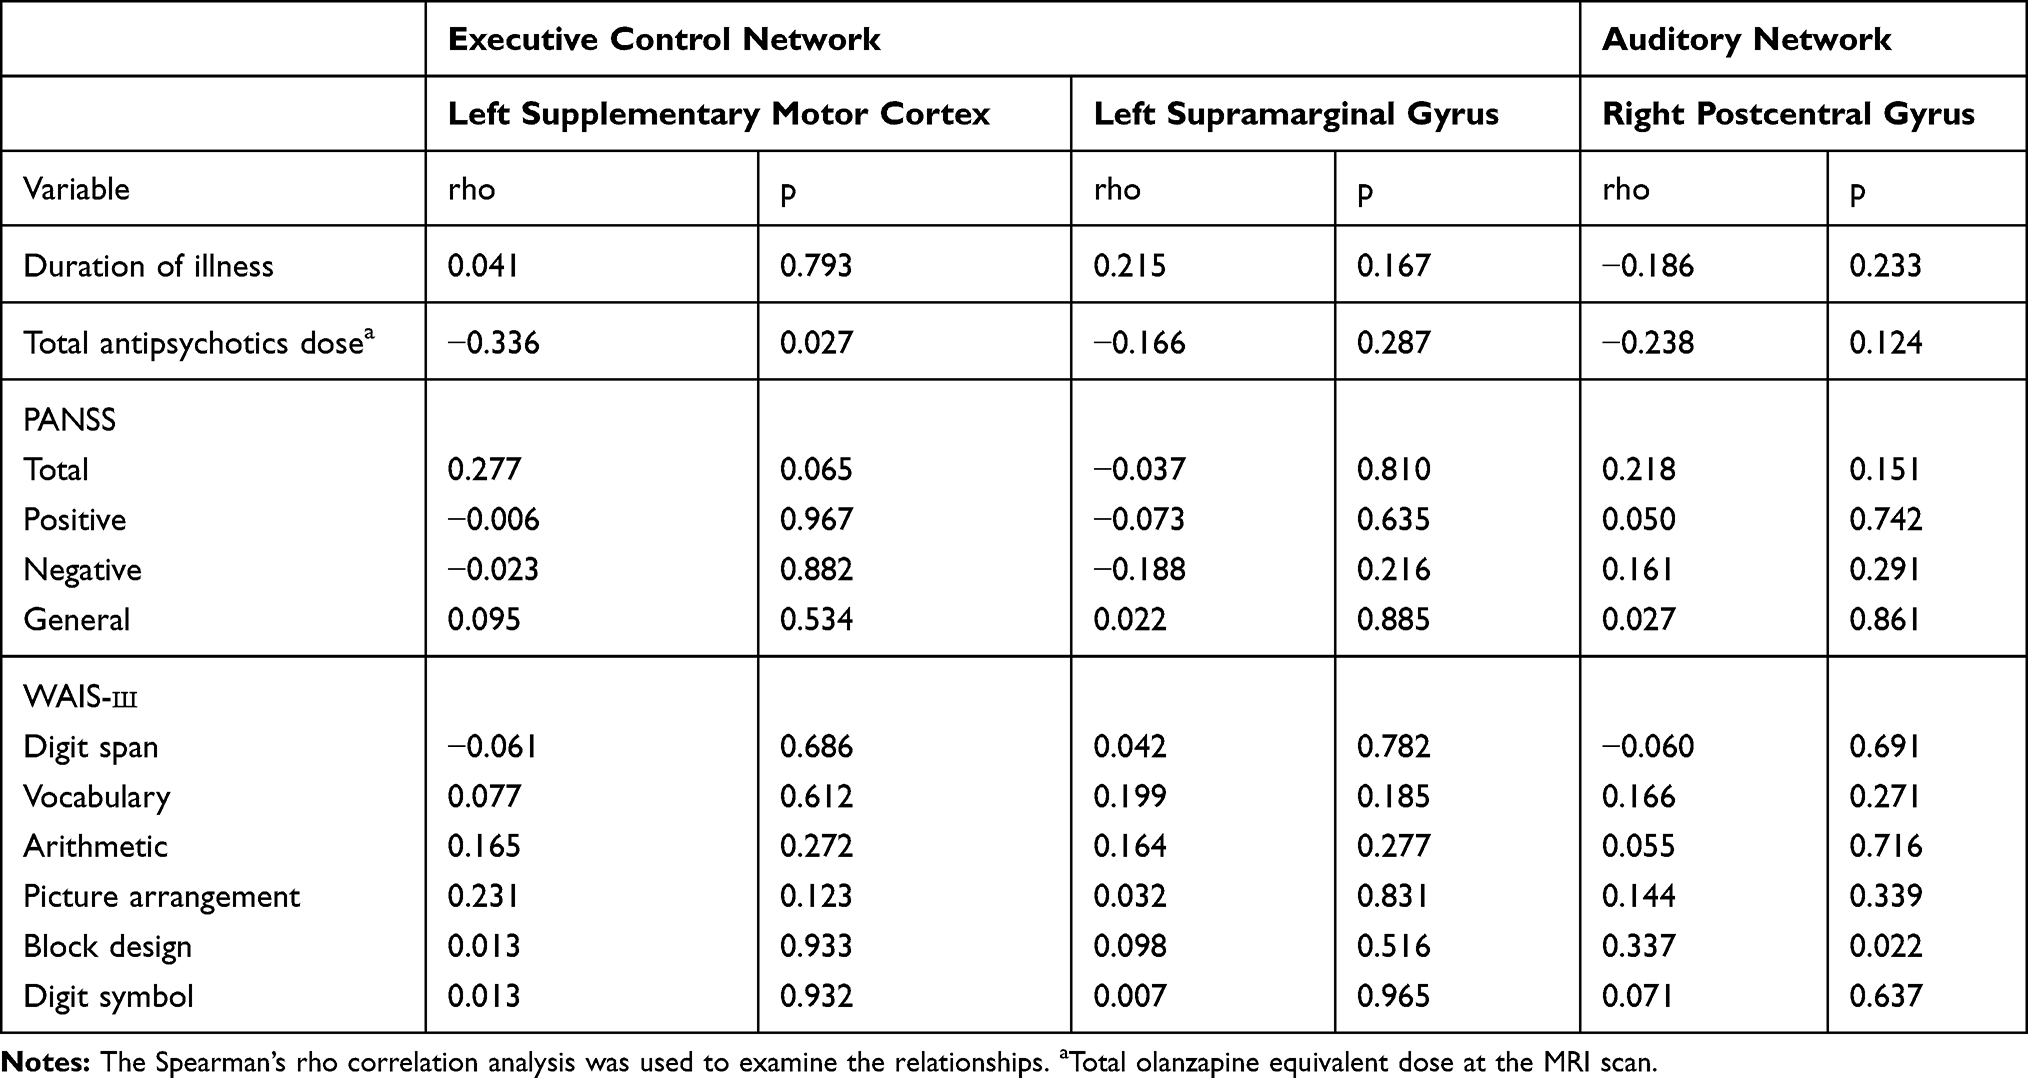 |
Table 3 Correlations with Clinical Variables in the Patient Group |
Discussion
In this study, we performed group ICA and dual regression to reveal a significant group difference in FC of the RSNs between patients with recent-onset schizophrenia and healthy controls. Of the ten identified ICs corresponding to the nine reference networks, two ICs had the areas in which the control group exhibited significantly increased FC than the patient group, and which corresponded to the executive control and auditory networks. While the FC of the clusters did not significantly correlate with the symptom severity, duration of illness, and cognitive function, the FC of the cluster in the left supplementary motor cortex in the executive control network had a significant negative correlation with a total antipsychotic dose.
The executive control network involves medial frontal areas, including the anterior cingulate and paracingulate, and strongly relates to action-inhibition, emotion, and perception-somesthesis-pain.1 According to previous studies using a seed-based analysis,16,17 FC of the executive control network is increased or decreased in patients with schizophrenia compared to healthy controls. In a previous study adopting the ICA,37 patients with schizophrenia showed an increased FC in the inferior parietal lobule and par hippocampal gyrus and a decreased FC in the bilateral insula and precuneus in the executive control network in comparison with healthy controls. Regarding the executive control network, the present study showed that the control group had areas with a significantly increased FC in the left supplementary motor cortex and supramarginal gyrus. The supplementary motor area is contained in the dorsal mesial frontal cortex and plays an important role in motor planning, executing, inhibition, speech, and language processing.38 To the best of our knowledge, no convincing evidence on structural and functional abnormalities of the supplementary motor cortex in schizophrenia has been reported yet. The left supramarginal gyrus is related to phonological processing fundamental to speech comprehension, production, and reading.39 Patients with schizophrenia have a decreased FC between the left supramarginal gyrus and left inferior frontal gyrus compared to healthy controls.40 Significantly decreased FC between the right ventral caudate/nucleus accumbens and bilateral supramarginal gyrus is observed in patients with first-episode schizophrenia showing improvement in psychotic symptoms after antipsychotic treatment.41 Despite the similarity in functional aspects between these two regions and the executive control network, until now, it is unclear how these two regions are functionally connected and contribute to the executive control network, which should be addressed in future studies.
The auditory network is comprised of the superior temporal gyrus, Heschl’s gyrus, and posterior insular.1 A significantly increased co-activation in the right auditory cortex and bilateral insula within the auditory network was reported in schizophrenia patients with auditory hallucinations compared with those without auditory hallucinations.15 A decrease in FC in the cingulate gyrus and left insula within the auditory network was found in schizophrenia patients compared with healthy controls.37,42 The present study showed that the control group had areas with a significantly increased FC in the right postcentral gyrus. Baseline amplitude of low-frequency fluctuation in the left postcentral gyrus is increased in schizophrenia patients with treatment response.43 In a delayed response working memory task, schizophrenia patients exhibit significantly increased activity in postcentral gyrus compared to healthy controls.44 Evidence on change in FC of postcentral gyrus in relation to the auditory network has not been reported yet. The postcentral gyrus has been regarded as one of the classically defined somatosensory areas. However, a recent study demonstrated that auditory frequency representations can be distributed over parietal regions and the postcentral gyrus significantly contributes to temporal frequency processing.45 Given this finding, it is likely that the postcentral gyrus can be involved in auditory information processing and even clinical symptoms such as auditory hallucination. Further research with an appropriate design is needed to elucidate how the decreased FC of postcentral gyrus in the auditory network is implicated in the clinical symptoms of schizophrenia.
The current study showed no significant group difference in FC in the visual, default mode, frontoparietal, and sensorimotor networks between the patient and control groups. The most widely investigated RSN in schizophrenia research is the DMN. Hyperconnectivity, hypoconnectivity, and a mix of hyperconnectivity and hypoconnectivity of the DMN have been reported in previous studies.46–48 The negative finding for the DMN in the current study may be due to that the DMN was captured in two different ICs. Abnormalities of the frontoparietal and sensorimotor networks have been reported.42,49,50 Yu et al pointed out that in rsfMRI studies regarding schizophrenia, most seed-based studies report decreased FC while ICA studies report both increases and decreases, which suggests different image analysis methods could be a reason for variability in the findings.18 Other several factors including medication, duration of illness, data quality, and image parameter could also contribute to the inconsistency with previous studies.
Although we did not find a significant correlation between the FC of the clusters, and the symptom severity, duration of illness, and cognitive function, there was a significant correlation with the total antipsychotics dose. The reason for the negative finding regarding the correlation with symptom severity may be that the patient group exhibited relatively mild symptom severity. We found that in the executive control network, the FC of the cluster in the left supplementary motor cortex had a significant negative correlation with the total antipsychotics dose. Though it may suggest that an increase in total antipsychotics dose induce a decrease in FC between the left supplementary motor cortex and the executive control network, this should be interpreted as an explorative finding because factors possibly affecting the relationship were not controlled in the analysis. Further studies with the specific aim of investigating the longitudinal medication effects on the FC are needed to verify this finding. Even though the significance did not survive after correction for multiple comparisons, the present study showed several correlations of the FC with the WAIS-3 subtest scores. The vocabulary subtest measures semantic knowledge and verbal comprehension and expression. The block design and digit symbol subtests are used for evaluating visuospatial processing and processing speed.51,52 Although the statistical significance did not survive after correction for multiple comparisons, this study showed a probable association of the FC with cognitive function. Future studies are needed to address how the decreased FC of the regions affects cognitive function in relation to the executive control or auditory network.
In this study, there were several limitations to be taken into consideration when it comes to interpreting the results. First, we could not control the covariate effect in the FC analysis. Previous studies reported longitudinal effects of illness duration and antipsychotic treatment on FC.53,54 We found a significant correlation of the FC with the total antipsychotics dose, which may indicate a possible covariate effect of the variable. Second, the small number of the control group compared with that of the patient group could induce a false-negative result. Third, the whole cerebellum was not included in some subjects’ rsfMRI data due to limited FOV. This may be a reason that we could not obtain an IC corresponding to the cerebellum network. Fourth, the mean IQ of the control group was 119.6, indicating the control group had superior cognitive abilities compared with the general healthy population. This could induce a false-positive result. Fifth, we did not control multiple comparisons across the ten ICs. The reason for this is that our main hypothesis is not to compare the FC of multiple RSNs simultaneously between the groups. Although we investigated aberrations of several RSNs in recent-onset schizophrenia, a voxel-wise test was performed in an individual component which was considered a component of interest as in the seed-based analysis. When interpreting the current findings, this issue should be considered.
Conclusion
We found that the control group had areas with a significantly increased FC in the left supplementary motor cortex and supramarginal gyrus for the executive control network and the right postcentral gyrus for the auditory network. Although there was no significant correlation of symptom severity, duration of illness, cognitive function with the FC of the clusters, the significant relationship with a total antipsychotics dose was found. Further studies are needed to elucidate how the decreased FC of these regions in relation to the executive control or auditory network is implicated in the pathophysiology of schizophrenia.
Acknowledgments
This study was supported by the National Research Foundation of Korea (NRF-2012R1A1A1006514) and the Korean Society for Schizophrenia Research.
Disclosure
The authors have no potential conflicts of interest to disclose.
References
1. Smith SM, Fox PT, Miller KL, et al. Correspondence of the brain’s functional architecture during activation and rest. Proc Natl Acad Sci U S A. 2009;106(31):13040–13045. doi:10.1073/pnas.0905267106
2. Karbasforoushan H, Woodward ND. Resting-state networks in schizophrenia. Curr Top Med Chem. 2012;12(21):2404–2414. doi:10.2174/156802612805289863
3. Raichle ME, MacLeod AM, Snyder AZ, Powers WJ, Gusnard DA, Shulman GL. A default mode of brain function. Proc Natl Acad Sci U S A. 2001;98(2):676–682. doi:10.1073/pnas.98.2.676
4. Huo L, Li R, Wang P, Zheng Z, Li J. The default mode network supports episodic memory in cognitively unimpaired elderly individuals: different contributions to immediate recall and delayed recall. Front Aging Neurosci. 2018;10:6. doi:10.3389/fnagi.2018.00006
5. Gusnard DA, Akbudak E, Shulman GL, Raichle ME. Medial prefrontal cortex and self-referential mental activity: relation to a default mode of brain function. Proc Natl Acad Sci U S A. 2001;98(7):4259–4264. doi:10.1073/pnas.071043098
6. Vatansever D, Menon DK, Stamatakis EA. Default mode contributions to automated information processing. Proc Natl Acad Sci U S A. 2017;114(48):12821–12826. doi:10.1073/pnas.1710521114
7. Hu ML, Zong XF, Mann JJ, et al. A review of the functional and anatomical default mode network in Schizophrenia. Neurosci Bull. 2017;33(1):73–84. doi:10.1007/s12264-016-0090-1
8. Schmitt A, Hasan A, Gruber O, Falkai P. Schizophrenia as a disorder of disconnectivity. Eur Arch Psychiatry Clin Neurosci. 2011;261(Suppl 2):S150–154. doi:10.1007/s00406-011-0242-2
9. Kelly S, Jahanshad N, Zalesky A, et al. Widespread white matter microstructural differences in schizophrenia across 4322 individuals: results from the ENIGMA schizophrenia DTI working group. Mol Psychiatry. 2018;23(5):1261–1269. doi:10.1038/mp.2017.170
10. Meda SA, Gill A, Stevens MC, et al. Differences in resting-state functional magnetic resonance imaging functional network connectivity between schizophrenia and psychotic bipolar probands and their unaffected first-degree relatives. Biol Psychiatry. 2012;71(10):881–889. doi:10.1016/j.biopsych.2012.01.025
11. Littow H, Huossa V, Karjalainen S, et al. Aberrant functional connectivity in the default mode and central executive networks in subjects with schizophrenia - a whole-brain resting-state ICA study. Front Psychiatry. 2015;6:26. doi:10.3389/fpsyt.2015.00026
12. Lui S, Li T, Deng W, et al. Short-term effects of antipsychotic treatment on cerebral function in drug-naive first-episode schizophrenia revealed by “resting state” functional magnetic resonance imaging. Arch Gen Psychiatry. 2010;67(8):783–792. doi:10.1001/archgenpsychiatry.2010.84
13. Zuo XN, Kelly C, Adelstein JS, Klein DF, Castellanos FX, Milham MP. Reliable intrinsic connectivity networks: test-retest evaluation using ICA and dual regression approach. Neuroimage. 2010;49(3):2163–2177. doi:10.1016/j.neuroimage.2009.10.080
14. Nickerson LD, Smith SM, Ongur D, Beckmann CF. Using dual regression to investigate network shape and amplitude in functional connectivity analyses. Front Neurosci. 2017;11:115. doi:10.3389/fnins.2017.00115
15. Cui LB, Liu L, Guo F, et al. Disturbed brain activity in resting-state networks of patients with first-episode schizophrenia with auditory verbal hallucinations: a cross-sectional functional MR imaging study. Radiology. 2017;283(3):810–819. doi:10.1148/radiol.2016160938
16. Woodward ND, Rogers B, Heckers S. Functional resting-state networks are differentially affected in schizophrenia. Schizophr Res. 2011;130(1–3):86–93. doi:10.1016/j.schres.2011.03.010
17. Kraguljac NV, White DM, Hadley JA, et al. Abnormalities in large scale functional networks in unmedicated patients with schizophrenia and effects of risperidone. Neuroimage Clin. 2016;10:146–158. doi:10.1016/j.nicl.2015.11.015
18. Yu Q, Allen EA, Sui J, Arbabshirani MR, Pearlson G, Calhoun VD. Brain connectivity networks in schizophrenia underlying resting state functional magnetic resonance imaging. Curr Top Med Chem. 2012;12(21):2415–2425. doi:10.2174/156802612805289890
19. Pu W, Li L, Zhang H, et al. Morphological and functional abnormalities of salience network in the early-stage of paranoid schizophrenia. Schizophr Res. 2012;141(1):15–21. doi:10.1016/j.schres.2012.07.017
20. Zhou Y, Liang M, Tian L, et al. Functional disintegration in paranoid schizophrenia using resting-state fMRI. Schizophr Res. 2007;97(1–3):194–205. doi:10.1016/j.schres.2007.05.029
21. Newton R, Rouleau A, Nylander AG, et al. Diverse definitions of the early course of schizophrenia-a targeted literature review. NPJ Schizophr. 2018;4(1):21. doi:10.1038/s41537-018-0063-7
22. Kay SR, Fiszbein A, Opler LA. The positive and negative syndrome scale (PANSS) for schizophrenia. Schizophr Bull. 1987;13(2):261–276. doi:10.1093/schbul/13.2.261
23. Smith SM, Jenkinson M, Woolrich MW, et al. Advances in functional and structural MR image analysis and implementation as FSL. Neuroimage. 2004;23(Suppl 1):S208–219. doi:10.1016/j.neuroimage.2004.07.051
24. Woolrich MW, Jbabdi S, Patenaude B, et al. Bayesian analysis of neuroimaging data in FSL. Neuroimage. 2009;45(1 Suppl):S173–186. doi:10.1016/j.neuroimage.2008.10.055
25. Jenkinson M, Beckmann CF, Behrens TE, Woolrich MW, Smith SM. Fsl. Neuroimage. 2012;62(2):782–790. doi:10.1016/j.neuroimage.2011.09.015
26. Jenkinson M, Bannister P, Brady M, Smith S. Improved optimization for the robust and accurate linear registration and motion correction of brain images. Neuroimage. 2002;17(2):825–841. doi:10.1006/nimg.2002.1132
27. Smith SM. Fast robust automated brain extraction. Hum Brain Mapp. 2002;17(3):143–155. doi:10.1002/hbm.10062
28. Beckmann CF, Smith SM. Probabilistic independent component analysis for functional magnetic resonance imaging. IEEE Trans Med Imaging. 2004;23(2):137–152. doi:10.1109/TMI.2003.822821
29. Beckmann CF, DeLuca M, Devlin JT, Smith SM. Investigations into resting-state connectivity using independent component analysis. Philos Trans R Soc Lond B Biol Sci. 2005;360(1457):1001–1013. doi:10.1098/rstb.2005.1634
30. Pruim RHR, Mennes M, van Rooij D, Llera A, Buitelaar JK, Beckmann CF. ICA-AROMA: a robust ICA-based strategy for removing motion artifacts from fMRI data. Neuroimage. 2015;112:267–277. doi:10.1016/j.neuroimage.2015.02.064
31. Kiviniemi V, Starck T, Remes J, et al. Functional segmentation of the brain cortex using high model order group PICA. Hum Brain Mapp. 2009;30(12):3865–3886. doi:10.1002/hbm.20813
32. Abou-Elseoud A, Starck T, Remes J, Nikkinen J, Tervonen O, Kiviniemi V. The effect of model order selection in group PICA. Hum Brain Mapp. 2010;31(8):1207–1216. doi:10.1002/hbm.20929
33. Nichols TE, Holmes AP. Nonparametric permutation tests for functional neuroimaging: a primer with examples. Hum Brain Mapp. 2002;15(1):1–25. doi:10.1002/hbm.1058
34. Smith SM, Nichols TE. Threshold-free cluster enhancement: addressing problems of smoothing, threshold dependence and localisation in cluster inference. Neuroimage. 2009;44(1):83–98. doi:10.1016/j.neuroimage.2008.03.061
35. Gardner DM, Murphy AL, O’Donnell H, Centorrino F, Baldessarini RJ. International consensus study of antipsychotic dosing. Am J Psychiatry. 2010;167(6):686–693. doi:10.1176/appi.ajp.2009.09060802
36. Team RC. R: A Language and Environment for Statistical Computing [Computer Program]. Vienna, Austria: R Foundation for Statistical Computing; 2017.
37. Li P, Fan TT, Zhao RJ, et al. Altered brain network connectivity as a potential endophenotype of schizophrenia. Sci Rep. 2017;7(1):5483. doi:10.1038/s41598-017-05774-3
38. Ruan J, Bludau S, Palomero-Gallagher N, et al. Cytoarchitecture, probability maps, and functions of the human supplementary and pre-supplementary motor areas. Brain Struct Funct. 2018;223(9):4169–4186. doi:10.1007/s00429-018-1738-6
39. Oberhuber M, Hope TM, Seghier ML, et al. Four functionally distinct regions in the left supramarginal gyrus support word processing. Cereb Cortex. 2016;26(11):4212–4226. doi:10.1093/cercor/bhw251
40. Jeong B, Wible CG, Hashimoto R, Kubicki M. Functional and anatomical connectivity abnormalities in left inferior frontal gyrus in schizophrenia. Hum Brain Mapp. 2009;30(12):4138–4151. doi:10.1002/hbm.20835
41. Sarpal DK, Robinson DG, Lencz T, et al. Antipsychotic treatment and functional connectivity of the striatum in first-episode schizophrenia. JAMA Psychiatry. 2015;72(1):5–13. doi:10.1001/jamapsychiatry.2014.1734
42. Li S, Hu N, Zhang W, et al. Dysconnectivity of multiple brain networks in schizophrenia: a meta-analysis of resting-state functional connectivity. Front Psychiatry. 2019;10:482. doi:10.3389/fpsyt.2019.00482
43. Cui LB, Cai M, Wang XR, et al. Prediction of early response to overall treatment for schizophrenia: a functional magnetic resonance imaging study. Brain Behav. 2019;9(2):e01211. doi:10.1002/brb3.1211
44. Park JI, Kim GW, Jeong GW, Yang JC. Brain activation patterns associated with the effects of fearful distractors during working memory maintenance in patients with schizophrenia. Clin Psychopharmacol Neurosci. 2019;17(1):54–63. doi:10.9758/cpn.2019.17.1.54
45. Perez-Bellido A, Anne Barnes K, Crommett LE, Yau JM. Auditory frequency representations in human somatosensory cortex. Cereb Cortex. 2018;28(11):3908–3921. doi:10.1093/cercor/bhx255
46. Whitfield-Gabrieli S, Thermenos HW, Milanovic S, et al. Hyperactivity and hyperconnectivity of the default network in schizophrenia and in first-degree relatives of persons with schizophrenia. Proc Natl Acad Sci U S A. 2009;106(4):1279–1284. doi:10.1073/pnas.0809141106
47. Ongur D, Lundy M, Greenhouse I, et al. Default mode network abnormalities in bipolar disorder and schizophrenia. Psychiatry Res. 2010;183(1):59–68. doi:10.1016/j.pscychresns.2010.04.008
48. Camchong J, MacDonald AW
49. Tu PC, Lee YC, Chen YS, Li CT, Su TP. Schizophrenia and the brain’s control network: aberrant within- and between-network connectivity of the frontoparietal network in schizophrenia. Schizophr Res. 2013;147(2–3):339–347. doi:10.1016/j.schres.2013.04.011
50. Kaufmann T, Skatun KC, Alnaes D, et al. Disintegration of sensorimotor brain networks in schizophrenia. Schizophr Bull. 2015;41(6):1326–1335. doi:10.1093/schbul/sbv060
51. Kaufman AS, Lichtenberger EO. Essentials of WAIS-III Assessment. Hoboken, NJ, US: John Wiley & Sons Inc; 1999.
52. Groth-Marnat G, Teal M. Block design as a measure of everyday spatial ability: a study of ecological validity. Percept Mot Skills. 2000;90(2):522–526. doi:10.2466/pms.2000.90.2.522
53. Nejad AB, Ebdrup BH, Glenthoj BY, Siebner HR. Brain connectivity studies in schizophrenia: unravelling the effects of antipsychotics. Curr Neuropharmacol. 2012;10(3):219–230. doi:10.2174/157015912803217305
54. Li F, Lui S, Yao L, et al. Longitudinal changes in resting-state cerebral activity in patients with first-episode schizophrenia: a 1-year follow-up functional MR imaging study. Radiology. 2016;279(3):867–875. doi:10.1148/radiol.2015151334
 © 2020 The Author(s). This work is published and licensed by Dove Medical Press Limited. The full terms of this license are available at https://www.dovepress.com/terms.php and incorporate the Creative Commons Attribution - Non Commercial (unported, v3.0) License.
By accessing the work you hereby accept the Terms. Non-commercial uses of the work are permitted without any further permission from Dove Medical Press Limited, provided the work is properly attributed. For permission for commercial use of this work, please see paragraphs 4.2 and 5 of our Terms.
© 2020 The Author(s). This work is published and licensed by Dove Medical Press Limited. The full terms of this license are available at https://www.dovepress.com/terms.php and incorporate the Creative Commons Attribution - Non Commercial (unported, v3.0) License.
By accessing the work you hereby accept the Terms. Non-commercial uses of the work are permitted without any further permission from Dove Medical Press Limited, provided the work is properly attributed. For permission for commercial use of this work, please see paragraphs 4.2 and 5 of our Terms.