")
Back to Journals » Neuropsychiatric Disease and Treatment » Volume 14
Aberrant cortical thickness in neurologically asymptomatic patients with end-stage renal disease
Authors Dong J, Ma X , Lin W, Liu M, Fu S, Yang L , Jiang G
Received 4 April 2018
Accepted for publication 24 May 2018
Published 2 August 2018 Volume 2018:14 Pages 1929—1939
DOI https://doi.org/10.2147/NDT.S170106
Checked for plagiarism Yes
Review by Single anonymous peer review
Peer reviewer comments 3
Editor who approved publication: Professor Wai Kwong Tang
Jianwei Dong,1,* Xiaofen Ma,2,* Wuhong Lin,1 Mengchen Liu,2 Shishun Fu,2 Lihua Yang,1 Guihua Jiang2
1School of Mathematics, Sun Yat-Sen University, Guangzhou, People’s Republic of China; 2Department of Medical Imaging, Guangdong No. 2 Provincial People’s Hospital, Guangzhou, People’s Republic of China
*These authors contributed equally to this work
Purpose: The aim of this study is to investigate the morphology of cortical gray matter in patients with end-stage renal disease (ESRD) and the relationship between cortical thickness and kidney function.
Patients and methods: Three-dimensional high-resolution brain structural magnetic resonance imaging data were collected from 35 patients with ESRD (28 men, 18–61 years old) and 40 age- and gender-matched healthy controls (HCs, 32 men, 22–58 years old). Vertex-wise analysis was then performed to compare the brains of the patients with ESRD with those of HCs to identify abnormalities in the brains of the former. Multiple biochemical measures of renal metabolin, vascular risk factors, general cognitive ability, and dialysis duration were correlated with brain morphometry alterations for the patients.
Results: Patients with ESRD showed lesser cortical thickness than the HCs. The most significant cluster with decreased cortical thickness was found in the right prefrontal cortex (P<0.05, random-field theory correction). In addition, the four local peak vertices in the prefrontal cluster were lateral prefrontal cortex (Peaks 1 and 2), medial prefrontal cortex (Peak 3), and ventral prefrontal cortex (Peak 4). Significant negative correlations were observed between the cortical thicknesses of all four peak vertices and blood urea nitrogen; a negative correlation, between the cortical thickness in three of four peaks and serum creatinine; and a positive correlation, between cortical thickness in the medial prefrontal cortex (Peak 3) and hemoglobin.
Conclusion: These results provided compelling evidence for cortical abnormality of ESRD patients and suggested that kidney function may be the key factor for predicting changes of brain tissue structure.
Keywords: cortical thickness, kidney function, vertex-wise analysis, multivariate analysis, brain morphometry alterations
Introduction
End-stage renal disease (ESRD) typically occurs when chronic renal failure progresses to a point where the kidneys are permanently functioning at less than 10% of their capacities.1 Apart from central nervous system abnormalities and neurologic problems,2,3 ESRD significantly elevates the risk of developing cognitive impairments and death rate.4,5 Therefore, detecting brain abnormalities in neurologically asymptomatic patients with ESRD is crucial to early diagnosis, prognosis improvement, and ultimately the reduction of death rate. Neuroimaging techniques provide potential avenues for these goals and enable the detection of ESRD-related abnormalities in white matter (WM) integrity,6–8 gray matter (GM) volume,9 and functional architecture.10,11 These pioneering studies have largely contributed to our understanding of the disease. However, the neuropathologic substrate underlying ESRD cannot be established well, particularly at the structure level from a cortical GM morphology perspective.
The morphology of cortical GM is commonly assessed using T1-weighted magnetic resonance imaging (MRI) with automated computerized methods, such as voxel-based morphometry (VBM). Most previous studies in this field analyzed regional alterations in the brain GM volume or density in patients with ESRD.10,12,13 For example, Ma et al10 found that the brain GM volumes in the bilateral medial prefrontal gyrus, anterior cingulate gyrus, superior temporal gyrus, middle temporal gyrus, lingual gyrus, parahippocampa gyrus, putamen, caudate, insula, and right middle cingulate gyrus were reduced in patients with ESRD. Zhang et al13 found that patients with ESRD showed diffusely decreased GM volume, which further decreased in the presence of encephalopathy. They also discovered that the GM volumes in these areas were negatively correlated with serum urea level. Qiu et al12 showed that the GM volume in the bilateral medial orbital-prefrontal cortices, bilateral dorsal lateral prefrontal cortices, and left middle temporal cortices of patients with ESRD considerably decreased. However, VBM is influenced by registration strategies and the choice of a normalization template.14,15 In addition, VBM analysis may provide a mixed measure of GM alteration combined with abnormalities in cortical thickness, cortical surface area, and cortical folding.16,17 These factors potentially reduce the sensitivity of VBM analysis for detecting significant effects of brain structural abnormalities in diseased brains.
Structural neuroimaging studies have largely focused on volumetric measures of the cerebral cortex.12,13 This metric is, however, a composite measure derived from the product of cortical surface area and cortical thickness, each of which may in turn be differentially affected by a variety of factors. It is, therefore, surprising that there have been relatively few studies focusing on the analyses of cortical thickness or surface area as discrete measures in patients with ESRD. In this study, we investigated ESRD-related alterations in the morphology of cortical GM. These alterations might be a more appropriate measure than GM volume when evaluating morphologic abnormalities in the brain structure.18–21 Cortical thickness can provide valuable information of brain neuroanatomy, and it reflects the size, density, and arrangement of cells (neurons, neuroglia, and nerve fibers). Moreover, cortical thickness can represent a more sensitive and complementary measure of brain structure change than standard MRI-based volumetry in patients with ESRD. Based on previous structural and functional studies on ESRD, we hypothesized that cortical thickness in certain areas of the brain can be altered, especially in the orbito-prefrontal cortices, bilateral dorsal lateral prefrontal cortices, and the left middle temporal cortex10,12 of individuals with ESRD, and that the nephrotoxicity or duration of dialysis is associated with altered cortical thickness. To test this hypothesis, we calculated the cortical thickness in patients with ESRD and control groups using vertex-wise methods. Simultaneously, our aim is to determine the brain structure changes in patients with ESRD by calculating cortical thickness of the entire brain and to explore whether changes in renal function and cortical thickness may be predicted or correlated with each other. Our results provided direct evidence for cortical GM disturbances in ESRD at the structural level.
Patients and methods
Participants
A total of 38 patients with ESRD (all right-handed) were recruited from the Renal Transplantation Department of Guangdong No. 2 Provincial People’s Hospital, Guangzhou, China, from August 2011 to July 2013. The exclusion criteria were as follows: 1) psychiatric disorders or major neurologic disorders (eg, severe head injury, stroke, epilepsy, or visible lesions); 2) ischemic diseases including acute ischemic cerebrovascular disease, acute peripheral arterial occlusion, and advanced liver or heart failure; 3) asymptomatic coronary ischemia by electrocardiogram testing; 4) a history of diabetes; and 5) substance abuse, particularly drugs, alcohol, and cigarettes. Conventional MR images were examined by an experienced radiologist who was blinded to whether the images were from the patient or control group. Three patients were excluded because of abnormal hyperintensities in their T2-weighted-fluid-attenuated inversion recovery (T2-FLAIR) MR images. Therefore, 35 patients with ESRD (28 males, 7 females; mean age 37.5±11.3 years, range 18–61 years) were included in the final analysis. Because Guangdong No. 2 Provincial People’s Hospital is an affiliated hospital of Southern Medical University, ethical approval was provided by the Research Ethics Review Board of the Institute of Mental Health at the Southern Medical University, and written informed consent was obtained from each participant.
All the patients completed biochemical tests, such as serum creatinine, urea level, hemoglobin level, cholesterol level, serum albumin level, serum kalium, and serum calcium within 24 hours before the MRI. In this study, none of the patients were on erythropoiesis-stimulating agents (ESAs) and treated with vitamin D, calcitriol, and/or phosphorus-chelating agents, ASE, whereas they were treated with intravenous iron. Indeed, intravenous iron can raise levels of hemoglobin even without the use of ESAs and enhance the efficacy of ESAs, and also has non-erythropoietic effects including improvement in physical performance, cognition, and amelioration of restless leg syndrome.22 We did not check the serum parathyroid hormone (PTH) level for the patients with ESRD. The serum calcium levels were corrected with serum albumin levels using the Payne’s formula.23 The dialysis modality and duration (15.5±6.6 months) were also recorded from the medical history of patients. All the patients underwent a neuropsychological test involving a mini-mental state examination (MMSE).24
Forty age- and gender-matched healthy controls (HCs) (all right handed; 32 males, 8 females; mean age of 41.5±10.6 years, range 22–58 years) were recruited from the local community. All the HCs had normal renal functions, having no detected abnormalities in abdominal MRI and no physical disease or history of psychiatric or neurologic diseases. All the demographic and clinical information is summarized in Table 1.
 | Table 1 Demographics and clinical characteristics of all participants |
Data acquisition
All participants were scanned using a 1.5 T MR scanner (Achieva Nova-Dual; Philips, Best, the Netherlands) at the Department of Medical Imaging, Guangdong No. 2 Provincial People’s Hospital. The conventional imaging sequences, including T1-weighted images and T2-FLAIR images, were obtained for each participant to detect clinically silent lesions. High-resolution anatomical images were acquired using a T1-weighted three-dimensional volumetric magnetization-prepared rapidly acquired gradient-echo (MPRAGE) sequence set at the following parameters: repetition time=1,600 ms; echo time=2.13 ms; flip angle=9°; inversion time (TI)=1,000 ms; slice thickness=1 mm; no gap; in-plane resolution=1×1 mm2; and matrix=256×224×176. For each participant, resting-state functional MRI (fMRI) data and diffusion-weighted imaging were also acquired but were not used in the current study.
Image processing
Cortical thickness was estimated using three-dimensional MPRAGE images from patients with ESRD and HCs with the use of FreeSurfer software package (Version 5.3.0, http://surfer.nmr.mgh.harvard.edu),62 a widely documented and automated program for reconstructing brain cortical surfaces.25–27
The brain cortical surface reconstruction included the following steps: 1) brain extraction using a hybrid watershed/surface deformation procedure; 2) automated segmentation to obtain the cerebrospinal fluid (CSF), WM, and deep GM structures; 3) generation of the cutting planes to separate two hemispheres and subcortical structures; 4) repairmen of the interior holes of the segmentation; 5) a triangular mesh tessellation of the GM–WM boundary and the mesh deformation over the GM–WM boundary to form the GM–WM interface (white surface) and the GM–CSF interface (pial surface); 6) automatic fixation of the topologic defects on the surface; 7) inflation of the individual mesh surface; and 8) registration of all individual cortical surfaces to a common surface template (fsaverage).
Cortical thickness was measured during the reconstruction as follows: two distances were estimated for each vertex: the shortest distance between a given point on an estimated pial surface and white surface and that between a given point on the white surface and an estimated pial surface. These distances were averaged to estimate the cortical thickness. After the normalization to a common template, the cortical thickness was smoothed with a 25-mm full-width-half-maximum Gaussian kernel to improve the signal-to-noise ratio and statistical power.
Statistical analysis
We performed multivariate analysis to examine the differences between the cortical thicknesses of the patients with ESRD and those of HCs. SurfStat software was used for the surface-based analysis, and general linear models (http://www.math.mcgill.ca/keith/surfstat/)63 were used. Two-sample t-tests were performed to compare the cortical thickness between the two groups. The mean cortical thickness from each participant was used as covariate. The resulting T-maps were corrected for multiple comparisons using the random-field theory (RFT) correction method at a P-value of <0.05.
To estimate whether demographic and clinical information affects the changes in cortical thickness in patients with ESRD, we calculated the Pearson correlations between the indices (demographic and clinical) and cortical thickness in a local peak vertex from the between-group difference results. The correlations were considered significant at a threshold of P<0.05.
Results
Demographic and clinical characteristics
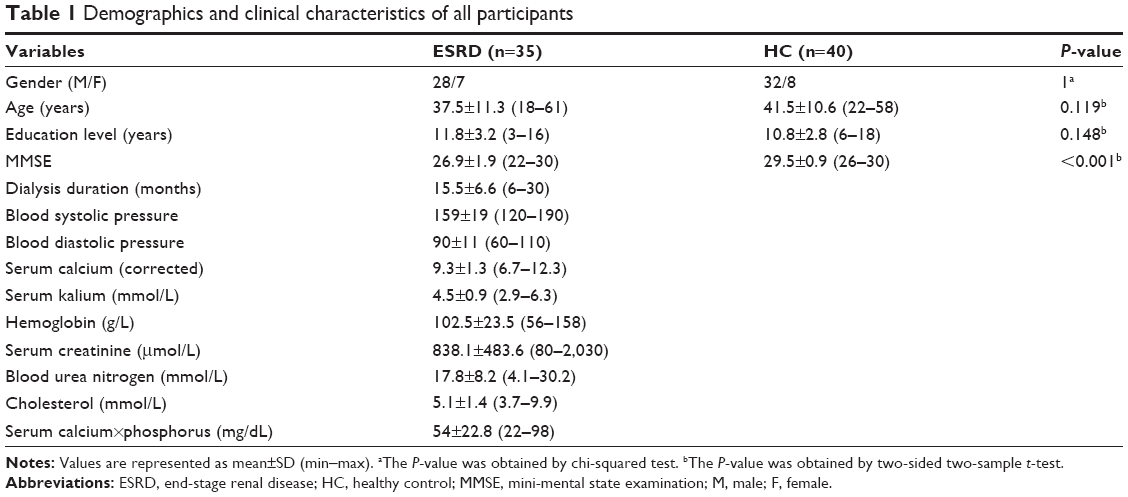
Thirty-five patients with ESRD (28 males, 7 females; mean age of 37.5±11.3 years, range of 18–61 years) and 40 HCs (32 males, 8 females; mean age of 41.5±10.6 years, range of 22–58 years) were included in the final analysis. As shown in Table 1, no significant difference was observed in gender (P=1), age (P=0.119), or education level (P=0.148) between the ESRD and HC groups. Patients with ESRD had lower MMSE score than HCs (P<0.001). The mean duration of hemodialysis for the patients was 15.5±6.6 months. The mean calcium, kalium, hemoglobin, creatinine, urea, and cholesterol levels for the patients were 2.3±0.2 mmol/L, 4.5±0.9 mmol/L, 102.5±23.5 g/L, 838.1±483.6 μmol/L, 17.8±8.2 mmol/L, and 5.1±1.4 mmol/L, respectively (Table 1).
Between-group differences in cortical thickness
Figure 1 displays the difference in cortical thickness between patients with ESRD and HCs. The patients with ESRD showed lower cortical thicknesses than HCs. The most significant cluster with decreased cortical thickness was found in the right prefrontal cortex (P<0.05, RFT correction). Four local peak vertices were observed in the prefrontal cluster as shown in Figure 2. Their MNI coordinates are Peak 1 (25.438, 42.1878, 23.7868), Peak 2 (27.191, 51.987, 8.085), Peak 3 (28.108, 34.569, −10.259), and Peak 4 (2.543, 39.725, −19.244), respectively. Peaks 1 and 2 were in the lateral prefrontal cortex, Peak 3 was located in the medial prefrontal cortex, and Peak 4 was in the ventral prefrontal cortex. No increase in cortical thickness was observed in the ESRD group at the same statistical threshold.
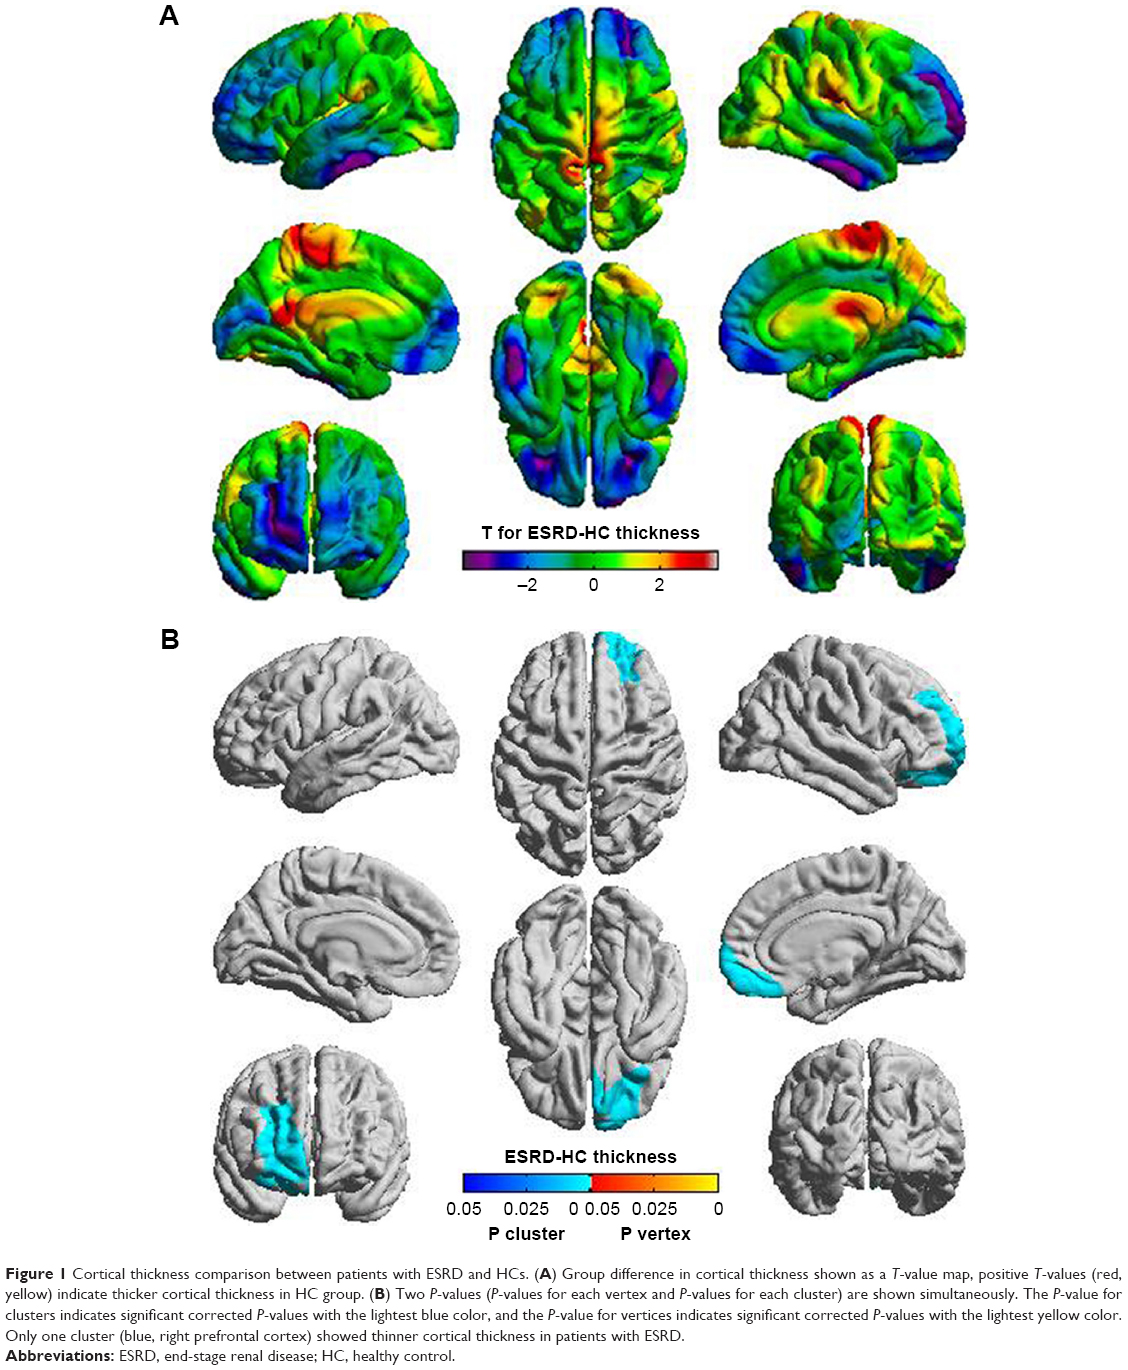 | Figure 1 Cortical thickness comparison between patients with ESRD and HCs. (A) Group difference in cortical thickness shown as a T-value map, positive T-values (red, yellow) indicate thicker cortical thickness in HC group. (B) Two P-values (P-values for each vertex and P-values for each cluster) are shown simultaneously. The P-value for clusters indicates significant corrected P-values with the lightest blue color, and the P-value for vertices indicates significant corrected P-values with the lightest yellow color. Only one cluster (blue, right prefrontal cortex) showed thinner cortical thickness in patients with ESRD. |
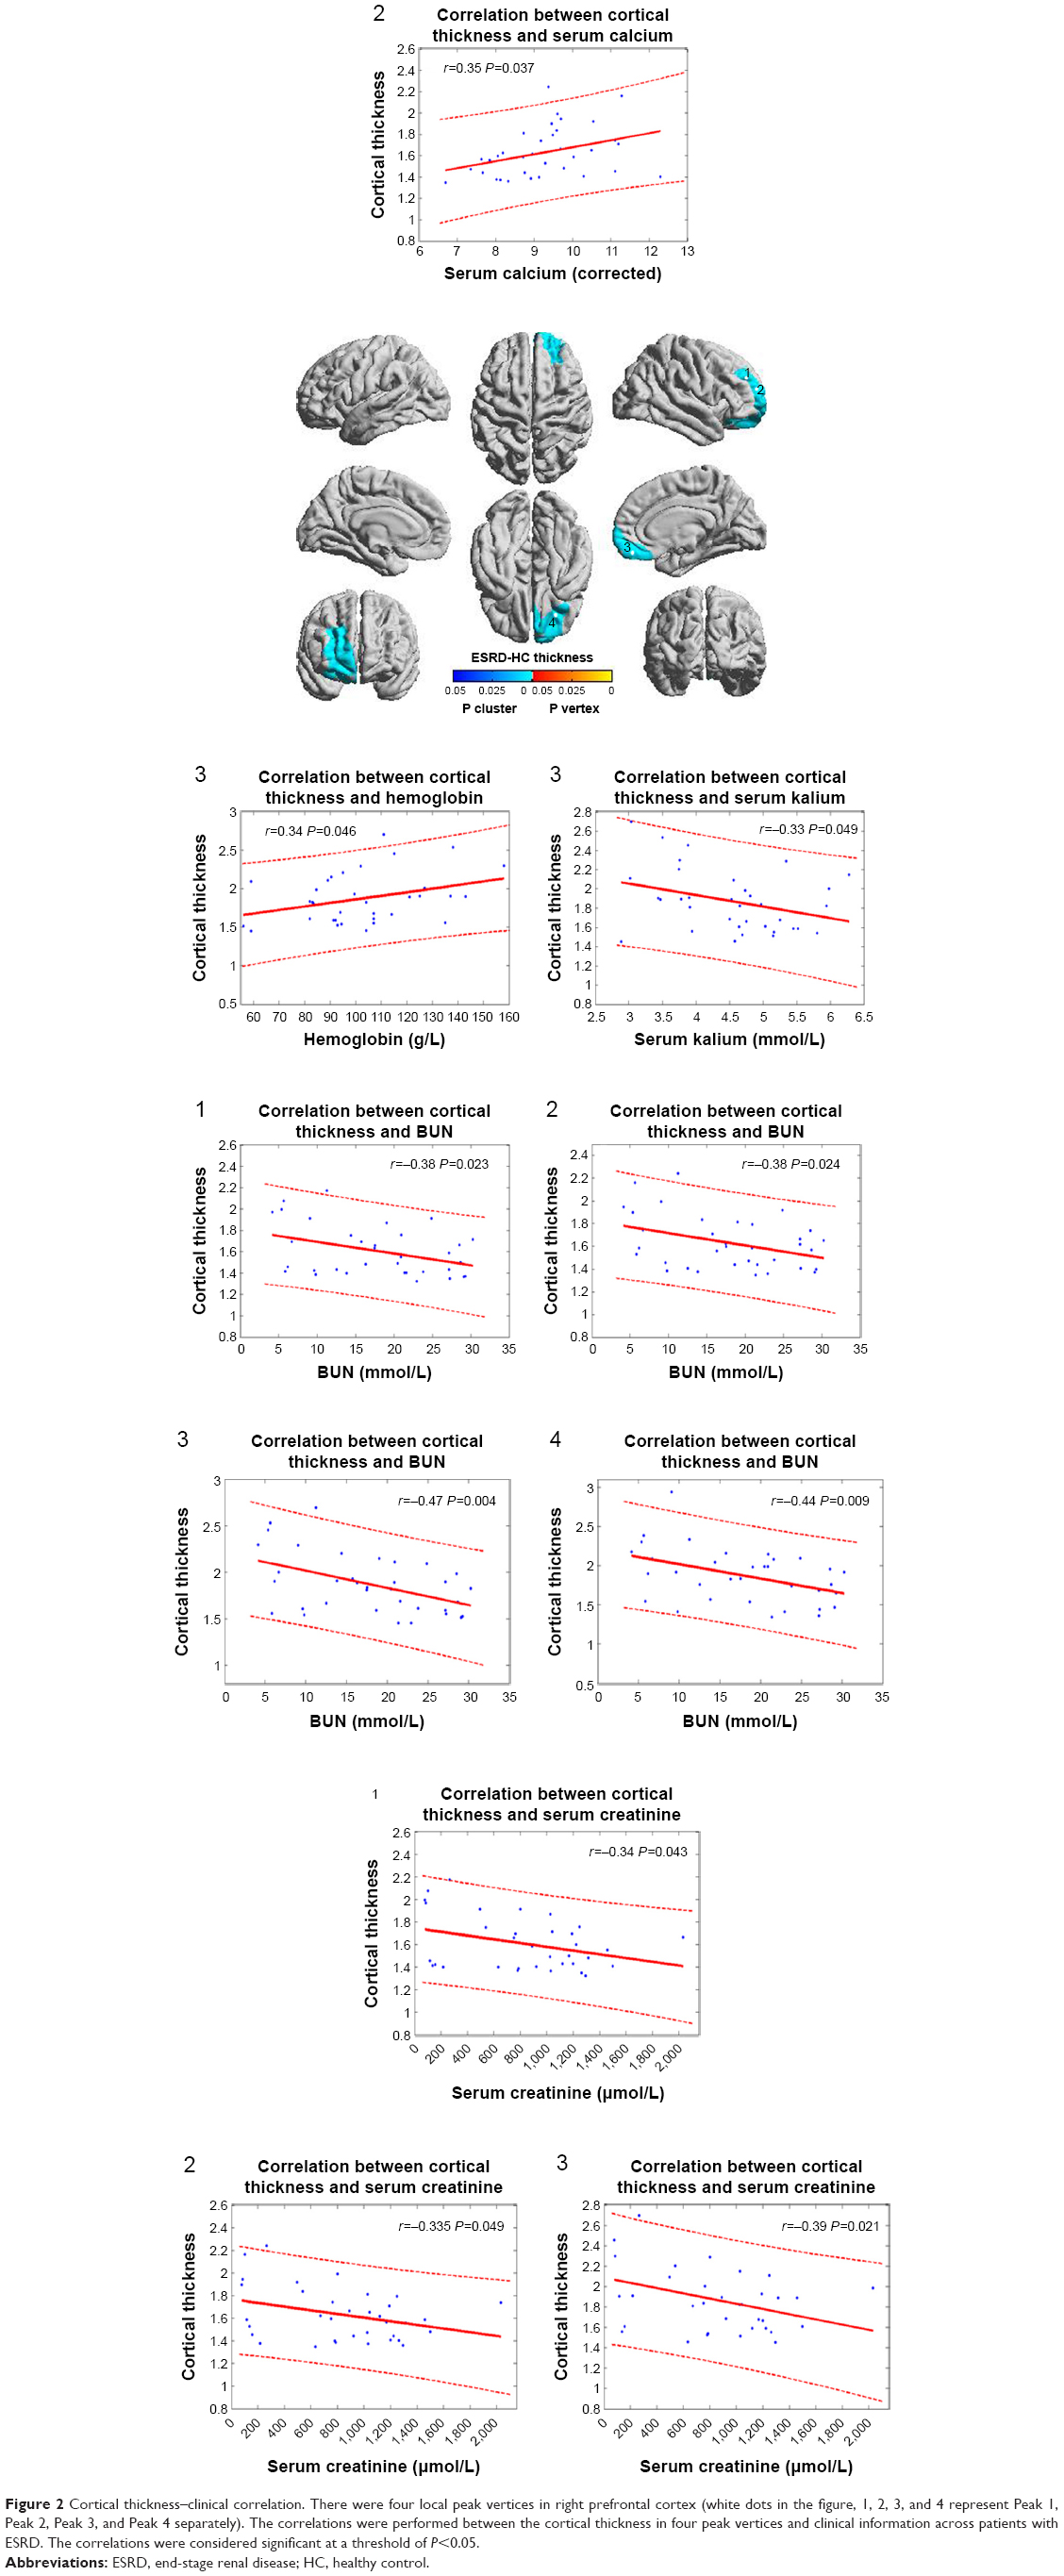 | Figure 2 Cortical thickness–clinical correlation. There were four local peak vertices in right prefrontal cortex (white dots in the figure, 1, 2, 3, and 4 represent Peak 1, Peak 2, Peak 3, and Peak 4 separately). The correlations were performed between the cortical thickness in four peak vertices and clinical information across patients with ESRD. The correlations were considered significant at a threshold of P<0.05. |
Cortical thickness–clinical relationship
For the ESRD patients, cortical thicknesses from the four local peak vertices were correlated with demographic and clinical information across subjects to delineate the demographic and clinical factor resulting in the observed differences in the cortical thickness.
In patients with ESRD, correlation analysis revealed no significant correlations between the cortical thicknesses of all the four peak vertices and the MMSE scores (P>0.05), and the cortical thicknesses of all the four peak vertices showed negative correlation with blood urea nitrogen (BUN) (Peak 1: r=−0.384, P=0.023; Peak 2: r=−0.38, P=0.024; Peak 3: r=−0.47, P=0.004; and Peak 4: r=−0.44, P=0.009). The cortical thickness in three of the four peak vertices showed negative correlation with serum creatinine (Peak 1: r=−0.34, P=0.043; Peak 2: r=−0.335, P=0.049; and Peak 3: r=–0.39, P=0.021). By contrast, the cortical thickness in Peak 3 located in the medial prefrontal cortex was positively correlated with hemoglobin (r=0.34, P=0.046) and negatively correlated with serum kalium (r=−0.33, P=0.049). Another positive correlation was observed between the cortical thickness in Peak 2 and corrected serum calcium (r=0.35, P=0.037). The scatter plots of all these correlations are visualized in Figure 2, and all significant correlation results are shown in Table 2.
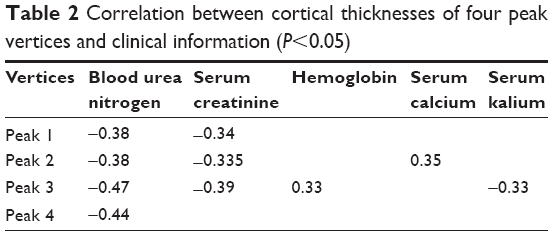 | Table 2 Correlation between cortical thicknesses of four peak vertices and clinical information (P<0.05) |
Discussion
Using vertex-wise methods, we explored the differences between the ESRD and HC group with respect to cortical thickness. The vertex-wise surface-based morphometry (SBM) analysis indicated that compared with HCs, ESRD showed significantly decreased cortical thickness in clusters primarily located in the right prefrontal cortex of the brain, which includes four local peak vertices in the prefrontal cluster, such as lateral prefrontal cortex (Peaks 1 and 2), medial prefrontal cortex (Peak 3), and ventral prefrontal cortex (Peak 4). Significant negative correlations were also observed between the BUN and cortical thicknesses of all four peak vertices in patients with ESRD. Cortical thickness in three peak vertices showed negative correlation with serum creatinine. Cortical thickness in Peak 3, located in the medial prefrontal cortex, was positively correlated with hemoglobin but negatively correlated with serum kalium. A positive correlation was observed between cortical thickness in Peak 2 and corrected serum calcium.
Renal failure results in accumulation of numerous organic substances that possibly act as uremic neurotoxins, but no single metabolite has been identified as the sole cause of uremia.28 Accumulation of urea, guanidino compounds, uric acid, various amino acids, and “middle molecules” has been reported in the literature.29,30 Among the guanidino compounds, guanidine and creatinine were found to be highly increased in serum, CSF, and brain of uremic patients.31 De Deyn et al reported that CSF and brain levels of some guanidine compounds, such as creatinine, guanidine, guanidinosuccinic acid, and methylguanidine, are substantially elevated in uremic patients.32 Interestingly, these high toxin concentrations (up to ten-fold higher in chronic kidney disease (CKD) patients than in controls) were found in brain regions that play a determinant role in cognition, such as the thalamus, the mamillary bodies, and the cerebral cortex.32 Moreover, more than 30 years ago, Passer reported a high prevalence of cerebral atrophy (CA) in patients undergoing long-term hemodialysis.33 It was subsequently shown in such patients that the lesions were prominent in the frontal lobes.34,35 In addition, in patients with ESRD, alterations in the brain morphometry of the right prefrontal cortex are also supported by a recent histologic study by Frias et al.36 The reduced brain-derived neurotrophic factor is often associated with the atrophy and cellular death of glia and neurons in neurodegenerative disorders. Previous positron emission tomography (PET) studies also revealed abnormalities in these areas. In an F-18-fluorodeoxyglucose PET study, Song et al37 found several voxel clusters of significantly decreased cerebral glucose metabolism in patients with predialysis CKD. These clusters include the left prefrontal cortex (Brodmann’s area 9), right prefrontal cortex (Brodmann’s area 10), right basolateral prefrontal cortex (Brodmann’s area 46), left anterior cingulate gyrus (Brodmann’s area 32), left premotor cortex (Brodmann’s area 6), left transverse temporal gyrus (Brodmann’s area 41), left superior temporal gyrus (Brodmann’s area 42), right basolateral prefrontal cortex (Brodmann’s area 44), right inferior parietal lobule (Brodmann’s area 39), left middle temporal gyrus (Brodmann’s area 19), and left angular gyrus (Brodmann’s area 39).37 In the present study, VBM analysis results indicated a significant decrease in the GM volumes in the bilateral prefrontal cortices of the patients with ESRD.12 Further study by Zhang et al13 showed diffusely decreased GM volumes of the frontal lobe in patients with ESRD by comparing minimal nephron-encephalopathy (MNE) and non-MNE with controls. They found that serum urea was negatively associated with the changes in GM volume in many regions (bilateral occipital lobes, bilateral lingual lobes, bilateral calcarine, bilateral superior temporal gyri, bilateral temporal poles, bilateral uncus, posterior cingulate cortex/precuneus/cuneus, right fusiform, right parahippocampus, right amygdala, and left hippocampus/parahippocampus).13 However, VBM analysis may have reduced sensitivity to the significant effects of brain structural abnormalities in diseased brains because of the GM alterations and the abnormalities in cortical thickness, cortical surface area, and cortical folding.16,17
In this study, we used SBM analyses over VBM to provide more precise information with morphometry in ESRD. ESRD showed significantly decreased cortical thickness in clusters primarily located in the right prefrontal cortex. The prefrontal cortex subserves cognitive control. In the human brain, the areas of the prefrontal cortex are involved in the mediation of cognitive control processes for motor behavior38–40 and evaluation of motivational responses to behavioral and environmental feedback.39,41,42 Thus, our result may imply early imaging manifestations of ESRD-related functional impairment. Numerous clinical studies suggested that ESRD significantly elevates the risk of developing cognitive impairments.43–45 The brain morphologic changes detected in our study may serve as brain structural bases of cognitive impairment in ESRD. Several fMRI studies have a similar finding, that is, disrupted functional integration in ESRD, particularly in the prefrontal cortex.10,11 This evidence suggests that prefrontal cortex plays a decisive role in the progress of cognitive impairment in ESRD and is a potential observation indicator of cognitive change in ESRD.
In addition, certain correlations were observed between morphometry alterations and blood biochemical indicators. The four local peak vertices in the prefrontal cluster were lateral prefrontal cortex (Peaks 1 and 2), medial prefrontal cortex (Peak 3), and ventral prefrontal cortex (Peak 4). Significant negative correlations were observed between BUN and cortical thicknesses of all the four peak vertices. A negative correlation was observed between serum creatinine and cortical thicknesses in three peaks, whereas a positive correlation was observed between cortical thickness in the medial prefrontal cortex (Peak 3) and hemoglobin. ESRD is typically accompanied by low hemoglobin levels, which could further lead to malnutrition. Previous studies showed that chronic malnutrition can result in insufficient nutrient supply to the brain, thereby triggering a series of problems, including brain tissue hypoxia and blood viscosity reduction and eventual hypoperfusion and/or hypometabolism.46,47 Recent studies highlighted the importance of normal metabolism in establishing and retaining interregional coordination in the brain,48,49 which is the basis of cognitive processing.50 Given that low hemoglobin is associated with poor mental health in ESRD,51,52 morphometry alterations of the prefrontal cortex may contribute to cognitive disturbances in ESRD because of insufficient energy metabolism in the brain because of low hemoglobin levels. We also found significant negative correlations between BUN and the cortical thicknesses of all four peak vertices and a negative correlation between serum creatinine and cortical thicknesses in three peaks. Galons et al53 reported the major role of urea in the pathogenesis of cerebral edema in dialysis disequilibrium syndrome. Zhang et al13 found that serum urea levels play an important role in ESRD MNE using VBM method; this result was consistent with our results. Uremic toxins, such as serum urea and creatinine, accumulated in vivo in the brains of patients with ESRD because of renal failure.54,55 Our results may provide several objective evidence of neuronal damage due to nephrotoxic substances.
Our study has several limitations. First, the sample size was relatively small, and the MRI scanning parameters were suboptimal. Thus, the detection of subtle effects was limited. Future studies must use a large cohort of participants, advanced techniques, and optimized parameters. Second, depression may complicate ESRD. A recent study found that depression itself can affect the alterations in the neurons.56,57 Thus, a more rigorous experiment is necessary to exclude the influence of depression in the future study. Third, another main limitation of the study is that all of the ESRD patients received regular hemodialysis at the time of the fMRI study. Whether and how hemodialysis itself can affect the brain is unknown; however, it can affect the patient’s cognitive function.58,59 Although we did not find significant correlation between the abnormal cortical thickness and hemodialysis duration, a more detailed experiment with CKD (stages 4–5) without hemodialysis is required in the future study. Finally, we did not collect clinical information on Kt/V and episodes of dialytic hypotension for the patients. Consequently, we could not exclude the possibility that the current findings may be confounded by other factors, such as hemodialysis modality. As our project progresses, we will address these interesting questions with more rigorous experimental design and stricter enrollment criteria. In addition, a study has shown that all three tested dialysis modes did not differ in urea dialysis dose (Kt/V) as a parameter of small molecular weight removal.60 The patients showed mild CA on the basis of cortical sulci exceeding 3 mm in breadth and an Evans ratio exceeding 0.31, for a total of 14 degrees of CA (mean 0.9±1), and further conclusions indicated that CA in this patient group can only be attributed to uremia-related pathology and that it tends to worsen as regular hemodialysis treatment continues.61
In conclusion, we detected alterations in the cortical thicknesses of the prefrontal cortices of patients with ESRD through a surface-based morphometric analysis. Our findings were consistent with those of previous studies, which reported the presence of abnormalities in key brain regions in the brains of patients with ESRD. To the best of our knowledge, this is one of the first studies to evaluate the difference between patients with ESRD and HCs with respect to cortical thickness. Our findings suggested that abnormal cortical thickness in the prefrontal cortex has more considerable effect on cognitive capacities of patients in the ESRD group than in the normal group. We detected negative correlations between the cortical thickness in the lateral prefrontal cortex, medial prefrontal cortex, and ventral prefrontal cortex, and BUN and serum creatinine. By contrast, a positive correlation was observed between cortical thickness in the medial prefrontal cortex and hemoglobin. These results may contribute vital information to the limited literature on brain structural alterations in ESRD.
Conclusion
In summary, this study provided evidence for the first time that ESRD showed thinner cortical thickness than the HCs by combining resting-state fMRI technique and vertex-wise analysis. ESRD had the most significant cluster with decreased cortical thickness, which was found in the right prefrontal cortex (P<0.05, RFT corrected) than HCs. Moreover, significant negative correlations were observed between the cortical thicknesses of all four peak vertices and BUN; negative correlations, between the cortical thickness in three of four peaks and serum creatinine; and a positive correlation, between cortical thickness in the medial prefrontal cortex (Peak 3) and hemoglobin. These results provided compelling evidence for cortical abnormality in ESRD and also suggested that kidney function may be a critical factor associated with the brain alteration.
Acknowledgment
This study is supported by National Natural Science Foundation of China (Nos. 11771458, 81471639, 81771807), Guangdong Province Key grant (No. 2016B030307003), and Natural Science Foundation of Guangdong (Nos. 2015A030313723, 2016A020215125, 201607010056, 2017A020215077).
Author contributions
All authors contributed toward data analysis, drafting and revising the paper and agree to be accountable for all aspects of the work.
Disclosure
The authors report no conflicts of interest in this work.
References
Foley RN, Collins AJ. End-stage renal disease in the United States: an update from the United States Renal Data System. J Am Soc Nephrol. 2007;18(10):2644–2648. | ||
De Deyn PP, Saxena VK, Abts H, et al. Clinical and pathophysiological aspects of neurological complications in renal failure. Acta Neurol Belg. 1992;92(4):191–206. | ||
Brouns R, De Deyn PP. Neurological complications in renal failure: a review. Clin Neurol Neurosurg. 2004;107(1):1–16. | ||
Kurella Tamura M, Yaffe K. Dementia and cognitive impairment in ESRD: diagnostic and therapeutic strategies. Kidney Int. 2011;79(1):14–22. | ||
Raphael KL, Wei G, Greene T, Baird BC, Beddhu S. Cognitive function and the risk of death in chronic kidney disease. Am J Nephrol. 2012;35(1):49–57. | ||
Hsieh TJ, Chang JM, Chuang HY, et al. End-stage renal disease: in vivo diffusion-tensor imaging of silent white matter damage. Radiology. 2009;252(2):518–525. | ||
Kim HS, Park JW, Bai DS, et al. Diffusion tensor imaging findings in neurologically asymptomatic patients with end stage renal disease. NeuroRehabilitation. 2011;29(1):111–116. | ||
Chou MC, Hsieh TJ, Lin YL, et al. Widespread white matter alterations in patients with end-stage renal disease: a voxelwise diffusion tensor imaging study. AJNR Am J Neuroradiol. 2013;34(10):1945–1951. | ||
Prohovnik I, Post J, Uribarri J, Lee H, Sandu O, Langhoff E. Cerebrovascular effects of hemodialysis in chronic kidney disease. J Cereb Blood Flow Metab. 2007;27(11):1861–1869. | ||
Ma X, Jiang G, Li S, et al. Aberrant functional connectome in neurologically asymptomatic patients with end-stage renal disease. PLoS One. 2015;10(3):e0121085. | ||
Ma X, Tian J, Wu Z, et al. Spatial disassociation of disrupted functional connectivity for the default mode network in patients with end-stage renal disease. PLoS One. 2016;11(8):e0161392. | ||
Qiu Y, Lv X, Su H, Jiang G, Li C, Tian J. Structural and functional brain alterations in end stage renal disease patients on routine hemodialysis: a voxel-based morphometry and resting state functional connectivity study. PLoS One. 2014;9(5):e98346. | ||
Zhang LJ, Wen J, Ni L, et al. Predominant gray matter volume loss in patients with end-stage renal disease: a voxel-based morphometry study. Metab Brain Dis. 2013;28(4):647–654. | ||
Bookstein FL. “Voxel-based morphometry” should not be used with imperfectly registered images. Neuroimage. 2001;14(6):1454–1462. | ||
Jones DK, Symms MR, Cercignani M, Howard RJ. The effect of filter size on VBM analyses of DT-MRI data. Neuroimage. 2005;26(2):546–554. | ||
Hester R, Nestor L, Garavan H. Impaired error awareness and anterior cingulate cortex hypoactivity in chronic cannabis users. Neuropsychopharmacology. 2009;34(11):2450–2458. | ||
Voets NL, Hough MG, Douaud G, et al. Evidence for abnormalities of cortical development in adolescent-onset schizophrenia. Neuroimage. 2008;43(4):665–675. | ||
Clarkson MJ, Cardoso MJ, Ridgway GR, et al. A comparison of voxel and surface based cortical thickness estimation methods. Neuroimage. 2011;57(3):856–865. | ||
Hutton C, Draganski B, Ashburner J, Weiskopf N. A comparison between voxel-based cortical thickness and voxel-based morphometry in normal aging. Neuroimage. 2009;48(2):371–380. | ||
Klein A, Ghosh SS, Avants B, et al. Evaluation of volume-based and surface-based brain image registration methods. Neuroimage. 2010;51(1):214–220. | ||
Lüsebrink F, Wollrab A, Speck O. Cortical thickness determination of the human brain using high resolution 3T and 7T MRI data. Neuroimage. 2013;70:122–131. | ||
Singh N, Agarwal AK. Pumping iron: revisiting risks, benefits and strategies in treatment of iron deficiency in end-stage renal disease. Clin Nephrol. 2012;77(3):188–194. | ||
Payne RB, Little AJ, Williams RB, Milner JR. Interpretation of serum calcium in patients with abnormal serum proteins. Br Med J. 1973;4(5893):643–646. | ||
Schultz-Larsen K, Lomholt RK, Kreiner S. Mini-Mental Status Examination: a short form of MMSE was as accurate as the original MMSE in predicting dementia. J Clin Epidemiol. 2007;60(3):260–267. | ||
Dale AM, Fischl B, Sereno MI. Cortical surface-based analysis. I. Segmentation and surface reconstruction. Neuroimage. 1999;9(2):179–194. | ||
Fischl B, Sereno MI, Dale AM. Cortical surface-based analysis. II: inflation, flattening, and a surface-based coordinate system. Neuroimage. 1999;9(2):195–207. | ||
Fischl B, Sereno MI, Tootell RB, Dale AM. High-resolution intersubject averaging and a coordinate system for the cortical surface. Hum Brain Mapp. 1999;8(4):272–284. | ||
Vanholder R, De Smet R, Glorieux G, et al; European Uremic Toxin Work Group (EUTox). Review on uremic toxins: classification, concentration, and interindividual variability. Kidney Int. 2003;63(5):1934–1943. | ||
Enomoto A, Takeda M, Taki K, et al. Interactions of human organic anion as well as cation transporters with indoxyl sulfate. Eur J Pharmacol. 2003;466(1–2):13–20. | ||
Topczewska-Bruns J, Pawlak D, Chabielska E, Tankiewicz A, Buczko W. Increased levels of 3-hydroxykynurenine in different brain regions of rats with chronic renal insufficiency. Brain Res Bull. 2002;58(4):423–428. | ||
De Deyn PP, D’Hooge R, van Bogaert PP, Marescau B. Endogenous guanidino compounds as uremic neurotoxins. Kidney Int Suppl. 2001;78:S77–S83. | ||
De Deyn PP, Vanholder R, Eloot S, Glorieux G. Guanidino compounds as uremic (neuro) toxins. Semin Dial. 2009;22(4):340–345. | ||
Passer JA. Cerebral atrophy in end-stage uremia. Proc Clin Dial Transplant Forum. 1977;7:91–94. | ||
Kamata T, Hishida A, Takita T, et al. Morphologic abnormalities in the brain of chronically hemodialyzed patients without cerebrovascular disease. Am J Nephrol. 2000;20(1):27–31. | ||
Savazzi GM, Cusmano F, Musini S. Cerebral imaging changes in patients with chronic renal failure treated conservatively or in hemodialysis. Nephron. 2001;89(1):31–36. | ||
Frias B, Santos J, Morgado M, et al. The role of brain-derived neurotrophic factor (BDNF) in the development of neurogenic detrusor overactivity (NDO). J Neurosci. 2015;35(5):2146–2160. | ||
Song SH, Kim IJ, Kim SJ, Kwak IS, Kim YK. Cerebral glucose metabolism abnormalities in patients with major depressive symptoms in pre-dialytic chronic kidney disease: statistical parametric mapping analysis of F-18-FDG PET, a preliminary study. Psychiatry Clin Neurosci. 2008;62(5):554–561. | ||
Ridderinkhof KR, van den Wildenberg WP, Segalowitz SJ, Carter CS. Neurocognitive mechanisms of cognitive control: the role of prefrontal cortex in action selection, response inhibition, performance monitoring, and reward-based learning. Brain Cogn. 2004;56(2):129–140. | ||
Ridderinkhof KR, Ullsperger M, Crone EA, Nieuwenhuis S. The role of the medial frontal cortex in cognitive control. Science. 2004;306(5695):443–447. | ||
Polli FE, Barton JJ, Cain MS, Thakkar KN, Rauch SL, Manoach DS. Rostral and dorsal anterior cingulate cortex make dissociable contributions during antisaccade error commission. Proc Natl Acad Sci U S A. 2005;102(43):15700–15705. | ||
Schnider A, Bonvallat J, Emond H, Leemann B. Reality confusion in spontaneous confabulation. Neurology. 2005;65(7):1117–1119. | ||
Diekhof EK, Falkai P, Gruber O. The orbitofrontal cortex and its role in the assignment of behavioural significance. Neuropsychologia. 2011;49(5):984–991. | ||
Kurella M, Chertow GM, Luan J, Yaffe K. Cognitive impairment in chronic kidney disease. J Am Geriatr Soc. 2004;52(11):1863–1869. | ||
Murray AM, Tupper DE, Knopman DS, et al. Cognitive impairment in hemodialysis patients is common. Neurology. 2006;67(2):216–223. | ||
Kurella Tamura M, Yaffe K. Dementia and cognitive impairment in ESRD: diagnostic and therapeutic strategies. Kidney Int. 2011;79(1):14–22. | ||
Bornivelli C, Aperis G, Giannikouris I, Paliouras C, Alivanis P. Relationship between depression, clinical and biochemical parameters in patients undergoing haemodialysis. J Ren Care. 2012;38(2):93–97. | ||
Kuwabara Y, Sasaki M, Hirakata H, et al. Cerebral blood flow and vasodilatory capacity in anemia secondary to chronic renal failure. Kidney Int. 2002;61(2):564–569. | ||
Liang X, Zou Q, He Y, Yang Y. Coupling of functional connectivity and regional cerebral blood flow reveals a physiological basis for network hubs of the human brain. Proc Natl Acad Sci U S A. 2013;110(5):1929–1934. | ||
Tomasi D, Wang GJ, Volkow ND. Energetic cost of brain functional connectivity. Proc Natl Acad Sci U S A. 2013;110(33):13642–13647. | ||
Sporns O, Zwi JD. The small world of the cerebral cortex. Neuroinformatics. 2004;2(2):145–162. | ||
Kalender B, Ozdemir AC, Koroglu G. Association of depression with markers of nutrition and inflammation in chronic kidney disease and end-stage renal disease. Nephron Clin Pract. 2006;102(3–4):c115–c121. | ||
Teles F, Azevedo VF, Miranda CT, Miranda MP, Teixeira MC, Elias RM. Depression in hemodialysis patients: the role of dialysis shift. Clinics. 2014;69(3):198–202. | ||
Galons JP, Trouard T, Gmitro AF, Lien YH. Hemodialysis increases apparent diffusion coefficient of brain water in nephrectomized rats measured by isotropic diffusion-weighted magnetic resonance imaging. J Clin Invest. 1996;98(3):750–755. | ||
Owen WF, Lew NL, Liu Y, Lowrie EG, Lazarus JM. The urea reduction ratio and serum albumin concentration as predictors of mortality in patients undergoing hemodialysis. N Engl J Med. 1993;329(14):1001–1006. | ||
De Deyn PP, Vanholder R, Eloot S, Glorieux G. Guanidino compounds as uremic (neuro)toxins. Semin Dial. 2009;22(4):340–345. | ||
Murphy ML, Frodl T. Meta-analysis of diffusion tensor imaging studies shows altered fractional anisotropy occurring in distinct brain areas in association with depression. Biol Mood Anxiety Disord. 2011;1(1):3. | ||
Kimmel PL, Cukor D, Cohen SD, Peterson RA. Depression in end-stage renal disease patients: a critical review. Adv Chronic Kidney Dis. 2007;14(4):328–334. | ||
Nasser MT, Shawki S, El Shahawy Y, Sany D. Assessment of cognitive dysfunction in kidney disease. Saudi J Kidney Dis Transpl. 2012;23(6):1208–1214. | ||
Kurella Tamura M, Unruh ML, Nissenson AR, et al. Effect of more frequent hemodialysis on cognitive function in the frequent hemodialysis network trials. Am J Kidney Dis. 2013;61(2):228–237. | ||
Vára F, Lopot F, Valkovský I, et al. Phosphorus removal in low-flux hemodialysis, high-flux hemodialysis and hemodiafiltration. ASAIO Journal. 2015;62(2):176. | ||
Savazzi GM, Cusmano F, Vinci S, Allegri L. Progression of cerebral atrophy in patients on regular hemodialysis treatment: long-term follow-up with cerebral computed tomography. Nephron. 1995;69(1):29–33. | ||
A Software Package for the analysis and visualization of structural and functional neuroimaging data from cross-sectional or longitudinal studies [homepage on the Internet]. Massachusetts: The Athinoula A. Martinos Center for Biomedical Imaging; 2013 [updated May 15, 2013]. Available from: http://surfer.nmr.mgh.harvard.edu/. Accessed May, 2013. | ||
A Matlab Toolbox for the statistical analysis of univariate and multivariate surface and volumetric data using linear mixed effects models and random field theory [homepage on the Internet]. Canada: Department of Mathematics and Statistics, McGill University; 2008 [updated September 26, 2008]. Available from: http://www.math.mcgill.ca/keith/surfstat/. Accessed September, 2008. |
 © 2018 The Author(s). This work is published and licensed by Dove Medical Press Limited. The full terms of this license are available at https://www.dovepress.com/terms.php and incorporate the Creative Commons Attribution - Non Commercial (unported, v3.0) License.
By accessing the work you hereby accept the Terms. Non-commercial uses of the work are permitted without any further permission from Dove Medical Press Limited, provided the work is properly attributed. For permission for commercial use of this work, please see paragraphs 4.2 and 5 of our Terms.
© 2018 The Author(s). This work is published and licensed by Dove Medical Press Limited. The full terms of this license are available at https://www.dovepress.com/terms.php and incorporate the Creative Commons Attribution - Non Commercial (unported, v3.0) License.
By accessing the work you hereby accept the Terms. Non-commercial uses of the work are permitted without any further permission from Dove Medical Press Limited, provided the work is properly attributed. For permission for commercial use of this work, please see paragraphs 4.2 and 5 of our Terms.