")
Back to Journals » Clinical Epidemiology » Volume 10
A validation study of the CirCom comorbidity score in an English cirrhosis population using the Clinical Practice Research Datalink
Authors Crooks CJ , West J , Jepsen P
Received 28 July 2017
Accepted for publication 20 November 2017
Published 15 January 2018 Volume 2018:10 Pages 107—120
DOI https://doi.org/10.2147/CLEP.S147535
Checked for plagiarism Yes
Review by Single anonymous peer review
Peer reviewer comments 2
Editor who approved publication: Professor Vera Ehrenstein
Colin J Crooks,1,2 Joe West,1,2 Peter Jepsen3,4
1Division of Epidemiology and Public Health, University of Nottingham, Nottingham, UK; 2Nottingham Digestive Diseases Biomedical Research Centre, School of Medicine, University of Nottingham, Nottingham, UK; 3Department of Hepatology and Gastroenterology, Aarhus University Hospital, Aarhus, Denmark; 4Department of Clinical Epidemiology, Aarhus University Hospital, Aarhus, Denmark
Purpose: The CirCom score has been developed from Danish data as a specific measure of comorbidity for cirrhosis to predict all-cause mortality. We compared its performance with the Charlson Comorbidity Index (CCI) in an English cirrhosis population.
Patients and methods: We used comorbidity scores in a survival model to predict mortality in a cirrhosis cohort in the Clinical Practice Research Datalink. The discrimination of each score was compared by age, gender, socioeconomic status, cirrhosis etiology, cirrhosis stage, and year after cirrhosis diagnosis. We also measured their ability to predict liver-related versus non-liver-related death.
Results: There was a small improvement in the C statistic from the model using the CirCom score (C=0.63) compared to the CCI (C=0.62), and there was an overall improvement in the net reclassification index of 1.5%. The improvement was more notable in younger patients, those with an alcohol etiology, and those with compensated cirrhosis. Both scores performed better (C statistic >0.7) for non-liver-related deaths than liver-related deaths (C statistic <0.6), as comorbidity was only weakly predictive of liver-related death.
Conclusion: The CirCom score provided a small improvement in performance over the CCI in the prediction of all-cause and non-liver mortality, but not liver-related mortality. Therefore, it is important to include a measure of comorbidity in studies of cirrhosis survival, alongside a measure of cirrhosis severity.
Keywords: cirrhosis, mortality, comorbidity, prognosis, cause of death, cohort
Plain language summary
Why was the study done? We assessed whether the effect of non-liver disease on survival in patients with liver disease scarring (called cirrhosis) is better captured by a cirrhosis-specific measure (the CirCom score) than by a generic measure (the Charlson Comorbidity Index [CCI]).
What did the researchers do and find? The CirCom score was better able to predict patients’ survival times than the CCI, particularly in younger patients, patients with less severe cirrhosis, and patients whose cirrhosis was due to alcohol.
What do these results mean? This paper showed that the CirCom score is better than the CCI at describing the survival of English patients with liver cirrhosis. It also demonstrated the importance of accounting for non-liver disease in patients with liver cirrhosis.
Introduction
Patients with cirrhosis have a high mortality.1 Their high mortality is partly due to comorbidity,2 so adjustment for differences in the burden of comorbidity is important in studies that compare mortality among these patients. This is similar to what has been shown in end-stage renal failure, heart failure, and chronic obstructive pulmonary disease (COPD).3–5 For cirrhosis, Jepsen et al have developed a comorbidity score (CirCom) within a Danish cohort of patients with liver cirrhosis and shown it to be an improvement on the existing Charlson comorbidity score.6 However, the accompanying commentary recommended further external validation that included calculation of absolute risks, as well as discrimination and model fit.7
The most frequently validated method to date is the secondary care-derived CCI, published in 1987,8 developed using hospital chart data of medical inpatients to predict mortality in the 1-year postdischarge and validated in a cohort of breast cancer inpatients. However, this score assessed all medical inpatients rather than those with specific disease, thus failing to recognize that the prognostic effect of a specific comorbid disease (eg, COPD) might depend on the index disease (eg, ischemic heart disease versus cirrhosis). Furthermore, the management and prognosis of various diseases have changed greatly over the last two decades altering what is relevant to be contained in a score. In contrast, CirCom was derived specifically for cirrhotic patients and reassessed which comorbidities were associated with mortality in this context. It is simpler in that it includes less comorbidities overall compared to the CCI, but with some different comorbidities such as substance abuse (other than alcohol use) and epilepsy.6 We have previously extracted a validated and well-described cohort of cirrhotic patients with mixed etiology from linked primary care, secondary care, and death registry data within the Clinical Practice Research Datalink (CPRD).9 The purpose of this validation study of the CirCom score within this English cohort is to assess the performance of CirCom compared to the CCI in predicting mortality. By doing this assessment, we hope to provide evidence for its use (or nonuse) as the preferred measure of comorbidity adjustment in future population-based observational studies on cirrhosis mortality.
Materials and methods
Dataset
The CPRD consists of linked English Hospital Episodes Statistics data, primary care data, and the Office of National Statistics (ONS) death register. For this study, these data have linked records of all primary care events, hospital admissions, and causes of death from April 1997 to August 2010 for 3% of the English population (244 primary care practices).
Population
The cirrhosis cohort we used is one we have previously defined from the January 2011 static version of the CPRD (ISAC approved protocol number 09_065RA_4 and updated approval for this validation study 16_161).9 It consists of 5118 patients who were ≥18 years and had a diagnostic code for cirrhosis or a therapeutic code for cirrhosis, esophageal varices, or portal hypertension within either primary care or secondary care data within the CPRD between January 1, 1998 and December 31, 2009. These dates define the period when the linked data were available at the time of the initial study. The presence of cirrhosis was validated using secondary care, death registry, and free text data.1 The study population was restricted to the 244 practices with the primary and secondary care linkages available within the January 2011 static version of the CPRD. For this cirrhosis cohort, the patient characteristics, etiology of the cirrhosis (alcohol, viral/autoimmune/metabolic, or unknown), cause of death, and 5-year survival have been well described.1,10 The observation period for patients within this cohort commenced on the latest of 1) 1 year after each patient’s current registration date with an eligible practice, 2) the date that their practice’s data were up to research standard, or 3) January 1, 1998, when the linkage of the CPRD to secondary care data was first available. The 1-year cutoff following registration was used to avoid including potential prevalent cases who were diagnosed before they were observable in the dataset. The period of observation in this cohort terminated for each patient on the earliest of 1) the date of their death, 2) the date the patient left the practice, 3) their practice’s last data collection date, 4) the last date of the available linkage to secondary care (at the time of the study derivation) which was December 31, 2009. Within this observation period, the start of each patient’s follow-up was defined as his or her first Read or ICD 10 code for cirrhosis within the observation period. Patients with a diagnosis of cirrhosis before the observation period were excluded as the CirCom score was defined from comorbidity present at the time of diagnosis of cirrhosis. Follow-up for each patient ended at the end of the observation period described above.
Ethics
The CPRD has obtained ethical approval from the National Research Ethics Service Committee (NRECS) for all purely observational research using anonymized CPRD data. Studies which do not include patient involvement are reviewed for scientific quality by the Independent Scientific Advisory Committee for the Medicines and Healthcare Products Regulatory Agency database research. Regulatory approval for this study was obtained under approval 16_161.
Sample size
Studies modeling required sample sizes for complex discriminatory models have indicated that a study like ours requires at least 500 deaths, and ideally 1000.11 Two thousand five hundred sixty-four deaths occurred within our liver cirrhosis cohort within the follow-up time providing sufficient power overall. Within the stratified analysis, there were more than 500 deaths in each of the etiology groups when defined as Viral/Autoimmune/Metabolic, Alcoholic, or Unspecified, and within each of the age categories defined below.
Comorbidity scores
We defined the CirCom score as described by Jepsen et al.6 This score defines seven different weighted categories using ICD 10 codes. We also defined the CCI8 to provide a comparison similar to Jepsen et al’s paper. We used the Read and ICD 10 codes for the individual comorbidities that we have previously defined for calculating the CCI in linked primary and secondary care data within the CPRD.12 The Read codes for these comorbidities were also used to define the comorbidities for the CirCom score, apart from substance abuse, epilepsy, and COPD. For the latter two of these categories, we used published code lists from www.clinicalcodes.org,13,14 and for substance abuse, the Read codes are listed in Table S1. All comorbidities were defined using all diagnoses coded in the 5 years prior to the cirrhosis diagnosis date as was done in Jepsen et al’s original paper.6
Other covariates included etiology, cirrhosis stage, year of follow-up, socioeconomic status, age, and gender. For the stratified analysis, we used the age bands we published in our original cohort (<45, 45–54, 55–64, 65–74, >75 years).10 Etiology was defined using the previously defined groups in the cohort as Alcoholic, Viral/Autoimmune/Metabolic, or Unspecified. Cirrhosis stage was defined as compensated or decompensated using the Baveno IV criteria already defined in the cohort.1 Socioeconomic status was defined by quintile of deprivation as measured by the English Indices of Multiple Deprivation 2010.15 Each year of follow-up from the first to the fifth year after cirrhosis diagnosis was defined, similar to our previously published work on comorbidity scores.12 Finally, we used cirrhosis and non-cirrhosis death outcomes as already defined in this cohort from previous work on cause of death from the linked ONS Death Registry.10 Specifically, we categorized deaths using the main ICD 10 chapter headings of K70–K77, C22, I85, I864, and I982 as liver related. This definition included bleeding from gastric and esophageal varices and hepatocellular carcinoma. All other ICD 10 codes were categorized as a non-liver death.
Statistical analysis
We described the cohort characteristics for each covariate to allow a comparison with numbers and proportions with the Danish Development cohort. We then fitted a Cox proportional hazards model including age, gender, and either the CCI as a categorical variable or the CirCom score as a categorical variable as in the Jepsen paper. To compare how well the Charlson and CirCom score models fitted the data, we calculated the Bayesian information criterion (BIC). This measure penalizes the likelihood of the model for the number of parameters it includes, and the model with the smaller BIC value is more likely to have a better fit. Discrimination was measured using the Harrell’s C statistic, with 95% CIs calculated using the somersD command in Stata.16 We calculated the predicted absolute 1-year mortality risk from each model using cumulative incidence functions. These absolute predicted mortality risks were used to classify patients into 1-year mortality probabilities of ≤20%, 21%–50%, and ≥51% to allow the net reclassification index (NRI) to be calculated. These were the categories used to assess the development of the CirCom score in the Danish cohort and were chosen to be clinically relevant.6
To assess the calibration of the two scores, the observed 1-year mortality, computed using the Kaplan–Meier method, was plotted against the 1-year mortality predicted by the Cox model.17 In addition, a decision curve analysis was performed assessing the net benefit of using each score compared to not using a score. The net benefit is calculated as the difference between the true positives (proportion of patients whose predicted risk was over a particular threshold who also died within 1 year of follow-up) and the false positives (proportion of patients whose predicted risk was over a particular threshold who did not die within 1 year of follow-up), for thresholds of predicted risk from 0% to 100%.18
A stratified analysis was then performed to assess the models’ discrimination by age, gender, socioeconomic status, cirrhosis etiology, cirrhosis stage, and follow-up year as defined above. A final analysis assessed the models’ discrimination in predicting liver-related death and non-liver-related death separately.
Results
Validation population characteristics
The validation cirrhosis cohort from the CPRD had fewer patients than that used in Denmark for the score’s development and a shorter median follow-up time (1.9 years compared to 2.8 years, respectively), but a similar median age (59 years compared to 58 years, respectively). The CPRD cohort had a lower proportion with alcohol as an etiology, a lower proportion of men, and a lower mortality. This was despite a higher proportion of patients in the CPRD who had a comorbidity that contributed to the Charlson or CirCom score (Table 1).
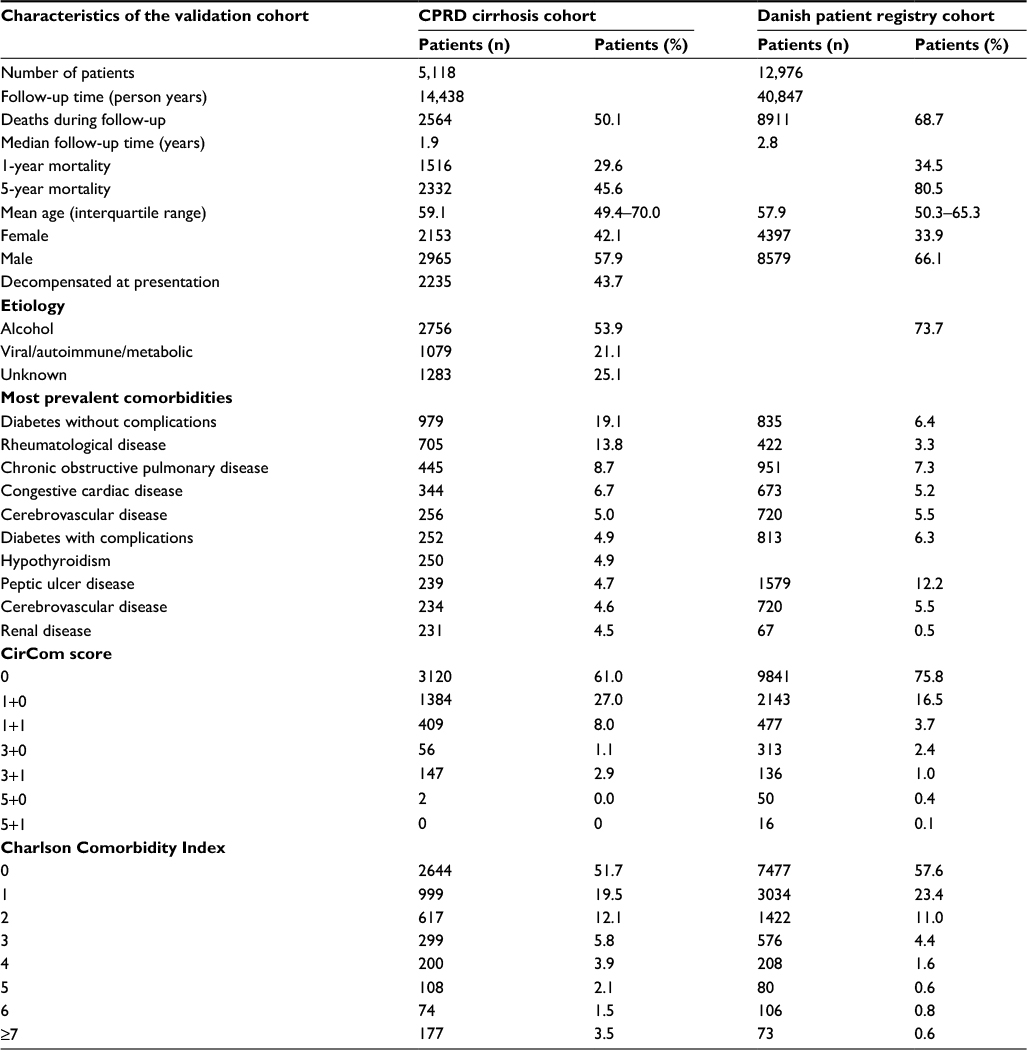 | Table 1 A comparison of the patient demographics of the Clinical Practice Research Datalink (CPRD) validation cohort and the original Danish Patient Registry derivation cohort Note: Cells are left blank where information was not presented in the papers on the original cohort studies. |
Overall performance of comorbidity scores
The full models are shown for comparison in Table 2. The CirCom score provided a better model fit than the CCI with an improvement in the BIC (Table 2).
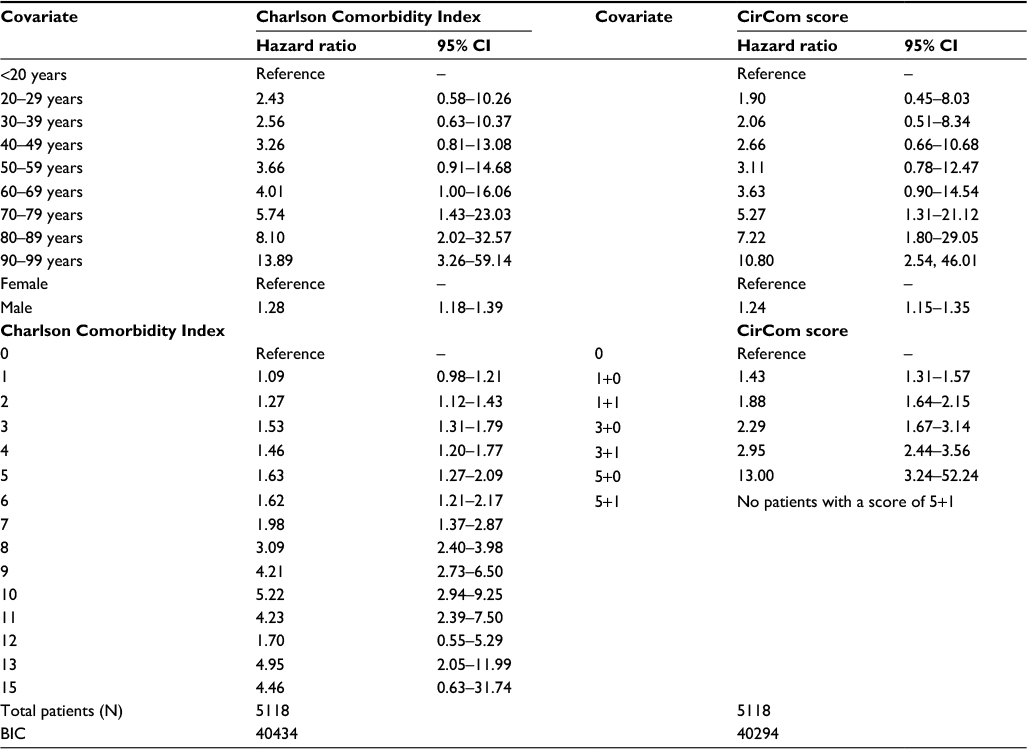 | Table 2 Full models with the comorbidity scores in the Clinical Practice Research Datalink validation cohort Note: Exponentiated coefficients. Abbreviations: BIC, Bayesian information criterion; CI, confidence interval. |
Measures of discrimination of the CCI and CirCom score models are shown in Table 3 compared to models with age and sex alone. Both scores showed an improvement when compared to age and sex alone with a small improvement in the C statistic from the model using the CirCom score compared to the CCI. This was also reflected in the 1.5% improvement of the CirCom score over the CCI in classifying 1-year mortality as measured by the categorical NRI (see Table 3). The addition of a covariate for decompensated or compensated liver disease further increased the discrimination of the model containing the CirCom score (C=0.67, 95% confidence interval [0.66–0.68]). Calibration was similar between the two scores (Figure S1). The decision curve analysis showed similar results for both scores, with a net benefit in true over false positives when the threshold used for the predicted risk of 1-year mortality was between 20% and 60% for both the CCI and the CirCom score (Figure S2).
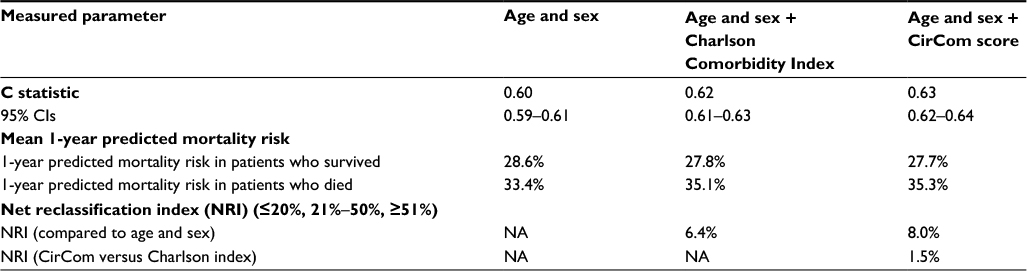 | Table 3 Discrimination of the comorbidity models Abbreviation: CI, confidence interval; NA, not applicable. |
To assess whether the differences in performance were due to difference in numbers of parameters, we reassessed the CCI score collapsed to 0, 1, 2, 3, 4, and 5 or more. This reduced the BIC for the CCI to 40,369, but this was still greater than the BIC for the CirCom score (which remained the better fit). The discrimination for the CCI with only six parameters was not altered (C statistic=0.62 [0.61–0.63]).
Stratified analysis
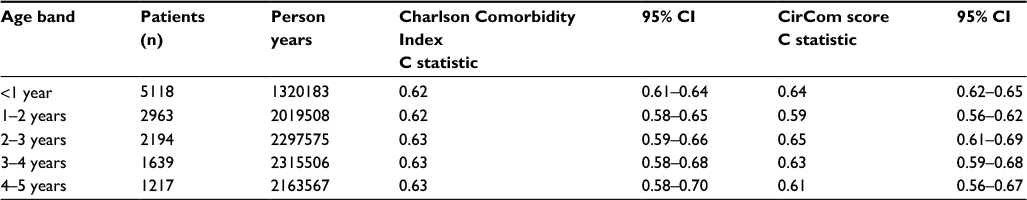
The CirCom score conferred a slight improvement in discrimination over the CCI in younger age groups, particularly in the <45-year-old age group (Table 4). Among the subgroups defined by cirrhosis etiology, the difference between the CCI and the CirCom score was most notable in the subgroup with alcoholic cirrhosis (Table 5). Both comorbidity scores performed better in those with autoimmune, viral, metabolic, or unknown causes, which reflected the older mean age in these groups and resultant higher prevalence of comorbidity. There was also a slight improvement in discrimination of the CirCom score over the CCI in those with compensated cirrhosis at presentation, but not in those with decompensated cirrhosis. The CirCom score performed better than the CCI in the first year of follow-up with similar discrimination in the subsequent years (Table 6). Discrimination reduced with increasing deprivation, but there was less of a reduction for the CirCom score (Table S2).
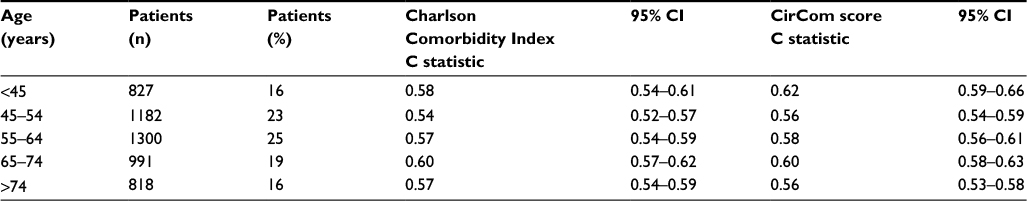 | Table 4 Age-stratified discrimination of the comorbidity models Notes: Each estimate is also adjusted for gender. Abbreviation: CI, confidence interval. |
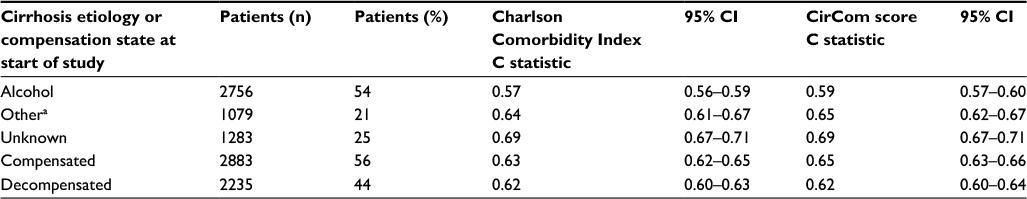 | Table 5 Etiology- and compensation-stratified discrimination of the comorbidity models Notes: aAutoimmune, viral, or metabolic. Each estimate is also adjusted for age and gender. Abbreviation: CI, confidence interval. |
 | Table 6 Follow-up-stratified discrimination of the comorbidity models Notes: Each estimate is also adjusted for age and gender. Abbreviation: CI, confidence interval. |
Both comorbidity scores had identically poor discrimination for liver-related death and identically good discrimination for non-liver-related death. The inclusion of a measure of decompensation improved the discrimination of a model with either score for liver-related death (Table 7).
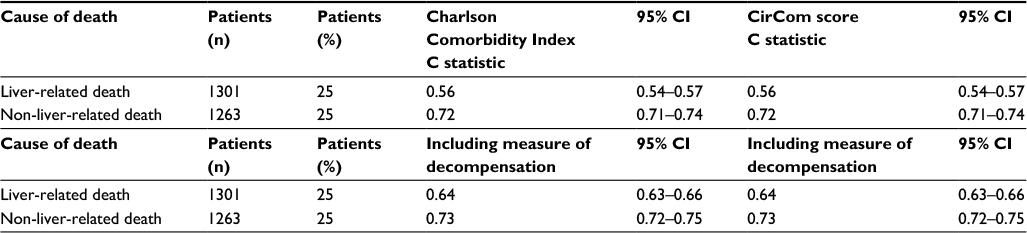 | Table 7 Cause of death–stratified and compensation-stratified discrimination of the comorbidity models Abbreviation: CI, confidence interval. |
Discussion
The CirCom score provided a small improvement in performance over the CCI when used to predict mortality in a large, population-based cohort of patients with cirrhosis of mixed etiology. Both scores showed good discriminative ability to predict deaths not related to the liver, which were almost half of the deaths, but poor ability to predict deaths related to the liver. However, the purpose of a comorbidity score is to adjust for factors other than the severity of cirrhosis and in this context it performs. Both the CCI and the CirCom score improved the performance of the model over using just demographic information, emphasizing the importance of including a comorbidity measure in any comparative study of cirrhosis survival. In particular, this validation study supports the use of the CirCom score as a measure of non-cirrhosis-related or all-cause mortality in cirrhotic patients in the English population.
The importance of our work is not just that it shows the utility of the score in an international context beyond Denmark, but that it also shows that the score is translatable into other coding systems such as the Read codes used in the CPRD. Furthermore, the Danish data use secondary care outpatient data for longitudinal comorbidity coding, whereas the English data use both linked inpatient secondary care and general practitioner primary care comorbidity coding. The finding that the score showed a consistent improvement over the CCI in this different health care context confirms the score’s generalizability, particularly as we demonstrated an even greater improvement in the C statistic than in the original Danish derivation cohort.
The strengths of this study are that it provides an in-depth analysis of the performance of the CirCom score and the CCI in an English population. The English CPRD has extensive linkages, and these have allowed the current cohort to be validated and its characteristics comprehensively described.1,9,10 Therefore, we are confident of the validity of the cirrhosis diagnosis from the primary and secondary care data, and the recording of death from the national death registry. Furthermore, the recording of comorbidity in the CPRD has previously been validated against anonymized case records in many studies (myocardial infarction,19,20 heart failure,21,22 cerebrovascular disease,23–25 dementia,26,27 respiratory disease,28–30 connective tissue disease,31–34 peptic ulcers,35 liver disease,9,36 renal failure,37 cancer,38 leukemia, and lymphoma39), and the sensitivity of definitions improved when defined from linked primary and secondary care records (eg, diabetes,40,41 cirrhosis,9 and acute myocardial infarction42).
The Model for End-Stage Liver Disease and the Child-Pugh score outperformed both the CCI and the CirCom score in predicting cirrhosis survival in a US Veteran cohort,43 and the validation in the original CirCom score paper showed the same.6 However, these measures depend on laboratory values that were not available in the CPRD. We have previously shown that it was possible to derive a measure of cirrhosis stage using just diagnostic coding within the CPRD,9 and including this as a variable for decompensation in our current study greatly improved the discrimination for liver-related death, and consequently the overall discrimination of all-cause mortality for our model with the CirCom score. The value of a comorbidity score, therefore, is that it predicts the additional non-liver-related outcomes that are not predicted by measures of severity of cirrhosis, and it will have benefit when added to any measure of cirrhosis severity.
The higher prevalence of comorbidity in the English cohort compared to the Danish cohort might reflect the more extensive comorbidity coding in a comprehensive primary care system in the UK or might reflect the more varied etiology of the English cohort, which had a lower proportion with alcohol etiology. We have previously shown that those patients with a non-alcohol etiology survive longer than those with an alcohol etiology, and, therefore, will have had a longer period of care in which to develop comorbidities and non-liver-related deaths.44 Finally, within the English cohort, the improvement with the CirCom score over the CCI was most noticeable in younger patients and in those with an alcohol etiology. This likely reflects the inclusion of epilepsy and substance abuse that have more importance in a cirrhotic cohort because of their association with a more hazardous lifestyle.45
Conclusion
We have validated the CirCom score in the English-linked CPRD as a measure of the burden of comorbidity and found that its performance is better than the CCI. However, both the CCI and the CirCom score improved discrimination compared to a model containing only age and sex. This emphasizes the importance of including any measure of comorbidity in comparative studies of cirrhosis survival.
Author contributions
CJ Crooks is the guarantor of the article, planned and performed the analysis, and drafted and edited the paper. P Jepsen had the original concept, contributed to the study design and analysis, and edited the paper. J West contributed to the study design and analysis, and edited the paper. All authors have approved the final version and authorship list and agree to be accountable for all aspects of the work.
Disclosure
The authors report no conflicts of interest in this work.
References
Ratib S, Fleming KM, Crooks CJ, Aithal GP, West J. 1 and 5 year survival estimates for people with cirrhosis of the liver in England, 1998–2009: a large population study. J Hepatol. 2014;60(2):282–289. | ||
Jepsen P, Vilstrup H, Andersen PK, Lash TL, Sørensen HT, Sorensen HT. Comorbidity and survival of Danish cirrhosis patients: a nationwide population-based cohort study. Hepatology. 2008;48(1):214–220. | ||
Incalzi RA, Fuso L, De Rosa M, et al. Co-morbidity contributes to predict mortality of patients with chronic obstructive pulmonary disease. Eur Respir J. 1997;10(12):2794–2800. | ||
Lee CS, Chien C V, Bidwell JT, et al. Comorbidity profiles and inpatient outcomes during hospitalization for heart failure: an analysis of the U.S. Nationwide inpatient sample. BMC Cardiovasc Disord. 2014;14(1):73. | ||
Liu J, Huang Z, Gilbertson DT, Foley RN, Collins AJ. An improved comorbidity index for outcome analyses among dialysis patients. Kidney Int. 2009;77(2):141–151. | ||
Jepsen P, Vilstrup H, Lash TL. Development and validation of a comorbidity scoring system for patients with cirrhosis. Gastroenterology. 2014;146(1):147–156. | ||
Younossi ZM, Henry L, Stepanova M. A new comorbidity model for predicting mortality in patients with cirrhosis: does it work? Gastroenterology. 2014;146(1):19–24. | ||
Charlson ME, Pompei P, Ales KL, MacKenzie CR. A new method of classifying prognostic comorbidity in longitudinal studies: development and validation. J Chronic Dis. 1987;40(5):373–383. | ||
Ratib S, West J, Crooks CJ, Fleming KM. Diagnosis of liver cirrhosis in england, a cohort study, 1998–2009: a comparison with cancer. Am J Gastroenterol. 2014;109(2):190–198. | ||
Ratib S, Fleming KM, Crooks CJ, Walker AJ, West J. Causes of death in people with liver cirrhosis in England compared with the general population: a population-based cohort study. Am J Gastroenterol. 2015;110(8):1149–1158. | ||
Peek N, Arts DGT, Bosman RJ, van der Voort PHJ, de Keizer NF. External validation of prognostic models for critically ill patients required substantial sample sizes. J Clin Epidemiol. 2007;60(5):491–501. | ||
Crooks CJ, West J, Card TR. A comparison of the recording of comorbidity in primary and secondary care by using the Charlson Index to predict short-term and long-term survival in a routine linked data cohort. BMJ Open. 2015;5(6):e007974. | ||
Quint JK, Mullerova H, DiSantostefano RL, et al. Validation of chronic obstructive pulmonary disease recording in the clinical practice research datalink (CPRD-GOLD). BMJ Open. 2014;4(7):e005540. | ||
Kontopantelis E, Springate DA, Ashworth M, Webb RT, Buchan IE, Doran T. Investigating the relationship between quality of primary care and premature mortality in England: a spatial whole-population study. BMJ. 2015;350(1):h904. | ||
Noble M, Mclennan D, Wilkinson K. The English indices of deprivation 2010; 2010. Available from:http://eprints.ioe.ac.uk/id/eprint/2461. Accessed April 4, 2013. | ||
Newson R. Efficient calculation of jackknife confidence intervals for rank statistics. J Stat Softw. 2006;15(1):1–10. | ||
Royston P. Tools for checking calibration of a Cox model in external validation: prediction of population-averaged survival curves based on risk groups. Stata J. 2015;15(1):275–297. | ||
Vickers AJ, Elkin EB. Decision curve analysis: a novel method for evaluating prediction models. Med Decis Making. 26(6):565–574. | ||
Hammad TA, McAdams MA, Feight A, Iyasu S, Dal Pan GJ. Determining the predictive value of Read/OXMIS codes to identify incident acute myocardial infarction in the general practice research database. Pharmacoepidemiol Drug Saf. 2008;17(12):1197–1201. | ||
Meier CR. Antibiotics and risk of subsequent first-time acute myocardial infarction. JAMA J Am Med Assoc. 1999;281(5):427–431. | ||
Huerta C, Varas-Lorenzo C, Castellsague J, García Rodríguez LA. Non-steroidal anti-inflammatory drugs and risk of first hospital admission for heart failure in the general population. Heart. 2006;92(11):1610–1615. | ||
Maru S, Koch GG, Stender M, et al. Antidiabetic drugs and heart failure risk in patients with type 2 diabetes in the U.K. primary care setting. Diabetes Care. 2005;28(1):20–26. | ||
Derby LE, Myers MW, Jick H. Use of dexfenfluramine, fenfluramine and phentermine and the risk of stroke. Br J Clin Pharmacol. 2001;47(5):565–569. | ||
Gibbs RGJ, Newson R, Lawrenson R, Greenhalgh RM, Davies AH. Diagnosis and initial management of stroke and transient ischemic attack across UK health regions from 1992 to 1996: experience of a national primary care database. Stroke. 2001;32(5):1085–1090. | ||
Hall GC, Brown MM, Mo J, MacRae KD. Triptans in migraine: the risks of stroke, cardiovascular disease, and death in practice. Neurology. 2004;62(4):563–568. | ||
Jick H, Zornberg G, Jick S, Seshadri S, Drachman D. Statins and the risk of dementia. Lancet. 2000;356(9242):1627–1631. | ||
Imfeld P, Bodmer M, Jick SS, Meier CR. Metformin, other antidiabetic drugs, and risk of Alzheimer’s disease: a population-based case-control study. J Am Geriatr Soc. 2012;60(5):916–921. | ||
Soriano JB, Vestbo J, Pride NB, Kiri V, Maden C, Maier WC. Survival in COPD patients after regular use of fluticasone propionate and salmeterol in general practice. Eur Respir J. 2002;20(4):819–825. | ||
Hansell A, Hollowell J, Nichols T, McNiece R, Strachan D. Use of the general practice research database (GPRD) for respiratory epidemiology: a comparison with the 4th Morbidity Survey in General Practice (MSGP4). Thorax. 1999;54(5):413–419. | ||
Hubbard R. Adult height and cryptogenic fibrosing alveolitis: a case-control study using the UK General Practice Research Database. Thorax. 2000;55(10):864–866. | ||
Watts RA, Al-Taiar A, Scott DGI, Macgregor AJ. Prevalence and incidence of Wegener’s granulomatosis in the UK general practice research database. Arthritis Rheum. 2009;61(10):1412–1416. | ||
Watson DJ, Rhodes T, Cai B, Guess HA. Lower risk of thromboembolic cardiovascular events with naproxen among patients with rheumatoid arthritis. Arch Intern Med. 2002;162(10):1105–1110. | ||
Thomas SL, Edwards CJ, Smeeth L, Cooper C, Hall AJ. How accurate are diagnoses for rheumatoid arthritis and juvenile idiopathic arthritis in the general practice research database? Arthritis Rheum. 2008;59(9):1314–1321. | ||
Jick SS, Choi H, Li L, McInnes IB, Sattar N. Hyperlipidaemia, statin use and the risk of developing rheumatoid arthritis. Ann Rheum Dis. 2009;68(4):546–551. | ||
Cai S, GarciaRodriguez LA, Massa-Gonzalez EL, Hernandez-Diaz S. Uncomplicated peptic ulcer in the UK: trends from 1997 to 2005. Aliment Pharmacol Ther. 2009;30(10):1039–1048. | ||
Fleming KM, Aithal GP, Solaymani-Dodaran M, Card TR, West J. Incidence and prevalence of cirrhosis in the United Kingdom, 1992–2001: a general population-based study. J Hepatol. 2008;49(5):732–738. | ||
Van Staa TP, Travis S, Leufkens HGM, Logan RF. 5-aminosalicylic acids and the risk of renal disease: a large British epidemiologic study. Gastroenterology. 2004;126(7):1733–1739. | ||
Dregan A, Moller H, Murray-Thomas T, Gulliford MC. Validity of cancer diagnosis in a primary care database compared with linked cancer registrations in England. Population-based cohort study. Cancer Epidemiol. 2012;36(5):425–429. | ||
Lewis JD, Bilker WB, Brensinger C, Deren JJ, Vaughn DJ, Strom BL. Inflammatory bowel disease is not associated with an increased risk of lymphoma. Gastroenterology. 2001;121(5):1080–1087. | ||
Harvey JN. Estimation of the prevalence of diagnosed diabetes from primary care and secondary care source data: comparison of record linkage with capture-recapture analysis. J Epidemiol Community Heal. 2002;56(1):18–23. | ||
Morgan CL, Currie CJ, Stott NCH, Smithers M, Butler CC, Peters JR. Estimating the prevalence of diagnosed diabetes in a health district of Wales: the importance of using primary and secondary care sources of ascertainment with adjustment for death and migration. Diabet Med. 2000;17(2):141–145. | ||
Herrett E, Shah AD, Boggon R, et al. Completeness and diagnostic validity of recording acute myocardial infarction events in primary care, hospital care, disease registry, and national mortality records: cohort study. BMJ. 2013;346(3):f2350. | ||
Kaplan DE, Dai F, Aytaman A, et al. Development and performance of an algorithm to estimate the child-turcotte-pugh score from a national electronic healthcare database. Clin Gastroenterol Hepatol. 2015;13(13):2333–2341.e6. | ||
Jepsen P, Lash TL, Vilstrup H. The clinical course of alcoholic cirrhosis: development of comorbid diseases. A Danish nationwide cohort study. Liver Int. 2016;36(11):1696–1703. | ||
Chapman BP, Weiss A, Fiscella K, Muennig P, Kawachi I, Duberstein P. Mortality risk prediction: can comorbidity indices be improved with psychosocial data? Med Care. 2015;53(11):909–915. |
Supplementary materials
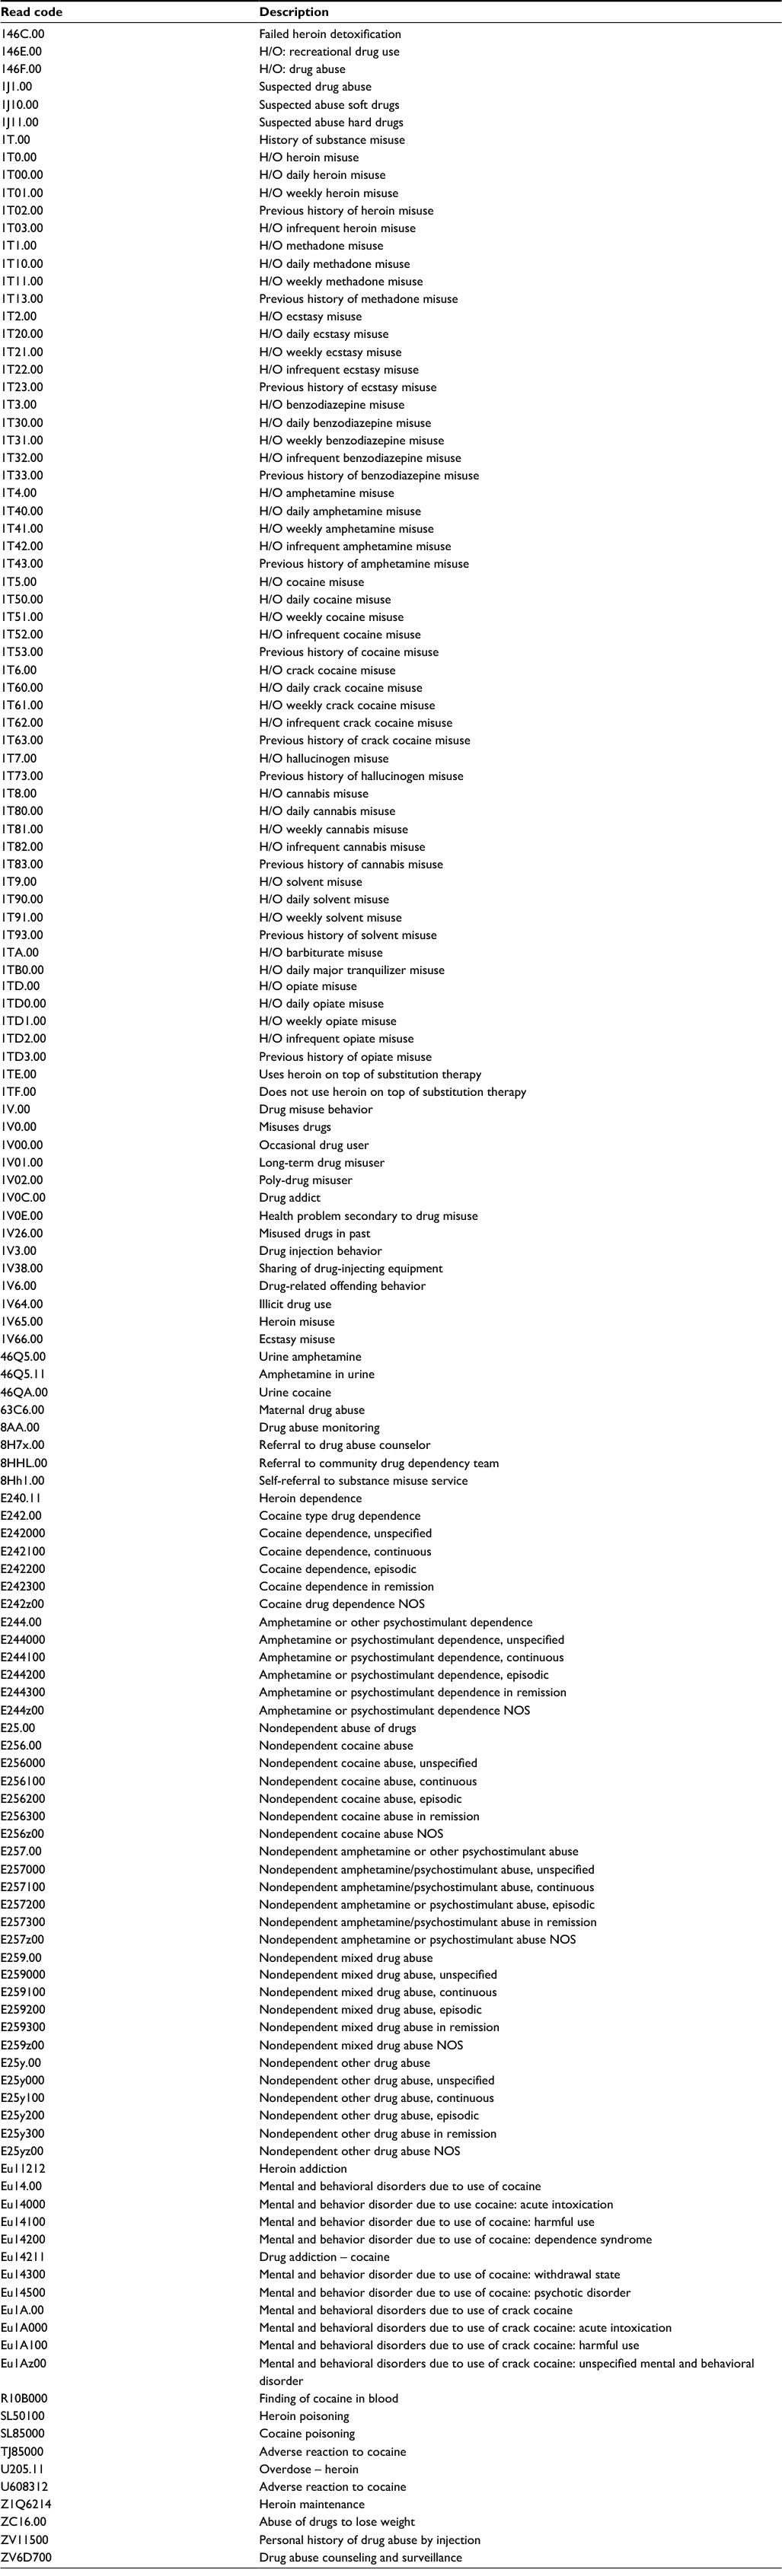 | Table S1 Read code list for non-alcohol substance misuse Abbreviations: H/O, history of; NOS, not otherwise specified. |
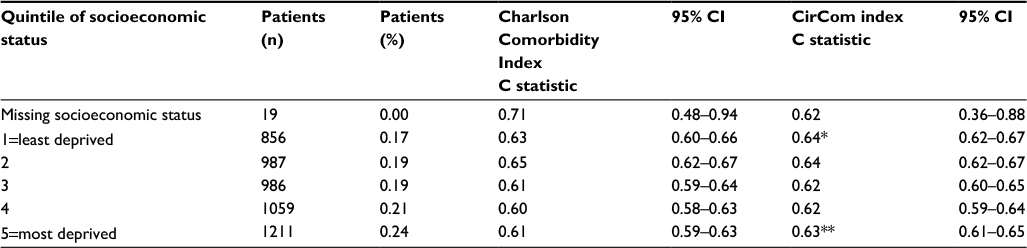 | Table S2 Socioeconomic status (as per IMD 2010)-stratified discrimination of the comorbidity models Notes: *p=0.03 between discrimination for the Charlson Comorbidity Index and the CirCom score. **p=0.007 between discrimination for the Charlson Comorbidity Index and the CirCom score. IMD, The English Indices of Multiple Deprivation 2010.2 Abbreviation: CI, confidence interval. |
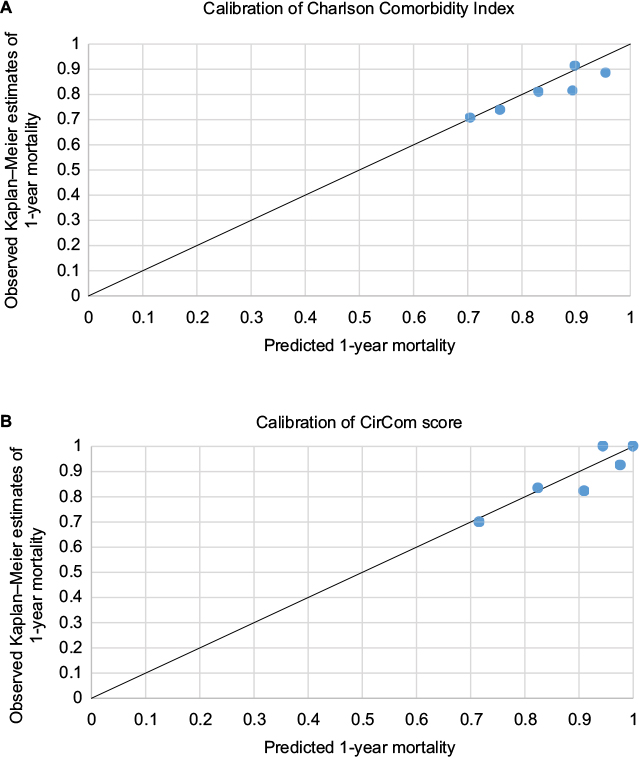 | Figure S1 Calibration plots for observed 1-year mortality from Kaplan–Meier estimates against predicted 1-year mortality from the Cox proportional hazards model from the (A) Charlson Comorbidity Index and (B) CirCom score. Note: Calculated using the stcoxgrp ado program.3 |
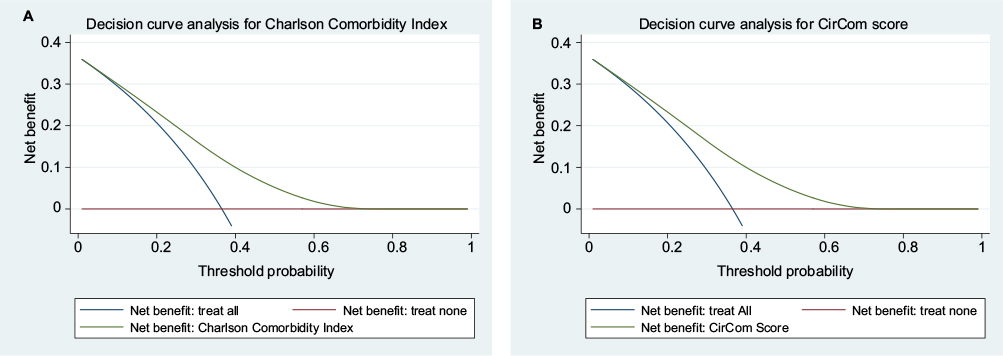 | Figure S2 Decision curve analysis plots for (A) the Charlson Comorbidity Index and (B) the CirCom score. Note: Calculated using the dca ado program.4 |
References
Quint JK, Mullerova H, DiSantostefano RL, et al. Validation of chronic obstructive pulmonary disease recording in the clinical practice research datalink (CPRD-GOLD). BMJ Open. 2014;4(7):e005540. | ||
Department for Communities and Local Government [UK]; 2011. The English indices of deprivation 2010. Available from: https://www.gov.uk/government/statistics/english-indices-of-deprivation-2010. Accessed December 21, 2017. | ||
Royston P. Tools for checking calibration of a Cox model in external validation: prediction of population-averaged survival curves based on risk groups. Stata Journal. 2015;15(1):275–297. | ||
Vickers AJ, Elkin EB. Decision curve analysis: a novel method for evaluating prediction models. Med Decis Making. 2006;26(6):565–574. |
 © 2018 The Author(s). This work is published and licensed by Dove Medical Press Limited. The full terms of this license are available at https://www.dovepress.com/terms.php and incorporate the Creative Commons Attribution - Non Commercial (unported, v3.0) License.
By accessing the work you hereby accept the Terms. Non-commercial uses of the work are permitted without any further permission from Dove Medical Press Limited, provided the work is properly attributed. For permission for commercial use of this work, please see paragraphs 4.2 and 5 of our Terms.
© 2018 The Author(s). This work is published and licensed by Dove Medical Press Limited. The full terms of this license are available at https://www.dovepress.com/terms.php and incorporate the Creative Commons Attribution - Non Commercial (unported, v3.0) License.
By accessing the work you hereby accept the Terms. Non-commercial uses of the work are permitted without any further permission from Dove Medical Press Limited, provided the work is properly attributed. For permission for commercial use of this work, please see paragraphs 4.2 and 5 of our Terms.