")
Back to Journals » Drug Design, Development and Therapy » Volume 10
A triazole derivative elicits autophagic clearance of polyglutamine aggregation in neuronal cells
Authors Hsieh C, Lee L, Leong W, Yang T, Yao C, Fang K
Received 3 May 2016
Accepted for publication 15 June 2016
Published 14 September 2016 Volume 2016:10 Pages 2947—2957
DOI https://doi.org/10.2147/DDDT.S111903
Checked for plagiarism Yes
Review by Single anonymous peer review
Peer reviewer comments 5
Editor who approved publication: Prof. Dr. Wei Duan
Chang Heng Hsieh,1 Li-Ching Lee,1 Wai-Yin Leong,1 Tsai-Chen Yang,1 Ching-Fa Yao,2 Kang Fang1
1Department of Life Science, 2Department of Chemistry, National Taiwan Normal University, Taipei, Taiwan
Abstract: Trinucleotide CAG repeat expansion in the coding region of genes has a propensity to form polyglutamine (polyQ) aggregates that contribute to neuronal disorders. Strategies in elevating autophagy to disintegrate the insoluble aggregates without injuring cells have become a major goal for therapy. In this work, a triazole derivative, OC-13, was found accelerating autophagic clearance of polyQ aggregation in human neuroblastoma cells following induction of the enhanced green fluorescence-conjugated chimeric protein that enclosed 79 polyQ repeats (Q79-EGFP). OC-13 accelerated autophagy development and removed nuclear Q79-EGFP aggregates. The increase of Beclin-1, turnover of LC3-I to LC3-II and degradation of p62 supported autophagy activation. Pretreatment of autophagy inhibitor, bafilomycin A1, not only suppressed autophagolysome fusion, but also impeded aggregate eradication. The study also showed that c-Jun N-terminal kinase/Beclin-1 pathway was activated during OC-13 treatment and c-Jun N-terminal kinase inhibitor impaired autophagy and final breakdown. Autophagic clearance of the insoluble aggregates demonstrated the feasibility of OC-13 in alleviating neuronal disorders because of expanded glutamine stretches.
Keywords: autophagic flux, polyglutamine, aggregates clearance, triazole, JNK pathway, neuronal disorders, green fluorescence protein
Corrigendum for this paper has been published
Introduction
Aggregation of expanded polyglutamine (polyQ) has the propensity to form intraneuronal inclusions. Having strong tendency to aggregate, proteins containing long polyQ stretches produce nuclear inclusions in various regions of the brain and are toxic.1 Abnormal expansions of glutamine repeats of ataxin protein and the acquired gain-of-function toxicity contribute to neuronal dysfunction or cell death.2–4 The aberrant glutamine repeat expansion during development is dominantly inherited. The acquired aggregates in brain lead to pathogenesis as manifested in a number of neurodegenerative diseases, for example, Huntington’s disease and spinocerebellar ataxias.5 Due to the insufficient endogenous clearance functions, new strategies aiming to dissolve the abnormal accumulation and obviate neuronal toxicities are constantly needed. Macroautophagy (hereafter referred to as autophagy) is the major catabolic mechanism to clear the accumulated protein aggregates. The coordinated autophagy and proteasome are proposed to ease deleterious effects. Since aggregate-prone polyQ protein is sometimes a poor proteasome substrate, autophagy naturally becomes an ideal alternative to clear the massive aggregation.6 Dysfunction of autophagy accumulates abnormal protein and aggravates the pathology of various neuronal disorders.7 The induction of autophagy against toxic insults of the mutant aggregate proteins effectively prevents neuronal disorders in animal and cell models.8
Numerous studies showed that autophagic enhancement is a practical approach to abolish the aberrant neuronal aggregation.9,10 Recent development to alleviate progressive neurodegeneration of intracellular aggregate-prone proteins by enhancing autophagy has attracted good attention. New drugs to reduce expanded polyQ through autophagy in neuron cells without affecting viabilities are always in pursuit. To further discover more potential drugs to ameliorate aggregates, the established clones of human neuroblastoma cells SK-N-SH were induced to express the N-terminal fragment of TATA-binding domain protein (TBP) enclosing various polyQ repeats tagged with enhanced green fluorescence protein (EGFP) at 3′-end. The triazole derivatives were reported effective in slowing the progression of Parkinson disease.11 By screening a panel of compounds with similar structures, the work described identification and evaluation of a new synthetic triazole molecule, OC-13, that dissolves polyQ aggregates while maintaining cell viabilities. The induced autophagy mediated dose-dependent elimination of the aggregated protein containing expanded glutamine stretches. The autophagy inhibitors suppressed polyQ aggregation eradication and blocked drug activity. The autophagic clearance involved activation of c-Jun N-terminal protein kinase 1 and 2 (JNK1/2) pathway. The findings provided another candidate chemical with potential to erase the accumulated polyQ aggregates and protect neuronal cells.
Materials and methods
Constructs of cDNA with EGFP-conjugated ΔC-TBP containing 36 and 79 glutamine repeats
The hemagglutinin-tagged full-length TBP/Q36 and Q79 cDNA inserts in the pGEM-T Easy (Promega Corporation, Fitchburg, WI, USA) and pcDNA5/FRT/TO (Thermo Fisher Scientific, Waltham, MA, USA) vectors were generated similar to previously described.12 To manufacture C-terminus-deleted ΔC-TBP/Q79-EGFP construct, the EcoRI (in the multiple cloning sites (MCS) of pGEM-T Easy)-RsaI fragment containing N-terminus ΔC-TBP/Q79 (203 amino acids) was cut from the cloned TBP/Q79 cDNA and fused in-frame with the EGFP gene between the EcoRI and RsaI sites in the MCS of the pEGFP-N1 vector (Clontech, Mountain View, CA, USA). The Kozak sequence of the EGFP gene was removed by polymerase chain reaction using the site-directed primer CGGGCCCGGGATCCACCGGTCGCCΔGTGAGCAAGGGCGAGGAGCTG (Δ = ACCATG). The deleted Kozak sequence was confirmed by DNA sequencing.13
Cell lines
Human neuroblastoma SK-N-SH cells were obtained from the American Type Culture Collection (ATCC, Manassas, VA, USA) and cultured in Dulbecco’s Modified Eagle’s Medium containing 10% fetal bovine serum (Thermo Fisher Scientific, Waltham, MA, USA) under humidified atmosphere supplemented with 5% CO2 at 37°C. SK-N-SH cells were transfected with ΔC-TBP/Q36 or ΔC-TBP/Q79 construct by Lipofectamine 2000 (Thermo Fisher Scientific) and selected by 20 μg/mL of blasticidin (Sigma-Aldrich Co., St Louis, MO, USA) and the stable cell lines established. Expression EGFP-conjugated protein was induced by doxycycline (20 μg/mL, Thermo Fisher Scientific) for 4 days.
Chemicals and materials
Compound OC-13 was synthesized by adding sodium azide (2.2 mmol), 1,3-bis(ethynyloxy)benzene (1.1 mmol), and CuSO4·5H2O (10 mol%) to the solution of the 5-(iodomethyl)-3-naphthyloxazolidin-2-one (2.0 mmol) in dimethyl sulfoxide (DMSO; 2 mL). The mixture was stirred at 80°C until the starting material was consumed as indicated by thin layer chromatography (5 hours). After cooling the reaction mixture, crushed ice was added and the resulting precipitate filtered, washed with excess of water and dried to obtain the desired triazole. The crude product was further purified by recrystalizing in methanol. When no precipitate was observed, the triazole was isolated after extraction with ethyl acetate. Further purification was carried out by column chromatography using ethyl acetate/hexane as eluent and white solid obtained, melting point: 193°C–195°C; 1H NMR (400 MHz, CDCl3): δ 7.90 (s, 2H), 7.84–7.80 (m, 4H), 7.49 (s, 6H), 7.43 (t, J=7.8 Hz, 2H), 7.22–7.41 (m, 3H), 6.16 (t, J=9.8 Hz, 3H), 5.20–5.14 (m, 6H), 4.76 (d, J=3.5 Hz, 4H), 4.15 (t, J=9.1 Hz, 2H), 3.93–3.91 (m, 2H); 13C NMR (100 MHz, CDCl3): 159.4, 155.8, 144.5, 134.4, 132.9, 130.2, 129.6, 129.0, 128.6, 127.2, 126.6, 125.6, 124.9, 124.8, 122.0, 107.8, 102.2, 71.4, 61.6, 52.2, 50.5. Mass spectrometry (electrospray ionization) (m/z) (relative intensity) 745[(M+Na)+, 100], 736 (10), 459 (3). High resolution mass spectrometry (electrospray ionization) calculated for C40H34N8O6 M+ 722.2601, found: 745.2504 (M++Na). The chemicals as tested for clearance were purified to >98% and prepared at 10 mM in DMSO for storage at −20°C.
The autophagy inhibitors, bafilomycin A1 (Baf A1) and 3-methyladenine (3-MA), and the nucleus staining agent 4′,6-diamidino-2-phenylindole (DAPI) were acquired from Sigma-Aldrich. JNK inhibitor Sp600125 was from Selleckchem (Houston, TX, USA). The tet-On system inducer, doxycycline, was from Clontech.
Autophagy detection by LysoTracker staining
The acidic intracellular compartments of the developing autophagosome were visualized by LysoTracker staining. After incubating with different concentrations of drugs, cells were washed with phosphate-buffered saline (PBS) and added with 100 nM intracellular acidic vesicular dye LysoTracker (Thermo Fisher Scientific) for 15 minutes at 37°C. The stained cells were washed and observed under the inverted fluorescence microscope. The intracellular acidification was assessed by FACSCalibur (BD Biosciences, Taipei, Taiwan) flow cytometer. The measured red and green fluorescence distributions were converted into ratios (mean FL3/FL1, arbitrarily set to 1 for control samples). The intensities of the collected cells were analyzed by Cell Quest software (BD Biosciences).
Immunoblotting
The cells were washed with PBS and lysed with radioimmunoprecipitation assay buffer (150 mM NaCl, 50 mM Tris–HCl, pH 8.0, 25 mM ethylenediaminetetraacetic acid) in 60 mm petri dishes. The collected cell lysates were stocked under refrigeration of −20°C. Equal amounts of protein samples were analyzed by sodium dodecyl sulfate polyacrylamide gel electrophoresis (8%–12%) and transferred to a nitrocellulose membrane. The blots were incubated with primary antibodies and then probed with peroxidase-conjugated antimouse or -rabbit secondary antibodies at 4°C for 18 hours. The antibodies used were against EGFP (Abomics, Turku, Finland), p62/SQSTM1 (Abcam, Cambridge, UK), glyceraldehyde 3-phosphate dehydrogenase, Akt, phospho-Akt473 (Genetex, Irvine, CA, USA), S6K, phospho-S6K (Cell Signaling, Danvers, MA, USA), phospho-JNK, JNK, Beclin-1, Bcl-2 (Santa Cruz Biotechnology Inc, Dallas, TX, USA), or LC3 (MBL, Woburn, MA, USA), respectively. The immunoblots were then stained with enhanced chemiluminescence and detected by LAS3000 detector. The blot densitometries were determined using MultiGauge software (Fuji Film, Tokyo, Japan).
Determination of aggregation clearance by fluorescence microscopy
Cells were stained with DAPI (10 μg/mL) following drug treatment and washed with PBS. The aggregates were measured by Live-Cell Imaging fluorescence microscopy (Leica, Singapore) and quantitated. The emergent spots in 500 EGFP positive cells were counted, converted into percentage ratios and analyzed statistically.
Confocal microscopy
Cells were seeded in chamber slides and treated with the various concentration of the compound. The slides with attached cells were washed with PBS twice and fixed with 4% paraformaldehyde in PBS for 15 minutes at room temperature. The slides were then incubated with 1:500 dilution of primary antibody against LC3 at 4°C overnight, followed by tetramethylrhodamine-conjugated antimouse or -rabbit secondary antibody of dilution 1:500 overnight. The antibodies were diluted in PBS-T (3.2 mM Na2HPO4, 0.5 mM KH2PO4, 1.3 mM KCl, 135 mM NaCl, 0.05% Tween-20, pH 7.4). The slides mounted with 90% glycerol in PBS were detected with Leica TCS5 confocal spectroscope. The images were analyzed by LAS AF Lite (Leica) software.
Statistical analysis
The statistical significance was analyzed by one-way analysis of variance analysis. The P-value of <0.05 was considered statistically significant.
Results
The identification of the triazole compound that activated autophagy
To identify candidate chemicals that suppressed aggregates as a result of the induced polyQ proteins, human neuroblastoma cells SK-N-SH were transfected with plasmids encoding EGFP-conjugated ΔTBP in which the C-terminus DNA binding domain was deleted. The residual N-terminus TBP fragment contained successive 36 (ΔC-TBP/Q36-EGFP) and 79 glutamine repeats (ΔC-TBP/Q79-EGFP), respectively (Figure 1A). The established stable clones, Q36 and Q79, were induced with doxycycline to express the EGFP-conjugated chimeric proteins, ΔC-TBP-Q36-EGFP (Q36-EGFP) and ΔC-TBP-Q79-EGFP (Q79-EGFP), respectively. The clones as induced were treated with a panel of synthetic triazole chemicals. The formation of autophagosome was monitored by flow cytometry analysis in cells stained with LysoTracker.14,15 Among them, OC-13 (5,5′-(4,4′-(1,3-phenylene-bis(oxy))-bis(methylene)-bis(1H-1,2,3-triazole-4,1-diyl))-bis(methylene)-bis(3-(naphthalene-1-yl)oxazolidin-2-one); molecular weight 722.2; Figure 1B) enhanced intensities of LysoTracker fluorescence (Figure 1C) and the effects were time- and concentration-dependent (Figure 1D and E). The improved autophagy did not affect cell viabilities (Figure 1F).
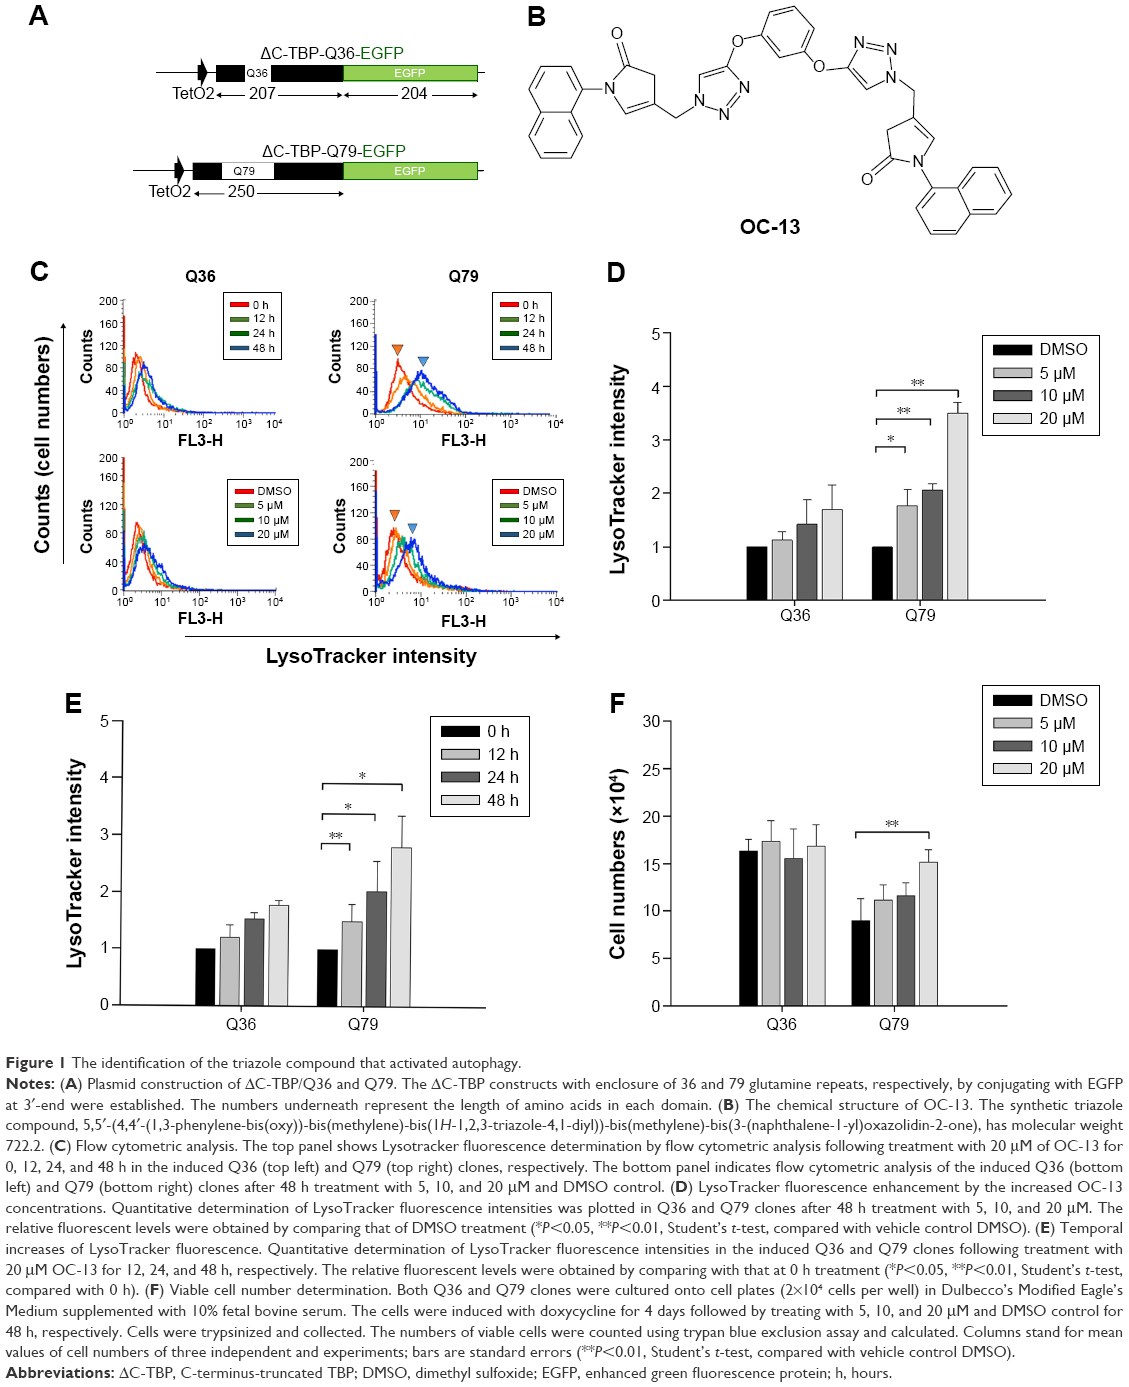 | Figure 1 The identification of the triazole compound that activated autophagy. |
OC-13 activated autophagic flux and dissolved the insoluble high molecular weight Q79-EGFP aggregates
Western blot analysis showed that the intensities of high molecular weight Q79-EGFP that accumulated in the stacking gels was reduced after 48 hours treatment. The results indicated dissolution of insoluble aggregates by OC-13 (Figure 2A). Dose-dependent increase of Beclin-1 and LC3-II/LC3-I ratios along with breakdown of p62/SQSTM1 protein (hereafter referred to as p62) supported autophagic flux during clearance. As lysates of OC-13-treated cells were subjected to a filter trap assay by incubating the blot with EGFP antibody, the collected sodium dodecyl sulfate-insoluble Q79-EGFP aggregates were shown dissipated (Figure 2B) indicating enhanced amelioration of the insoluble masses with increasing OC-13 concentrations. Densitometric determination showed that >50% of the aggregated Q79-EGFP was dissolved as drug concentration reached 10 μM. The levels of the soluble EGFP protein in Q79 clone were escalated at the expense of those of the insoluble high molecular weight Q79-EGFP (Figure 2C) and the effects are dose-dependent (Figure 2D). On the other hand, a minor amount of polyQ aggregate was shown in the Q36 clone and OC-13 exerted no variation on the soluble Q36-EGFP protein levels.
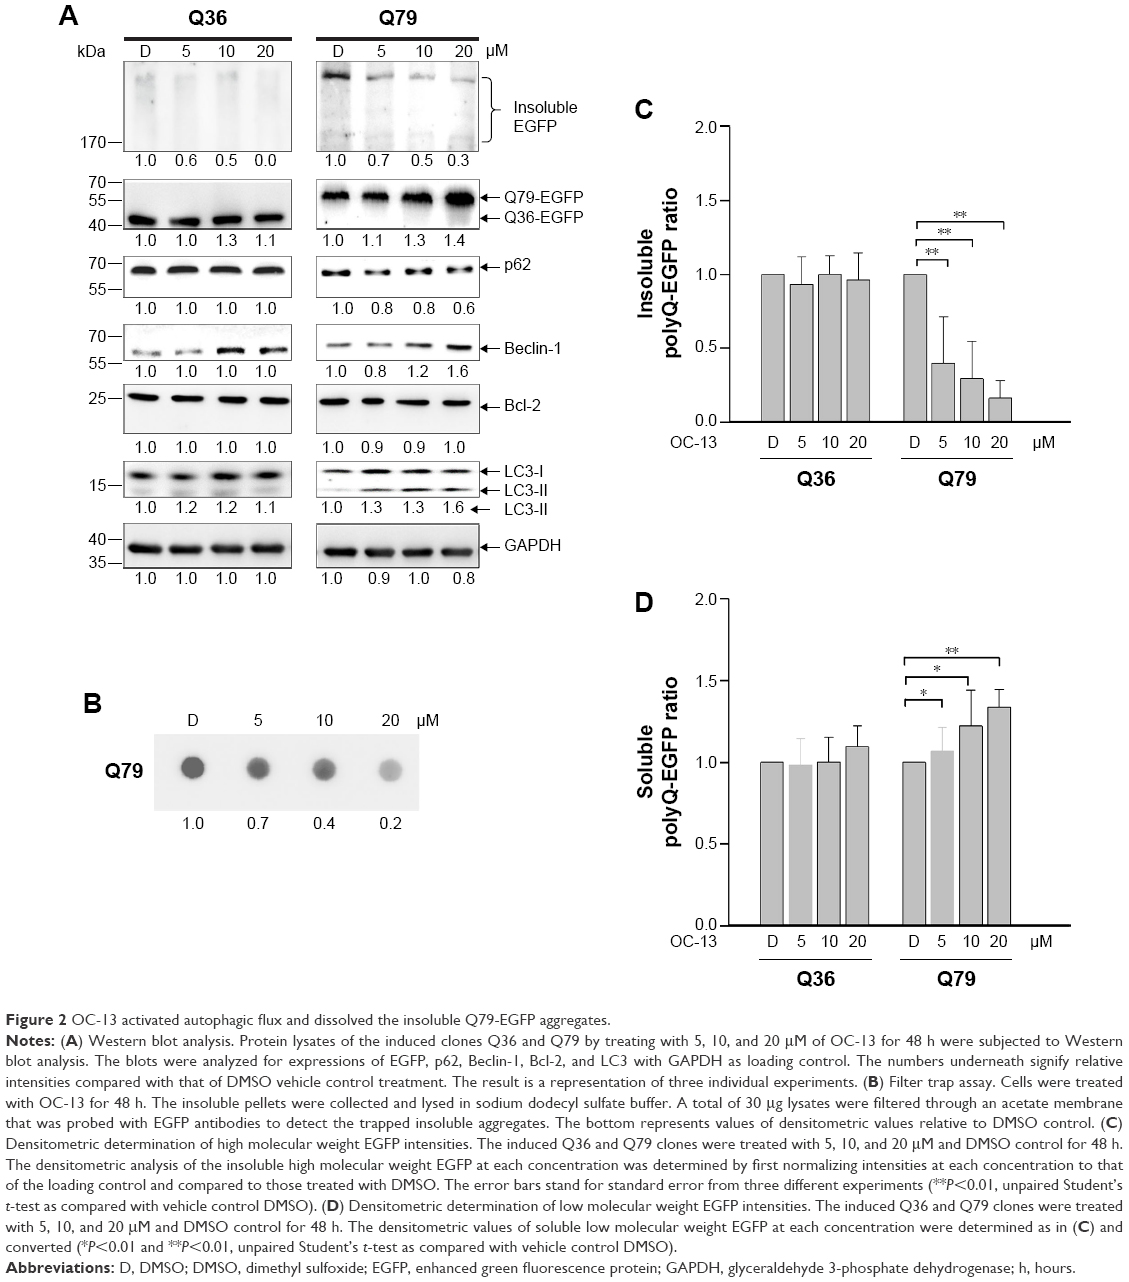 | Figure 2 OC-13 activated autophagic flux and dissolved the insoluble Q79-EGFP aggregates. |
Nucleus exclusion and autophagic amelioration of Q79-EGFP aggregates by OC-13
The induced Q79-EGFP aggregate formation in nucleus was proved by confocal microscopy. The emerging EGFP (green) next to nucleus (blue) with increasing OC-13 concentrations indicated that polyQ proteins were excluded from nucleus into cytosol (Figure 3A). The induced autophagy marker puncta LC3 (yellow) that coalesced with the increased cytosolic EGFP indicated that the aggregates were removed from nucleus by compound OC-13 that prompted the autophagosome formation to dissipate the accumulated polyQ (Figure 3B) and the increased drug concentrations accentuated the amelioration (Figure 3C).
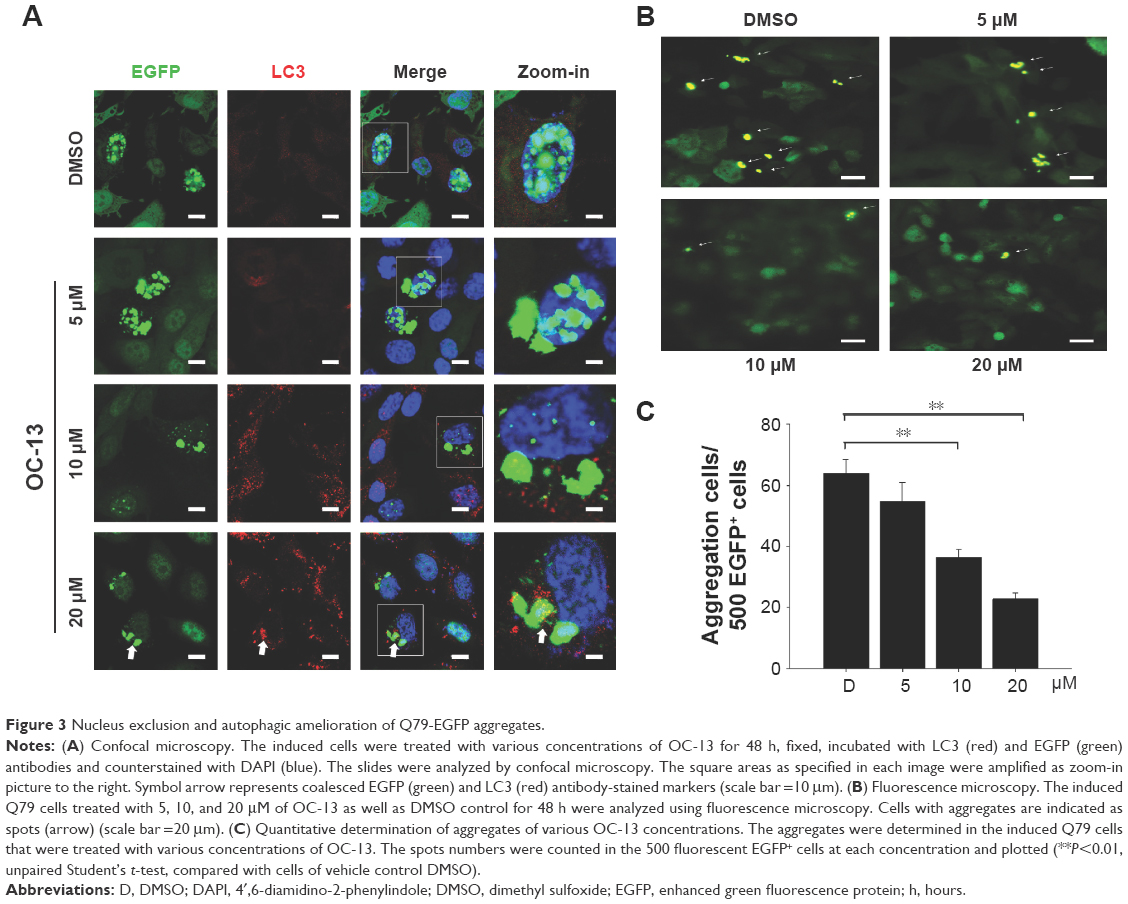 | Figure 3 Nucleus exclusion and autophagic amelioration of Q79-EGFP aggregates. |
The autophagic clearance is related to JNK signaling pathway activation
To find out the mechanistic aspect of the induced autophagy, Western blot analysis showed that OC-13 not only increased Beclin-1 expression, but also induced phosphorylation of JNK1/2, Akt, and S6K (Figure 4A). Upregulated Beclin-1 activated autophagy.16 The increased Akt, S6K, and JNK1/2 phosphorylation in Western blot by incubating with their respective anti-phosphorylated antibodies suggested that the enhanced autophagy is attributed to either activation of class III phosphatidyl inositol 3 kinase-Akt axis or JNK1/2 pathway.17,18 It is known that phosphorylated Akt-stimulated S6K phosphorylation negatively regulates mammalian target of rapamycin (mTOR)-dependent autophagy pathway.19 The results implied that the induced autophagic clearance of Q79-EGFP aggregates involves Beclin-1 and JNK signaling activation and is mTOR independent.20–22
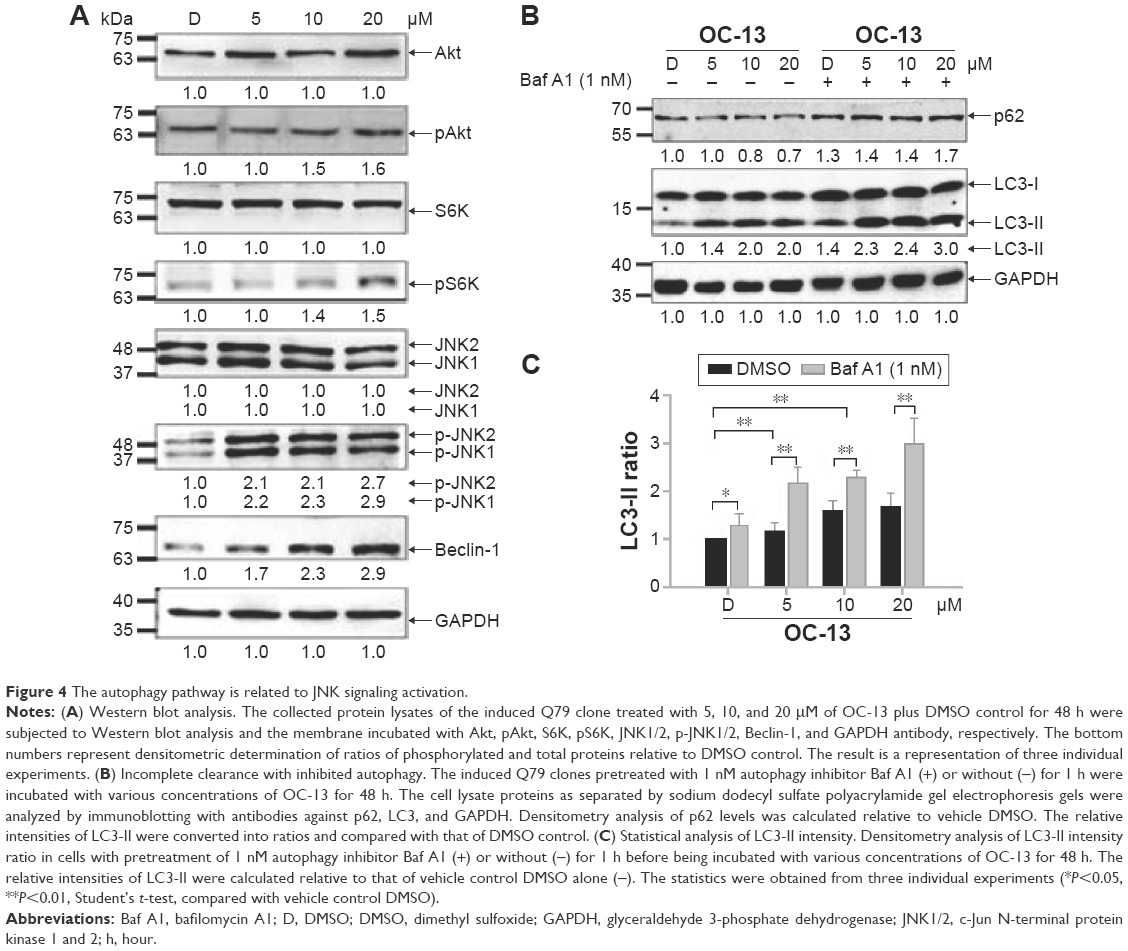 | Figure 4 The autophagy pathway is related to JNK signaling activation. |
Autophagy degrades protein accumulation by sequestering and delivering large aggregates to lysosome.23 The increased LC3-II/LC3-I ratio signaled formation of autophagosome prior to fusion to lysosomes. To test if aggregation clearance involves lysosomal activities, the induced Q79 clone was incubated with autophagolysosome inhibitor Baf A1 for 1 hour before treating with OC-13. As an inhibitor of the vacuolar ATPase, Baf A1 accumulates LC3-II, blocks autophagic flux and impairs fusion of autophagosome and lysosome. In addition, the delayed turnover of cargo adaptor p62 meant impaired autophagic degradation of ubiquitinated proteins.24,25 Pretreatment Baf A1 increased endogenous LC3-II/LC3-I that was further exacerbated by OC-13. The impaired lysosomal acidification by Baf A1 resulted in failure of LC3-II protein turnover.26,27 Elevation in the endogenous and conspicuous retention of LC3-II supported failure of autophagosome to fuse with lysosomes (Figure 4B). Baf A1 incapacitated turnover of p62 and hampered autolysosomes fusion (Figure 4B) and blocked degradation of LC3-II of Q79 (Figure 4C).
Inhibition autophagy flux blocked clearance of the Q79-EGFP aggregates by OC-13
To ascertain that OC-13 triggered JNK-dependent autophagy that reduced expanded polyQ protein aggregates, pretreatment of JNK inhibitor Sp600125, and autophagy inhibitors Baf A1 and 3-MA impaired clearance of the green fluorescent aggregation. On the other hand, insulin failed to impede the autophagy flux from clearing the accumulated aggregates (Figure 5A and B) that were supported by Western blot analysis (Figure 5C and D). The results of confocal microscopy elicited that the autophagy inhibitors and Sp600125 impaired elimination of Q79-EGFP aggregates (Figure 6A). More statistical analysis showed that 3-MA and JNK inhibitor diminished LC3 puncta, whereas the accumulated autophagosomes by Baf A1 failed to fuse with lysosome to eradicate polyQ proteins (Figure 6B).
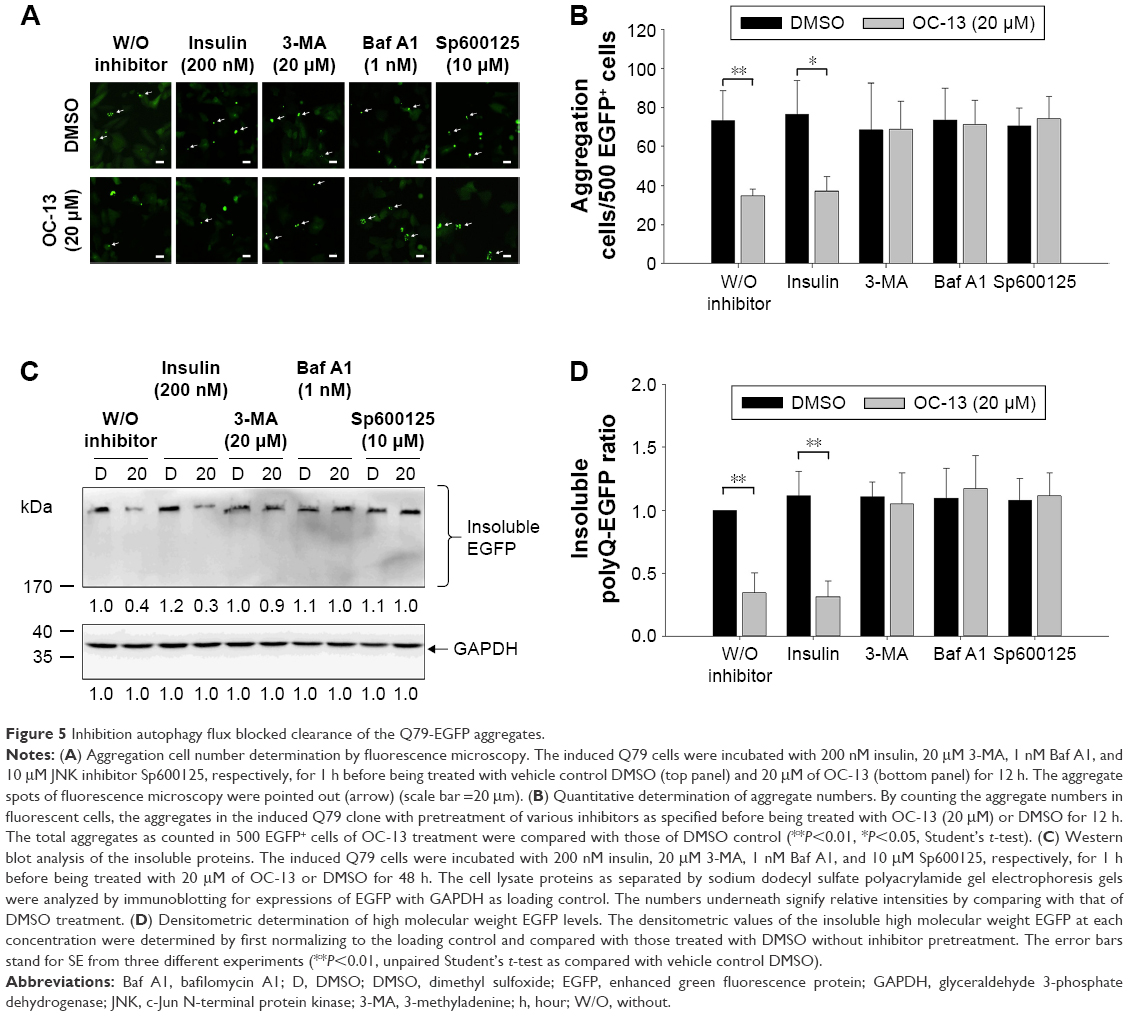 | Figure 5 Inhibition autophagy flux blocked clearance of the Q79-EGFP aggregates. |
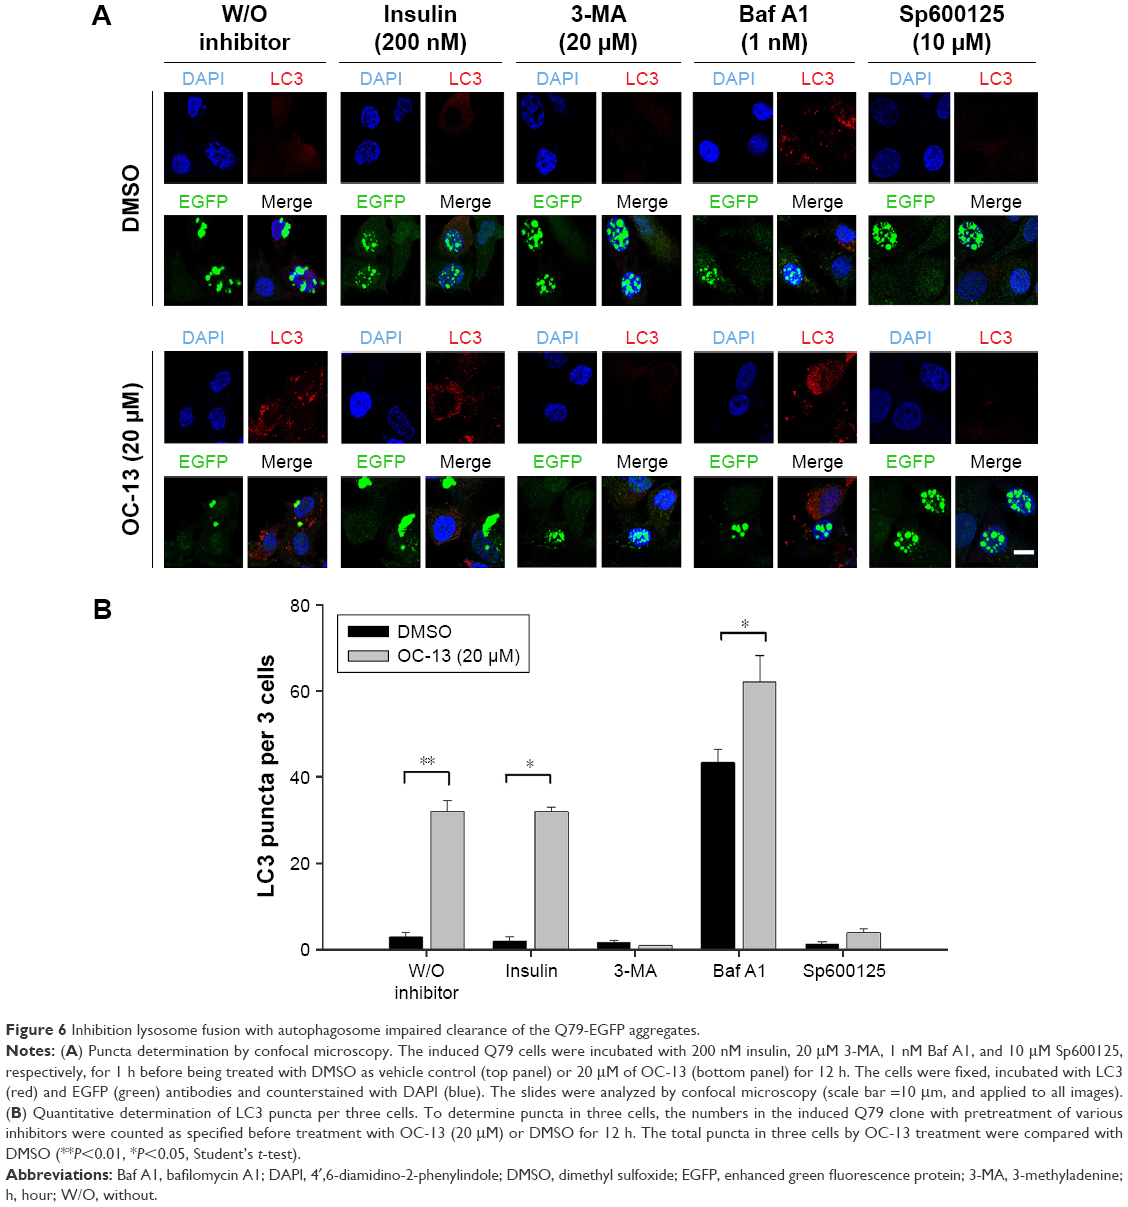 | Figure 6 Inhibition lysosome fusion with autophagosome impaired clearance of the Q79-EGFP aggregates. |
Discussion
New strategies to eliminate mutant protein aggregates are growing and their comprehensive mechanisms elucidated increasingly.28 The misfolded mutant proteins tend to aggregate and become toxic. Because the insoluble aggregated form is at times a poor proteasome substrate, autophagy turns out a viable and major alternative to ease the pathogenesis. Autophagy dysfunction exacerbates the progress of various neuronal degeneration. Activation of autophagic clearance promises to mitigate the disorders.8,29
The autophagic pathway cleared mutant polyQ of androgen receptor from motor neuronal cells that caused spinal and bulbar muscular atrophy.30 Autophagy upregulation is known to be beneficial to reduce aggregate-prone polyQ proteins that protect cell integrity with implication of alleviating neurodegeneration.31 The establishment of neuroblastoma cells with inducible Q79-EGFP serves as a viable tool to assess aggregation development, as compared with that of Q36-EGFP. The results showed that a triazole compound OC-13 removed the induced nuclear polyQ aggregation in Q79 clone as indicated by Western blot analysis and confocal microscopy. Activation of autophagy by OC-13 suppressed polyQ accumulation in cultured cells, in which the targeted cytoplasmic components is enclosed by double-membrane autophagosome that subsequently fused with lysosomes for degrading mutant aggregates.32 The compound induced autophagy by activating Beclin-1. Then cargo adaptor p62 binds ubiquitinated proteins and recruits LC3-I. The resultant turnover of LC3-I to LC-II and p62 degradation facilitated assembly of autophagy machinery as autolysosome. The presence of autophagy inhibitor Baf A1 suppressed the final fusion from forming autophagolysosomes and hampering aggregates from being cleared.
Expansion of glutamine tracts exceeding a normal range of elongated polyQ stretch at its amino-terminus of the protein produces a mutant form. The aberrant protein with expanded glutamine repeats formed aggregates in neurons.33 While the induced nuclear Q79 aggregations remained intact under DMSO control, OC-13 activated JNK that phosphorylated Bcl-2 and dissociated from Beclin-1 and helped autophagy development.28 Strategies to ease mutant aggregates confer protection against toxicity in cell and animal models and interrupt the disease pathogenesis.34 The approach was applied in a number of pathologies that include cancer and neurodegeneration.28 Several pharmacological inducers to upregulate autophagy in mammals are activated by mTOR-dependent or mTOR-independent pathways.35 Rapamycin or its analog rapalogs removes expanded repeats of Htt through mTOR pathway.11,36,37 Phosphorylated Akt activated mTOR complexes, which in turn downregulated autophagy.22,38,39 On the other hand, calpastatin and rilmenidine removed polyQ aggregation such as mutant Htt and α-synuclein by activating JNK. Likewise, OC-13-induced autophagy is independent of mTOR by activating JNK1/Beclin-1 pathway through phosphorylating JNK1/2.17,37 OC-13 induced autophagy through activation of JNK1/2, which in turn reduced the insoluble polyQ aggregation. Treatment with autophagy and JNK inhibitors completely protected aggregates against autophagy-mediated clearance. The results suggested that the nontoxic OC-13 is feasible as a candidate drug for efficacious relief of neuronal disorders and the clearance of the aberrant protein accumulation depends on autophagy activation.
It is yet unclear if clearance of aggregates may be beneficial or not. Nonetheless, as autophagy upregulation becomes a feasible approach to alleviate polyQ-related disease, new strategies to accelerate the clearance of the mutant proteins are needed and growing.40 The effective autophagic substrates like mutant proteins as activated by small molecules constitute a promising therapeutic approach.41 The work showed that the synthetic triazole acts as autophagy enhancer and can be protective. By targeting misfolded protein for clearance without injuring cells, OC-13 may have good potential to reverse neurodegenerative disorders.
Conclusion
A triazole OC-13 stimulated autophagy, removed the accumulated nucleus aggregates made of EGFP-conjugated protein with enclosure of 79 polyQ repeats. The attenuated aggregated protein intensities were demonstrated by fluorescence microscopy, confocal microscopy, and Western blot analysis. The induced autophagy clearance involved the activation of JNK, whose inhibitor blocked the amelioration. The results provided a new dimension of the new compound that promises a new approach to clear polyQ aggregation in neuronal cells.
Acknowledgments
The work is supported by grants from the National Taiwan Normal University (102T3040B2, 103T3040C2, and 104T3040D2). Scholarship to Chang Heng Hsieh by Taiwan Foundation of Rare Disorders is appreciated. Technical assistance of confocal laser microscopy from College of Life Science and Instrumentation Center, National Taiwan University, and fluorescence and confocal laser microscopy from Department of Life Science and Instrumentation Center, National Taiwan Normal University is acknowledged.
Disclosure
The authors report no conflicts of interest in this work.
References
Wong E, Cuervo AM. Autophagy gone awry in neurodegenerative diseases. Nat Neurosci. 2010;13(7):805–811. | ||
Duarte-Silva S, Silva-Fernandes A, Neves-Carvalho A, Soares-Cunha C, Teixeira-Castro A, Maciel P. Combined therapy with m-TOR-dependent and -independent autophagy inducers causes neurotoxicity in a mouse model of Machado–Joseph disease. Neuroscience. 2016;313:162–173. | ||
del Cano-Espinel M, Acebes JR, Sanchez D, Ganfornina MD. Lazarillo-related Lipocalins confer long-term protection against type I spinocerebellar ataxia degeneration contributing to optimize selective autophagy. Mol Neurodegener. 2015;10:11. | ||
Duncan C, Papanikolaou T, Ellerby LM. Autophagy: polyQ toxic fragment turnover. Autophagy. 2010;6(2):312–314. | ||
Takahashi T, Katada S, Onodera O. Polyglutamine diseases: where does toxicity come from? What is toxicity? Where are we going? J Mol Cell Biol. 2010;2(4):180–191. | ||
Mizushima N, Klionsky DJ. Protein turnover via autophagy: implications for metabolism. Annu Rev Nutr. 2007;27:19–40. | ||
Martin DD, Ladha S, Ehrnhoefer DE, Hayden MR. Autophagy in Huntington disease and huntingtin in autophagy. Trends Neurosci. 2015;38(1):26–35. | ||
Rubinsztein DC, Gestwicki JE, Murphy LO, Klionsky DJ. Potential therapeutic applications of autophagy. Nat Rev Drug Discov. 2007;6(4):304–312. | ||
Sarkar S, Rubinsztein DC. Huntington’s disease: degradation of mutant huntingtin by autophagy. FEBS J. 2008;275(17):4263–4270. | ||
Wei PF, Zhang L, Nethi SK, et al. Accelerating the clearance of mutant huntingtin protein aggregates through autophagy induction by europium hydroxide nanorods. Biomaterials. 2014;35(3):899–907. | ||
Ray S, Liu M. Current understanding of LRRK2 in Parkinson’s disease: biochemical and structural features and inhibitor design. Future Med Chem. 2012;4(13):1701–1713. | ||
Lee LC, Chen CM, Chen FL, et al. Altered expression of HSPA5, HSPA8 and PARK7 in spinocerebellar ataxia type 17 identified by 2-dimensional fluorescence difference in gel electrophoresis. Clin Chim Acta. 2009;400(1–2):56–62. | ||
Lee L-C, Chen C-M, Wang P-R, Su M-T, Lee-Chen G-J, Chang C-Y. Role of high mobility group box 1 (HMGB1) in sca17 pathogenesis. PLoS One. 2014;9(12):e115809. | ||
Chikte S, Panchal N, Warnes G. Use of LysoTracker dyes: a flow cytometric study of autophagy. Cytometry A. 2014;85(2):169–178. | ||
Warnes G. Measurement of autophagy by flow cytometry. Curr Protoc Cytom. 2014;68:9.45.1–9.45.10. | ||
Mealer RG, Murray AJ, Shahani N, Subramaniam S, Snyder SH. Rhes, a striatal-selective protein implicated in Huntington disease, binds Beclin-1 and activates autophagy. J Biol Chem. 2014;289(6):3547–3554. | ||
Sarkar S. Regulation of autophagy by mTOR-dependent and mTOR-independent pathways: autophagy dysfunction in neurodegenerative diseases and therapeutic application of autophagy enhancers. Biochem Soc Trans. 2013;41(5):1103–1130. | ||
Sarkar S. Chemical screening platforms for autophagy drug discovery to identify therapeutic candidates for Huntington’s disease and other neurodegenerative disorders. Drug Discov Today Technol. 2013;10(1):e137–e144. | ||
Liu Q, Thoreen C, Wang J, Sabatini D, Gray NS. mTOR mediated anti-cancer drug discovery. Drug Discov Today Ther Strateg. 2009;6(2):47–55. | ||
Floto RA, Sarkar S, Perlstein EO, Kampmann B, Schreiber SL, Rubinsztein DC. Small molecule enhancers of rapamycin-induced TOR inhibition promote autophagy, reduce toxicity in Huntington’s disease models and enhance killing of mycobacteria by macrophages. Autophagy. 2007;3(6):620–622. | ||
Renna M, Jimenez-Sanchez M, Sarkar S, Rubinsztein DC. Chemical inducers of autophagy that enhance the clearance of mutant proteins in neurodegenerative diseases. J Biol Chem. 2010;285(15):11061–11067. | ||
Roscic A, Baldo B, Crochemore C, Marcellin D, Paganetti P. Induction of autophagy with catalytic mTOR inhibitors reduces huntingtin aggregates in a neuronal cell model. J Neurochem. 2011;119(2):398–407. | ||
Ravikumar B, Duden R, Rubinsztein DC. Aggregate-prone proteins with polyglutamine and polyalanine expansions are degraded by autophagy. Hum Mol Genet. 2002;11(9):1107–1117. | ||
Rossi M, Munarriz ER, Bartesaghi S, et al. Desmethylclomipramine induces the accumulation of autophagy markers by blocking autophagic flux. J Cell Sci. 2009;122(Pt 18):3330–3339. | ||
Zhang D, Zhang W, Li D, Fu M, Chen R, Zhan Q. GADD45A inhibits autophagy by regulating the interaction between BECN1 and PIK3C3. Autophagy. 2015;11(12):2247–2258. | ||
Mauvezin C, Neufeld TP. Bafilomycin A1 disrupts autophagic flux by inhibiting both V-ATPase-dependent acidification and Ca-P60A/SERCA-dependent autophagosome-lysosome fusion. Autophagy. 2015;11(8):1437–1438. | ||
Zhu S, Rea SL, Cheng T, et al. Bafilomycin A1 attenuates osteoclast acidification and formation, accompanied by increased levels of SQSTM1/p62 Protein. J Cell Biochem. 2016;117(6):1464–1470. | ||
Jimenez-Sanchez M, Thomson F, Zavodszky E, Rubinsztein DC. Autophagy and polyglutamine diseases. Prog Neurobiol. 2012;97(2):67–82. | ||
Williams A, Jahreiss L, Sarkar S, et al. Aggregate-prone proteins are cleared from the cytosol by autophagy: therapeutic implications. Curr Top Dev Biol. 2006;76:89–101. | ||
Rusmini P, Bolzoni E, Crippa V, et al. Proteasomal and autophagic degradative activities in spinal and bulbar muscular atrophy. Neurobiol Dis. 2010;40(2):361–369. | ||
Watson LM, Scholefield J, Greenberg LJ, Wood MJ. Polyglutamine disease: from pathogenesis to therapy. S Afr Med J. 2012;102(6):481–484. | ||
Settembre C, Fraldi A, Jahreiss L, et al. A block of autophagy in lysosomal storage disorders. Hum Mol Genet. 2008;17(1):119–129. | ||
Cortes CJ, La Spada AR. Autophagy in polyglutamine disease: Imposing order on disorder or contributing to the chaos? Mol Cell Neurosci. 2015;66(Pt A):53–61. | ||
Sarkar S, Krishna G, Imarisio S, Saiki S, O’Kane CJ, Rubinsztein DC. A rational mechanism for combination treatment of Huntington’s disease using lithium and rapamycin. Hum Mol Genet. 2008;17(2):170–178. | ||
Baldo B, Soylu R, Petersen A. Maintenance of basal levels of autophagy in Huntington’s disease mouse models displaying metabolic dysfunction. PLoS One. 2013;8(12):e83050. | ||
Sarkar S, Ravikumar B, Floto RA, Rubinsztein DC. Rapamycin and mTOR-independent autophagy inducers ameliorate toxicity of polyglutamine-expanded huntingtin and related proteinopathies. Cell Death Differ. 2009;16(1):46–56. | ||
Rose C, Menzies FM, Renna M, et al. Rilmenidine attenuates toxicity of polyglutamine expansions in a mouse model of Huntington’s disease. Hum Mol Genet. 2010;19(11):2144–2153. | ||
Qi M, Zhou H, Fan S, et al. mTOR inactivation by ROS-JNK-p53 pathway plays an essential role in psedolaric acid B induced autophagy-dependent senescence in murine fibrosarcoma L929 cells. Eur J Pharmacol. 2013;715(1–3):76–88. | ||
Song YM, Song SO, Jung YK, et al. Dimethyl sulfoxide reduces hepatocellular lipid accumulation through autophagy induction. Autophagy. 2012;8(7):1085–1097. | ||
Sarkar S, Ravikumar B, Rubinsztein DC. Autophagic clearance of aggregate-prone proteins associated with neurodegeneration. Methods Enzymol. 2009;453:83–110. | ||
Nedelsky NB, Todd PK, Taylor JP. Autophagy and the ubiquitin-proteasome system: collaborators in neuroprotection. Biochim Biophys Acta. 2008;1782(12):691–699. |
 © 2016 The Author(s). This work is published and licensed by Dove Medical Press Limited. The full terms of this license are available at https://www.dovepress.com/terms.php and incorporate the Creative Commons Attribution - Non Commercial (unported, v3.0) License.
By accessing the work you hereby accept the Terms. Non-commercial uses of the work are permitted without any further permission from Dove Medical Press Limited, provided the work is properly attributed. For permission for commercial use of this work, please see paragraphs 4.2 and 5 of our Terms.
© 2016 The Author(s). This work is published and licensed by Dove Medical Press Limited. The full terms of this license are available at https://www.dovepress.com/terms.php and incorporate the Creative Commons Attribution - Non Commercial (unported, v3.0) License.
By accessing the work you hereby accept the Terms. Non-commercial uses of the work are permitted without any further permission from Dove Medical Press Limited, provided the work is properly attributed. For permission for commercial use of this work, please see paragraphs 4.2 and 5 of our Terms.