")
Back to Journals » International Journal of Nanomedicine » Volume 12
A tetraethylene glycol coat gives gold nanoparticles long in vivo half-lives with minimal increase in size
Authors Willett JDS, Lawrence MG, Wilder JC, Smithies O
Received 4 September 2016
Accepted for publication 10 February 2017
Published 31 March 2017 Volume 2017:12 Pages 2581—2592
DOI https://doi.org/10.2147/IJN.S121486
Checked for plagiarism Yes
Review by Single anonymous peer review
Peer reviewer comments 3
Editor who approved publication: Professor Carlos Rinaldi
Julian DS Willett, Marlon G Lawrence, Jennifer C Wilder, Oliver Smithies†
Department of Pathology and Laboratory Medicine, University of North Carolina at Chapel Hill, Chapel Hill, NC, USA
†Dr Oliver Smithies passed away on January 10, 2017
Abstract: In this study, we describe the experiments determining whether coating gold nanoparticles with tetraethylene glycol (TEG) provides pharmacologically relevant advantages, such as increased serum half-life and resistance to protein adsorption. Monodisperse TEG-coated, NaBH4-reduced gold nanoparticles with a hydrodynamic size comparable to albumin were synthesized by reducing gold chloride with NaBH4 under alkaline conditions in the presence of TEG-SH. The particles were characterized by gel electrophoresis, column chromatography, and transmission electron microscopy. The nanoparticles were subsequently injected intravenously into mice, and their half-lives and final destinations were determined via photometric analysis, light microscopy (LM), and transmission electron microscopy. The TEG particles had a long half-life (~400 minutes) that was not influenced by splenectomy. After 500 minutes of injection, TEG particles were found in kidney proximal tubule cell vesicles and in spleen red and white pulp. The particles induced apoptosis in the spleen red pulp but not in white pulp or the kidney. Some of the TEG particles appeared to have undergone ligand exchange reactions that increased their charge. The TEG particles were shown to be resistant to nonspecific protein adsorption, as judged by gel electrophoresis and column chromatography. These results demonstrate that naturally monodisperse, small-sized gold nanoparticles coated with TEG have long in vivo plasma half-lives, are minimally toxic, and are resistant to protein adsorption. This suggests that a TEG coating should be considered as an alternative to a polyethylene glycol coating, which is polydisperse and of much larger size.
Keywords: tetraethylene glycol, tetraethylene glycol coating, polyethylene glycol, splenectomy, spleen clearance, kidney clearance
Introduction
Preexisting data show that nanoparticle coating impacts their removal from circulation.1 PEG coating has been found to be particularly useful, with coated particles remaining in serum for hours, minimally interacting with proteins that could trigger removal from circulation, and causing minor physiological consequences in the organs that filter them, notably the spleen and kidney.2–4 However, PEG is a large compound (typical formulations used have a molecular weight >2 kDa) that can increase hydrodynamic radius (HDR), limiting particle diffusion into target cells.4 PEG is also polydisperse, necessitating purification and limiting control of variables when the particles are used in medical applications. Extensive work has been done studying the in vivo behavior of these PEG nanoparticles,1–5 although a number of coats have yet to be investigated in mouse models that could overcome limitations presented by PEG. Among these, tetraethylene glycol (TEG) is particularly attractive because it has been found to confer properties comparable to those of PEG in vitro, but with less impact on overall particle size.5–9 Currently, no articles document the effect of this coat on nanoparticles in vivo. We here describe the results of experiments aimed at rectifying this absence using particles synthesized with a gold core to facilitate observation with both light microscopy (LM) and transmission electron microscopy (TEM). We characterized the TEG-coated nanoparticles, determined their plasma half-life, and studied their uptake and cytotoxic effects on the kidney and spleen. Our results show that TEG coating confers benefits similar to a PEG coating, but with a smaller increase in HDR.
Materials and methods
Chemicals
Gold(III) chloride trihydrate, reduced glutathione (GSH), and TEG-SH were obtained from Sigma Aldrich (Natick, MA, USA) (product codes: G4022, G4251, and 767751, respectively). Phosphate-buffered saline (PBS) without calcium and magnesium was obtained from Corning Cellare (Corning, NY, USA) (product code: 01-031-CV).
TEG-coated, NaBH4-reduced gold nanoparticle synthesis
Synthesis of TEG-coated particles was based on a modification of Smithies et al’s10 synthesis of GSH-coated nanoparticles. Synthesis was conducted in the following manner at room temperature while stirring vigorously with a Teflon-magnetic bar. To a 125 mL Wheaton glass bottle were added 1) 18 mL of water, 2) 800 μL of 0.1 M borax, Na2B4O7, 3) 40 μL of 5 M TEG-SH (10 mM final concentration), and 4) 800 μL of 25 mM HAuCl4. After 1 minute, 5) 160 μL of freshly prepared 0.5 M NaBH4 was added. This mixture was left overnight without stirring and then concentrated to ~200 μL with a 4 mL Amicon 30 kDa filter and stored at 4°C after diluting as described subsequently.
Gold nanoparticle dilution
To dilute nanoparticles to a standardized concentration, absorbance at 260 nm of 1/1,000 nanoparticle dilution was determined. The particle preparation was then diluted with water to a concentration that yielded an absorbance of 0.25 when diluted 1/1,000. The final volume was typically 300 μL.
Gel electrophoretic assessment of gold nanoparticle size distribution
To determine nanoparticle consistency between batches and size dispersity, 1 μL of nanoparticle formulations was mixed with 10 μL of a glycerol-containing loading buffer, LG (200 μL 80% v/v glycerol plus 80 μL 0.5 M NaHCO3, bromophenol blue to 0.05%) plus 1.2 μL of 10× PBS. The mixture was loaded into a Biorad 4%–20% Mini-PROTEAN TGX precast protein gel (BioRad Laboratories, Hercules, CA, USA) using 1× Tris/glycine running buffer without sodium-dodecyl sulfate (SDS). The gel was electrophoresed at 200 V until the bromophenol blue band neared the bottom of the gel. Gels were scanned with an Epson Perfection 3170 Photo, J161A scanner (Epson, Long Beach, CA, USA) set to: document type: reflective, 24-bit color, resolution: 720 dpi, and Unsharp Mask checked.
Gold nanoparticle core diameter determination
TEM was used to assess gold nanoparticle core diameter. Particles were diluted 1:250 with water, and 1 μL was placed on a copper glow-discharged electron microscope grid and left to dry. The core diameters of at least 1,000 nanoparticles were measured, and an average particle core diameter was calculated using the ImageJ program (software available from the National Institutes of Health).
Gold nanoparticle HDR determination
Size-exclusion chromatography was performed using a Superdex 200 10/300 GL column with PBS as the eluting buffer. Standards included IgG, bovine serum albumin, and ovalbumin. Absorbance was measured at 260 nm.
Injection of gold nanoparticles and blood collection from mice
Female B6 mice (B6 Jax), some splenectomized and permitted to heal for at least a week, were obtained, weighed, and fed normal diets. 1) A blood sample was collected from the retro-orbital sinus in one eye under light isoflurane anesthesia using a heparinized 70 μL microcapillary tube. 2) A mixture of 90 μL of gold nanoparticles (1/1,000 OD260 nm =0.25) and 10 μL 10× PBS was subsequently injected into the retro-orbital sinus of the other eye.11 3) Approximately 45 μL of blood was collected at 5, 166, 333, and 500 minutes. 4) At the end of each experiment, animals were exposed to isoflurane until they became unconscious and were then sacrificed by cervical dislocation. 5) Kidneys and spleens were collected, fixed, and stored in Karnovsky’s fixative for subsequent analysis. 6) All experiments were repeated with different batches of particles using at least three animals for each test. All mouse experimental procedures were performed following protocols approved by the Institutional Animal Care and Use Committee (IACUC) at the University of North Carolina (Smithies 14-004).
Half-life determination of TEG-coated gold nanoparticles
The microcapillary tubes containing blood samples were centrifuged for 2 minutes with an MB International Micro-Capillary Centrifuge (Damon, Needham, MA, USA), and the plasma region was scanned on an Epson J161A Scanner set to: document type: film, document type setting: positive film, 24-bit color, resolution: 1,000 dpi, and Unsharp Mask checked. ImageJ was used to calculate the plasma gray value at the center of each tube, and from this value, a relative nanoparticle concentration was calculated relative to gray values of serial dilutions of standard concentration nanoparticle preparations (1:15, 1:20, 1:25, 1:30, 1:40, 1:60, 1:100, and 1:250 dilutions). This relative concentration was then adjusted for tube-related effects by subtracting the preinjection sample relative concentration (typically close to zero). Following this measurement, the alpha-phase (distribution phase) length was determined by plotting time against relative concentration for plasma samples of a batch of particles and locating the point on the curve where the decline in relative concentration became roughly linear, delineating the end of the alpha phase (Figure 1).12 Only times after the estimated alpha phase were used during calculation of half-life as this is when half-life can be most accurately assessed.12 The natural logarithms of beta-phase relative concentrations were then plotted against time. Plasma half-lives were determined assuming first-order clearance. The slope of the subsequent beta phase, Slopeβ, was determined using Microsoft Office plots of collected data.12 This value was used to determine half-life using the following pharmacokinetic equations with each individual animal experiment. The base formula for first-order elimination is C = C0·e−Slopeβ t·.12 Half-life (t1/2) was defined as the time when  . Thus, half-life:
 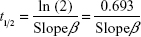 with the slope equating to:
  .12
.12
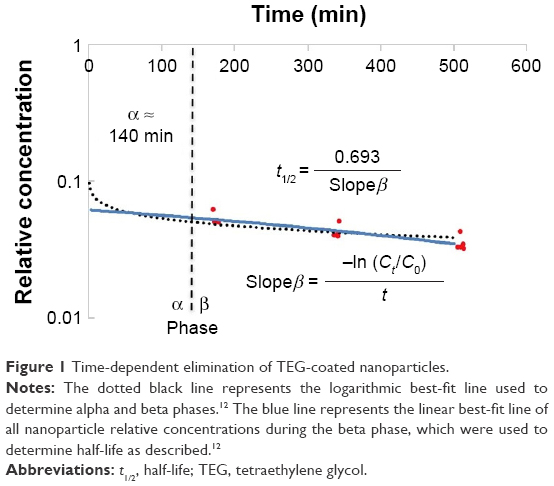 | Figure 1 Time-dependent elimination of TEG-coated nanoparticles. |
Gel electrophoresis analysis of plasma samples
To observe potential changes in nanoparticle mobility during circulation, 6 μL of plasma isolated from collected blood samples was mixed with 4.8 μL LG buffer and 1.2 μL 10× PBS. This mixture was electrophoresed at 200 V in a Tris/glycine 4%–20% gradient gel without SDS. Voltage was applied until the bromophenol blue marker was close to the bottom of the gel casing. The gel was scanned using an Epson Scanner.
Tissue analysis
Tissue sectioning
Fixed kidney and spleen samples, taken from abnormally dark tissue when apparent, were embedded in LR white resin. At least two unstained and two toluidine blue-stained sections were examined by LM, and at least two ultrathin sections were examined by TEM for each batch of nanoparticles.
Light microscopic analysis
Slides were analyzed using bright-field LM with and without bromophenol blue staining. Images were captured using Volocity imaging software from Perkin Elmer (Walthman, MA, USA). Images had their brightness adjusted using ImageJ to facilitate analysis.
Transmission electron microscopic analysis
Electron microscope images were obtained with a LEO 910 Electron Microscope. Images were analyzed with Gatan Digital Micrograph provided by Gatan, Inc. (Pleasanton, CA, USA).
Analysis of sections stained with terminal deoxynucliotidyl transferase dUTP nick end labeling (TUNEL) TUNEL reagent
Two sets of tissue for each experimental condition were stained with a Promega DeadEnd Colorimetric TUNEL System (Promega Corporation, Madison, WI, USA). For kidneys, three 200× images from one tissue slice and three 200× images from another slice were randomly selected from the cortical region (the observed region of particle uptake). Spleen images were collected similarly with emphasis on the regions containing both red and white pulps. Results were quantified by the ImageJ threshold analysis of the blue image produced after RGB split. The blue filter was chosen as it minimized background noise produced from staining and emphasized the bronze-colored TUNEL stain.
Gold nanoparticle–salt interaction assay
To study interactions between TEG nanoparticles and common cations, a TEG nanoparticle preparation was mixed 1:1 with 0.2 M KCl or 0.2 M CaCl2 and left for 5 minutes. Then, 4 μL of the mixture, 8 μL of LG buffer, and 1.3 μL of 10× PBS were electrophoresed in a 4%–20% Tris/glycine gel and scanned using an Epson Scanner.
Gold nanoparticle–pH interaction assay
To measure the effect of pH on nanoparticle stability, as visualized by electrophoretic mobility differences, a TEG nanoparticle preparation was mixed 1:1 with dilute HCl or NaOH to give final pHs from 1 to 14. After leaving samples overnight, 8 μL of LG buffer and 1.3 μL of 10× PBS were added to 4 μL of sample, and aliquots were electrophoresed in a 4%–20% Tris/glycine gel. The gel was scanned using the Epson Scanner.
Gold nanoparticle-glutathione ligand exchange assay
To determine whether intracellular concentrations of glutathione are sufficient to induce ligand exchange reactions with TEG nanoparticles,13 a TEG nanoparticle preparation was mixed 1:1 with glutathione dissolved in water to yield aliquots with a final glutathione concentration of 0.1 mM (low concentration), 1 mM (low cellular concentration), 5 mM (medium cellular concentration), and 10 mM (high cellular concentration).14 Samples were left on a bench for 1 hour. Then, 8 μL LG buffer and 1.3 μL 10× PBS were added to 4 μL of sample. The mixture was electrophoresed in a 4%–20% Tris/glycine gel and scanned using an Epson Scanner.
Statistical analyses
Half-lives and core diameters between batches of nanoparticles and the number of TUNEL-positive cells between experimental and control samples were compared with JMP 9 from the SAS Institute (Middleton, MA, USA) using one-way analysis of variance (ANOVA) with an alpha value of 0.01. Unless otherwise specified, numerical data are presented as mean ± standard error.
Results and discussion
The goal of these experiments was to determine whether a TEG-SH coat is useful for nanomedicine. TEG was chosen as a coat due to its small size and because of its chemical similarity to the widely used PEG. The primary findings were that 1) a TEG coating confers a long nanoparticle half-life, 2) the kidney and spleen completely take up the TEG-coated particles, 3) TEG particles induce apoptosis in spleen red pulp cells although not in other splenic regions or the kidney, and 4) TEG particles are initially unchanged in vivo; however, they are significantly modified by ligand exchange reactions by roughly a quarter of their half-life after injection.
Particles are consistently monodisperse
Gel electrophoresis of the TEG particles showed that they are monodisperse and have a negative charge despite TEG having no groups expected to ionize at this pH (Figure 2A).6 This has been noted in a previous study.15
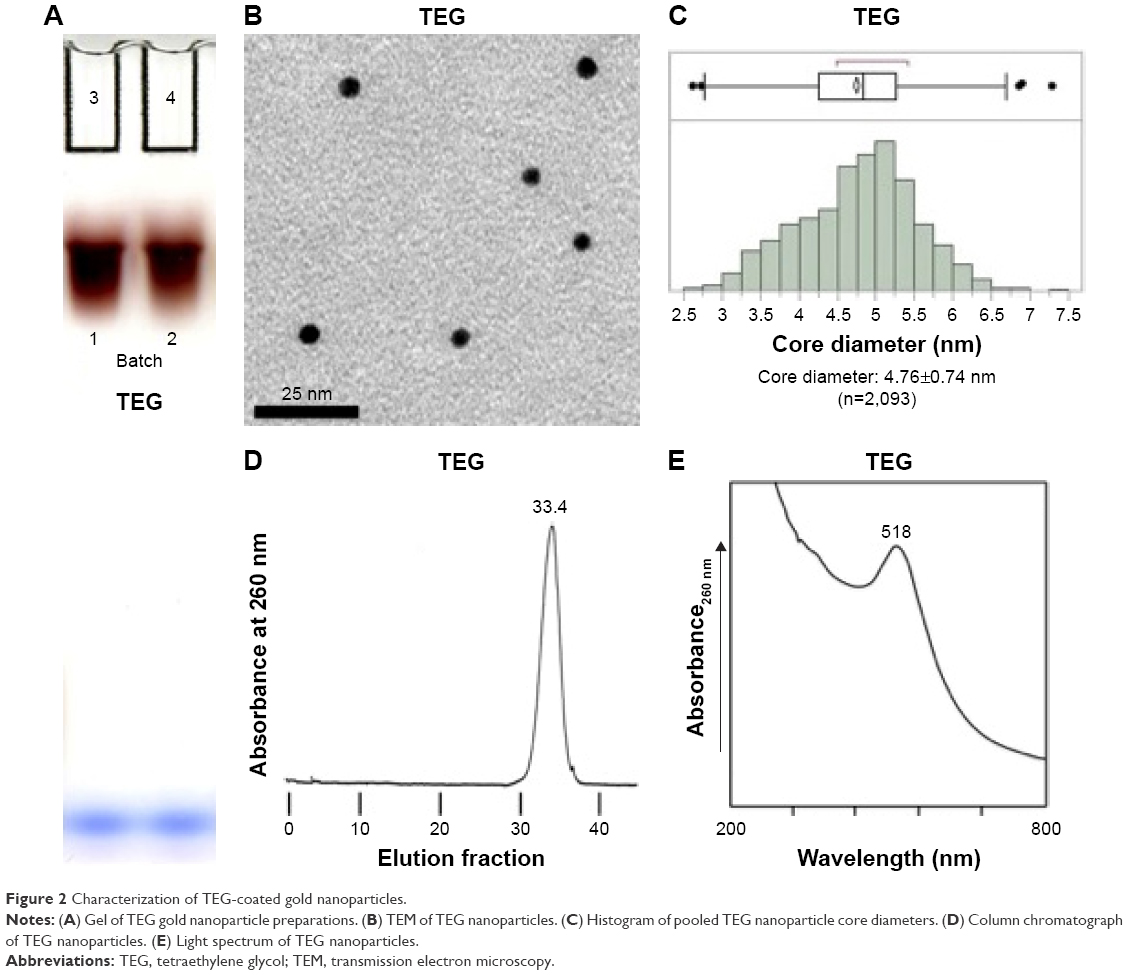 | Figure 2 Characterization of TEG-coated gold nanoparticles. |
TEG particles have a consistent core diameter
Transmission electron microscopic analysis showed that batches of TEG nanoparticles have consistent core diameters between batches as the values were within a standard deviation of each. The pooled core diameter of TEG nanoparticles was 4.76±0.74 nm (n=2,093) (Figure 2B and C). The TEG particles had a sharp, well-refined edge (Figure 2B and C). TEG particles were found to be unaffected by variations in the times of adding reagents.
TEG particles have consistent HDR
Hydrodynamic radii were compared by size-exclusion chromatography using a Superdex 200 column with PBS as the eluent buffer. On this column, fully excluded Dextran 2000 eluted in fraction 20 and fully penetrant acetone eluted in fraction 49. Two batches of TEG particles eluted at fractions 33.4 (Figure 2D) and 34.2 (data not shown), indicating a size slightly smaller than bovine serum albumin, MW 66.5 kDa.16 Elution profiles showed that the particles are monodisperse (Figure 2D).
TEG particles absorb visible light
TEG particles are ruby colored due to an absorption maximum at 518 nm (Figure 2E). The color of the TEG particles is useful because it permits the determination of a sample’s nanoparticle concentration and electrophoretic trends by equipment using visible light, which are readily available.
TEG particles have a long half-life
To determine whether a TEG coat increases nanoparticle half-life, relative concentrations of serum-based nanoparticles were plotted semilogarithmically against time as previously described with data points in the beta elimination phase used for half-life determination (Figure 3).12 The pooled half-life of two batches of TEG particles was 421±32 min (n=8) with no significant variation in this measurement between the batches (P=0.31) (Figure 3). Thus, TEG particles have long and reproducible half-lives, supporting their potential as a coating agent. These samples yielded an average alpha-phase length of 150±10 minutes.12 This half-life (~7 hours) of TEG-coated particles is largely determined by their HDR, which is slightly less than that of albumin.17 Particles of that size have been shown by Lawrence et al18 to traverse the renal glomerulus and be captured by proximal tubule (PT) cells. Larger sized PEG-coated particles do not traverse the glomerulus and so have longer half-lives and varied clearance profile (~20 hours).3 Gel electrophoresis suggests that despite the long half-life, the particles are modified during circulation with no unmodified material remaining by ~166 minutes (Figure 3).
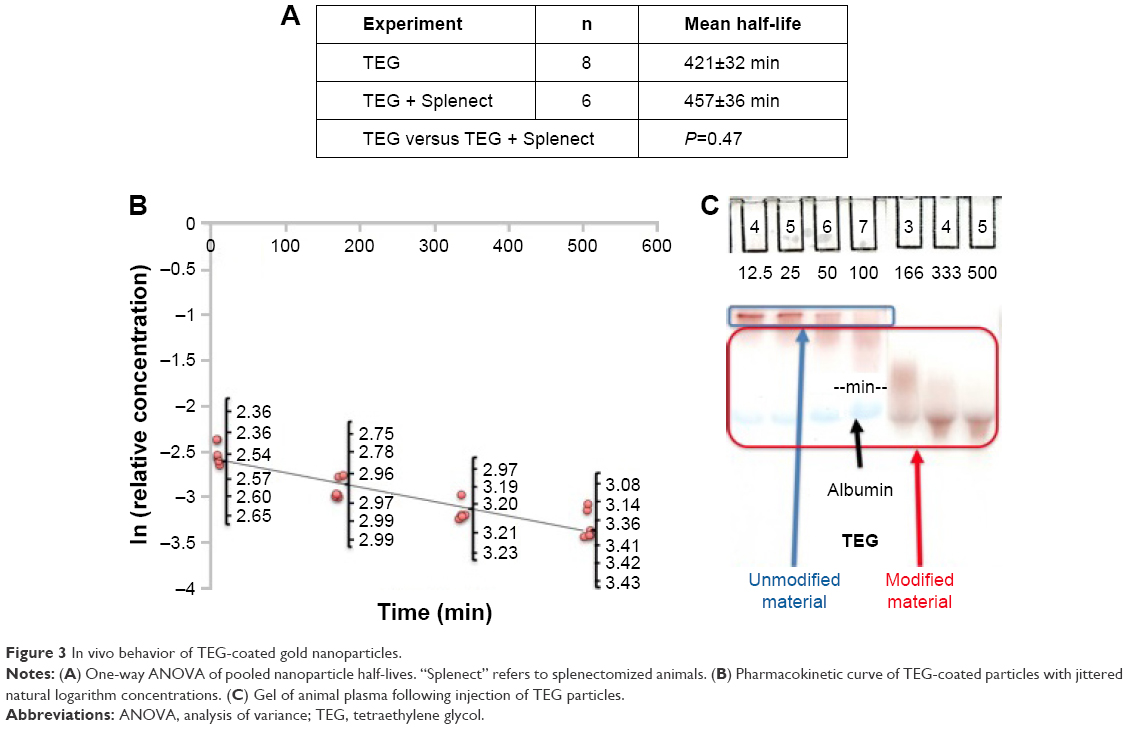 | Figure 3 In vivo behavior of TEG-coated gold nanoparticles. |
Splenectomy does not impact TEG particle half-life
To determine the role of the spleen in TEG particle clearance, animals were splenectomized and injected with particles. The particle half-lives were calculated as described. The pooled half-life for TEG particles in these splenectomized animals was 457±36 min (n=6; P=0.47 for splenectomized versus nonsplenectomized animals) (Figure 3A). The particles were modified during circulation similarly to mice that were not splenectomized (Figure S1). We conclude that the spleen is not the primary organ for clearing TEG nanoparticles from circulation (Figure 4D and E).
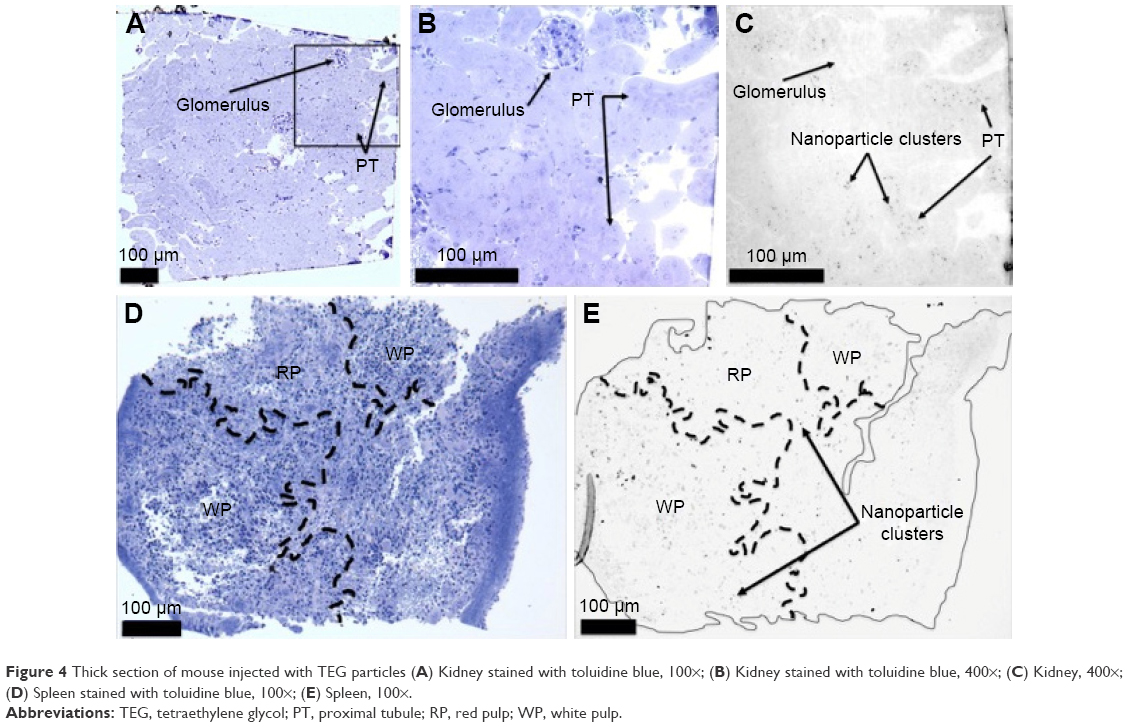 | Figure 4 Thick section of mouse injected with TEG particles (A) Kidney stained with toluidine blue, 100×; (B) Kidney stained with toluidine blue, 400×; (C) Kidney, 400×; (D) Spleen stained with toluidine blue, 100×; (E) Spleen, 100×. |
Tissue analysis
TEG particles are taken up by renal proximal tubule cells
Kidney tissue sections taken from animals 500 minutes after nanoparticle injection showed that the TEG nanoparticles were accumulated in intracellular vesicles of PT cells (Figures 4 and 5). This shows that our TEG particles have passed through the glomerulus and have entered cells, most likely via endocytosis and diffusion.17 Clearance of our TEG particles from the renal ultrafiltrate was complete since the urine was devoid of particles. The particles do not appear to cause harm to renal PT cells as apoptosis studies yielded no significant difference in the number of apoptotic cells in the kidneys of these experimental animals compared to control animals (data not shown); however, it is possible that cellular pathways are altered as the particles proved toxic to cells in the spleen red pulp (Figure 6). These results were not changed when the mice were splenectomized (Figure S2).
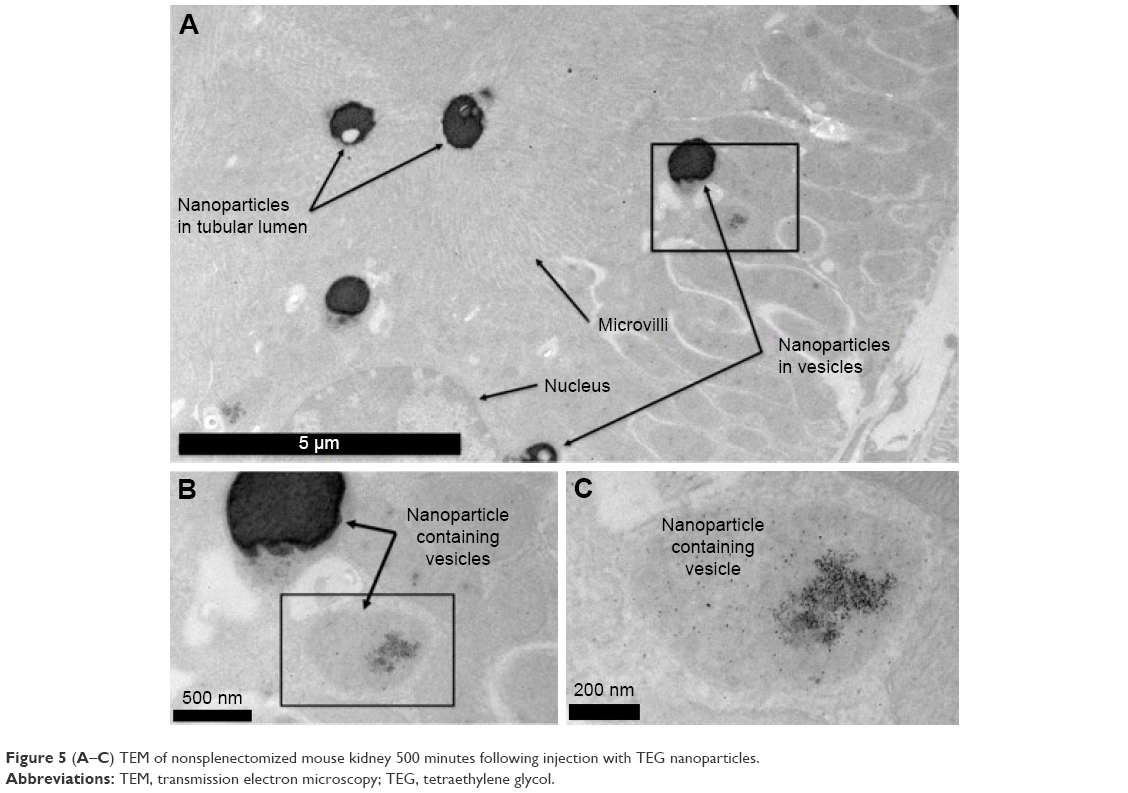 | Figure 5 (A–C) TEM of nonsplenectomized mouse kidney 500 minutes following injection with TEG nanoparticles. |
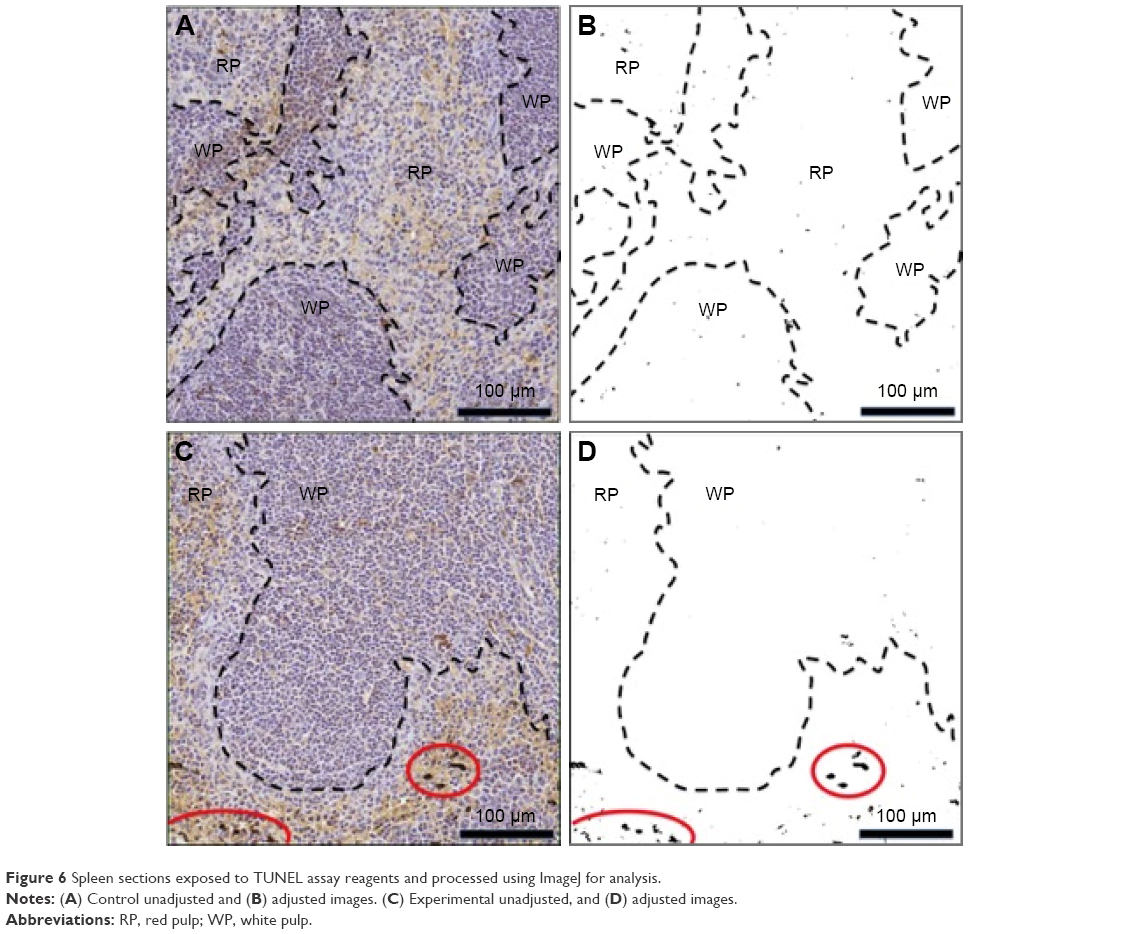 | Figure 6 Spleen sections exposed to TUNEL assay reagents and processed using ImageJ for analysis. |
TEG particles are collected in the spleen
Light microscopic analysis of splenic tissue shows particle accumulation throughout the organ in red and white pulps as visualized by the dark punctate not present on sections taken from mice injected with PBS (Figure 4D and E).19 The extent of observed uptake is similar to the 5 nm PEG-coated nanoparticles described by Zhang et al with a similar extent of uptake in the kidney and spleen.4 The punctuate could not be definitively located on TEM sections as electron dense metals in the spleen, such as iron, looked similar to the particles, preventing effective assessment. The particles observed with LM in red pulp were likely taken up by macrophages in the region’s reticular meshwork (Figure 4D and E);19 previous work has found that injections of thorium dioxide and hemosiderin, an iron storage complex, are taken up by macrophages in this region, suggesting metallophilic characteristics.20 Particles collected in the white pulp were likely taken up by well-described metallophilic macrophages present there (Figure 4D and E).19 The particles were perhaps collected by the spleen due to exposure to serum compounds that could trigger aggregation and phagocytosis following ligand exchange, which is known to preferentially lead to splenic clearance with PEG-coated nanoparticles.3,5,13,21 A minority of particles would aggregate as splenectomized animal half-life results and column work demonstrated an unchanged HDR 12.5 and 166 minutes after injection (Figure 7A).
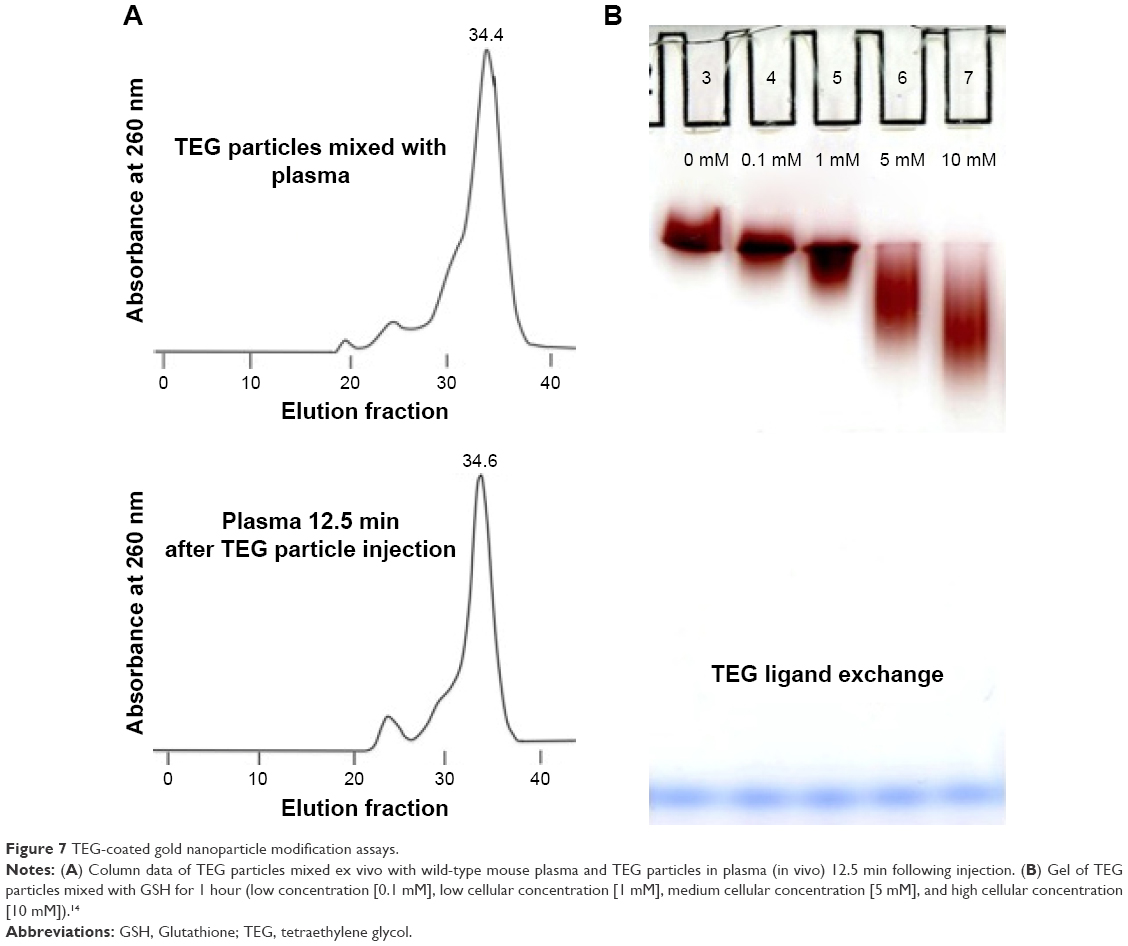 | Figure 7 TEG-coated gold nanoparticle modification assays. |
TEG particles induce apoptosis in the spleen
There was no apparent nanoparticle-induced apoptosis in the kidney regardless of splenectomy status as TUNEL assay results yielded a comparable number of TUNEL positive cells between experimental and control samples (P>0.35). Spleen tissue had significantly increased TUNEL positive cells (predominantly localized to the red pulp) relative to control tissue with an average of 88±15 positive cells for experimental samples versus an average of 19±3 positive cells for control samples (P<0.001) (Figure 6). While TEG gold nanoparticles are collected promiscuously through the spleen, likely by macrophages per Larson et al’s13 work characterizing ligand-exchanged PEG-coated particles (Figure 4D and E), these results suggest that the nanoparticles taken up in the spleen red pulp, by perhaps reticular meshwork macrophages as previously described, are toxic.19 Thus, both TEG- and PEG-coated nanoparticles are toxic, albeit to different organs.3 However, the marginal zone and white pulp showed little apoptotic activity (Figure 6). These results reinforce the necessity to characterize nanoparticle-induced cellular pathways both for toxicology purposes and the use of particles’ apoptotic ability for use in treatment for hyperproliferative conditions.
TEG particles gain charge during circulation
There was a time-based increase in charge for TEG particles suggesting their modification (Figure 3C). The unmodified particle band was readily observed in the 12.5-minute lane but was no longer visible in the 166-minute sample (Figure 3C). Column data indicated no significant interaction of TEG particles with macromolecules based on minimal HDR change 12.5 minutes (Figure 7A) and 166 minutes (data not shown) following injection compared to HDR before injection and upon mixing with plasma. This demonstrates that a majority of the particles are not reacting with other macromolecules and are resistant to protein adsorption, which is in agreement with other investigators’ ex vivo work.7–10 The change in charge is thus likely due to interaction with small molecules, such as glutathione, that more readily penetrate the particles’ TEG shield and trigger ligand exchange reactions.13 PEG-coated particles have been shown to undergo ligand exchange reactions, which also increase protein adsorption and their uptake by macrophages.13 The change is unlikely due to cations as gel electrophoresis illustrated that neither concentrated salts (0.1 M potassium, sodium, and calcium) (data not shown) nor physiological hydrogen or hydroxide ion concentrations elicited the observed change (Figure S3).22 The change is also unlikely to be due to particle degradation as TEM revealed that nanoparticles collected from the plasma 166 minutes after injection had comparable core diameters to TEG batches before injection with a pooled core diameter of 4.71±1.03 nm (n=228) (data not shown) contrasting with newly synthesized particles yielding a pooled core diameter of 4.76±0.74 nm (n=2,093) (Figure 2B and C). The serum concentration of common thiols (GSH at 68.1 μM and cysteine at 79.6 μM) was found to be insufficient to elicit this reaction (Figure 7B).9,13,23 However, intracellular concentrations of GSH (concentrations >1 mM) were found to increase nanoparticle charge similarly to what was observed in plasma samples, suggesting that the reaction may occur within cells (Figures 3C and 7B).14
TEG particles do not change size during circulation
Column chromatographic analysis of TEG particles mixed with wild-type mouse plasma and in plasma 12.5 minutes following nanoparticle injection demonstrated no significant nanoparticle–macromolecule interactions (Figure 7A). While aggregates were observed in the spleen, they likely do not influence the HDR due to a minority of particles aggregating. These results suggest that TEG confers “stealth” and stability to nanoparticles in the bloodstream, similar to PEG.1
Conclusion
Our results show that gold nanoparticles coated with TEG have a long half-life in circulation and are resistant to nonspecific protein adsorption. Thus, they are similar to PEG-coated nanoparticles.3 The protocol used to make these particles is reproducible as judged by consistent electrophoretic mobility and core diameters. The TEG-coated particles, which have a hydrodynamic size slightly less than albumin, traverse the glomerulus and are captured by proximal tubule cells to never reach the urine. The particle half-life was not altered by splenectomy indicating that the spleen is not the primary clearing organ. The liver did not capture significant amounts of nanoparticles. TEG particles in the circulation gained charge over time, suggesting that they undergo ligand exchange with intracellular thiols, such as glutathione. We conclude that TEG is a useful coating agent for gold nanoparticles since their synthesis yields monodisperse particles with a long half-life and resistance to protein adsorption. However, the toxicity of their gold cores must be further investigated because they remain in the kidney and induce apoptosis in spleen red pulp. As they can trigger apoptosis, it is possible that the particles interfere with other cell pathways, such as reuptake of glucose, even though they do not induce apoptosis in other tissue or cause the injected animals to show signs of distress. Such work could enable production of a safer nanoparticle and a novel chemotherapeutic if the particles’ toxicology was used against tumors.
Acknowledgments
This work was made possible by the University of North Carolina at Chapel Hill Summer Undergraduate Research Fellowship, Honors Carolina of the University of North Carolina at Chapel Hill, grants from the National Institutes of Health (HL49277 and DK080302), Robert Bagnell, Vicky Madden, and Kristen White for their assistance with electron and light microscopy, Dr Nobuyo Maeda for access to mice, J Ashley Ezzell and Kara Clissold for their assistance with TUNEL assays, and Dr Daniel Kenan for his assistance in histological section cellular identification and the late Dr Oliver Smithies for his invaluable guidance over the years.
Disclosure
The authors report no conflicts of interest in this work.
References
Gref R, Domp A, Quellec P, et al. The controlled intravenous delivery of drugs using PEG coated sterically stabilized nanospheres. Adv Drug Del Rev. 1995;16(95):215. | ||
Dreaden EC, Austin L, Mackey M, El-Sayed M. Size matters: gold nanoparticles in targeted cancer drug delivery. Ther Deliv. 2012;3(4):457–478. | ||
Cho WS, Cho M, Jeong J, et al. Acute toxicity and pharmacokinetics of 13 nm-sized PEG-coated gold nanoparticles. Toxicol Appl Pharmacol. 2009;236(1):16–24. | ||
Zhang XD, Wu D, Shen X, et al. Size-dependent in vivo toxicity of PEG-coated gold nanoparticles. Int J Nanomedicine. 2011;6:2071–2081. | ||
Jong WHD, Borm PJ. Drug delivery and nanoparticles: applications and hazards. Int J Nanomedicine. 2008;3(2):133–149. | ||
Foos EE, Snow AW, Twigg ME, Ancona MG. Thiol-terminated Di-, Tri-, and tetraethylene oxide functionalized gold nanoparticles: a water-soluble, charge-neutral cluster. Chem Mater. 2002;14(5):2401–2408. | ||
Kanaras AG, Kamounah FS, Schaumburg K, Kiely CJ, Brust M. Thioalkylated tetraethylene glycol: a new ligand for water soluble monolayer protected gold clusters. Chem Commun (Camb). 2002;20(26):2294–2295. | ||
Zheng M, Davidson F, Huang X. Ethylene glycol monolayer protected nanoparticles for eliminating nonspecific binding with biological molecules. J Am Chem Soc. 2003;125(26):7790–7791. | ||
Zheng M, Li Z, Huang X. Ethylene glycol monolayer protected nanoparticles: synthesis, characterization, and interactions with biological molecules. Langmuir. 2004;20(10):4226–4235. | ||
Smithies O, Lawrence M, Testen A, et al. Stable oligomeric clusters of gold nanoparticles: preparation, size distribution, derivatization, physical and biological properties. Langmuir. 2014;30:13394–13404. | ||
Yardeni T, Eckhaus M, Morris HD, Huizing M, Hoogstraten-Miller S. Retro-orbital injections in mice. Lab Anim (NY). 2011;40(5):155–160. | ||
Tomlin M. Pharmacology & Pharmacokinetics: A Basic Reader. London: Springer-Verlag London; 2010. | ||
Larson TA, Joshi PP, Sokolov K. Preventing protein adsorption and macrophage uptake of gold nanoparticles via a hydrophobic shield. ACS Nano. 2012;6(10):9182–9190. | ||
Hwang C, Sinskey AJ, Lodish HF. Oxidized redox state of glutathione in the endoplasmic reticulum. Science. 1992;257(5076):1496–1502. | ||
Schollbach M, Zhang F, Roosen-runge F, Skoda MWA, Jacobs RMJ, Schreiber F. Gold nanoparticles decorated with oligo (ethylene glycol) thiols: surface charges and interactions with proteins in solution. J Colloid Interface Sci. 2014;426:31–38. | ||
Masuelli MA. Study of bovine serum albumin solubility in aqueous solutions by intrinsic viscosity measurements. Adv Phys Chem. 2013;2013:8. | ||
Smithies O. Why the kidney glomerulus does not clog: a gel permeation/diffusion hypothesis of renal function. Proc Natl Acad Sci U S A. 2003;100(7):4108–4113. | ||
Lawrence MG, Altenburg MK, Sanford R, et al. Permeation of macromolecules into the renal glomerular basement membrane and capture by the tubules. PNAS. 2017;114(11):2958–2963. | ||
Cesta MF. Normal structure, function, and histology of the spleen. Toxicol Pathol. 2006;34(5):455–465. | ||
Blue J, Weiss L. Electron microscopy of the red pulp of the dog spleen including vascular arrangements, peri-arterial macrophage sheaths, ellipsoids, and the contractive reticular meshwork. Am J Anat. 1981;161(2):189–218. | ||
Aggarwal P, Hall JB, Mcleland CB, Dobrovolskaia MA, Mcneil SE. Nanoparticle interaction with plasma proteins as it relates to particle biodistribution, biocompatibility and therapeutic efficacy. Adv Drug Deliv Rev. 2009;61(6):428–437. | ||
Pfeiffer C, Rehbock C, Hühn D, et al. Interaction of colloidal nanoparticles with their local environment: the (ionic) nanoenvironment around nanoparticles is different from bulk and determines the physico-chemical properties of the nanoparticles. J R Soc Interface. 2014;11(96):20130931. | ||
Granholm DE, Neil Reese R, Granholm NH. Agouti alleles alter cysteine and glutathione concentrations in hair follicles and serum of mice (Ay/a, AwJ/AwJ, and a/a). J Invest Dermatol. 1996;106(3):559–563. |
Supplementary materials
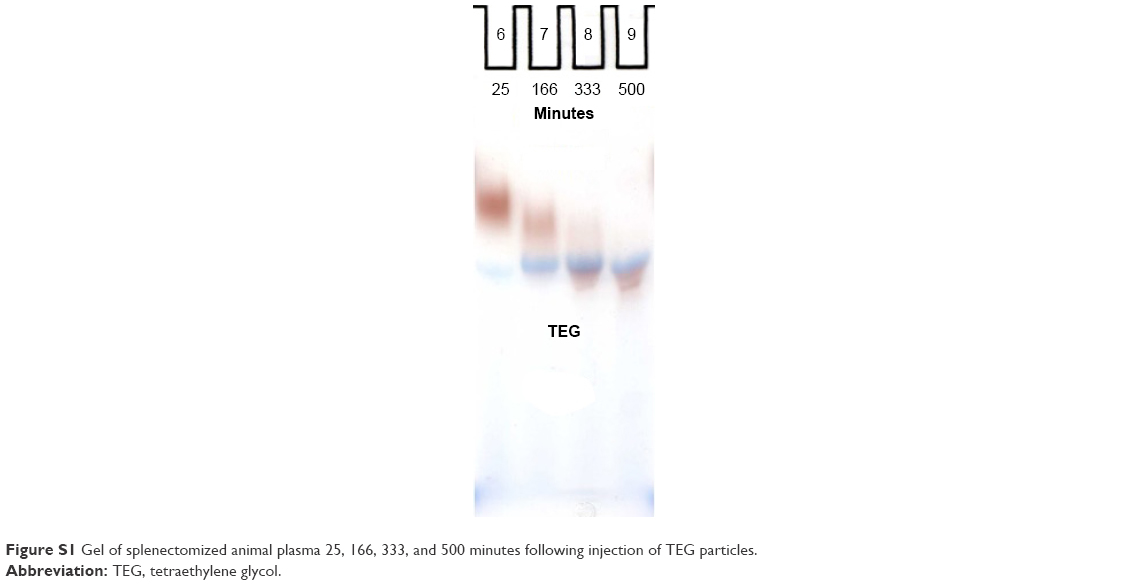 | Figure S1 Gel of splenectomized animal plasma 25, 166, 333, and 500 minutes following injection of TEG particles. |
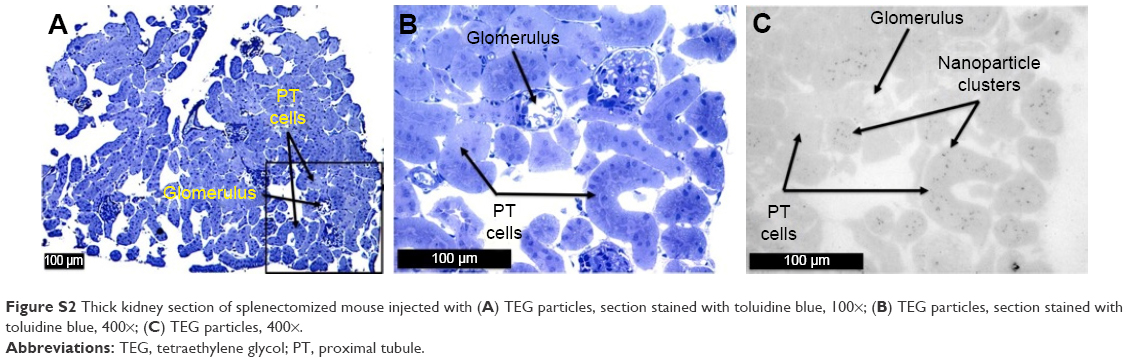 | Figure S2 Thick kidney section of splenectomized mouse injected with (A) TEG particles, section stained with toluidine blue, 100×; (B) TEG particles, section stained with toluidine blue, 400×; (C) TEG particles, 400×. |
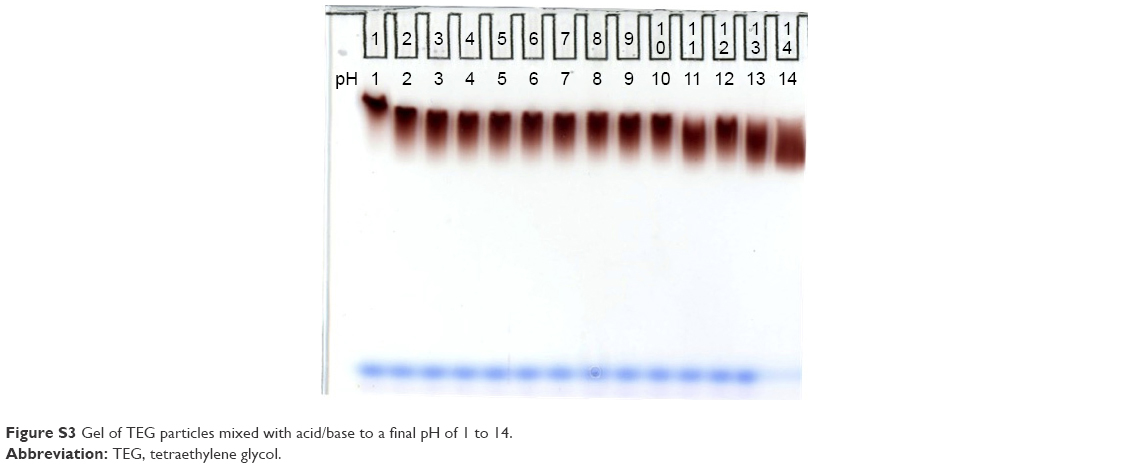 | Figure S3 Gel of TEG particles mixed with acid/base to a final pH of 1 to 14. |
 © 2017 The Author(s). This work is published and licensed by Dove Medical Press Limited. The full terms of this license are available at https://www.dovepress.com/terms.php and incorporate the Creative Commons Attribution - Non Commercial (unported, v3.0) License.
By accessing the work you hereby accept the Terms. Non-commercial uses of the work are permitted without any further permission from Dove Medical Press Limited, provided the work is properly attributed. For permission for commercial use of this work, please see paragraphs 4.2 and 5 of our Terms.
© 2017 The Author(s). This work is published and licensed by Dove Medical Press Limited. The full terms of this license are available at https://www.dovepress.com/terms.php and incorporate the Creative Commons Attribution - Non Commercial (unported, v3.0) License.
By accessing the work you hereby accept the Terms. Non-commercial uses of the work are permitted without any further permission from Dove Medical Press Limited, provided the work is properly attributed. For permission for commercial use of this work, please see paragraphs 4.2 and 5 of our Terms.