")
Back to Journals » Psychology Research and Behavior Management » Volume 15
A Telecommuting Experience Service Design Decision Model Based on BP Neural Network
Authors Wang W, Wei T , Yu S, Chen J, Yang X
Received 20 August 2022
Accepted for publication 6 October 2022
Published 25 October 2022 Volume 2022:15 Pages 3147—3166
DOI https://doi.org/10.2147/PRBM.S386089
Checked for plagiarism Yes
Review by Single anonymous peer review
Peer reviewer comments 2
Editor who approved publication: Dr Igor Elman
Weiwei Wang, Ting Wei, Suihuai Yu, Jian Chen, Xiaoyan Yang
College of Art and Design, Shaanxi University of Science and Technology, Xi’an City, People’s Republic of China
Correspondence: Ting Wei, College of Art and Design, Shaanxi University of Science and Technology, Xi’an City, People’s Republic of China, Email [email protected]
Introduction: The telecommuting experience and job performance have been significantly impacted by the COVID-19 pandemic, and job performance stability of telecommuting employees has become a critical concern.
Objective: A decision model for telecommuting experience service design was constructed based on a backpropagation (BP) neural network to provide a theoretical basis for enterprises to evaluate telework performance and the psychological health of employees.
Methods: The analytic hierarchy process (AHP) was used to determine the core stakeholders. The grey relational analysis (GRA) method and the NASA Task Load Index (NASA-TLX) scale were used to measure the factors affecting employees’ telecommuting experience and job performance. A BP neural network relationship model of employees’ telecommuting experience was established to predict its impact on employees’ job performance.
Results: Based on the model prediction results, a service system map was created, and the potential to enhance the telework performance of employees was evaluated.
Discussion: It was concluded that the factors affecting the telecommuting experience were diverse, but emotions had the dominant influence. Significant positive correlations were found between emotional impact and temporal perception, execution difficulty, and communication barriers.
Conclusion: The proposed decision model for telecommuting experience service design accurately predicted the impact of telecommuting efficiency, providing an effective approach for innovative remote management.
Keywords: design decision, job performance, telecommuting experience, BP neural networks, NASA-TLX scale
Introduction
The popularity of remote employment or working from home has increased as a result of the COVID-19 pandemic. This situation poses a serious challenge for companies facing many unknown factors related to telework performance management of employees. This change in the work pattern has led to significant changes in workflows and user experiences. It has been demonstrated that the job satisfaction and performance of employees who feel that their contribution and well-being are not considered sufficiently by the organization decreases.1–3 Researchers have found that telecommuting has various effects on job performance.4,5 Therefore, it is necessary to ensure the stability and efficiency of telework and construct a standard scientific efficiency management method. Two problems affect the performance management of telework. First, the COVID-19 pandemic adversely impacted the physiological and psychological aspects of employees and their job performance. Emotional swings can be exhausting, so emotions may have an impact on job satisfaction and job performance.6,7 Second, the performance of telecommuting employees was highly variable in the post-epidemic era. Several variables influence the job performance stability of telecommuting employees, such as work-family conflicts, virtual relationships and communication among colleagues.8–10
Employee performance was influenced by emotional experiences that directly determine the continuity of business operations during a COVID-19 pandemic. Therefore, companies need to understand the impact of a pandemic on remote work performance in order to effectively establish remote performance management methods to reduce the impact of negative emotional experiences. The key to analyzing the impact of the pandemic on teleworking performance was the analysis of the employees’ telecommuting experience and the core stakeholders.
On the one hand, changes in the work environment have forced changes in employees’ workflow. The loss of a physical work space and the inability to communicate with colleagues in a timely manner affect telecommuting performance. It has been proven that work is an emotional experience and that information overload has a significant impact on both employee emotional exhaustion and job performance.11 For example, teleworking requires increased use of digital tools, but this tends to create a cognitive overload, which may have a negative impact on the employees’ job performance.12 Meanwhile, research on the relationship between emotions and job performance has demonstrated that employee emotions exert a powerful influence on job performance, especially in the service sector.13–15 Liu found that job crafting enabled employees to better adapt to changes in work patterns during the COVID-19 period, positively impacting telecommuting performance.16 Self-control refers to adjusting one’s motivations and actions to achieve the predetermined pattern or goal by understanding one’s psychology and behavior. Troll et al conducted a quantitative analysis of 106 remote workers and confirmed that changing the physical status and autonomous motivation were significantly associated with job performance. This study provides new insights for employees to work efficiently from home.17 Tariq et al found that autonomy and scheduling flexibility during COVID-19 can further improve job performance. Meanwhile, their study found that perceived trust and support from superiors increased job performance.18,19 Regulatory Emotional Self-Efficacy (RESE) theory demonstrated that individuals’ inability to adequately and effectively regulate their negative emotions in the face of stress could negatively affect their job performance. In contrast, experiencing positive emotions enhanced people’s cognitive functioning. Therefore, the relationship between emotions and service performance can be moderated through RESE.20 Nonetheless, there was still ambiguity regarding the impact of remote emotional experiences on performance and a lack of attention regarding the importance of core stakeholders to remote performance management.
On the other hand, job performance management is a dynamic process. Only by managing people and their behaviors can we ensure job performance stability. Previous studies have suggested the use of stakeholder analysis as a more appropriate method to measure the importance of people in the organization who have different relevance to the benefits.21 Stakeholders are individuals and groups who influence the organizational behavior and goal achievements or are affected by the achievement of organizational goals and processes. Clarifying the influence relationships between all stakeholders in an organization and the user experience of the core stakeholders is crucial to improving the telework performance of employees.22 Cheng and He utilized operations research and service design tools to distinguish the primary and secondary status of stakeholders to reduce the complexity and uncertainty of the cocreation link and focus on major stakeholders.23 Liu et al proposed a cluster intelligence service design model based on value co-creation.24 Multiple stakeholders were deconstructed and reorganized to improve the collaborative co-creation of solutions. Xu et al conducted a ranking analysis of the stakeholders of state-owned enterprises (SOE) using a data model to assist enterprises in decision making.25 Stakeholder analysis can reduce the complexity of a problem; thus, the core stakeholders should be identified.
It is necessary to analyze the influencing factors affecting the telecommuting experience of employees to predict the relationship between the key variables and job performance and ensure the stability of telecommuting performance. The factors that affect the employee experience during a pandemic are diverse, and the cognitive load, affective responses, and job performance influence each other. Van der Lippe et al found that working from home had a negative impact on employee performance, and the team performance was worse when more colleagues worked from home.26 Working from home has provided advantages and disadvantages for the employees and the organization and has been responsible for a decrease in employee productivity.27 Chang et al examined the results of high-performance work systems (HPWS) for different workplace events using the affective event theory (AET).28 The results showed that different work environments affected the employees’ feelings and job satisfaction. Job arbitrariness resulted in positive feelings and increased job satisfaction, which is consistent with the findings of Tariq et al. Hashim et al studied the relationship between satisfaction and performance of university administrators working from home in Malaysia. The results showed that the availability of information and computer technologies (ICT) directly influenced the employees’ job performance.29 Numerous scholars have investigated the effectiveness of job performance management. Xu et al proposed three cross-functional synergy efficiency evaluation schemes to evaluate the synergy efficiency of team clusters in transforming companies, providing a valid reference for cross-organizational collaboration efficiency.30 Hussain used the analytic hierarchy process (AHP) to evaluate energy professionals and experts. The results showed that the most influential factors affecting project performance during the COVID-19 pandemic were government measures and individual factors. These findings provide insights into project management during and after a pandemic.31 Zhang et al analyzed the positive relationship of intra-firm factor synergy on innovation performance and proposed countermeasures to promote internal factor synergy.32 Multiple regression analysis was used by Xie et al to verify the effect of a synergistic network on the innovation performance of enterprises.33
The aforementioned studies have shown that evaluating the factors affecting the performance of remote employees is critical for companies to manage job performance during a pandemic. Although these scholars have provided various methods for analyzing performance management, there are some shortcomings in these studies. Existing studies have focused on the evaluation of job performance but did not research in-depth the variables affecting job performance. In particular, relatively few studies investigated the effect of the pandemic on people’s job performance. The literature review indicated that visualization of the service design and system process optimization were critical for efficient management.34 However, the relationship between telecommuting experience and employee performance had not been investigated sufficiently. In particular, research on the stability of job performance lacked a theoretical basis because the impact of the pandemic on people is dynamic. It was critical for job performance management of telecommuting employees to predict the telecommuting experience accurately. Therefore, this paper proposed an innovative human-centered decision-making approach that integrates the AHP, GRA, NASA-TLX, and a backpropagation (BP) neural network to evaluate and predict the telecommuting employees’ performance. The results provide a strategy for improving the telecommuting experience and a powerful reference for remote collaboration organizations during the pandemic. Grey relational analysis (GRA) quantified the relationships between the system’s elements by evaluating the similarity or heterogeneity of trends. It was suitable for the study of dynamic processes and enables companies to analyze the dynamics of changing relationships of core stakeholders in a remote synergy model. Kuo et al used GRA to solve multi-attribute decision-making (MADM) problems.35 Liu et al demonstrated that GRA and sensitivity analysis could overcome the uncertainty of a design scheme.36 Li developed a hesitant fuzzy multi-attribute decision model based on GRA to analyze the influencing factors of the culture score index.37 These studies indicated that GRA was well suited for the quantitative analysis of system dynamics due to its straightforward approach. Therefore, GRA was used in this study to measure the variables that affect job performance.
Our current research contributed to the existing literature on telework performance and affective experiences in three meaningful ways. First, we proposed to think about stakeholder relationships through human-centered service design thinking. Service design analyzed the relationship between the user experience and all stakeholders using a visual approach.38,39 It provided a global, systematic way of thinking and efficient service processes for companies.40–42 From the perspective of job performance management, an adequate service level could improve the team members’ mobility, maximize value creation, and enhance the ability of remote collaboration. Unlike traditional job performance management, which categorized people based on the system or rewards performance, service design was human-centered. The service can be optimized, and key aspects of employee performance management can be determined by studying the service and service experience of stakeholders. The service quality influenced the employee’s subjective initiative and cooperation efficiency, especially in teleworking, where performance management is crucial.43
Secondly, we have chosen the appropriate design decision method for innovation integration. The advantages of combining the AHP, GRA, NASA-TLX, and a BP neural network for employee performance evaluation and prediction are as follows. AHP is a systematic and hierarchical analysis method. It can provide an easy decision-making method for complex problems with multiple objectives and criteria using less quantitative information.44 In this study, AHP is used for core stakeholder screening and decision-making to improve the accuracy of the results. It can determine the core employees who influence the job performance to improve remote job performance management.45 GRA and NASA-TLX are used to analyze the factors affecting the performance of core stakeholders in telecommuting, ie, the factors influencing user experience. NASA-TLX is a widely used tool for measuring subjective workload and performs better than other subjective assessment tools.46 This method enables us to evaluate the impact of the dynamic factors on the employees’ performance during the pandemic. These factors are used as the input layer of the BP neural network, and the job performance is the output layer for telework performance prediction. Just like data mining,47,48 BP neural network algorithm is a quantitative approach that can be used to analyze subjective information. BP neural network algorithm has strong nonlinear mapping capabilities. The BP neural network is an artificial neural network (ANN). Existing data are used to determine the weight relationship between the input and output and predict the outcome.49 Combining the four methods provides an accurate evaluation of the relationships between elements affecting the employees’ job performance and telecommuting experience.
Finally, previous research has focused on the relationships or moderating effects among factors that influence remote performance50 and less on service systems that improve the remote employee office experience. Our work visualized the relationship between remote performance management and various stakeholders by constructing a telework service system map. Corresponding improvement strategies to the location of the system map allowed visual and effective visibility of solutions to improve or stabilize remote work performance.
Given these advantages, we developed an innovation decision model to bridge the research gap and contribute to the relevant literature. First, this study visualizes the telecommuting workflow by analyzing the interactions between stakeholders. GRA and the NASA-TLX are used to rank the relevance of the user experience elements of core stakeholders and screen the variables. The BP neural network is used to construct a relationship model between employee telecommuting experience and job performance. The experience pain points are transformed into opportunities using system maps to provide new insights into efficiency management and references for enterprises to conduct telework performance management. The map illustrated the relationships between the various stakeholders in the organization. It took different moderating measures on key work processes to stabilize remote job performance by improving the emotional experience.
Introduction of BP Neural Network Model
Principle of BP Neural Network
The basic unit of the BP neural network is the neuron, which simulates the structure and working mechanism of the brain. Neurons and synapses perform information transmission. When the human sensory system obtains information, it is transformed into signals that are received and processed by neurons. The information is transmitted from the synapses to the connected neurons, which process and transmit it. The brain produces signals and guides the person to perform appropriate actions and responses. Wang et al analyzed the significance and feasibility of BP neural networks for evaluating business management performance. The results showed that BP neural networks have high accuracy for predicting corporate performance.51 An improved AHP-BP neural network algorithm was proposed for corporate social responsibility (CSR) performance evaluation. The results showed that the model could be used as a good predictive tool for CSR performance evaluation.52 Yang proposed a BP neural network algorithm to predict athletes’ performance. The results showed that the algorithm had high prediction accuracy and general applicability.53 A BP neural network is a multilayer feedforward network trained by error BP using a gradient descent method. A gradient search is used to minimize the mean square error between the actual and desired output values of the network.54 The neuron model is shown in Figure 1.
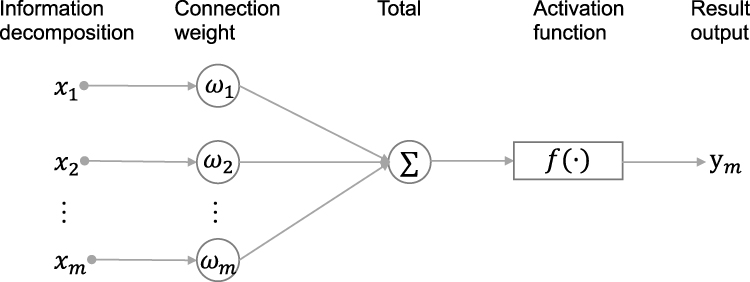 |
Figure 1 Diagram of a neuron model. Notes: Figure 1 is mainly a schematic representation of the neuronal model. |
The neuron output is calculated as follows:

where  denotes the processed output value,
  denotes the weight of each transmitted signal,
  denotes the input signal, and
  denotes the activation function of the neural network.
Topology of BP Neural Network
A BP neural network consists of an input layer, a hidden layer, and an output layer. The input layer passes information to the hidden layer, which passes information to the output layer through the weights and activation functions between the neurons. The output layer collates the information processed by the hidden layer to produce the final result. If the correct result is known, it is compared with the output to obtain the error. The weights in the neural network are corrected by BP to complete the learning process. In Figure 2,  is the input of the mth node of the input layer, m=1, 2,., P;
  is the output of the mth node of the output layer, m=1, 2,., Q;
  is the excitation function of the hidden layer; ψ denotes the excitation function of the output layer.
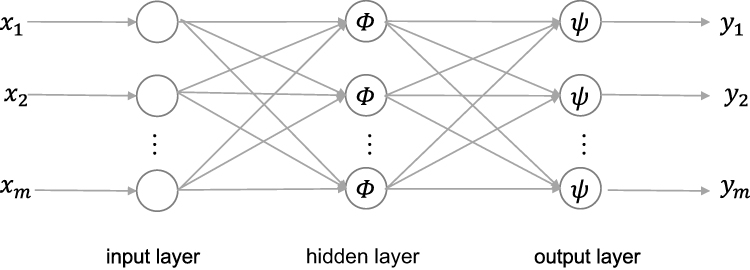 |
Figure 2 Topology of BP neural network. Notes: Figure 2 presents the structure of the BP neural network, containing the topology of the input layer, the hidden layer and the output layer. |
The number of neurons in the hidden layer is calculated by formula (2):

where G is the hidden layer’s neuron, P is the input layer neuron, Q is the output layer neuron, and α is a constant. In this study, the variables affecting the employee workload and telecommuting performance are used as the input layer information, and the job performance is the output layer information. Analysis of the data using SPSS 26.0 showed that the number of nodes in the hidden layer was 1.
BP Neural Network-Based Decision Model for Telecommuting Experience Service Design
Variables of BP Neural Network Decision Model
The model was trained using the results of existing studies to reveal the hierarchical and causal relationships between the factors. The core stakeholders and workflow were screened using stakeholder analysis. We used GRA to rank the influencing factors affecting telework performance and derive the key influencing factors as experimental variables. We designed a questionnaire survey to obtain accurate experimental data.
Simple mathematical questions were used in the questionnaire to screen invalid questionnaires and reduce bias. A total of 142 valid questionnaires were obtained. We selected screening questions to evaluate qualified users. For example, we used simple math questions and reciprocal questions in the questionnaire. Two principles were used to screen eligible subjects. If the participants answered the math questions incorrectly, they were eliminated.
We used the NASA-TLX scale, which is a widely used instrument for measuring subjective workload with a high level of user acceptance and reliability. The NASA-TLX scale assesses the cognitive load in six dimensions: mental demand, physical demand, temporal demand, performance, effort, and frustration. The NASA-TLX scale was used to obtain the workload of employees working from home. It is shown in Figure 3.
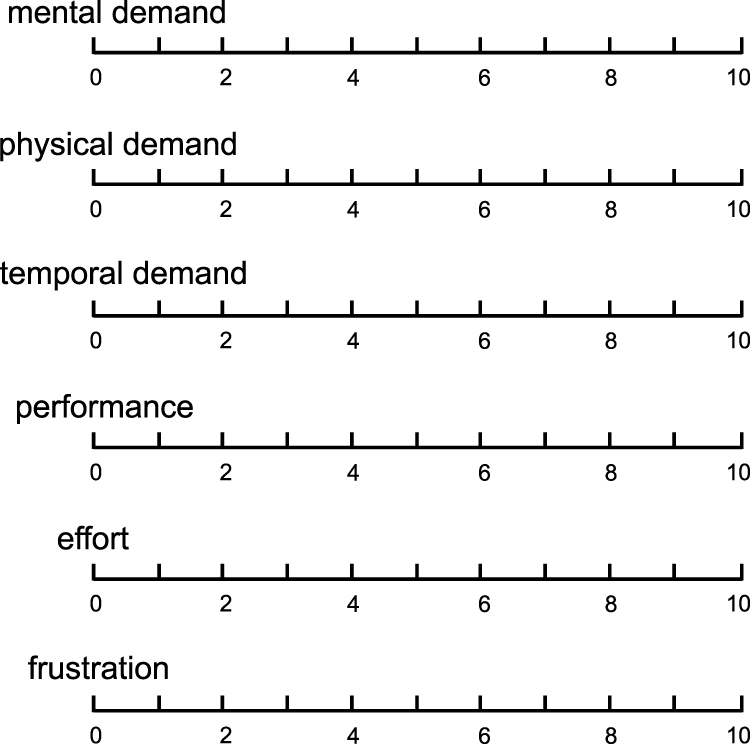 |
Figure 3 Example questionnaire design using the NASA-TLX scale. Notes: Figure 3 presents the NASA-TLX scale, which contains 6 dimensions, each with a score of 0–10. |
Establishment of BP Neural Network Model
The decision model of the employees’ teleworking experience service design based on the BP neural network consists of a stakeholder evaluation model, user experience evaluation model, and BP neural network model. In the first step, the quantitative stakeholder model is constructed. The telecommuting stakeholders are divided into the decision-making level, management level, and executive level according to the internal organizational structure. Each level contains decision-makers, managers, and executors of different functional departments. The management elements of the stakeholders at each level are analyzed and summarized. The stakeholder layer with the highest weight is classified as the core stakeholder layer (CS) and is represented by set A, where A1, A2,……, Am represent the sub-stakeholders of the core stakeholder layer. Ja12 denotes the interaction feedback from A1 to A2, and Ja21 denotes the interaction feedback from A2 to A1. Jab denotes the interaction feedback from A-level stakeholders to B-level stakeholders, and so on. This approach is used to obtain the stakeholders and interaction relationships of the direct stakeholder layer (DS) and indirect stakeholder layer (IS), providing the basis for determining the remote collaborative workflow.
The second step is to construct a user experience evaluation model and use GRA to analyze the experience factors that affect the telework performance of core stakeholders. Influencing factors were constructed from the entire telework system of people, devices, and environment, including objective and subjective factors. A 7-point scale was established to evaluate the influencing factors. The higher the score, the greater the impact on job performance. Correlations between the factors were calculated to obtain rankings. The core stakeholder workloads were obtained from the NASA-TLX questionnaire.
Finally, the user experience and workload are used as the input layer of the BP neural network, and the job performance is used as the output layer to train the model and make predictions to derive improvement opportunities for telework efficiency management. The BP neural network-based decision model for the employees’ telecommuting experience service design is shown in Figure 4.
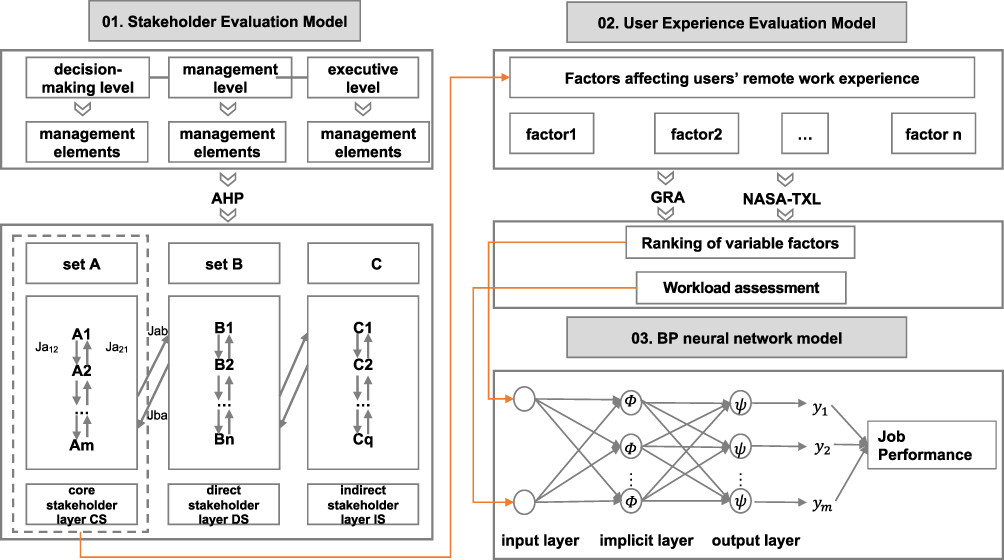 |
Figure 4 Technical route for establishing a decision model for telecommuting experience service design based on a BP neural network. Notes: Figure 4 presents the general framework of our proposed method. The integration of the three modules leads to the final construction of a BP neural network-based remote performance prediction model. |
Ethical Approval
This study received approval from the ethical research committee, College of Art and Design, Shaanxi University of Science and Technology. The study complies with the Declaration of Helsinki. The participants provided their written informed consent to participate in this study.
Experiment and Results
In the first stage, four senior managers were invited as experts to score the importance of stakeholders and each management index element. Opinions were collected sequentially using the Delphi method until the experts no longer changed their opinions. The results of the hierarchical analysis method were combined to obtain the core stakeholders.
In the second stage, user interviews were conducted with 20 employees of Company X. A 7-level scale was established to evaluate the influencing factors. The higher the score, the greater the influence on the office experience was. The evaluation data were collected. GRA was used to obtain the final correlation value to rank the key variables.
In the third stage, a questionnaire survey of 142 telecommuting employees was conducted. The participants completed the survey on workload using an online questionnaire. The survey results were entered into SPSS 26.0 software for data analysis and processing. The reliability and validity of the data were analyzed, and the relationship between the variables was analyzed using correlation analysis, principal component analysis, and BP neural network analysis.
Analysis of Telecommuting Stakeholder Assessment
Establish the Evaluation Index Hierarchy Framework
We established the hierarchy analysis index framework for telecommuting efficiency management as follows.
Objective layer: The stakeholders of telecommuting efficiency management and the importance of each management indicator A.
Criterion layer: According to the company’s management organization, four categories are used as the evaluation elements of the guideline level: decision-maker B1, project manager B2, design supervisor B3, and employee B4. The decision-maker appoints the managers in the company. This person makes decisions on projects or management staff and defines the project goals. The project manager controls the project’s progress. After evaluating the project goals, they check whether they have been achieved and report the results to the decision maker. The design manager manages the project’s execution. They decompose the tasks according to the goals and assign the tasks to employees. They also evaluate the completion and overall performance of the employees. The employees perform the tasks and collaborate as a team according to the design director’s requirements.
Sub-criteria layer: 12 evaluation indicators are used according to the project operation management, and a hierarchy analysis index framework for the teleworking efficiency management is constructed, as shown in Table 1.
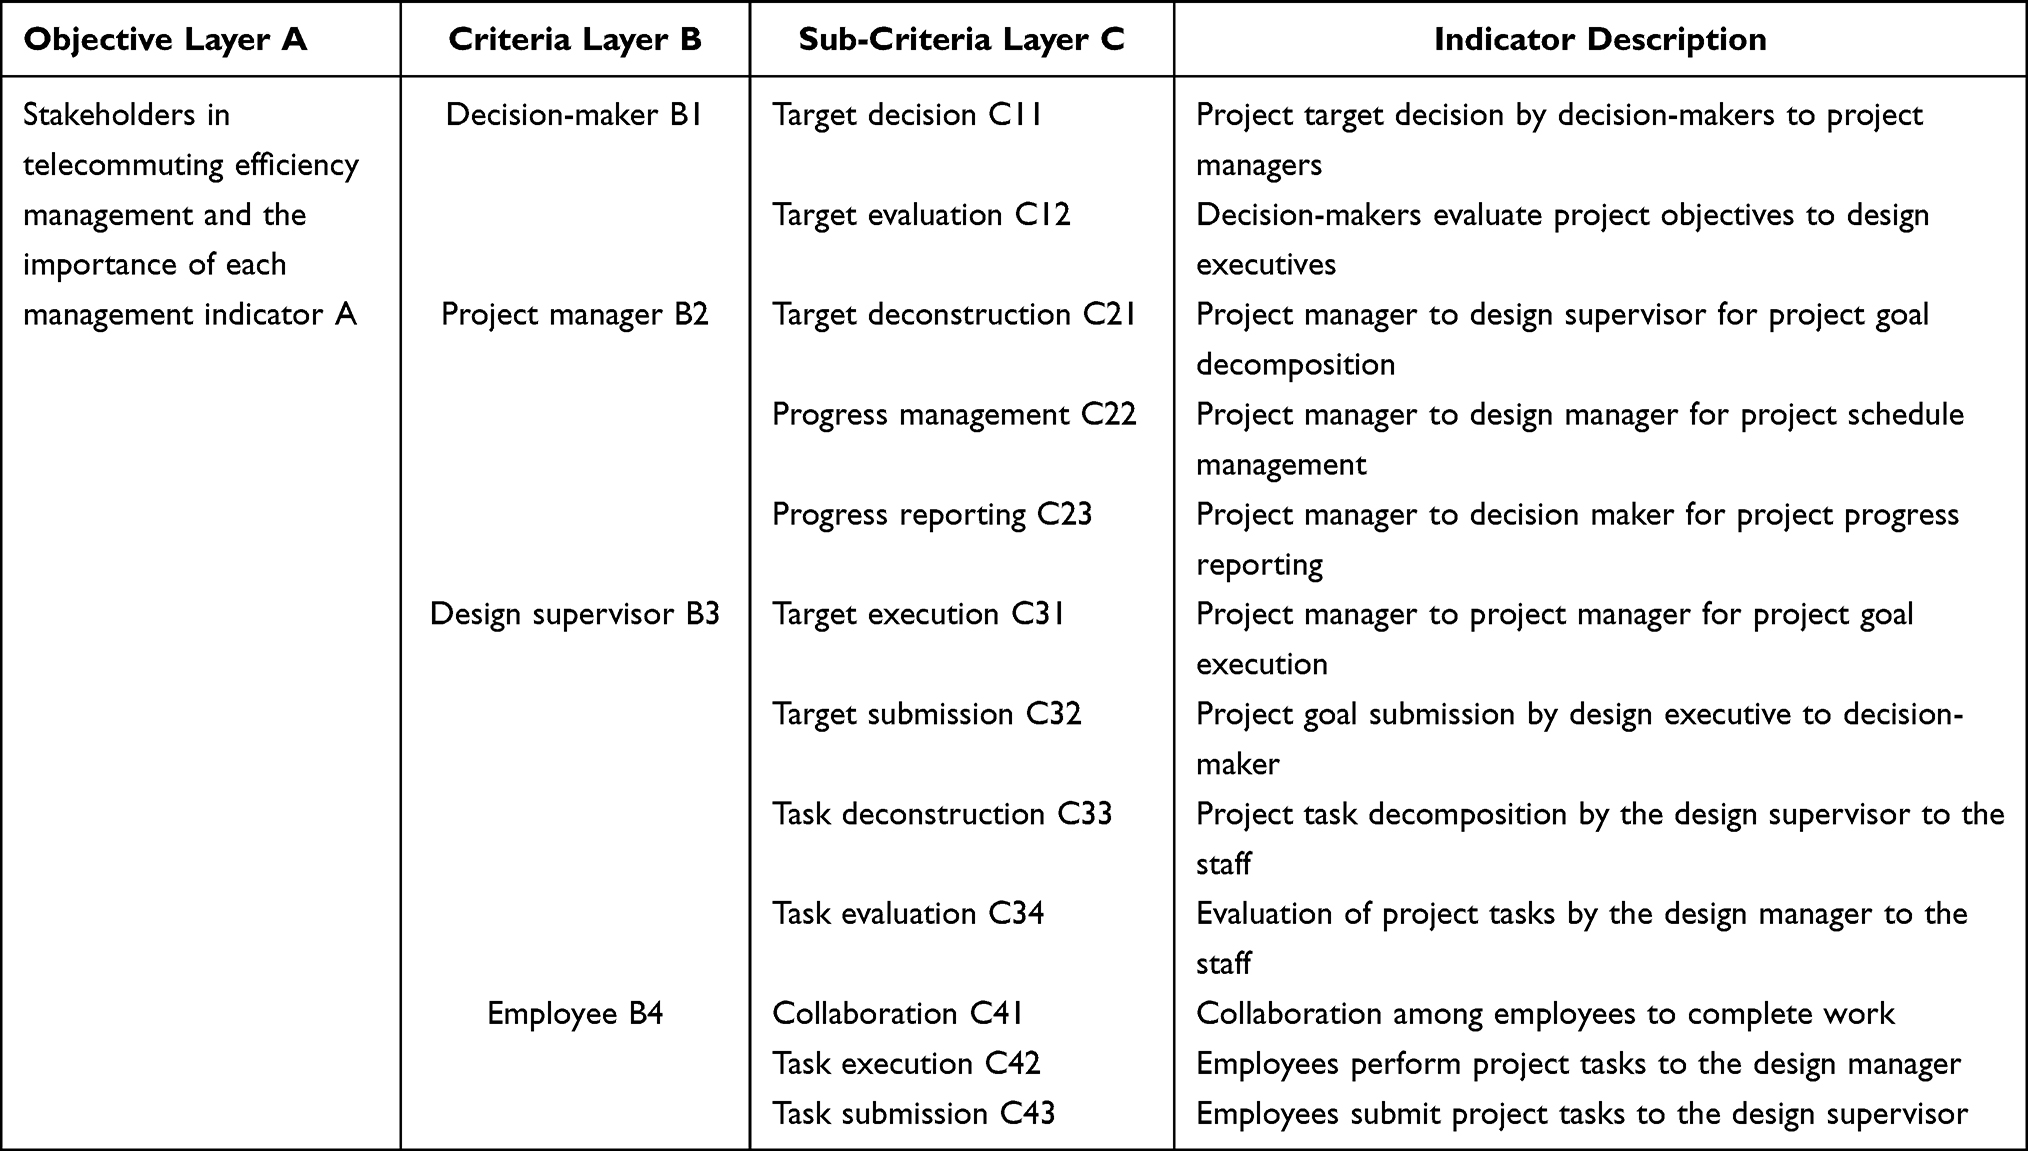 |
Table 1 Hierarchical Analysis Index Framework |
Establish the Judgment Matrix of Evaluation Indicators
The judgment matrix was constructed according to the seven-level scaling method, and the elements of each evaluation index in each layer were compared in pairs. For target layer A, the importance is compared to the criterion layers B1, B2, B3, and B4, and the values are assigned to 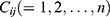 , where
  indicates the importance values of factors
  and
and  relative to the target, and n is the number of indicators. The evaluation matrix is defined in Eq. (3):
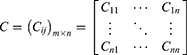
Four senior managers were invited as experts to score the importance of the indices. The evaluation matrices are listed in Tables 2–6.
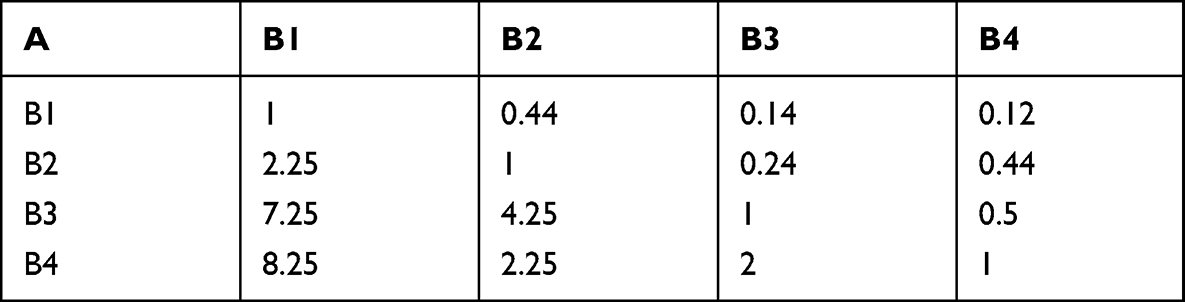 |
Table 2 Evaluation Matrix for the Indicators at the Target Level-Criterion Level |
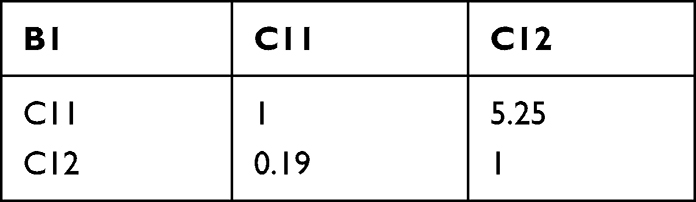 |
Table 3 Evaluation Matrix for the Indicators at the Decision-Maker-Sub-Criterion Level |
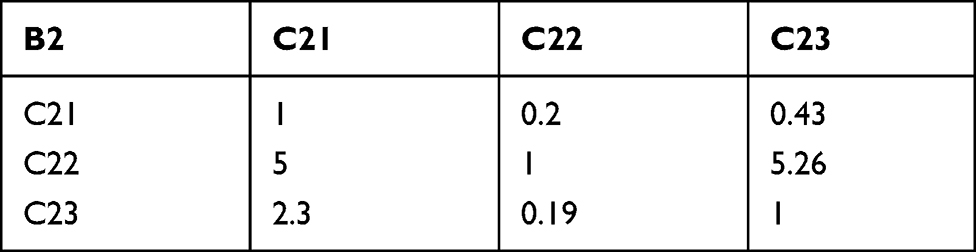 |
Table 4 Evaluation Matrix for the Indicators at the Project Manager-Sub-Criterion Level |
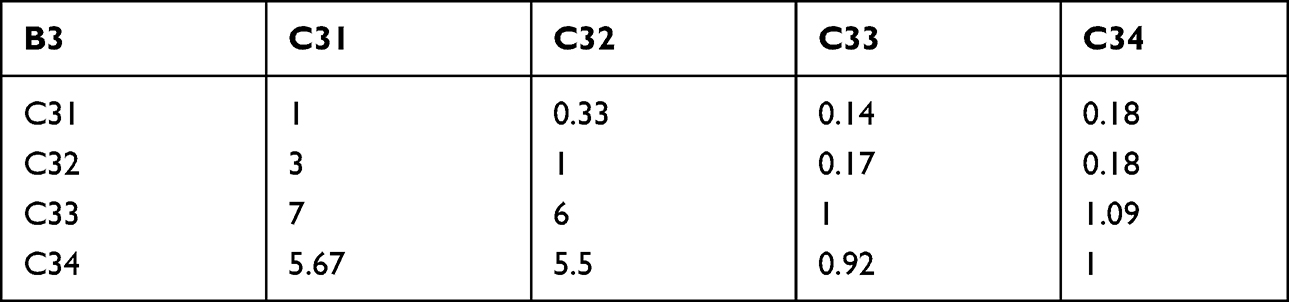 |
Table 5 Evaluation Matrix for the Indicators at the Design Supervisor-Sub Criterion Level |
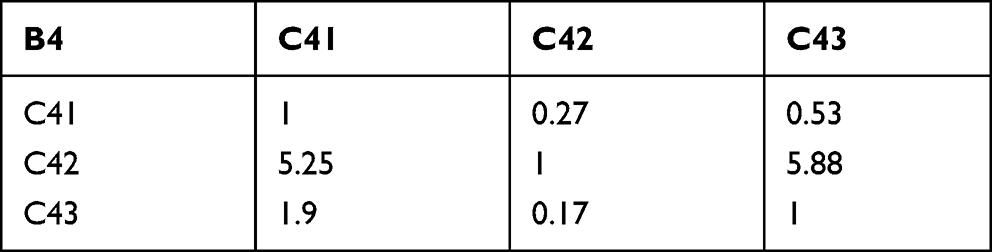 |
Table 6 Evaluation Matrix for the Indicators at the Employee-Sub-Criterion Level |
Consistency Test of Judgment Matrix


 :
:
We calculate the maximum eigenroot root  and the consistency index
  :
:

where n is the order of the evaluation matrix.
A fourth-order evaluation matrix was constructed and analyzed by AHP for decision-makers, project managers, design supervisors, and employees. The weights W= (0.052, 0.133, 0.365, 0.450) of A-B were obtained using SPSS analysis (Table 7). In addition, the maximum eigenroot  =4.221 was calculated by combining the eigenvectors, and
  =0.074 was obtained.
 |
Table 7 Results of AHP for a-B |
A consistency test was performed on the evaluation matrix. The ratio of the consistency index  to the average random indicator
  is the consistency ratio, denoted as
  :
:

The  value of 0.052 was calculated for the fourth-order evaluation matrix, and the consistency checklist for the
  value was 0.90. Since 0.052 < 0.1, the evaluation matrix passes the consistency test, indicating that the weights are calculated accurately. Similarly, the weights W= (0.840, 0.160) for B1-C1, W= (0.109, 0.703, 0.188) for B2-C2, W= (0.056, 0.102, 0.445, 0.397) for B3-C3, and W= (0.111, 0.725, 0.164) for B4-C4.
Weight Ranking
The total weights were calculated by combining the weights of A-B and B-C. The ranking results are listed in Table 8. Employees play a key role in project efficiency management, followed by design supervisors, project managers, and decision-makers. Therefore, the enterprise’s employees are the core stakeholders, the design supervisors and project managers are direct stakeholders, and the decision-makers are indirect stakeholders. The key efficiency management elements are the execution of tasks by employees, the decomposition and evaluation of tasks by design supervisors, and the progress management by project managers.
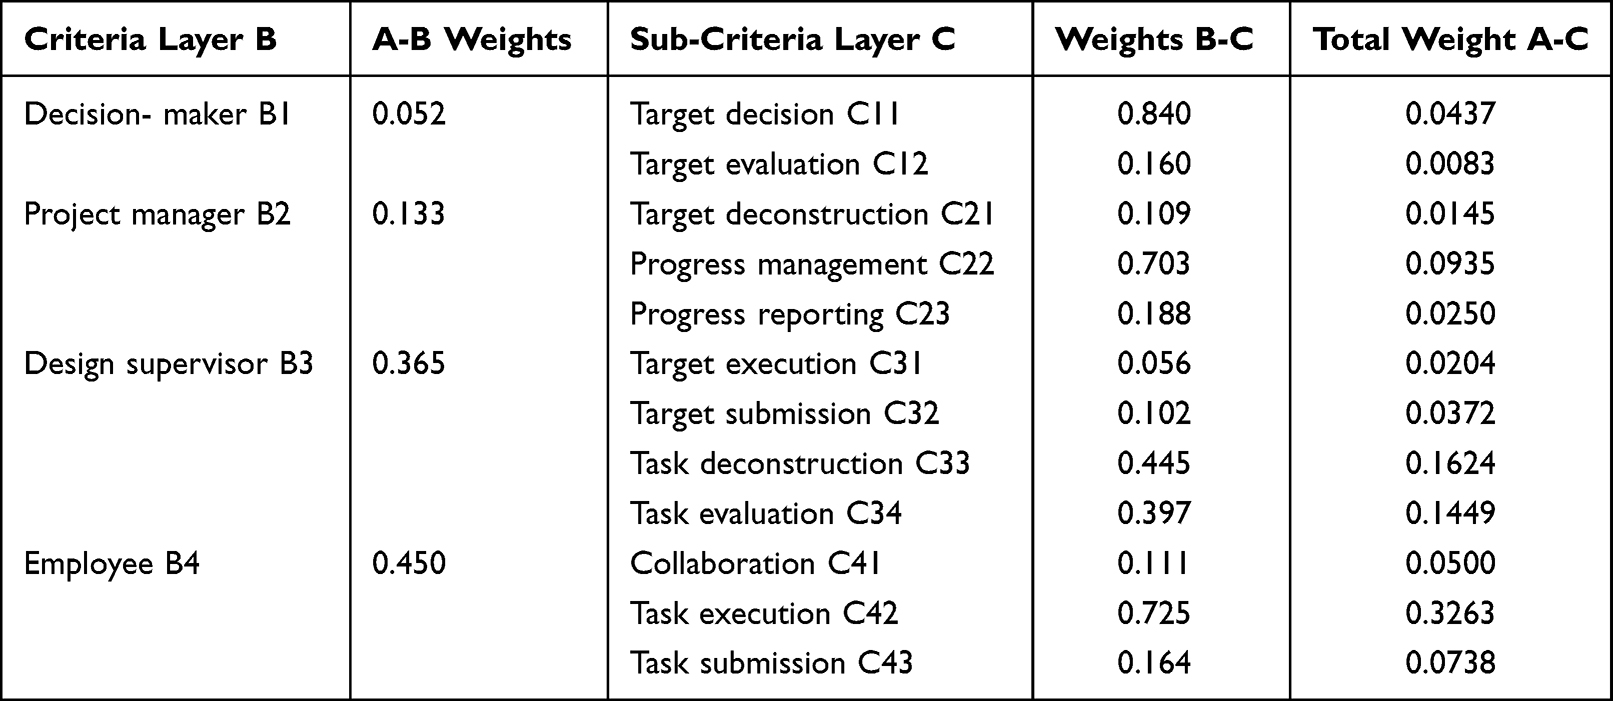 |
Table 8 Total Weight Ranking |
Stakeholder Map
The stakeholder map of the telecommuting model is shown in Figure 5. In an efficient office, the innermost circle of employees collaborate and communicate with each other and with the design supervisor across the hierarchy by performing and submitting tasks. The design supervisor decomposes and evaluates tasks to provide feedback to employees. The middle circle design supervisor and project manager communicate at the same level by decomposing goals, executing goals, and managing progress. The design supervisor, decision-maker, and project manager must communicate across the hierarchy by submitting goals and reporting progress. The decision-maker also manages goals for the project manager and evaluates them for the design manager. The three stakeholder levels comprise the stakeholder map.
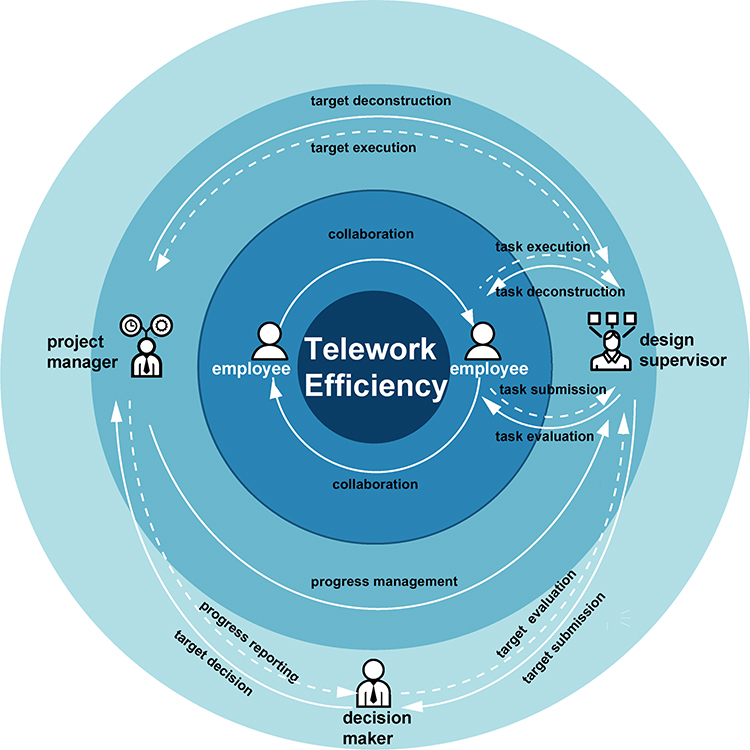 |
Figure 5 Stakeholder map of the telecommuting model. Notes: Figure 5 presents the stakeholder map. Each stakeholder is represented by a symbol, and their interrelationships are related by arrows. The most central circle indicates the most central stakeholder. |
Quantitative Analysis of Employees’ Telecommuting Experience
Establishment of Factor Evaluation Matrix
The differences between the traditional office model and telecommuting are analyzed from three dimensions: people, equipment, and environment. The factors affecting telecommuting efficiency and fluctuations in the users’ emotional experience are summarized in Table 9. The human dimension refers to the relationship with colleagues, the quality of social interaction, and the ability to control oneself and one’s time. The equipment dimension refers to the level of ICT and the cognitive load of digital tools. The environmental dimension refers to the impact of changes in the work environment.
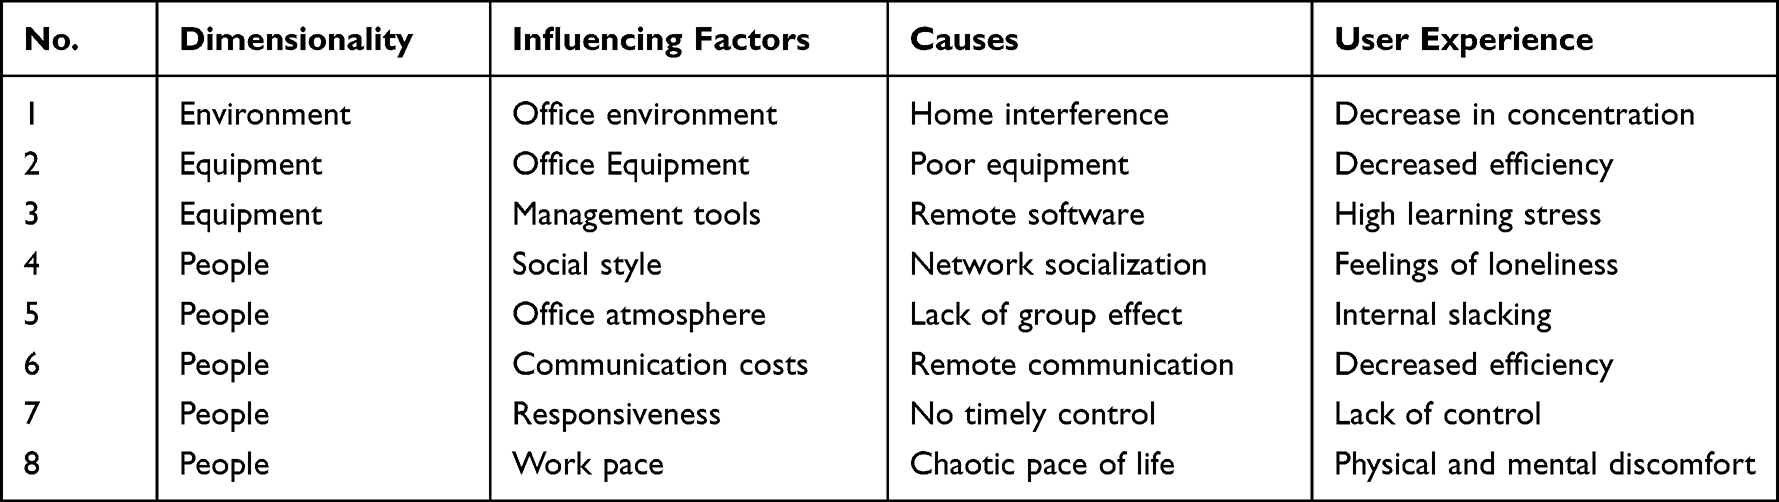 |
Table 9 Factors Affecting Telework Productivity and Emotional Experience |
Let n be the data series creating the following matrix:
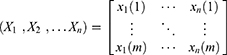
where m refers to the number of indicators, and n is the number of rated objects.
Dimensionless Processing of Data
We determine the reference sequence as:  and the comparison sequence as:
Correlation Analysis
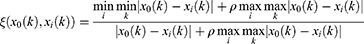
where  is the discrimination coefficient,
  . The smaller the value of
  , the greater the difference in the correlation coefficient is and the greater the discrimination ability is; usually
  = 0.5.
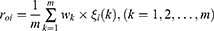
Averaging Coefficients for Each Level
The following equation is used to describe the correlation between factors:
Derive the Analysis Results
User interviews were conducted with 20 employees of Company X. A 7-point scale was established to evaluate the influencing factors. The higher the rating, the greater the influence on work performance was. GRA was conducted for the 8 evaluation items. The discrimination coefficient was 0.5, and the correlation coefficient was calculated. The correlation coefficients are listed in Table 10. For the eight evaluation items, the work pace had the highest correlation (0.922), followed by the responsiveness (0.919) and the social style (0.900).
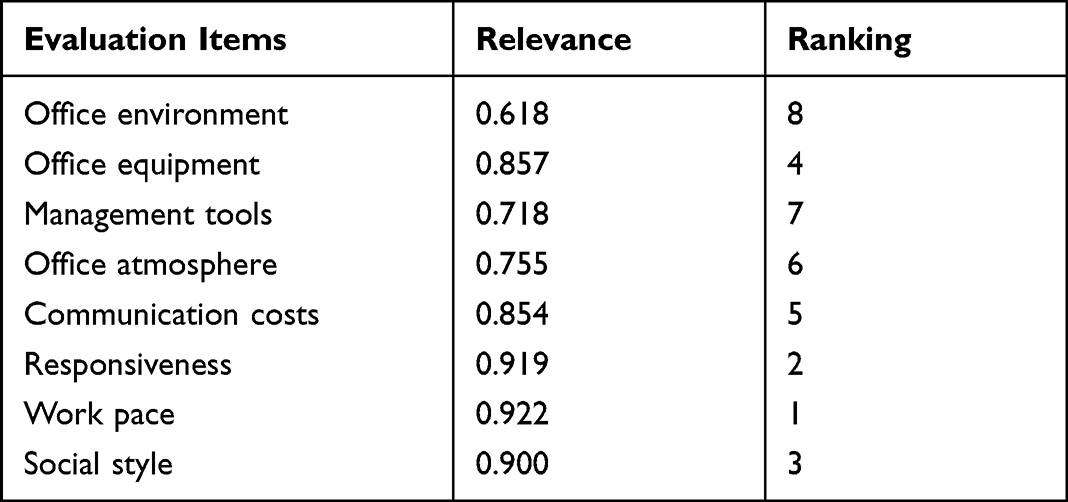 |
Table 10 Correlation Coefficients between Factors Affecting Telework Productivity |
BP Neural Network Analysis
The work pace, responsiveness, and social style were the key elements that influence the telecommuting experience. They were decomposed into 4 variables based on the questionnaire questions: temporal perception, execution difficulty, emotional impact, and communication barrier. These four variables were combined into the NASA-TLX questionnaire. The data obtained from 142 questionnaires and the NASA-TLX scale questions were imported into SPSS 26.0 software to analyze the correlations between the six dimensions of the workload for working at home. A significant correlation was observed between performance and each factor (Table 11). Reliability analysis of the six cognitive load dimensions yielded a Cronbach coefficient of 0.852, indicating the high reliability of the NASA-TLX questions and their suitability for assessing the workload. Factor analysis was performed on six dimensions using principal component analysis. The criterion of the characteristic root was greater than or equal to 1. A Kaiser-Meyer-Olkin (KMO) value of 0.819 was obtained, and the Bartlett sphericity test significance was 0.000. Correlation analysis of the key variables of the user experience indicated that user emotion and temporal perception, execution difficulty, and communication barriers showed significant correlations with each other (Table 12).
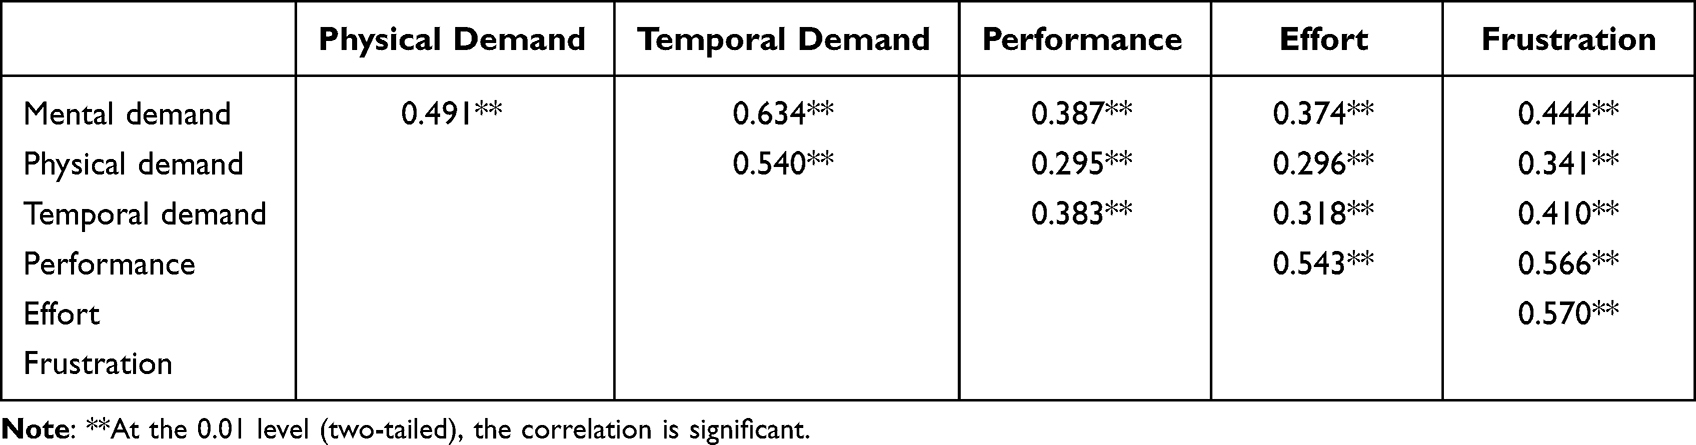 |
Table 11 Results of Correlation Analysis Between the Six Dimensions for the NASA-TLX Scale |
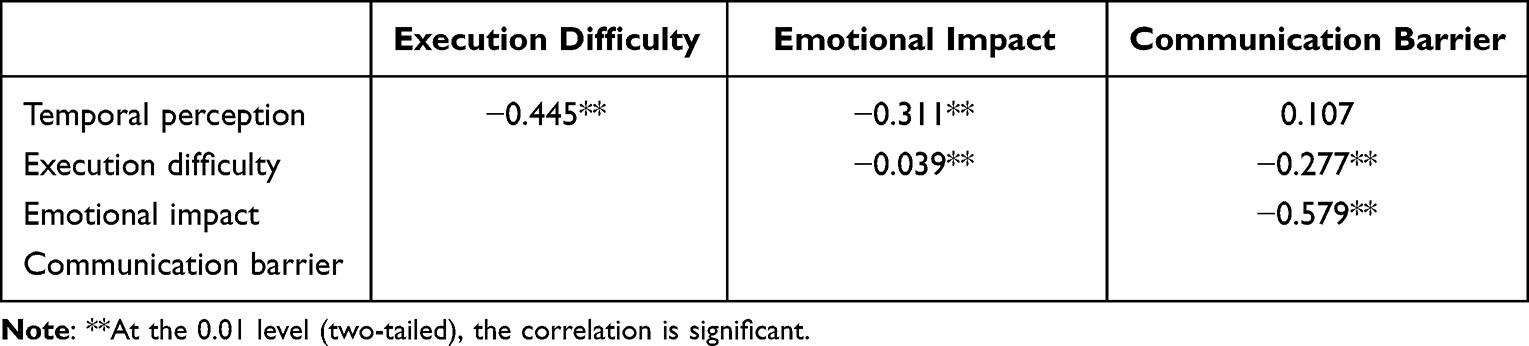 |
Table 12 Results of Correlation Analysis Between the Key Variables of User Experience |
SPSS26.0 was used for BP neural network computation. We grouped the data and trained the model in SPSS 26.0 using two steps. First, the data were split into the training set (70%) and the validation set (30%). The training set was used to train the model and find the best weights and biases. The validation set was used to determine the model’s hyperparameters and select the optimal model. The test set was only used to evaluate the performance of the trained network. Next, a multilayer perceptron was generated, and the dependent variable, factors, and covariates were selected. We selected a random case assignment based on the relative number of cases. A custom architecture was used. We used one hidden layer, a sigmoid activation function in the hidden layer, and a softmax activation function in the output layer. We used batch training to speed up the training process. Gender was a factor, emotional impact and workload were covariates, and job performance was the dependent variable for data prediction.
The model summary (Table 13) shows that the error rate of the training set is 19.8%, and that of the test set is 22%. The classification results (Table 14) indicate that the accuracy rate of the training set is 80.2%, and that of the test set is 78%. These findings demonstrate a high prediction ability of the model. The areas of the receiver operating characteristics (ROC) curves are greater than 0.865 (Figure 6 and Table 15), indicating that the model has a good prediction ability.
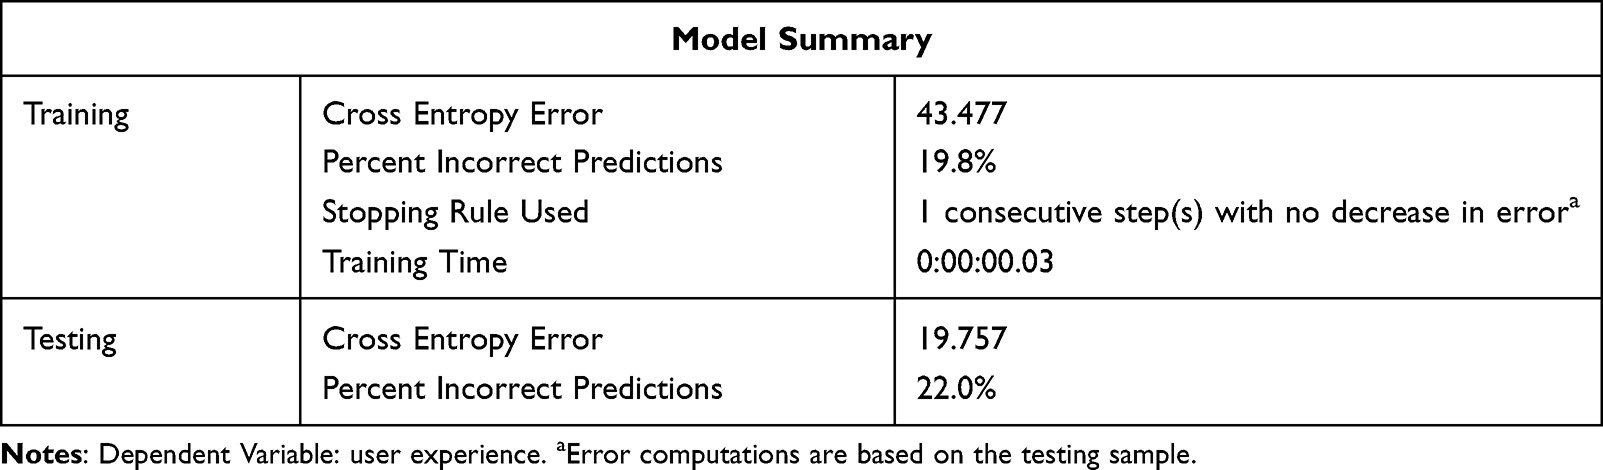 |
Table 13 Model Summary |
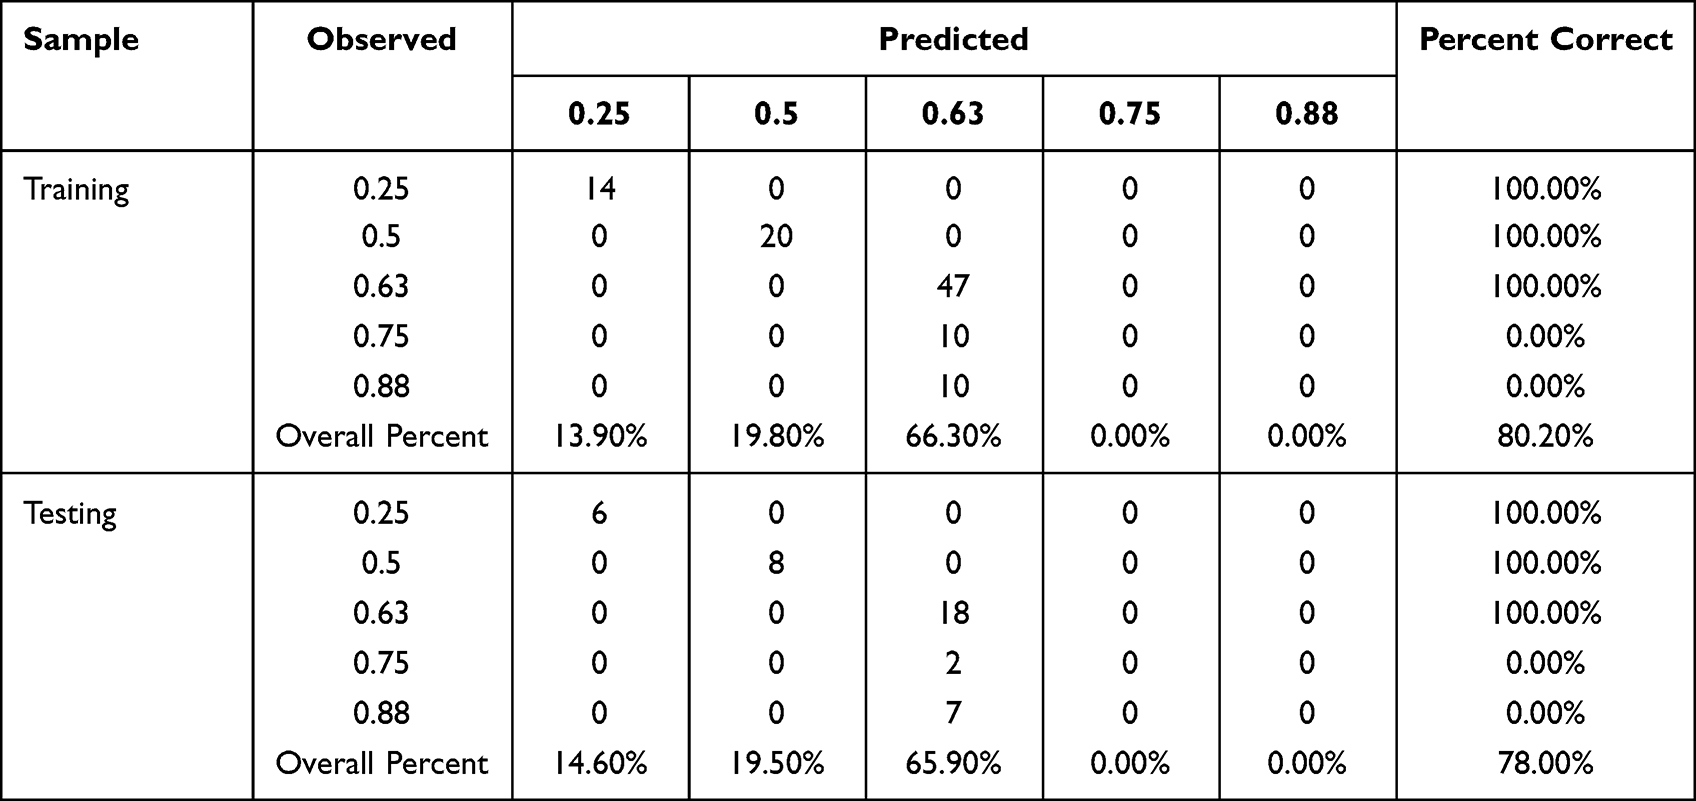 |
Table 14 Classification Results |
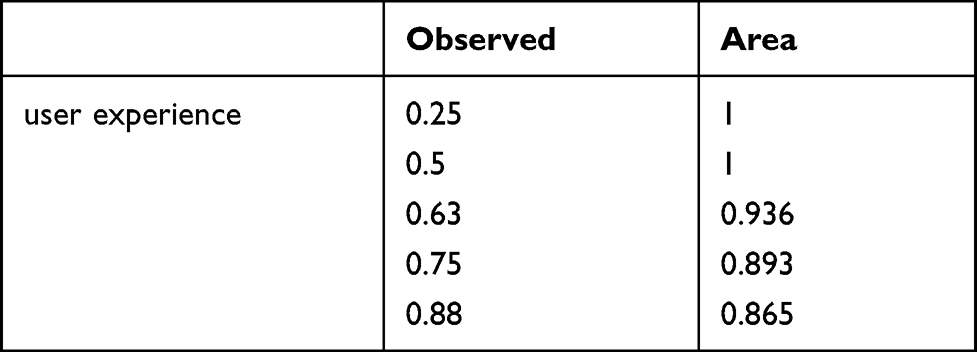 |
Table 15 Area Under the Curve |
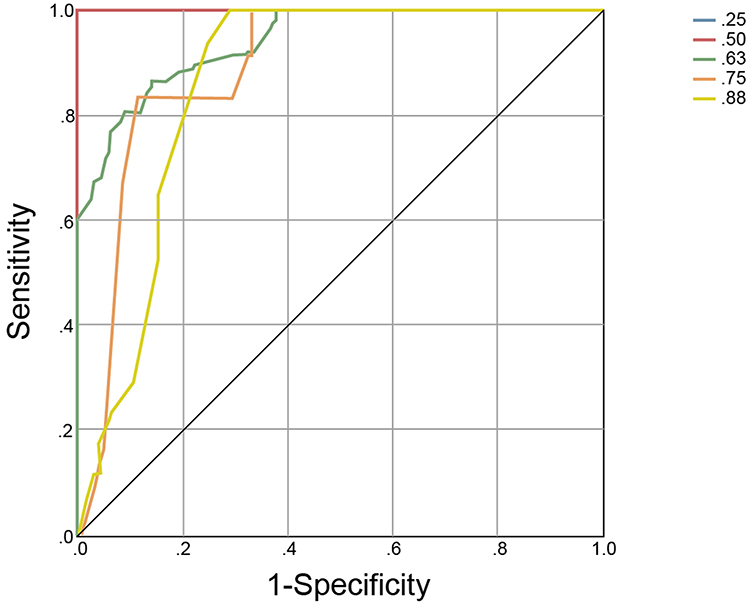 |
Figure 6 Area under the curve. Notes: Figure 6 represents the ROC area map calculated by the BP neural network. A larger area indicates a more accurate prediction result. |
Based on our results, we created a system map for telecommuting efficiency management (Figure 7). The system map is based on stakeholder interactions, and the movement and stakeholders are indicated by arrows. The interaction relationship of the core stakeholder C42 has the largest weight and is the crucial point of the user experience. Adjusting the rhythm, timing, and communication goals through scheduled punching can provide opportunities to improve physical and mental well-being and sense of control. Second, the relationship between task and efficiency is evaluated by setting task hours to reduce the sense of informality resulting from remote collaboration. Third, it is suggested to create short-time multiple rounds of communication and share files for collaborative editing to reduce the sense of loneliness and improve the efficiency of remote collaboration.
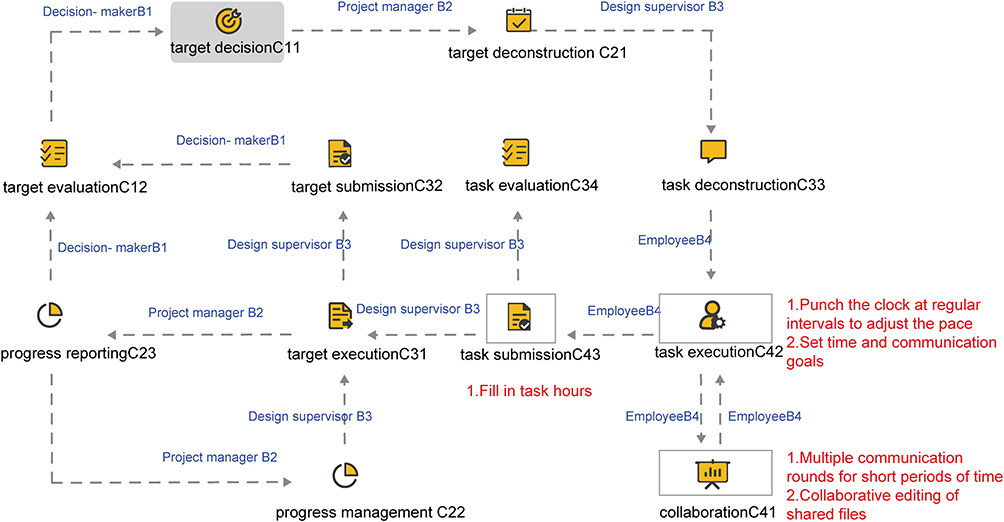 |
Figure 7 System map for telecommuting efficiency management. Notes: Figure 7 represents the system map of the remote experience. The core interaction points are identified through the stakeholder interactions, the processes of each stakeholder, and the core interaction points of the remote experience are improved through our proposed strategies to enhance the remote experience of employees. |
Discussion
The use of teleworking has been necessary during the global epidemic to minimize its influence. The teleworking model is likely here to stay in the fight against the pandemic in various countries.55 The literature on teleworking has focused primarily on employee job satisfaction, work-life balance, impact on career development, and employee performance.56 Studies have evaluated the influence of teleworking on job performance. However, there has been a lack of focus on factors affecting performance, especially psychological aspects. This study examined how teleworking affects the user experience and how the performance of teleworking employees can be predicted using workload analysis. This approach enables companies to manage job performance in a timely manner during the pandemic, stabilize job performance, and reduce negative experiences of employees related to remote work.
Although there were many factors associated with remote work performance, our findings demonstrated that user experience can serve as a strong predictor of work performance. It supported the findings that positive emotional encouragement can strive for better performance.15 Meanwhile, Kumar’s study found that family distraction, occupational discomfort, and distress were significant for the marketing of job performance, with distress being the most significant one.57 This was consistent with our findings emphasizing the impact of emotional experience on job performance. This is because, in contrast to performance management studies prior to the pandemic outbreak, working from home is an encouraging and innovative mode of work that provides flexibility. However, the need for companies and employees to face a sudden, temporary shift to work from home after a pandemic outbreak is both unfamiliar and stressful for everyone. COR theory demonstrates that a reduction in employees’ resources, both physical and emotional, affects employee performance.58
In addition, the prediction results indicate that the factors affecting teleworking employees are diverse, but emotions are the main influencing factor. A positive relationship was observed between emotional influence and temporal perception, execution difficulty, and communication barriers. Therefore, the user experience can be substantially improved by adjusting these three factors. Job performance is related to the difficulty of performing work, and employees’ sense of responsibility and control over their work determines the difficulty of performing work.59 Both the control over their own office equipment and the control over collaboration among colleagues increase the difficulty of working from home. This is consistent with the findings of the Kim’s study that good teamwork is an element of high performing workers.60 This is further evidence that the reliability of our proposal for enhancing the sense of control over remote work.
Cheng and He reduced the complexity and uncertainty of a project by focusing on the key stakeholders.23 The results indicated that job performance analysis of core stakeholders and employees could predict employee telework performance. Similar to the results of Liu’s study, it is important for employees to improve their job performance by job shaping and setting goals for telecommuting employees’.16 This result is consistent with our study, which showed the advantages of establishing flexible office hours and developing the social skills of teleworking employees. Troll found that physical conditions and autonomous motivation were significantly correlated with job performance. This is in line with our results that improving employees’ motivations can be achieved by establishing work hours for specific tasks.17
Limitations and Directions for Future Research
Our study has several limitations that should be addressed in future research. First, the validity of the user experience model should be tested in different cultural contexts. This study was conducted in a Chinese city; however, it is unclear whether it is applicable to other countries. Second, the sample size of this study was insufficient due to the time and lack of people’s willingness to participate due to the epidemic. Only employees working from home in Xi’an city were analyzed, resulting in potential bias. In addition, the BP neural network proved accurate in this study, but more research is focused on optimizing it to improve the model’s accuracy.
This study focused on the methodological ideas of teleworking performances management, but the classification of stakeholders was relatively broad. The decision and execution levels were summarized by individual stakeholders. However, in an actual project, each stakeholder dynamically adjusts to different positions, resulting in potential variability in the results.
Future studies should investigate differences in teleworking performances in different cultural contexts. By sampling people from different regions, we can assess the variability in the employee experience during telecommuting. Due to the popularity of teleworking, the employees’ experiences will stabilize over time. Thus, the impact of teleworking on performance should be evaluated at a later date. Another key direction for future research is the optimization of the BP neural network for teleworking performance. In follow-up studies, the classification of stakeholders should be refined, and the complexity of the organizational structure of the collaborative teams should be increased to improve the applicability of the model and provide new insights into quantitative research on service design.
Conclusion
This study shows that we use service design thinking to identify the stakeholder relationships for telecommuting. According to the results, the core stakeholders that influence telecommuting performance are at the executive level, ie, the company’s employees. In addition, it also verifies the scientificity and accuracy of the change from an institution-centered management model to a people-centered management model in remote office management. The weight of the stakeholders defines the efficiency of the collaborative team, and the interaction relationship of the stakeholders determines the process and key nodes of efficiency management.
For studying the relationship between remote experience and work performance, we used the AHP and GRA to obtain the weights of stakeholders and interaction relations to evaluate the main factors affecting the efficiency of the core stakeholders. The causal relationship of the user experience was predicted by the BP neural network, and a system map for telecommuting efficiency management was created. According to the results, the accuracy of the prediction model reached more than 80%, so our proposed method can be used to predict work efficiency through telework workload and emotional experience. Finally, the strategies proposed in the system map can prevent performance fluctuations during teleworking.
The emotional experience of employees is crucial in telework performance. Our study contributes to the literature by extending research on the influential mechanisms of telework performance. It is important for companies to perform timely adjustments to reduce telework-induced fluctuations in job performance due to paradigm shifts, such as an epidemic. Improving the user experience of teleworking and ensuring job performance stability can guide organizational management.
Theoretical Implications
First, considering the lack of previous studies on the prediction of telework performance using BP neural networks, at the theoretical level, future studies can refer to the proposed method in this study as an effective means to further explore the knowledge of telework performance in order to expand the research on this area. Also, this study combines the AHP, GRA, and NASA-TLX methods to quantitatively analyze the factors influencing remote job performance. Although this study is exploratory in nature, it can still be used as a reference as an empirical study for future research scholars to study variables and data-based analysis in depth.
Second, the service design thinking proposed in this study can serve as a guideline for future research on telework performance. In other words, a human-centered and experience-centered management model is more helpful for companies to manage their employees.
Practical Implications
Regarding the practical implications of our findings, companies can use the results of our study to establish new management thinking not only in terms of employee performance management, but also in terms of the systemic aspects of overall corporate management to better predict and evaluate employee performance management and mental health management during the COVID-19 pandemic. In addition, the emphasis on a people-centered management approach better helps companies care for their employees and enhance their sense of organizational support. Alternatively, employees can feel the company’s concern for their well-being and enhance their dependence and loyalty to the company.
Acknowledgments
This study was funded by the Innovation capability support program of Shaanxi (2021PT-025), the ”Young outstanding” talent support program of colleges and universities in Shaanxi (2020-50), and the Key R&D plan program of Shaanxi(2022ZDLGY06-05).
Disclosure
The authors report no conflicts of interest in this work.
References
1. Kim WJ, Seo WS. The effects of job characteristics on perceived organizational support, organizational commitment and organizational citizenship behavior of hotel employees. J Tourism Leisure Res. 2011.
2. Jeung W. The effect of perceived organizational support on job performance: the mediating effect of thriving at work and the moderating effect of resilience. Productivity Rev. 2019;33(4):135–165. doi:10.15843/kpapr.33.4.2019.12.135
3. Chipoong K, Hyung-Gyu L. The effect of perceived organizational support on organizational citizenship behavior: the mediating role of employee experience. Korean Manag Consulting Rev. 2022;22(2):91–104.
4. Golden TD, Veiga JF. The impact of superior–subordinate relationships on the commitment, job satisfaction, and performance of virtual workers. Leadersh Q. 2008;19(1):77–88. doi:10.1016/j.leaqua.2007.12.009
5. Taskin L, Devos V. Paradoxes from the individualization of human resource management: the Case of Telework. J Bus Ethics. 2005;62(1):13–24. doi:10.1007/s10551-005-8710-0
6. Ashkanasy NM, Dorris AD. Emotions in the workplace. Annu Rev Organ Psychol Organ Behav. 2017;4(1):67–90. doi:10.1146/annurev-orgpsych-032516-113231
7. Qu XY, Yao X, Liu QS. Affective shifts outside work: effects on task performance, emotional exhaustion, and counterproductive work behavior. Front Psychol. 2021;12:640144. doi:10.3389/fpsyg.2021.640144
8. Barriga Medina HR, Campoverde Aguirre R, Coello-Montecel D, et al. The influence of work–family conflict on burnout during the COVID-19 pandemic: the effect of teleworking overload. Int J Environ Res Public Health. 2021;19:10302. doi:10.3390/ijerph181910302
9. Lal B, Dwivedi YK, Haag M. Working from home during Covid-19: doing and managing technology-enabled social interaction with colleagues at a distance. Inf Syst Front. 2021. doi:10.1007/s10796-021-10182-0
10. Jamal MT, Alalyani WR, Thoudam P, et al. Telecommuting during COVID 19: a moderated-mediation approach linking job resources to job satisfaction. Sustainability. 2021;13(20):11449. doi:10.3390/su132011449
11. Yu LL, Zhong YW, Sun Y, et al. The impact of excessive social media use at work: a usage experience–stressor–strain perspective. Behav Inf Technol;2022. 1–20. doi:10.1080/0144929X.2022.2054358
12. Schmitt JB, Breuer J, Wulf T. From cognitive overload to digital detox: psychological implications of telework during the COVID-19 pandemic. Comput Human Behav. 2021;2:106899. doi:10.1016/j.chb.2021.106899
13. Chu LC. Mediating positive moods: the impact of experiencing compassion at work. J Nurs Manag. 2016;24(1):59–69. doi:10.1111/jonm.12272
14. Furnham A, Milner R. The impact of mood on customer behavior: staff mood and environmental factors- ScienceDirect. J Retail Consum Serv. 2013;20(6):634–641. doi:10.1016/j.jretconser.2013.06.001
15. Liu W. Effects of positive mood and job complexity on employee creativity and performance. Soc Behav Pers. 2016;44(5):865–880. doi:10.2224/sbp.2016.44.5.865
16. Liu L, Wan W, Fan Q. How and when telework improves job performance during COVID-19? Job crafting as mediator and performance goal orientation as moderator. Psychol Res Behav Manag. 2021;14:2181–2195. doi:10.2147/PRBM.S340322
17. Troll ES, Venz L, Weitzenegger F, et al. Working from home during the COVID-19 crisis: how self-control strategies elucidate employees’ job performance. Appl Psychol. 2022;71(3):853–880. doi:10.1111/apps.12352
18. Jamal MT, Khan AI, Khan NA. Voluntary part-time and mandatory full-time telecommuting: a comparative longitudinal analysis of the impact of managerial, work and individual characteristics on job performance. Int J Manpow. 2022;43(6):1316–1337. doi:10.1108/IJM-05-2021-0281
19. Jamal MT, Anwar I, Khan NA, et al. Work during COVID-19: assessing the influence of job demands and resources on practical and psychological outcomes for employees. Asia-Pac J Bus Adm. 2021;13(3):293–319. doi:10.1108/APJBA-05-2020-0149
20. Zhang BQ, Zhao L, Liu XY, et al. The influence of employee emotion fluctuation on service performance: an experience sampling data analysis. Front Psychol. 2022;13:648142. doi:10.3389/fpsyg.2022.648142
21. García-Sánchez IM, Aibar-Guzmán C, Serrano-Valdecillos C, et al. Analysis of the dialogue with stakeholders by the IBEX 35 companies. Sustainability. 2022;14(3):1913. doi:10.3390/su14031913
22. Rana W, Mukhtar S, Mukhtar S. Job satisfaction, performance appraisal, reinforcement and job tasks in medical healthcare professionals during the COVID‐19 pandemic outbreak. Int J Health Plann Manage. 2022;37(4):2345–2353. doi:10.1002/hpm.3476
23. Cheng S, He XM. Evaluation method of stakeholder status in service design. Packag Eng. 2020;41(16):205–209.
24. Jian LIU, Feng Z, Zaoli Y, et al. An integrated intelligent service design model and empirical analysis based on the value co-creation. J Manag World. 2021;37(6):202–213+13.
25. Xu J, Yan C. Research on the influence of stakeholders on the performance evaluation of state-owned enterprises. Macroecon Res. 2016;7:122–128+159.
26. Lippe T, Van D, Zoltán L. Co-workers working from home and individual and team performance. John Wiley & Sons, Ltd; 2020:1.
27. Zainal AN, Irmohizam I, Azuwar AAS. A literature review of work from home phenomenon during COVID-19 toward employees’ performance and quality of life in Malaysia and Indonesia. Front Psychol. 2022;13:819860. doi:10.3389/fpsyg.2022.819860
28. Chang PC, Wu T, Liu CL. Do high-performance work systems really satisfy employees? evidence from China. Sustainability. 2018;10(10):3360. doi:10.3390/su10103360
29. Alfina B, Ismayaza N, Mahyudin HA, et al. Employee’s job satisfaction and performance through working from home during the pandemic lockdown. Digital Gov Capacity Build Soc Inclusion. 2020.doi:10.21834/ebpj.v5i15.2515
30. Chenglei XU, Silu C, Wanchu D. Research on cross-functional interface collaborative efficiency for transformational enterprises team cluster. Sci Technol Prog Policy. 2017;34(21):125–132.
31. Hussain S, Khoja AH, Wang X, et al. Assessing the impact of COVID-19 and safety parameters on energy project performance with an analytical hierarchy process. Util Policy. 2021;101:101210. doi:10.1016/j.jup.2021.101210
32. Fanghua Z, Jingyuan T. A study of the relationship between synergy of internal elements and innovation performance. Sci Res Manag. 2016;37(2):20–28.
33. Xie X, Xu M. Collaborative innovation mechanism, collaborative innovation atmosphere and innovation performance: taking collaborative networks as the mediator variable. Sci Res Manag. 2014;35(12):9–16.
34. Hu F, Li WQ. Definition of ”service design. Packag Eng. 2019;10:37–51.
35. Kuo Y, Yang T, Huang GW. The use of grey relational analysis in solving multiple attribute decision-making problems. Comput Ind Eng. 2008;55(1):80–93. doi:10.1016/j.cie.2007.12.002
36. Liu J, Gao ZM, Wang L. Design scheme evaluation and sensitivity analysis of product based on grey relation. In: Applied Mechanics and Materials. Vol. 291–294. Trans Tech Publications, Ltd.; 2013:2706–2709.
37. Xingguo LI. Hesitant fuzzy multi-attribute decision making model based on grey relational analysis and its application. Fuzzy Sets Syst. 2019;33(5):127–135.
38. Shijian L, Wenyin Z. Status and progress of service design research. Packag Eng. 2018;39(24):43–53.
39. Weiwei W, Ting W, Zhang Y, et al. A method of intelligent product design cue construction based on customer touchpoint correlation analysis and positive creativity theory. Adv Mech Eng. 2019;11:1687814018819347.
40. Xiuli G, Jie W. Evaluation of product service system design solutions based on complex networks and preference order structure evaluation method. Comput Integr Manuf Syst. 2019;25(9):2324–2333.
41. 문주시., Kim YS. A case study of service design prototyping using emotional experience evaluation for service space design. J Korea Design Forum. 2015;48:409–418.
42. Rau CA, Zbiek JM, Jonas JM. Creating competitive advantage from services: a design thinking case study from the commodities industry. Res Technol Manag. 2017;60(3):48–56. doi:10.1080/08956308.2017.1301003
43. Shah MU, Guild PD. Stakeholder engagement strategy of technology firms: a review and applied view of stakeholder theory. Technovation. 2022;114:102460. doi:10.1016/j.technovation.2022.102460
44. Lyu HM, Zhou WH, Shen SL, et al. ”Inundation risk assessment of metro system using AHP and TFN-AHP in Shenzhen. Sustain Cities Soc. 2020;56:102103. doi:10.1016/j.scs.2020.102103
45. Liu HJ, Zhao CH, Li CB. The research on research personnel performance appraisal based on the AHP and fuzzy evaluation. J North China Electr Power Univ. 2012;39(5):105–108.
46. Mansikka HK, Harris VD, Harris D. Comparison of NASA-TLX scale, modified cooper-harper scale and mean inter-beat interval as measures of pilot mental workload during simulated flight tasks. Ergonomics. 2019;62(2):246–254. doi:10.1080/00140139.2018.1471159
47. Saura JR, Palacios-Marqués D, Ribeiro-Soriano D. Exploring the boundaries of open innovation: evidence from social media mining. Technovation. 2022;102447. doi:10.1016/j.technovation.2021.102447
48. Saura JR, Ribeiro-Soriano D, Palacios-Marqués D. Using data mining techniques to explore security issues in smart living environments in Twitter. Comput Commun. 2021;179:285–295. doi:10.1016/j.comcom.2021.08.021
49. Yuelin L, Xiyu W, Jian W. Product image modeling design based on triangular fuzzy and BP neural network. Packag Eng. 2021;42(14):185–193.
50. Diestel S, Rivkin W, Schmidt KH. Sleep quality and self-control capacity as protective resources in the daily emotional labor process: results from two diary studies. J Appl Psychol. 2015;100(3):809–827. doi:10.1037/a0038373
51. Wang ZJ, Han XJ. A Prediction and evaluation model analysis of enterprise economic management mode based on neural network strategy. Secur Commun Netw. 2022.doi: 10.1155/2022/9639025
52. Li WQ, Xu GH, Xing QH, et al. Application of improved AHP-BP neural network in CSR performance evaluation model. Wirel Pers Commun. 2019;2:34.
53. Yang ST, Luo LN, Tan BH. Research on sports performance prediction based on BP neural network. Mob Inf Syst. 2021. doi:10.1155/2021/5578871
54. Lin S, Döngül ES, Uygun SV, et al. Exploring the relationship between abusive management, self-efficacy and organizational performance in the context of human–machine interaction technology and artificial intelligence with the effect of ergonomics. Sustainability. 2022;14(14):1949. doi:10.3390/su14041949
55. Seejeen PJ, Kim G. The effects of telework related perceptions on job satisfaction: the case of COVID-19 context in the Republic of Korea. J Gov Adm. 2021. 17: 1–35.
56. Athanasiadou C, Theriou G. Telework: systematic literature review and future research agenda. Heliyon. 2021;7(10):e08165. doi:10.1016/j.heliyon.2021.e08165
57. Kumar P, Kumar N, Aggarwal P, et al. Working in lockdown: the relationship between COVID-19 induced work stressors, job performance, distress, and life satisfaction. Curr Psychol. 2021;40(12):6308–6323. doi:10.1007/s12144-021-01567-0
58. Xia A, Wang B, Song B, et al. How and when workplace ostracism influences task performance: through the lens of conservation of resource theory. Hum Resour Manag J. 2019;29(3):353–370. doi:10.1111/1748-8583.12226
59. Sethela J, Mahmood R. The relationship between person-job fit and job performance: a study among the employees of the service sector SMEs in Malaysia. Intl J Bus Humanit Technol. 2011;1:2047–7031.
60. Kim YK. The relationships between high-performance work systems, job satisfaction, and job performance. Int J Tour Hosp Res. 2017;31(12):101–115. doi:10.21298/IJTHR.2017.12.31.12.101
 © 2022 The Author(s). This work is published and licensed by Dove Medical Press Limited. The full terms of this license are available at https://www.dovepress.com/terms.php and incorporate the Creative Commons Attribution - Non Commercial (unported, v3.0) License.
By accessing the work you hereby accept the Terms. Non-commercial uses of the work are permitted without any further permission from Dove Medical Press Limited, provided the work is properly attributed. For permission for commercial use of this work, please see paragraphs 4.2 and 5 of our Terms.
© 2022 The Author(s). This work is published and licensed by Dove Medical Press Limited. The full terms of this license are available at https://www.dovepress.com/terms.php and incorporate the Creative Commons Attribution - Non Commercial (unported, v3.0) License.
By accessing the work you hereby accept the Terms. Non-commercial uses of the work are permitted without any further permission from Dove Medical Press Limited, provided the work is properly attributed. For permission for commercial use of this work, please see paragraphs 4.2 and 5 of our Terms.