")
Back to Journals » International Journal of Nanomedicine » Volume 12
A systematic identification of species-specific protein succinylation sites using joint element features information
Authors Hasan MM , Khatun MS, Mollah MNH, Yong C, Guo D
Received 2 May 2017
Accepted for publication 6 June 2017
Published 28 August 2017 Volume 2017:12 Pages 6303—6315
DOI https://doi.org/10.2147/IJN.S140875
Checked for plagiarism Yes
Review by Single anonymous peer review
Peer reviewer comments 2
Editor who approved publication: Dr Thomas Webster
Md Mehedi Hasan,1 Mst Shamima Khatun,2 Md Nurul Haque Mollah,2 Cao Yong,3 Dianjing Guo1
1School of Life Sciences and the State Key Laboratory of Agrobiotechnology, The Chinese University of Hong Kong, Shatin, New Territory, Hong Kong, People’s Republic of China; 2Laboratory of Bioinformatics, Department of Statistics, University of Rajshahi, Rajshahi, Bangladesh; 3Department of Mechanical Engineering and Automation, Harbin Institute of Technology, Shenzhen Graduate School, Shenzhen, People’s Republic of China
Abstract: Lysine succinylation, an important type of protein posttranslational modification, plays significant roles in many cellular processes. Accurate identification of succinylation sites can facilitate our understanding about the molecular mechanism and potential roles of lysine succinylation. However, even in well-studied systems, a majority of the succinylation sites remain undetected because the traditional experimental approaches to succinylation site identification are often costly, time-consuming, and laborious. In silico approach, on the other hand, is potentially an alternative strategy to predict succinylation substrates. In this paper, a novel computational predictor SuccinSite2.0 was developed for predicting generic and species-specific protein succinylation sites. This predictor takes the composition of profile-based amino acid and orthogonal binary features, which were used to train a random forest classifier. We demonstrated that the proposed SuccinSite2.0 predictor outperformed other currently existing implementations on a complementarily independent dataset. Furthermore, the important features that make visible contributions to species-specific and cross-species-specific prediction of protein succinylation site were analyzed. The proposed predictor is anticipated to be a useful computational resource for lysine succinylation site prediction. The integrated species-specific online tool of SuccinSite2.0 is publicly accessible.
Keywords: posttranslation modification, succinylation site prediction, machine learning, sequence encoding, feature selection
Introduction
Lysine succinylation is identified as a major type of protein posttranslational modification (PTM) found in a wide variety of biological processes.1–3 Succinylation has been shown to occur in the active site of homoserine trans-succinylase, although a succinyl group was transferred from succinyl-CoA to homoserine in the intermediate reaction.2,4,5 It is evolutionarily conserved and is commonly found in response to various physiological conditions.4 It has been indicated that lysine succinylation may have potential impacts on cellular enzymes and metabolism such as tricarboxylic acid cycle, amino acid degradation, nitrogen metabolism, and fatty acid oxidation.6 Furthermore, histone succinylation is suggested to contribute to protein structures and function regulation.2,7
Nowadays, various large-scale proteomic methods are widely adopted to identify lysine succinylation in numerous organisms, including bacteria (Escherichia coli), pathogenic bacteria (Mycobacterium tuberculosis), protozoan and parasite (Toxoplasma gondii), fungi (yeast), mammalian cells (human and mouse), and recently in plants.1,6,8–14 Despite these efforts, the mechanism of lysine succinylation specificity is still largely unknown.9,10 Moreover, conventional experimental identification of succinylation substrates is not efficient enough for large-scale datasets. Computational approaches, on the other hand, can provide accurate and reliable prediction of succinylation sites, and thus may serve as powerful alternatives to complement the experimental efforts.
In recent years, a number of computational approaches have been developed for predicting succinylation sites.15–21 Zhao et al proposed a primary sequence-based SucPred predictor15 integrating multiple sequence encoding schemes, including autocorrelation functions, grouped weight-based encoding, position-weighted amino acids composition, and normalized van der waals volume with a support vector machine (SVM) classifier. Xu et al developed iSuc-PseAAC predictor based on a single sequence encoding, that is, pseudo amino acid composition with SVM classifier.16 In addition, an SVM-based predictor SuccFind utilizing the amino acid frequency-based composition of k-spaced amino acid pair (CKSAAP) and a single amino acid index (AAindex) properties was developed.17 We developed a random forest (RF)-based predictor SuccinSite,18 in which the three informative sequence encoding features, that is, CKSAAP, binary, and the selected AAindex physicochemical features, were combined. Recently, Jia et al developed the iSuc-PseOpt predictor,19 based on pseudo amino acid composition encoding with K-nearest neighbors’ algorithm. Meanwhile, Jia et al developed pSuc-Lys based on a pseudo amino acid composition encoding an ensemble RF approach.20 More recently, SucStruct predictor was developed based on structural properties of amino acids with a decision tree classifier.21 The SucStruct achieved a better performance on cross-validation tests based on only 670 succinylated proteins, and yet the recently published novel datasets were not tested. Despite all these efforts, the overall performances of the aforementioned predictors are still not fully satisfactory. Limitations were encountered when these models were applied to whole proteome species as a training model. The most important issue is that the sequences or structural patterns around the succinylation sites may significantly vary in different species.10 Moreover, all of the existing predictors combine all species as a generic one to build a simplified model, disregarding the differences that exist among species. Effective species-specific computational predictors for succinylation site prediction in various organisms are currently not available. Therefore, this study aims to establish a novel predictor for predicting both generic and species-specific lysine succinylation sites based on joint element features information. In this new model, integrated profile-based composition of k-spaced amino acid pairs (pbCKSAAP)19–21 and orthogonal binary encodings were adopted. The proposed method achieved better performance on cross-validation and a large-scale independent test. Furthermore, cross-species lysine succinylation site was analyzed for a better understanding of protein succinylation pattern. A feature selection method, namely, Information Gain (IG) was then applied for optimizing our prediction results.25 A web server for both species-specific and generic model was established.
Materials and methods
The SuccinSite2.0 predictor is an RF-based predictor constructed based on pbCKSAAP and orthogonal binary features. An overview of the predictor is shown in Figure 1.
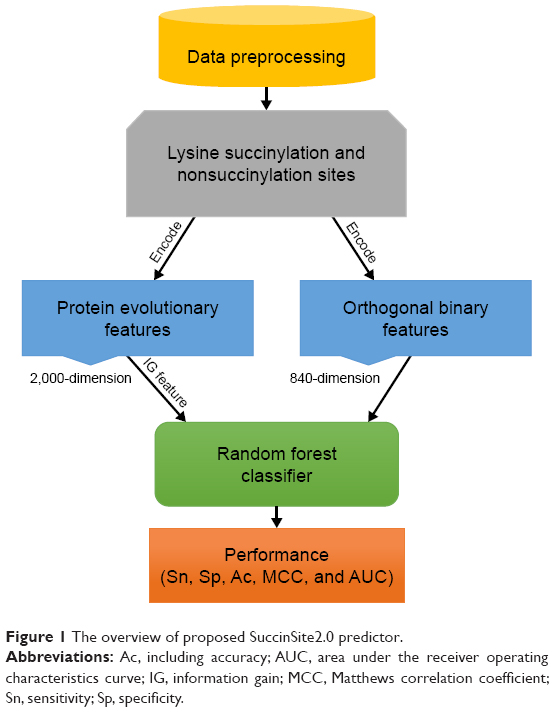 | Figure 1 The overview of proposed SuccinSite2.0 predictor. |
Dataset preparation
Experimentally verified succinylation data for seven model organisms, including Homo sapiens, Mus musculus, E. coli, M. tuberculosis, Saccharomyces cerevisiae, T. gondii, and Solanum lycopersicum datasets, were collected.11,18 The redundant sequences were removed with a 30% identity cutoff using CD-HIT.26 Experimentally verified succinylated lysine residues were regarded as succinylated sites (ie, positive samples). All the remaining lysine residues that have not been verified as succinylated sites in these proteins were considered as negative samples (ie, nonsuccinylated sites). Each site was represented as a peptide segment of 2w+1 length with lysine in the center. Randomly selected nonsuccinylated sites were considered as negative samples based on an intuitive assumption.22,27
To construct a robust generic predictor, the training and independent dataset was compiled using the same methods described in our previous publication.18 A total of 124 proteins with 254 succinylated sites and 2,977 nonsuccinylated sites were obtained as an independent dataset in this study. The remaining 2,198 proteins containing 4,750 succinylated sites were utilized as positive training samples. From the whole negative samples 9,500 nonsuccinylated sites were randomly selected as negative training samples. In addition, for fair comparison with existing predictors, a new dataset containing 590 succinylated proteins was collected from the recently published articles.11–14 After removal of redundancy from the new dataset, 423 succinylation proteins containing 721 positive samples and 8,846 putative negative samples were obtained.
To assess the prediction performance on species-specific succinylated proteins, each of the seven datasets (ie, H. sapiens, M. musculus, E. coli, M. tuberculosis, S. cerevisiae, T. gondii, and S. lycopersicum) was divided into training and independent testing datasets. After removal of redundancy using CD-HIT,26 ~10% proteins were randomly chosen as the independent testing dataset. From the remaining proteins, a positive-to-negative sample ratio of 1:2 was randomly pooled as a training data. The statistics of both generic and species-specific succinylation datasets is shown in Table 1. All of these curated datasets can be downloaded at http://biocomputer.bio.cuhk.edu.hk/SuccinSite2.0/.
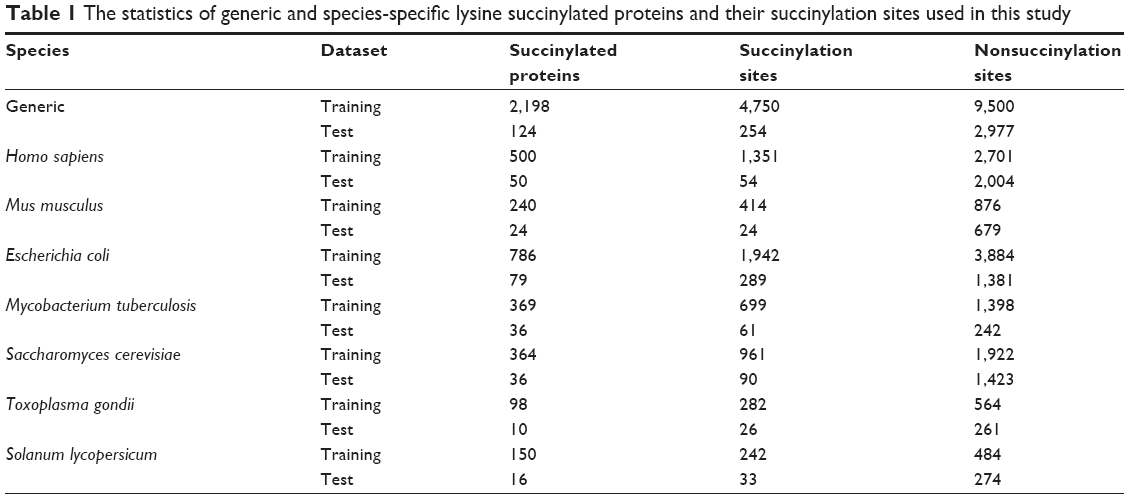 | Table 1 The statistics of generic and species-specific lysine succinylated proteins and their succinylation sites used in this study |
It should be mentioned that the 1:2 positive-to-negative ratios were controlled in both generic and species-specific classifiers for the training dataset test only. For the independent testing dataset, all the candidate positive and negative samples were retained to simulate the real situation. For the generic classifier, the training dataset was the same as used in our previously published article.18 The independent testing and new datasets were not combined to the final proposed generic and species-specific training models.
Sequence encoding strategy of pbCKSAAP
To conduct the pbCKSAAP encoding, each protein sequence was PSI-Blasted against Swiss-Prot nonredundant (NCBI NR90) database (version of December 2010) to generate a profile (ie, position-specific scoring matrix [PSSM]).22–24 To construct the PSSM of candidate sequences, the e-value cutoff and iteration times were set as 1.0×10⁻⁴ (−h 0.0001) and 3, respectively. For each residue, there were 20 PSSM score values indicating the occurrence probabilities for 20 amino acids. The pbCKSAAP was calculated from the PSSM using ri{k}rj, where, i, j=1, 2, ..., 20. For each value of k, (20×20) =400 features (AA, AC, AD... YY)400 were collected. If an amino acid pair ri{k}rj appears T times in the succinylation and nonsuccinylation fragments between the residue positions m and m+n+1 in the PSSM, the composition scores were calculated and normalized using the following equation:
|
|
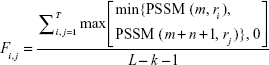
where PSSM (m, ri) denotes the score of amino acid ri at the mth row position of PSSM in ri{k}rj, and PSSM (m+n+1, rj) stands for the score of amino acid rj at the (m+n+1)th row position of PSSM in ri{k}rj. And L denotes the total length of candidate succinylation or nonsuccinylation fragment, that is, window size = L. When kmax=0, 1, 2, 3, and 4, the dimensionality of the output feature vectors will be 400, 800, 1,200, 1,600, and 2,000, respectively, for each of the succinylation or candidate nonsuccinylation sites. More details about the sequence encoding strategy of pbCKSAAP is available in our previous studies.22
Sequence encoding strategy for orthogonal binary features
To make a robust predictor, the orthogonal binary encoding was adopted in this study. In this encoding system, the 21 amino acids (including gap (-)) are represented by letters in alphabetic order such as ACDEFGHIKLMNPQRSTVWY. Each letter is represented by a 21-dimensional binary vector indicating the presence of a particular amino acid type.28 For making binary features, the rth amino acid having the binary code-word of 21 bits was set in rth position to “1” and all others to “0”s, for r=1, 2, ..., 21. For instance, in query proteins of amino acids, “Alanine” was represented as 1000000000000000000000 and “Cysteine” as 01000000000000000000, and so on. More details about the binary encoding system are available in the literature.18,28 In this work, based on the area under the receiver operating characteristics curve (AUC) value of generic prediction of succinylation sites, the optimum window size was set as 41. Therefore, (21×40) =840-dimensional feature vectors were calculated for orthogonal binary encoding.
Feature selection
For a prediction model, the challenge is how to select the specific features with a positive influence. In a given protein sequence, the conservative possessions vary from site to site, and as a result, the near central site residues make little contribution to the identification of PTM site.29,30 Our remedy of this problem is adopting a well-established feature dimensionality reduction method IG for optimizing the prediction results. A larger value of IG indicates a greater impact of the corresponding amino acid residues on the prediction performances. More information about the IG feature selection scheme is also available in the literature.25
Classification assessment
RF is an effective ensemble learning method for classification and has been widely used in protein bioinformatics research.18,20,31 In our study, the RF classifier was used to distinguish the succinylation and nonsuccinylation sites in the generic and species-specific models. The RF is operated by constructing a crowd of decision trees at the training stage and outputting the class that is the mode of the classification of the individual trees. Each tree gives a vote, and the forest chooses the proper classification using the selection of overall votes. The formulation of RF classifier is summarized as follows:
For j=1 to B
- Draw jth bootstrap sample of size N from the training dataset.
- Grow the jth RF tree Fj to the bootstrap data, by recursively repeating the following steps for each terminal node of the tree, until the minimum node size nmin is reached.
(i)
Select m feature variables at random from the p features.
(ii)
Pick the best feature among the m features.
(iii)
Split the node into two daughter nodes.
Output the ensemble of trees  . To make a prediction rule at a new point x, let
  be the class prediction of the jth RF tree. Then
 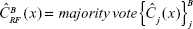 . To evaluate the model performance, the “Random_Forest” R package algorithm was implemented at https://cran.r-project.org/web/packages/randomForest/index.html.
Model evaluation and cross-validation
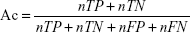
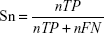
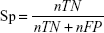
To evaluate the performance of SuccinSite2.0 predictor, fivefold cross-validation and large-scale independent tests were performed. In the cross-validation test, the training dataset was first divided into five approximately equal subgroups. For cross-validation among five groups, one subgroup was considered as the test set, and the other remaining four subgroups as the training set. The performances of fivefold results produced a single estimation by taking the average value and this procedure was repeated five times. Four widely used measurements were calculated to estimate the model’s performance, including accuracy (Ac), sensitivity (Sn), specificity (Sp), and Matthews correlation coefficient (MCC). The following formulas are used for calculating the Ac, Sn, Sp, and MCC.
|
|
|
|
|
|
|
|
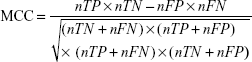
where nTP, nFP, nTN, and nFN represent the numbers of true positives (TP), false positives (FP), true negatives (TN), and false negatives (FN), respectively. Moreover, the receiver operating characteristics curve (ROC; Sn vs 1-Sp plot) was plotted for calculating the performance assessment. The AUC value was calculated by the pROC package in R software.32,33
Results and discussion
Analysis of the sequence-level specificity results
We first investigated the sequence patterns of the surrounding lysine succinylation sites for the curated data. A sequence logo was then plotted for the seven examined species, aiming to identify the surrounding sequence motifs that distinguish the succinylated sites from the nonsuccinylated sites (Figure 2).34 Graphical sequence from two sample logos was used to generate the position-specific residue compositions within the multiple sequence alignments. The heights in the amino acid sequence logos were scaled according to their statistical significance test (Student’s t-test by P<0.05). Apparently, for all the seven examined species, the primary features of the site specificity are located to the proximal in centered lysine succinylation site. It clearly showed a wide compositional amino acid difference for the position between succinylated and nonsuccinylated sites, especially for those located within the positions of approximately −20 to −1 and +1 to +20. For instance, “K” and “R” residues are most enriched in H. sapiens, M. musculus, and E. coli, where “K” tends to appear across all positions following the centered succinylation site (Figure 2). Residue “Q” is most enriched in T. gondii species sequence, whereas the “S” residue is significantly depleted in M. tuberculosis and S. lycopersicum. Interestingly, the enriched residues diverse at position +1 for all the seven species. For H. sapiens, M. musculus, S. cerevisiae, and E. coli sequence, the main residue is “D,” whereas for M. tuberculosis, T. gondii, and S. lycopersicum, the residues are “P,” “Q,” and “N,” respectively (Figure 2). These results revealed the significance of sequence patterning in the surrounding succinylation sites, and highlight the necessity to develop species-specific predictor for precise lysine succinylation site recognition.
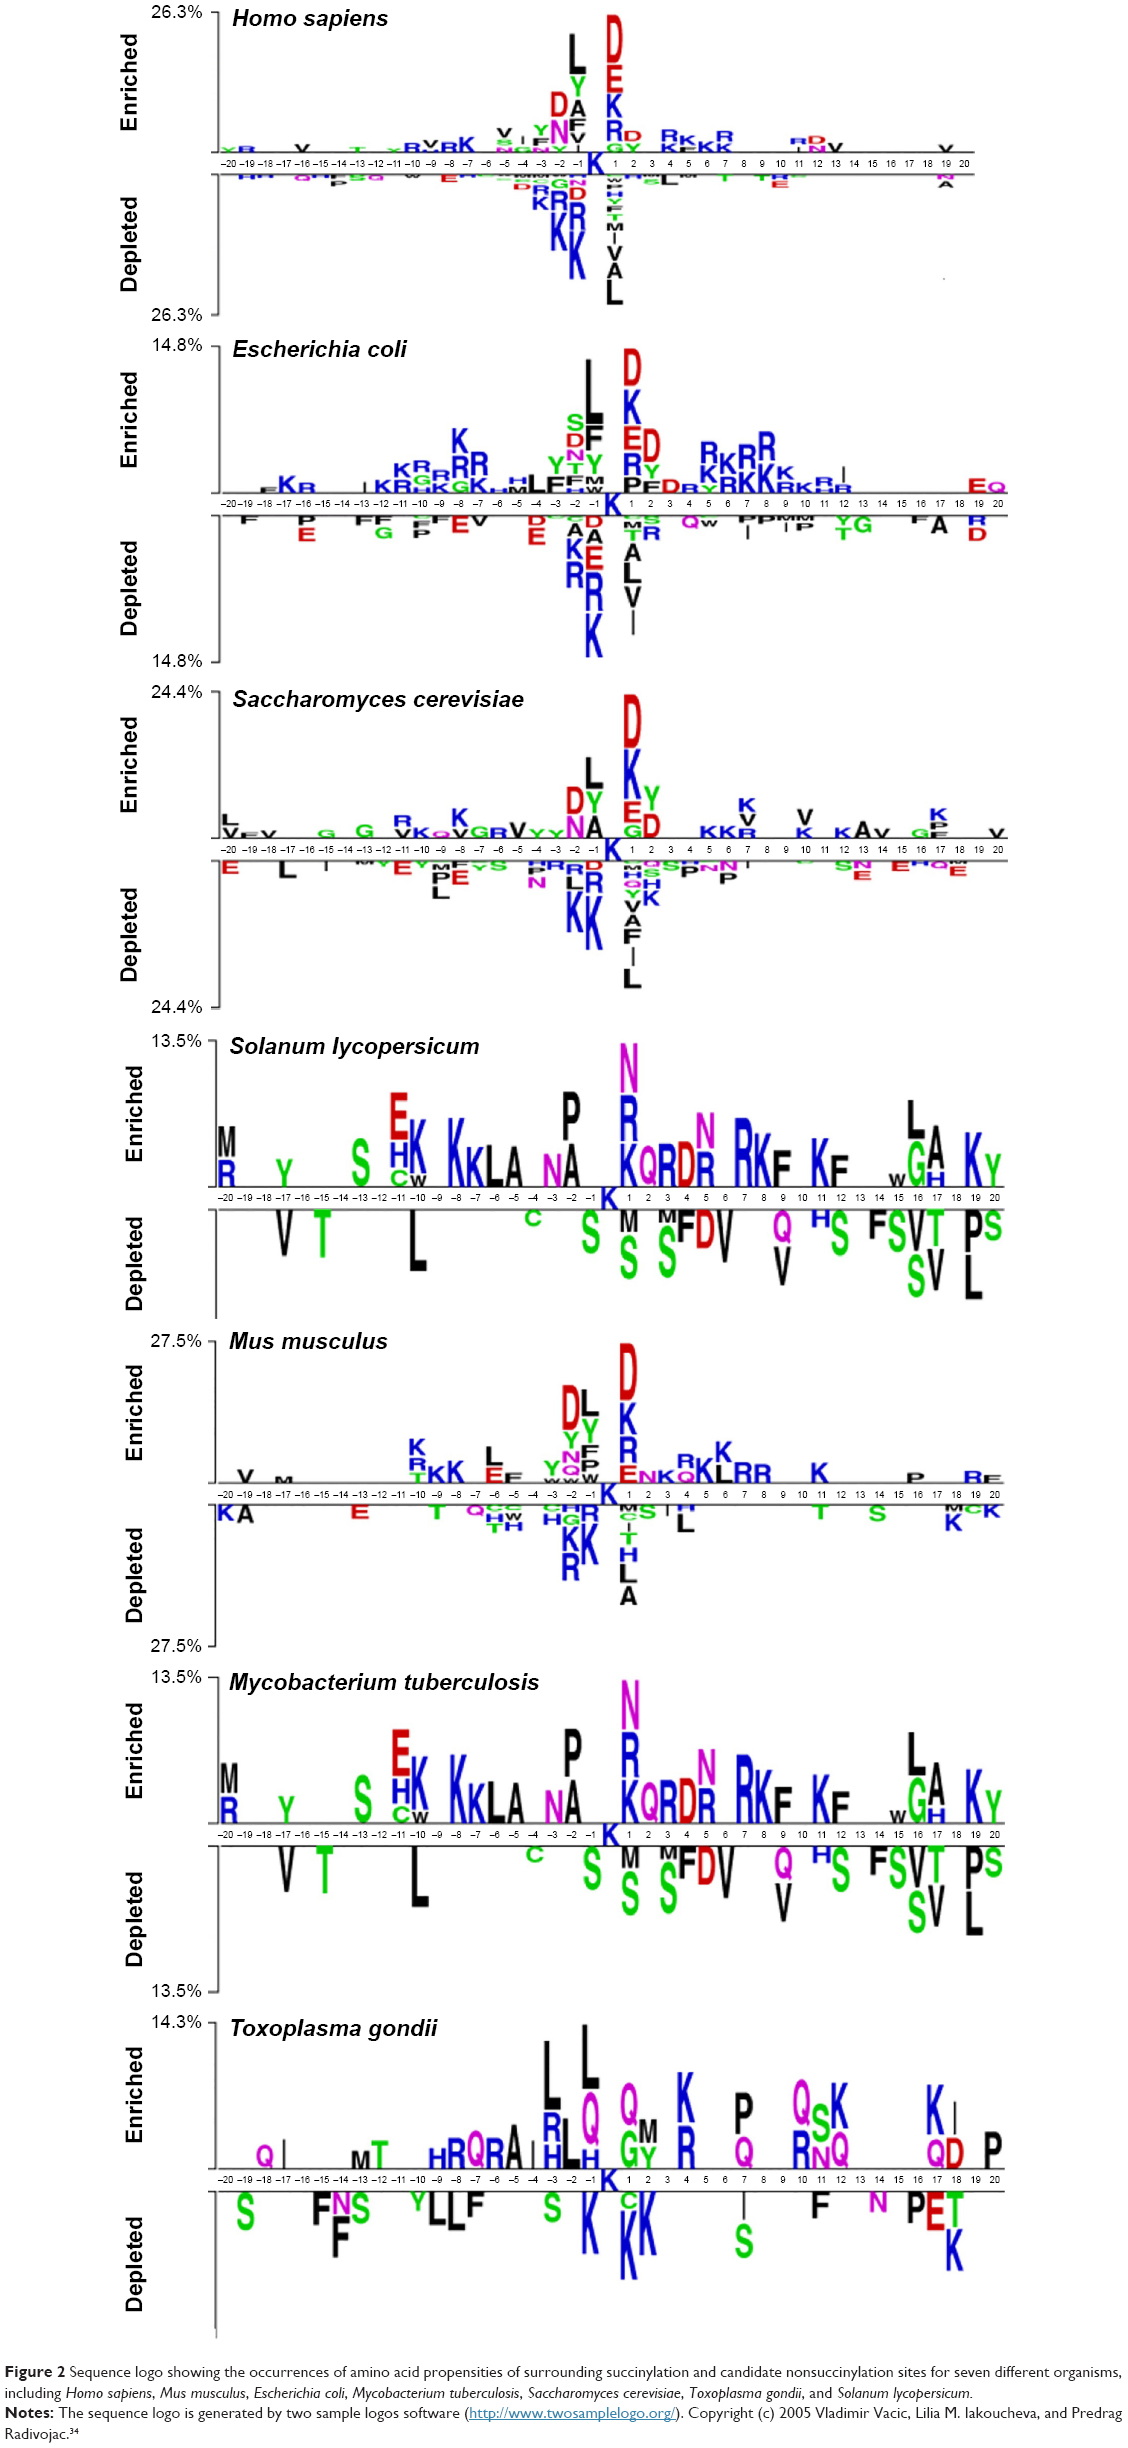 | Figure 2 Sequence logo showing the occurrences of amino acid propensities of surrounding succinylation and candidate nonsuccinylation sites for seven different organisms, including Homo sapiens, Mus musculus, Escherichia coli, Mycobacterium tuberculosis, Saccharomyces cerevisiae, Toxoplasma gondii, and Solanum lycopersicum. |
Secondly, we performed chi-square statistical test to identify the amino acids different in the succinylation sequences of the seven examined species. For the seven species including H. sapiens, M. musculus, E. coli, M. tuberculosis, S. cerevisiae, T. gondii, and S. lycopersicum, the total number of collected succinylated sites were 1,405, 438, 2,231, 760, 1,051, 308, and 275, respectively. For each species, the occurrences of amino acid residues at different window positions (approximately −5 to +5) with P-values were calculated and corrected (Bonferroni) (Table S1). For most of the amino acid frequencies at each window position, P-values were lower than 0.01/n (where n is the number of tests performed, representing the number of occurrences of each amino acid) according to the Bonferroni correction, indicating that the amino acids of the seven species-specific succinylation sequences are potentially significantly different. In Table S1, the most significantly different amino acid features were “H,” “K,” and “R.” We found that, at −3 and +4 sequence fragment positions, the percentages of “K,” “R,” and “H” amino acid features were much higher in E. coli, M. tuberculosis, and T. gondii than other species. This result showed that in E. coli, M. tuberculosis, and T. gondii, positively charged amino acids, that is, “K,” “R,” and “H,” at −3 and +4 positions of the succinylated sequences are preferred. Nonetheless, the highest proportions of “K,” “R,” and “H” amino acids were found at positions −1 and +3 for H. sapiens, M. musculus, and S. cerevisiae species.
Finally, we investigated the average PSSM score (APS) for each residue surrounding succinylated and nonsuccinylated sites for different species. The evolutionary conservation information of APS between succinylated and nonsuccinylated sites is illustrated in Figure 3. As shown, some adjacent amino acid positions of surrounding succinylated sites are of significantly higher scores, especially in H. sapiens, S. cerevisiae, and S. lycopersicum species (Figure 3). The PSSM scores suggest that succinylated sites tend to be more conserved than the nonsuccinylated sites. Moreover, a nonparametric Kruskal–Wallis test was carried out to detect whether positive and negative samples were significantly different. P-values were calculated and corrected (Bonferroni) from PSSM score matrix in the corresponding amino acid positions of surrounding succinylated and nonsuccinylated fragments for the seven examined species (Table S2). Significantly different profiles were observed at some positions of surrounding succinylation sites for the seven species, that is, P-value <0.05 (Table S2). Taken together, these findings support the plausible sequence basis for species-specific succinylation sites.
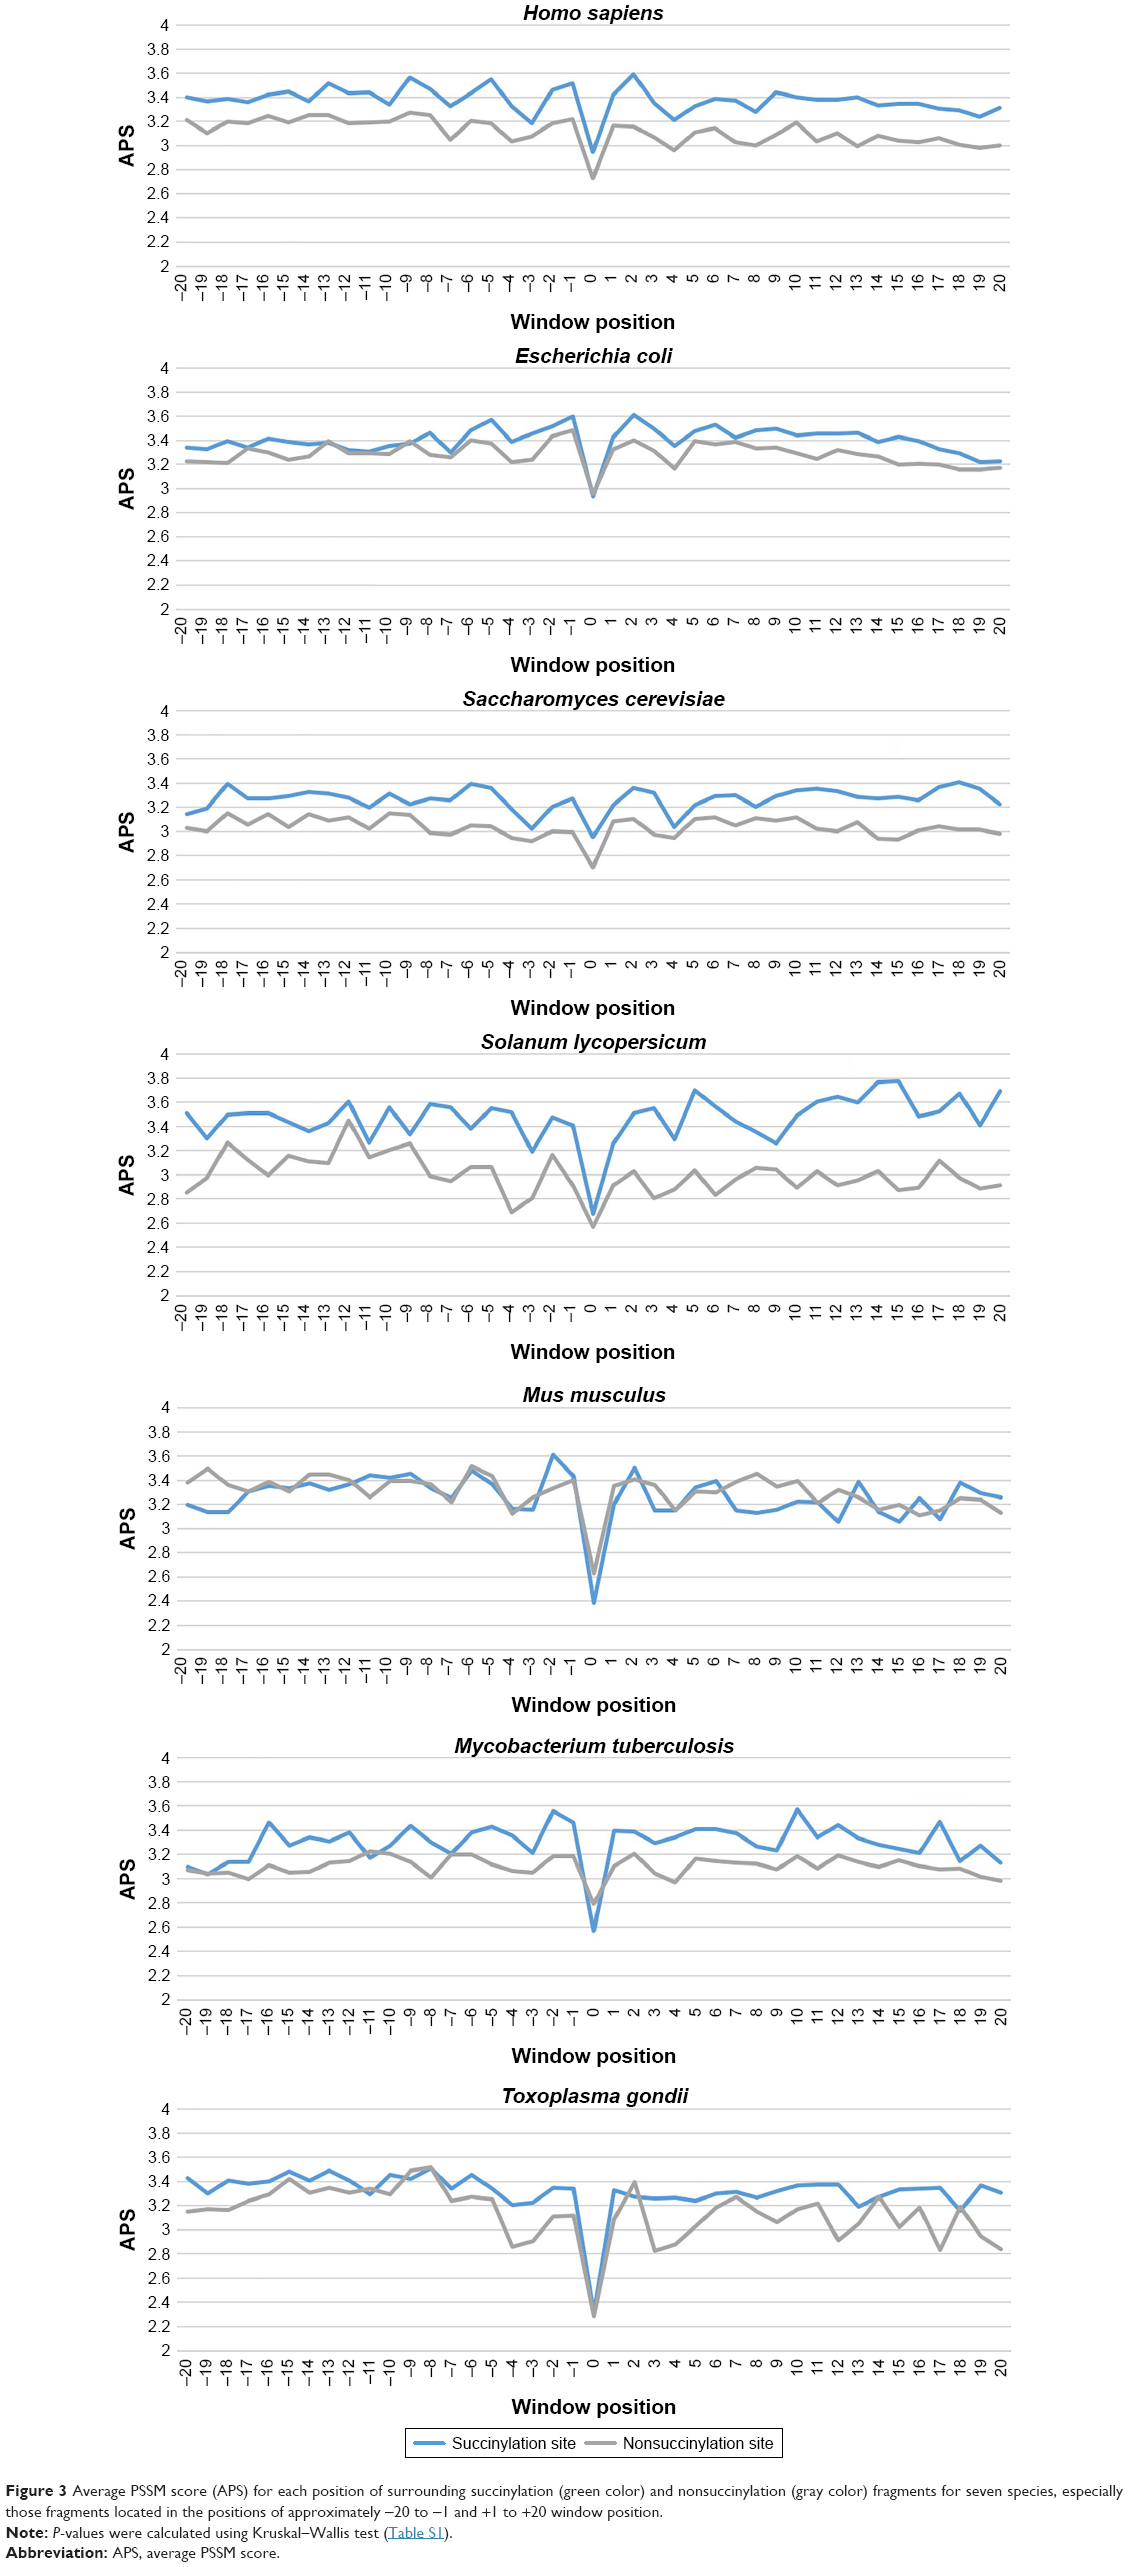 | Figure 3 Average PSSM score (APS) for each position of surrounding succinylation (green color) and nonsuccinylation (gray color) fragments for seven species, especially those fragments located in the positions of approximately −20 to −1 and +1 to +20 window position. |
Prediction performance of generic SuccinSite2.0 predictor
For predicting generic succinylation site, a sub-dataset of succinylated protein was retained as an independent dataset (the same as in our previous study18), and the other dataset containing 1:2 positive-to-negative ratio (succinylated vs nonsuccinylated) was used as training data to train a prediction model (Materials and methods). To evaluate the performance of “SuccinSite2.0” for generic succinylation site prediction, we carried out a fivefold cross-validation test. Then, the sequence fragments were encoded as numerical vectors by using the pbCKSAAP and orthogonal binary encoding schemes. The proposed predictor SuccinSite2.0 was established with the combined scores of RF classifier. The optimal decision trees were grown based on the fivefold cross-validation through the training dataset. It is well known that some feature vectors may be contaminated and possibly cause biased prediction.25 Therefore, to improve the performance of the trained model, it is generally necessary to reduce the dimensionality for optimizing incorporative features. The IG feature selection method was applied to select the valuable dimension feature vectors from the high-dimensional pbCKSAAP scheme (based on the IG theories, a higher score of IG means a more valuable vector).25 Then, we selected the top 300 IG features from the pbCKSAAP scheme and reconstituted it into a newly ordered feature based on low to high IG score. In the orthogonal binary encoding, all the corresponding features were used.
As observed from Table S3, the generic predictor SuccinSite2.0 showed performance index of Ac =77.58%, Sn =53.31%, Sp =89.72%, and MCC =47.12% for the training test. For independent test, the performance of SuccinSite2.0 was also found effective and reasonable compared with the existing tools (Table 2). Meanwhile, a plot of ROC curve is presented in Figure S1. The highest AUC value of the generic predictor SuccinSite2.0 peaked at 0.829 and 0.754 for training and independent test dataset, respectively. The performance of the generic SuccinSite2.0 predictor is thus eminently stable for prediction of succinylation site in both training and independent datasets.
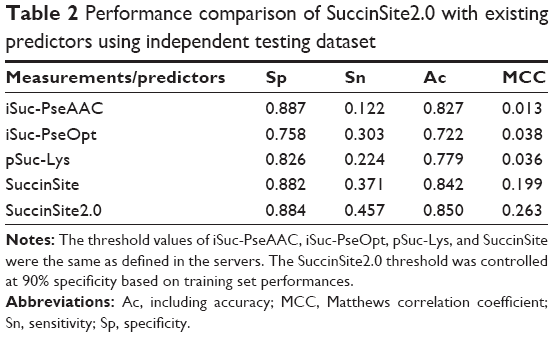 | Table 2 Performance comparison of SuccinSite2.0 with existing predictors using independent testing dataset |
The optimal window size was determined based on the combined AUC values for generic succinylation site prediction. For given peptides with window size of 2w+1, w varies from 13 to 45 on the combined performances of succinylation sequences (Figure S2). Then, the RF models were built and fivefold cross-validation tests were carried out. The model with a window size of 41 was found optimal for identification of succinylated sites.
Performance comparison with other existing generic tools using independent dataset
An independent test was conducted to compare the performance of SuccinSite2.0 with that of other previously published predictors, including iSuc-PseAAC,16 iSuc-PseOpt,19 pSuc-Lys,20 SucStruct,21 and our previous predictor SuccinSite.18 It should be noted that when we submitted the query sequence to the servers such as SucPred15 and SuccFind,17 they were no longer functional. The SucStruct21 has not established any available online implementation. These three implementations were, therefore, not compared. As all of these existing predictors employed different training datasets, an independent dataset was collected for a fair evaluation. Our proposed SuccinSite2.0 achieved the best performance among all the five models with a performance index of Sp =0.884, Sn =0.457, Ac =0.850, and MCC =0.263 (Table 2). Our previously developed predictor SuccinSite (Sp =0.882, Sn =0.371, Ac =0.842, and MCC =0.199) also outperformed the other three predictors including iSuc-PseAAC (Sp =0.887, Sn =0.122, Ac =0.827, and MCC=0.013), iSuc-PseOpt (Sp =0.758, Sn =0.303, Ac =0.722, and MCC =0.038), and pSuc-Lys (Sp =0.826, Sn =0.224, Ac =0.779, and MCC =0.036). Thus, it is anticipated that SuccinSite2.0 is a much more concise and powerful predictor for predicting succinylation sites.
A performance comparison with the existing predictors using the new dataset
To further evaluate the performance of SuccinSite2.0, we collected the new datasets from the recently published articles11–14 and submitted these datasets to all of the existing servers for comparison (Materials and methods section in this article). The performances from different models are summarized in Table 3. As shown, SuccinSite2.0 achieved better or at least competitive performances for this new dataset (Table 3) compared to other predictors.
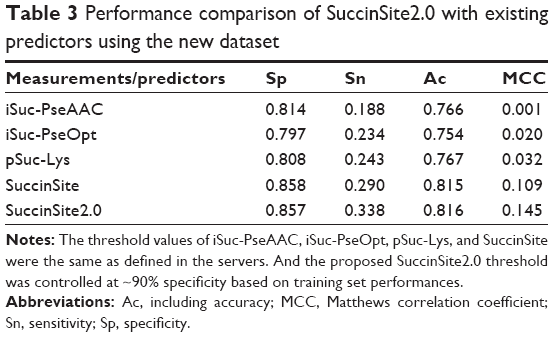 | Table 3 Performance comparison of SuccinSite2.0 with existing predictors using the new dataset |
Interestingly, SuccinSite2.0 and other existing predictors showed significantly lower performance on a new dataset collected from the plant and human pathogen species.11–14 The possible reason is that the sequence patterns of surrounding succinylation sites might not be the same across different species, and all of the existing predictors were trained by the datasets obtained from bacterial and mammalian cells, while the new test dataset was collected from the plant and human pathogen species. This analysis highlights the necessity of developing species-specific computational classifiers to improve the performances of lysine succinylation sites prediction.
Species-specific prediction of protein succinylation site
To assess the performance of SuccinSite2.0 in species-specific succinylation site prediction, each of the seven datasets were divided into training and independent testing datasets (Materials and methods). First, to evaluate the performance on the training dataset, a fivefold cross-validation test was applied in each species, combining two consecutive encoding features, that is, pbCKSAAP and orthogonal binary. The sensitivity at different specificity levels in each cross-validation was calculated. We then depicted the ROC curves using different thresholds, and calculated the AUC values. Without feature selection, the respective AUC values for the seven models (H. sapiens, M. musculus, E. coli, M. tuberculosis, S. cerevisiae, T. gondii, and S. lycopersicum) are 0.833, 0.811, 0.774, 0.698, 0.876, 0.825, and 0.813, respectively (Figure S3).
Secondly, we continued to evaluate the individual contribution of different species-specific features. In the fivefold cross-validation test, the optimum features were collected from the high-dimensional pbCKSAAP using IG method. Specifically, the top 280, 440, 470, 230, 260, 300, and 190 feature vectors were collected from H. sapiens, M. musculus, E. coli, M. tuberculosis, S. cerevisiae, T. gondi, and S. lycopersicum species, respectively. These optimum feature vectors were reconstituted into a newly ordered feature based on low to high IG score. In the binary encoding scheme, all the corresponding features were used. Furthermore, the top 20 amino acid pairs were collected by the IG feature selection method for the seven species, aiming to investigate the most significant residues and positions of surrounding succinylated and nonsuccinylated sites. The top 20 residue scores and their corresponding pairs are listed in Table S4. For instance, the feature “S×K” is represented by one-spaced residue (any amino acid) pair of “SK,” where “×” stands for any amino acid. The same representation applies to other k-spaced residue pairs. In the seven species, that is, H. sapiens, M. musculus, E. coli, M. tuberculosis, S. cerevisiae, T. gondii, and S. lycopersicum, the most important amino acid pairs were “IK,” “S×K,” “R××L,” “K××D,” “I××P,” “A×××V,” and “RD,” respectively, representing the most enriched motif of surrounding succinylation proteins. Interestingly, H. sapiens, M. musculus, M. tuberculosis, and T. gondii contain charged residues such as “K,” “R,” “H,” “E,” and “D” in most of the important features (Table S4). These charged residues may play a key role in the recognition of succinylated sites. We also observed that amino acid pairs with all possible k-spaces such as (“,” “×,” “××,” “×××,” “××××”) were included in the most significant features for the seven species-specific models (Table S4). This suggests that all spaced amino acid pairs are necessary and together they make a collective contribution to the prediction of succinylation proteins.
After feature selection, we evaluated the prediction performance of the SuccinSite2.0 based on the final species-specific optimal features, using fivefold cross-validation tests. The performance of the combined model on the training test achieved the AUC values of 0.844, 0.818, 0.779, 0.701, 0.904, 0.830, and 0.824, for H. sapiens, M. musculus, E. coli, M. tuberculosis, S. cerevisiae, T. gondii, and S. lycopersicum, respectively (Figure 4A). Using the ROC curves, we showed that those models have good predictions confidence with high specificities, especially for H. sapiens and S. cerevisiae models. At the specificity level of 90%, the prediction sensitivities reached 51.52% and 65.50%, respectively (Table S3).
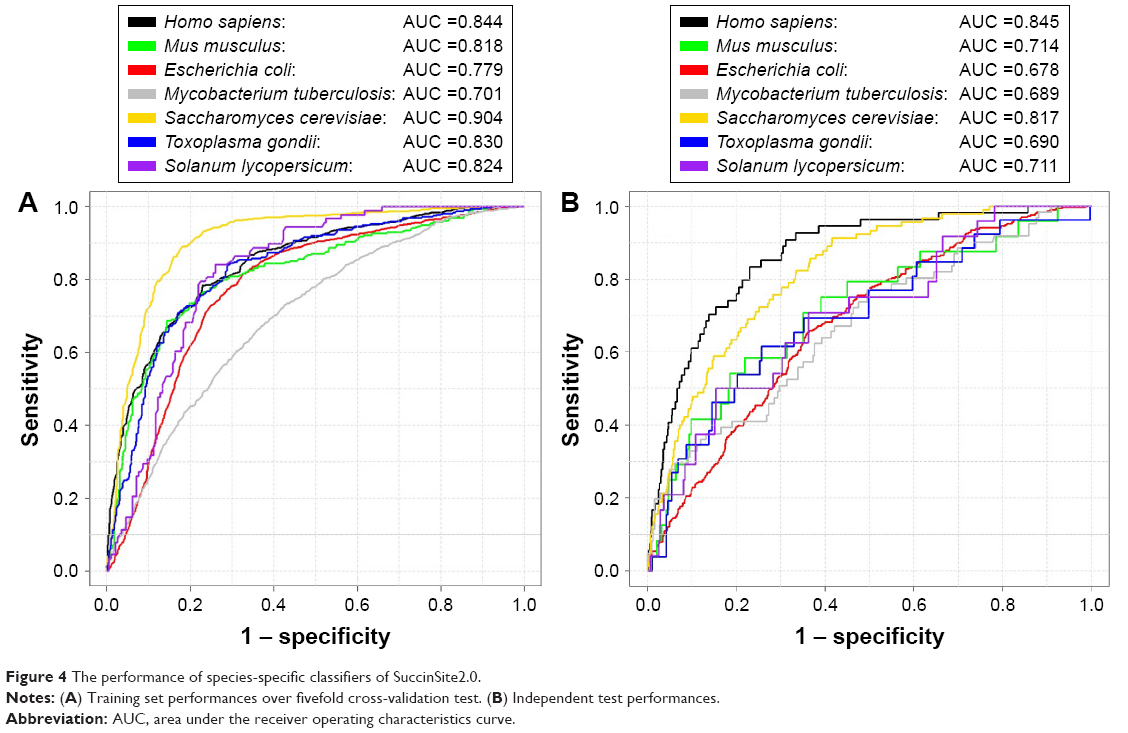 | Figure 4 The performance of species-specific classifiers of SuccinSite2.0. |
Finally, we accessed the independent testing dataset for the seven species-specific models. The full description of each independent set is summarized in the data preparation section (Materials and methods). The independent test yielded AUC values of 0.845, 0.714, 0.678, 0.689, 0.817, 0.690, and 0.711, respectively, for H. sapiens, M. musculus, E. coli, M. tuberculosis, S. cerevisiae, T. gondii, and S. lycopersicum species (Figure 4B). We found that the species-specific classifiers obtained good prediction performances for testing the independent dataset compared with each species of the training models. Thus, the proposed species-specific classifiers may provide helpful guidance to hypothesis-driven experimental studies on new succinylation sites.
Cross-species prediction performance
We further evaluated the cross-species performance for each of the seven models by testing them on all other species, to investigate whether each of the species-specific models gives the best performance for its original species. As summarized in Table 4, when applied to predict the candidate succinylation sites for different species, the original model consistently performed the best except for M. tuberculosis (Table 4). For instance, an AUC score of 0.844 was achieved in the H. sapiens specific model. In contrast, lower AUC scores of 0.702–0.821 were obtained in a cross-prediction of H. sapiens with the other six species (Table 4). It is intriguing that the contribution of functional features became marginal in M. tuberculosis. Whether this is due to the effect of protein sample collection from a wide range of species containing both succinylated and candidate nonsuccinylated sites still needs further investigation. Furthermore, the sequence patterns of the surrounding succinylation sites might not be the same across different species, that is, there may exist species-specific sequence patterns for the succinylation site, similar to other types of PTM such as lysine acetylation.31
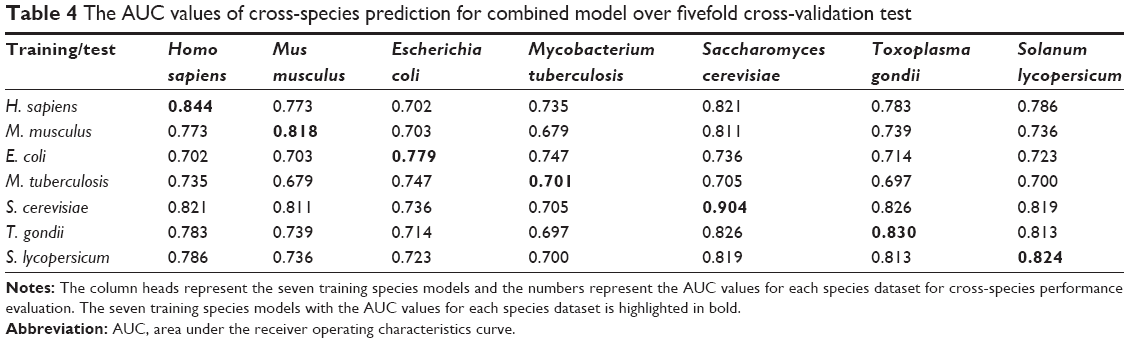 | Table 4 The AUC values of cross-species prediction for combined model over fivefold cross-validation test |
In addition, the cross-species performance was tested by independent testing datasets. The performance index is summarized in Table S5. Similarly, the model consistently performed the best when being applied to predict succinylation sites for the species of origin. For instance, H. sapiens specific model achieved AUC values of 0.845. In contrast, it achieved lower AUC scores of 0.679–0.805 in the other six species (Table S5). To improve the prediction of lysine succinylation sites, the above results also justify the prerequisite of developing the species-specific computational tools.
Web-server implementation
A web server of SuccinSite2.0 (succinylation site predictor) was made available at http://biocomputer.bio.cuhk.edu.hk/SuccinSite2.0/ to the research community. The online tool was implemented with Perl language, CGI scripts, HTML, and PHP. The input and output web pages of the server are shown in Figure S4. Users can submit their query sequence directly by pasting it into the text box or by browsing their own file. After query sequence submission, the server will generate the sequential feature vectors. The sequence similarity of the peptide with those in the reference set that categorizes positive and negative sites will be compared with the assistance of the RF classifier. Finally, the server will return the prediction result in the output webpage, which consists of the job ID and the query protein name, lysine fragment position, RF score, and the justification of the predicted succinylation sites.
Conclusions
In this work, we presented an efficient computational model SuccinSite2.0 for lysine succinylation sites prediction. We demonstrated that both generic and species-specific version of this model gave good prediction performance, and the SuccinSite2.0 also achieved a competitive performance compared with several existing methods for both independent and new datasets. Moreover, we carried out a feature selection analysis to optimize our prediction results. Finally, a user-friendly generic and species-specific succinylation site prediction web server was implemented for the research community (http://biocomputer.bio.cuhk.edu.hk/SuccinSite2.0/).
Acknowledgments
We are grateful to Dr Yuan Zhou in Peking University, China, for helpful discussion regarding this project. This work was funded by a grant from Shenzhen Science and Technology Committee (grant no JCYJ20140425184428456), and partially by a grant from Hong Kong Research Grand Council (project no CUHK3/CRF/11G).
Author contributions
MMH and DG conceived and designed the study. MMH and MSK collected data and performed the analyses. MMH, MNHM, CY, and DG wrote the manuscript. All authors discussed the prediction results and commented on the manuscript. All authors contributed toward data analysis, drafting and revising the paper and agree to be accountable for all aspects of the work.
Disclosure
The authors report no conflicts of interest in this work.
References
Weinert BT, Scholz C, Wagner SA, et al. Lysine succinylation is a frequently occurring modification in prokaryotes and eukaryotes and extensively overlaps with acetylation. Cell Rep. 2013;4(4):842–851. | ||
Xie Z, Dai J, Dai L, et al. Lysine succinylation and lysine malonylation in histones. Mol Cell Proteomics. 2012;11(5):100–107. | ||
Tan M, Peng C, Anderson KA, et al. Lysine glutarylation is a protein posttranslational modification regulated by SIRT5. Cell Metab. 2014;19(4):605–617. | ||
Zhang Z, Tan M, Xie Z, Dai L, Chen Y, Zhao Y. Identification of lysine succinylation as a new post-translational modification. Nat Chem Biol. 2011;7(1):58–63. | ||
Rosen R, Becher D, Buttner K, Biran D, Hecker M, Ron EZ. Probing the active site of homoserine trans-succinylase. FEBS Lett. 2004;577(3):386–392. | ||
Park J, Chen Y, Tishkoff DX, et al. SIRT5-mediated lysine desuccinylation impacts diverse metabolic pathways. Mol Cell. 2013;50(6):919–930. | ||
Du J, Zhou Y, Su X, et al. Sirt5 is a NAD-dependent protein lysine demalonylase and desuccinylase. Science. 2011;334(6057):806–809. | ||
Colak G, Xie Z, Zhu AY, et al. Identification of lysine succinylation substrates and the succinylation regulatory enzyme CobB in Escherichia coli. Mol Cell Proteomics. 2013;12(12):3509–3520. | ||
Li X, Hu X, Wan Y, et al. Systematic identification of the lysine succinylation in the protozoan parasite Toxoplasma gondii. J Proteome Res. 2014;13(12):6087–6095. | ||
Yang M, Wang Y, Chen Y, et al. Succinylome analysis reveals the involvement of lysine succinylation in metabolism in pathogenic Mycobacterium tuberculosis. Mol Cell Proteomics. 2015;14(4):796–811. | ||
Jin W, Wu F. Proteome-wide identification of lysine succinylation in the proteins of tomato (Solanum lycopersicum). PLoS one. 2016;11(2):e0147586. | ||
Xie L, Li J, Deng W, et al. Proteomic analysis of lysine succinylation of the human pathogen Histoplasma capsulatum. J Proteomics. 2017;154:109–117. | ||
Zhang Y, Wang G, Song L, et al. Global analysis of protein lysine succinylation profiles in common wheat. BMC Genomics. 2017;18(1):309. | ||
Song Y, Wang J, Cheng Z, et al. Quantitative global proteome and lysine succinylome analyses provide insights into metabolic regulation and lymph node metastasis in gastric cancer. Sci Rep. 2017;7:42053. | ||
Zhao X, Ning Q, Chai H, Ma Z. Accurate in silico identification of protein succinylation sites using an iterative semi-supervised learning technique. J Theor Biol. 2015;374:60–65. | ||
Xu Y, Ding YX, Ding J, Lei YH, Wu LY, Deng NY. iSuc-PseAAC: predicting lysine succinylation in proteins by incorporating peptide position-specific propensity. Sci Rep. 2015;5:10184. | ||
Xu HD, Shi SP, Wen PP, Qiu JD. SuccFind: a novel succinylation sites online prediction tool via enhanced characteristic strategy. Bioinformatics. 2015;31(23):3748–3750. | ||
Hasan MM, Yang S, Zhou Y, Mollah MN. SuccinSite: a computational tool for the prediction of protein succinylation sites by exploiting the amino acid patterns and properties. Mol Biosyst. 2016;12(3):786–795. | ||
Jia J, Liu Z, Xiao X, Liu B, Chou KC. iSuc-PseOpt: identifying lysine succinylation sites in proteins by incorporating sequence-coupling effects into pseudo components and optimizing imbalanced training dataset. Anal Biochem. 2016;497:48–56. | ||
Jia J, Liu Z, Xiao X, Liu B, Chou KC. pSuc-Lys: predict lysine succinylation sites in proteins with PseAAC and ensemble random forest approach. J Theor Biol. 2016;394:223–230. | ||
Lopez Y, Dehzangi A, Lal SP, et al. SucStruct: prediction of succinylated lysine residues by using structural properties of amino acids. Anal Biochem. 2017;527:24–32. | ||
Hasan MM, Zhou Y, Lu X, Li J, Song J, Zhang Z. Computational identification of protein pupylation sites by using profile-based composition of k-spaced amino acid pairs. PLoS One. 2015;10(6):e0129635. | ||
Dong X, Zhang YJ, Zhang Z. Using weakly conserved motifs hidden in secretion signals to identify type-III effectors from bacterial pathogen genomes. PLoS One. 2013;8(2):e56632. | ||
Chen K, Jiang Y, Du L, Kurgan L. Prediction of integral membrane protein type by collocated hydrophobic amino acid pairs. J Comput Chem. 2009;30(1):163–172. | ||
Wen PP, Shi SP, Xu HD, Wang LN, Qiu JD. Accurate in silico prediction of species-specific methylation sites based on information gain feature optimization. Bioinformatics. 2016;32(20):3107–3115. | ||
Huang Y, Niu B, Gao Y, Fu L, Li W. CD-HIT Suite: a web server for clustering and comparing biological sequences. Bioinformatics. 2010;26(5):680–682. | ||
Radivojac P, Vacic V, Haynes C, et al. Identification, analysis, and prediction of protein ubiquitination sites. Proteins. 2010;78(2):365–380. | ||
Yoo PD, Ho YS, Zhou BB, Zomaya AY. SiteSeek: post-translational modification analysis using adaptive locality-effective kernel methods and new profiles. BMC Bioinformatics. 2008;9:272. | ||
Weinert BT, Wagner SA, Horn H, et al. Proteome-wide mapping of the Drosophila acetylome demonstrates a high degree of conservation of lysine acetylation. Sci Signal. 2011;4(183):ra48. | ||
Chen YZ, Tang YR, Sheng ZY, Zhang Z. Prediction of mucin-type O-glycosylation sites in mammalian proteins using the composition of k-spaced amino acid pairs. BMC Bioinformatics. 2008;9:101. | ||
Li Y, Wang M, Wang H, et al. Accurate in silico identification of species-specific acetylation sites by integrating protein sequence-derived and functional features. Sci Rep. 2014;4:5765. | ||
Gribskov M, Robinson NL. Use of receiver operating characteristic (ROC) analysis to evaluate sequence matching. Comput Chem. 1996;20(1):25–33. | ||
Centor RM. Signal detectability: the use of Roc curves and their Analyses. Med Decis Making. 1991;11(2):102–106. | ||
Vacic V, Iakoucheva LM, Radivojac P. Two sample logo: a graphical representation of the differences between two sets of sequence alignments. Bioinformatics. 2006;22(12):1536–1537. |
 © 2017 The Author(s). This work is published and licensed by Dove Medical Press Limited. The full terms of this license are available at https://www.dovepress.com/terms.php and incorporate the Creative Commons Attribution - Non Commercial (unported, v3.0) License.
By accessing the work you hereby accept the Terms. Non-commercial uses of the work are permitted without any further permission from Dove Medical Press Limited, provided the work is properly attributed. For permission for commercial use of this work, please see paragraphs 4.2 and 5 of our Terms.
© 2017 The Author(s). This work is published and licensed by Dove Medical Press Limited. The full terms of this license are available at https://www.dovepress.com/terms.php and incorporate the Creative Commons Attribution - Non Commercial (unported, v3.0) License.
By accessing the work you hereby accept the Terms. Non-commercial uses of the work are permitted without any further permission from Dove Medical Press Limited, provided the work is properly attributed. For permission for commercial use of this work, please see paragraphs 4.2 and 5 of our Terms.