")
Back to Journals » Patient Preference and Adherence » Volume 10
A socioeconomic and behavioral survey of patients with difficult-to-control type 2 diabetes mellitus reveals an association between diabetic retinopathy and educational attainment
Authors Emoto N , Okajima F , Sugihara H, Goto R
Received 1 July 2016
Accepted for publication 27 September 2016
Published 25 October 2016 Volume 2016:10 Pages 2151—2162
DOI https://doi.org/10.2147/PPA.S116198
Checked for plagiarism Yes
Review by Single anonymous peer review
Peer reviewer comments 2
Editor who approved publication: Dr Johnny Chen
Naoya Emoto,1,2 Fumitaka Okajima,1,2 Hitoshi Sugihara,2 Rei Goto3
1Department of Endocrinology, Nippon Medical School Chiba-Hokusoh Hospital, Chiba, 2Department of Endocrinology, Diabetes and Metabolism, Graduate School of Medicine, Nippon Medical School, Tokyo, 3Graduate School of Business Administration, Keio University, Kanagawa, Japan
Background: We have recently reported that the attitude of patients toward risk could be a factor in the progression of diabetic complications. In general, risk preference is closely related to socioeconomic status (SES), which includes factors such as age, sex, income, and educational attainment.
Objective: We aimed to determine the effect of SES and behavioral propensity on the progress of diabetic complications in patients with type 2 diabetes mellitus (T2DM).
Methods: We conducted a survey of 238 patients with difficult-to-control T2DM treated at a hospital in Japan using a modified behavioral economics questionnaire that included questions related to SES. The patients had been referred by general practitioners or other departments in the hospital because of poor metabolic control or unstable complications.
Results: Educational attainment was significantly associated with progression of retinopathy in patients <65 years of age. Educational attainment of a high school diploma (12 years of education) or lower was a significant risk factor, but there were no differences among levels of attainment beyond high school (13–16 years or more of education). Behavioral propensities were also weakly associated with complications, but not as much as educational attainment. Personal income level and economic status did not show an association with the retinopathy levels.
Conclusion: Lower educational attainment is a strong risk factor for diabetic retinopathy, and it is independent of the economic status. The result suggests that cognitive function may play an important role in the progression of diabetic retinopathy in patients with T2DM.
Keywords: behavioral economics, cognitive function, diabetic nephropathy, economic status, income
Introduction
The standard treatment for type 2 diabetes mellitus (T2DM) is dietary therapy and appropriate exercise, followed by the sequential addition of oral antihyperglycemic agents, glucagon-like peptide-1 receptor agonists, or insulin injection (basal and/or mealtime).1 Large prospective clinical studies have shown a strong relationship between hyperglycemia and diabetic microvascular complications in both type 1 diabetes mellitus (T1DM) and T2DM.2,3 However, modification of lifestyle habits, as well as adherence to pharmacological treatment, proves to be challenging in many patients.4,5 It remains unclear why many patients with diabetes cannot make the necessary lifestyle changes and cannot adhere to pharmacological treatment, both of which are clearly beneficial for their future health.
The theory of neuroeconomics, an emerging field of study focusing on anomalies in the classical economics rationale, can provide important clues for understanding unreasonable human behavior regarding decisions over outcomes that occur at different time points.6,7 Neuroeconomic studies have demonstrated that humans and animals prefer rewards available to them in the short term over rewards only available in the long term. Recently, we reported a behavioral economics survey of patients with difficult-to-control T1DM or T2DM.8 The patients’ attitude to risk was estimated by the pricing of hypothetical lotteries; such questions are closely related to socioeconomic status (SES), a combined measure that includes factors such as age, sex, income, and educational levels.9 The results suggested that the attitude of patients toward risk could be a factor in the progression of diabetic complications. However, in that study, we could not differentiate between patients who were risk-seeking and those with low literacy proficiency.
SES has been reported to have a serious impact on the prevalence of T1DM and T2DM as well as associated complications and mortality in every major ethnic group worldwide.10–16 In order to determine the effect of SES and behavioral economics propensity on the progress of diabetic complications, in the present study, we conducted a survey among patients with diabetes using modified behavioral economics questionnaires, including those related to SES.
Methods
Participants
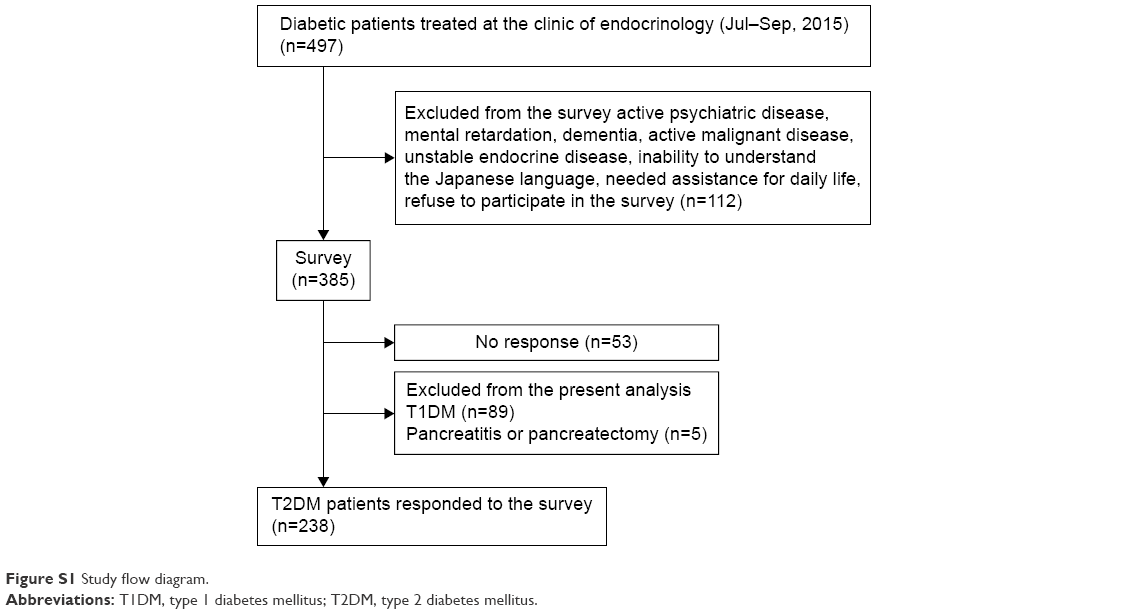
This study initially included every patient (497 in total) with diabetes treated by two endocrinologists at the outpatient clinic of endocrinology at the Nippon Medical School Chiba-Hokusoh Hospital from July to September 2015 (Figure S1). The hospital is one of the three base hospitals in a locality with a population of 700,000 that consists of several cities, towns, and villages near to metropolitan Tokyo, Japan. The clinic provides care to patients with diabetes referred by general practitioners or other departments in the hospital because the diabetes was difficult to control due to poor metabolic control or unstable complications. Of the 497 patients, 112 were excluded because of active psychiatric disease, mental retardation, dementia, active malignant disease, unstable endocrine disease, or inability to understand the Japanese language, or because they needed assistance for daily life or refused to participate in the survey. This left 385 patients eligible to participate. The patients defined as having T1DM (89 patients) were those with acute onset of insulin-dependent diabetes or who had positive anti-glutamic acid decarboxylase or anti-islet antigen-2 antibodies. All other patients, except those with pancreatitis or total pancreatectomy (5 patients), were defined as having T2DM (291 patients). The present study analyzed survey questionnaire data from the patients with T2DM.
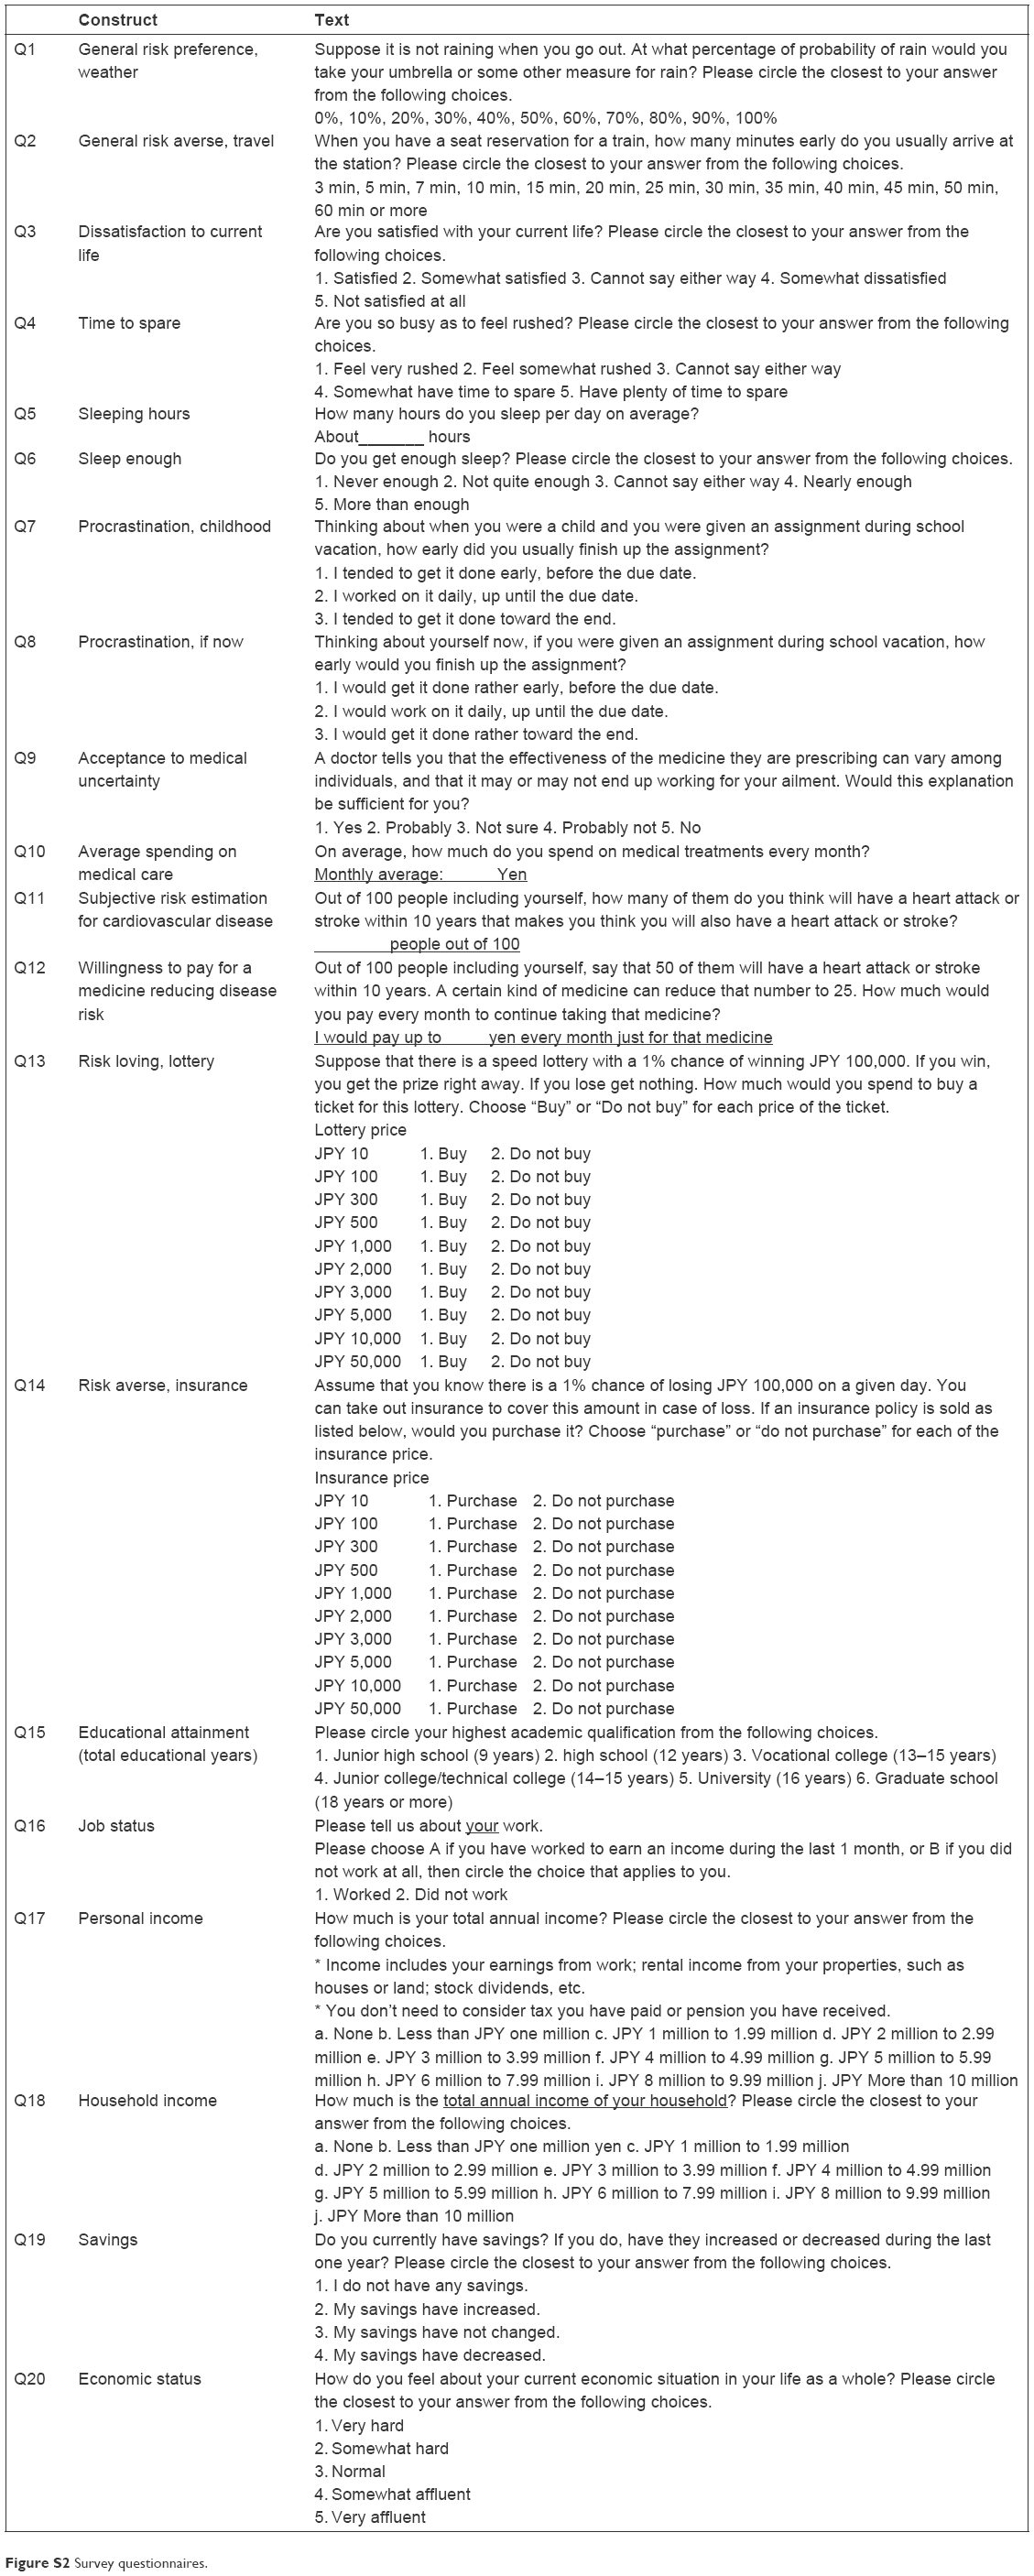
The study protocol, including a consent form with a confidentiality clause, was approved by the Internal Review Board of the Nippon Medical School Ethics Committee. The survey and an explanation sheet that included the consent form were handed out at the outpatient clinic. The completed survey forms and consent forms were returned by mail. Participants received a book coupon worth 500 yen (equivalent to USD 5) as token remuneration. The survey questionnaire used in this study is shown in Figure S2. The questions were modified versions of those from our previous report8 and from the Japan Household Survey on Consumer Preferences and Satisfaction.17,18 In the present study, we analyzed only the responses of the participants with T2DM. The survey response rate for these participants was 81.8% (238 out of 291 patients responded). Hemoglobin A1c (HbA1c) levels were determined by high-performance liquid chromatography using an HLC723G8 analyzer (Tosoh, Co., Tokyo, Japan) and presented as the equivalent National Glycohemoglobin Standardization Program values. To evaluate retinopathy, ophthalmologists performed fundoscopy after pupillary dilatation, following the Davis classification: no diabetic retinopathy, simple diabetic retinopathy, preproliferative diabetic retinopathy, and proliferative diabetic retinopathy including panretinal photocoagulation. Nephropathy was classified according to the Classification of Diabetic Nephropathy 2014: Stage 1, urinary albumin excretion (UAE) <30 mg/g creatinine; Stage 2, UAE 30–299 mg/g creatinine; Stage 3, UAE ≥300 mg/g creatinine; Stage 4, estimated glomerular filtration rate <30 mL/min/1.73 m2; and Stage 5, dialysis therapy.19
Statistical analyses
In the analysis, retinopathy level was represented as an ordinal variable with three possible values: 0, no diabetic retinopathy; 1, simple diabetic retinopathy; or 2, preproliferative diabetic retinopathy and proliferative diabetic retinopathy including panretinal photocoagulation. Nephropathy was represented by an ordinal variable with four possible values based on the nephropathy stage: 1, Stage 1; 2, Stage 2; 3, Stage 3; or 4, Stages 4 and 5. Personal income and household income were obtained by self-report (from Q17 and Q18 in Figure S2) as categorical data, and the median values for each category were treated as continuous variables with a maximum of 11 million yen. Statistical analyses were performed using JMP® 11 (SAS Institute Inc., Cary, NC, USA). Frequency analysis was performed using Fisher’s exact test. The Kruskal–Wallis rank sum test was used to compare income levels. Pearson’s χ2 test was performed to analyze differences between categorical data. P<0.01 was considered to be significant. Multiple logistic regression analysis was used to select parameters significantly associated with diabetic complications as follows.
Parameter selection
Stepwise logistic regression methods were used to identify the survey items associated with the progress of retinopathy or nephropathy. All 20 questionnaire questions, age, sex, duration of diabetes, body mass index (BMI), and HbA1c at the time of the survey were entered as independent variables in the stepwise regression model. Items were eliminated by the model in a backward stepwise fashion using minimum Akaike’s information criterion with a correction (for finite sample sizes) to choose the best model. In the Wald test and the effect likelihood ratio test, P<0.01 was considered to show a significant association and P<0.05 a weak association.
Results
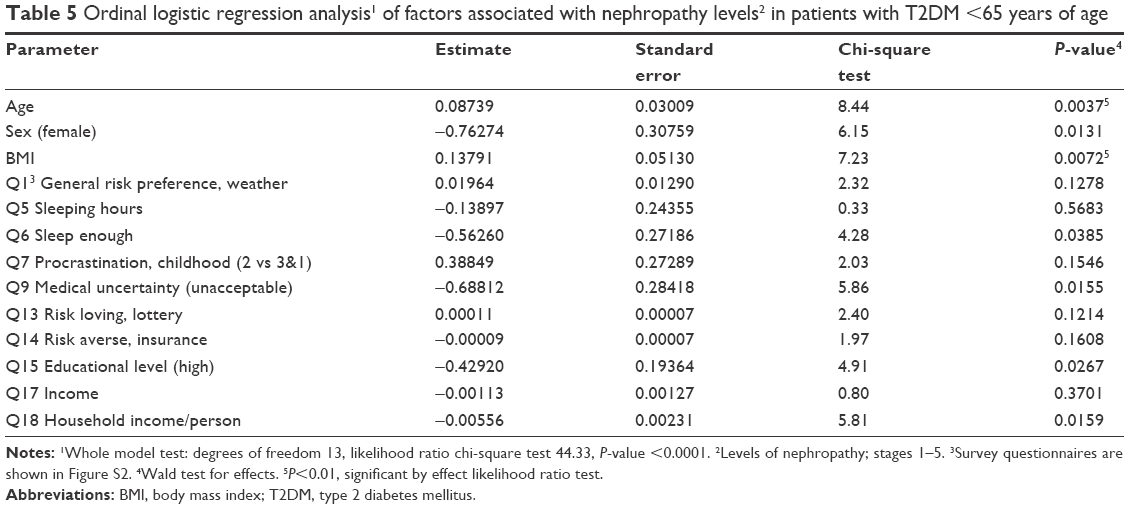
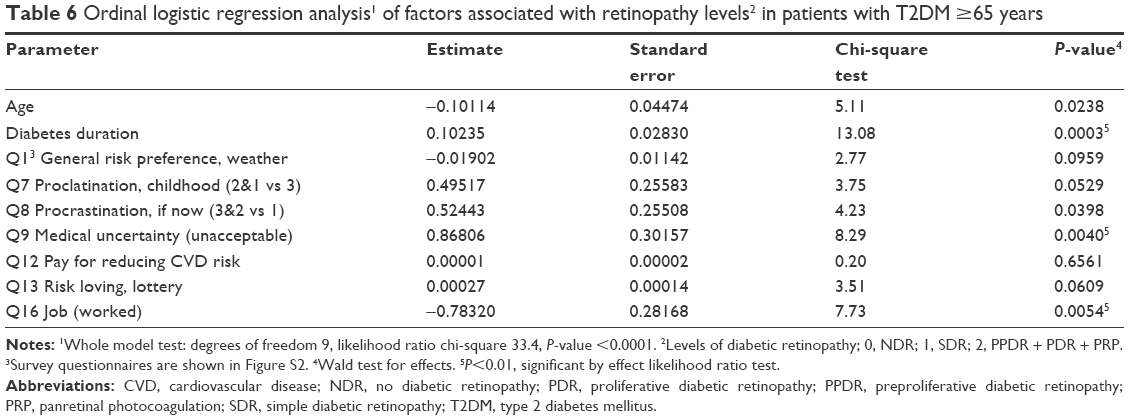
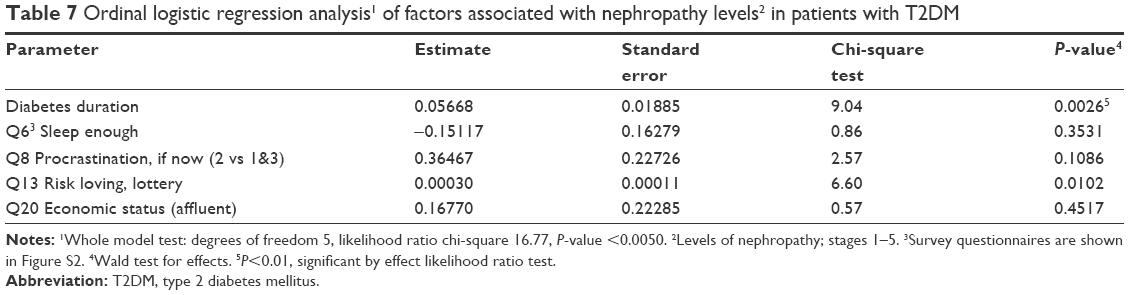
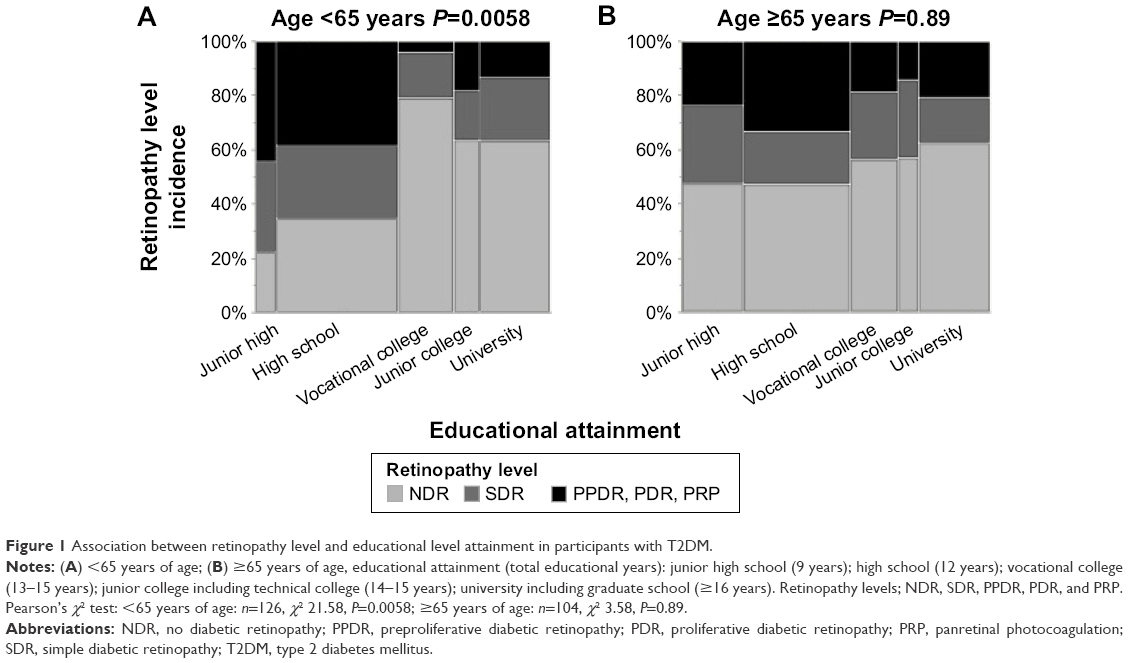
The characteristics of the participants who responded and whose data were analyzed in this study are shown in Table 1. It has been reported that SES differences in health are age-dependent, are greatest during the young- to middle-age adult years, and are not so pronounced among older people.20–24 We therefore divided the participants into two groups according to their age (<65 and ≥65 years) for further analysis. BMI were significantly higher in patients <65 years of age, and diabetes durations were longer in patients ≥65 years of age. Gender ratio, HbA1c, prevalence of retinopathy and nephropathy were not significantly different between age groups. Tables 2 and 3 show the results of the ordinal logistic regression analysis of factors associated with retinopathy and nephropathy for the participants with T2DM at all ages. Diabetes duration, procrastination, educational attainment, and savings status (not increased) were factors significantly associated with the retinopathy level. Sex (male), BMI, and shortage of sleep were factors associated with nephropathy level. Tables 4 and 5 show the results of the ordinal regression analysis of factors associated with the retinopathy level and nephropathy levels for the participants <65 years of age. Educational attainment was the only factor significantly associated with the retinopathy level in these participants. Sex (male), diabetes duration, procrastination, medical spending, risk preference, and job status were weakly associated with retinopathy (P<0.05). Factors significantly associated with nephropathy for those <65 years of age were age and BMI. Tables 6 and 7 show the results of the ordinal regression analysis of factors associated with retinopathy and nephropathy for participants ≥65 years of age. Diabetes duration, unwillingness to accept medical uncertainty, and job status were significantly associated with retinopathy level. Only diabetes duration was significantly associated with nephropathy in the older participants. Figure 1 shows the association between retinopathy level and educational attainment for the participants <65 years of age. Educational attainment of high school or lower (ie, 12 years of education) was a significant risk factor for the progression of retinopathy in the participants <65 years of age (Pearson’s χ2 test, P=0.0058); the risk exhibited a threshold at the high school level, and there were no marginal differences between educational attainment levels above high school (ie, 13–16 years or more of education). There was no association between retinopathy level and educational attainment in the older participants (Pearson’s χ2 test, P=0.89). Educational attainment and income are closely associated; we therefore analyzed the relationship between retinopathy, educational attainment, and income. Figure 2 shows a comparison of personal and household income by retinopathy level for the participants <65 years of age. Personal income level did not differ between retinopathy levels (Kruskal–Wallis test, P=0.51), and household income tended to be higher in participants <65 years of age with no diabetic retinopathy (Kruskal–Wallis tests, P=0.032). Figure 3 shows a comparison of personal income and household income by educational attainment in the participants <65 years of age. Although participants with a university or graduate school qualification showed significantly higher personal income (Kruskal–Wallis test, P=0.0073) and household income (Kruskal–Wallis test, P=0.028), the difference between personal and household income was not significant for other levels of educational attainment.
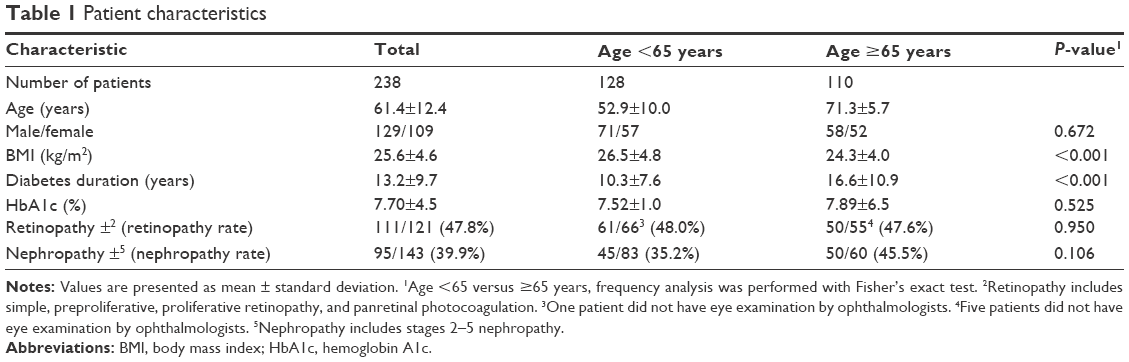 | Table 1 Patient characteristics |
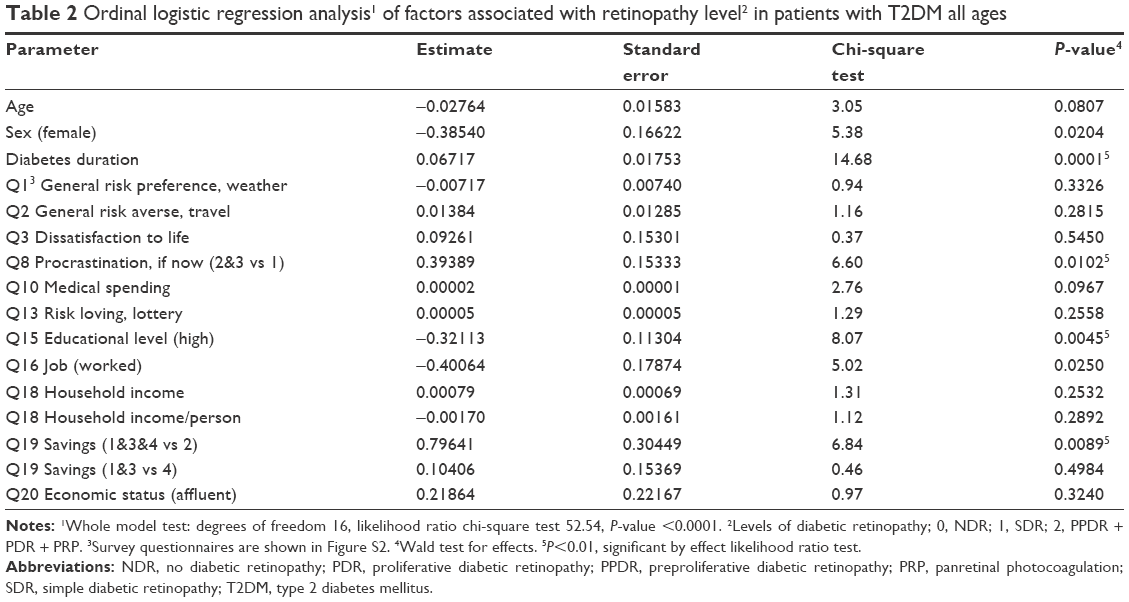 | Table 2 Ordinal logistic regression analysis1 of factors associated with retinopathy level2 in patients with T2DM all ages |
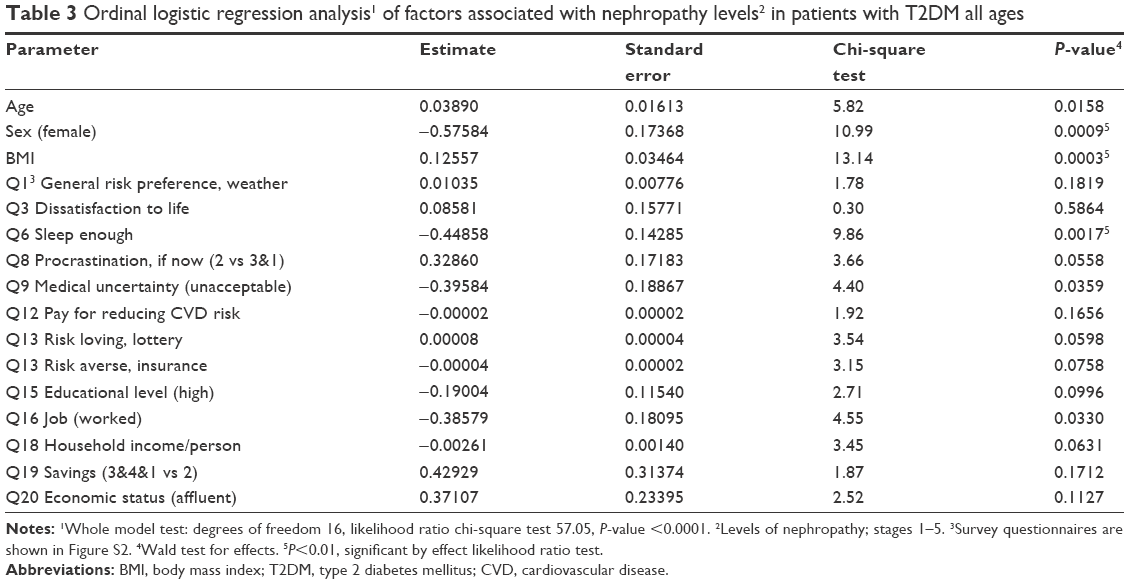 | Table 3 Ordinal logistic regression analysis1 of factors associated with nephropathy levels2 in patients with T2DM all ages |
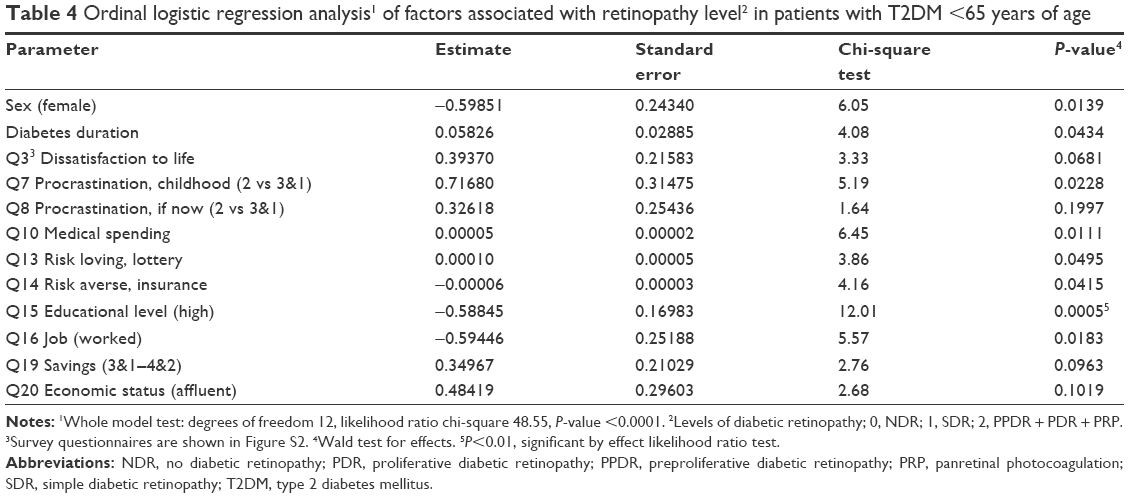 | Table 4 Ordinal logistic regression analysis1 of factors associated with retinopathy level2 in patients with T2DM <65 years of age |
 | Table 5 Ordinal logistic regression analysis1 of factors associated with nephropathy levels2 in patients with T2DM <65 years of age |
 | Table 6 Ordinal logistic regression analysis1 of factors associated with retinopathy levels2 in patients with T2DM ≥65 years |
 | Table 7 Ordinal logistic regression analysis1 of factors associated with nephropathy levels2 in patients with T2DM |
 | Figure 1 Association between retinopathy level and educational level attainment in participants with T2DM. |
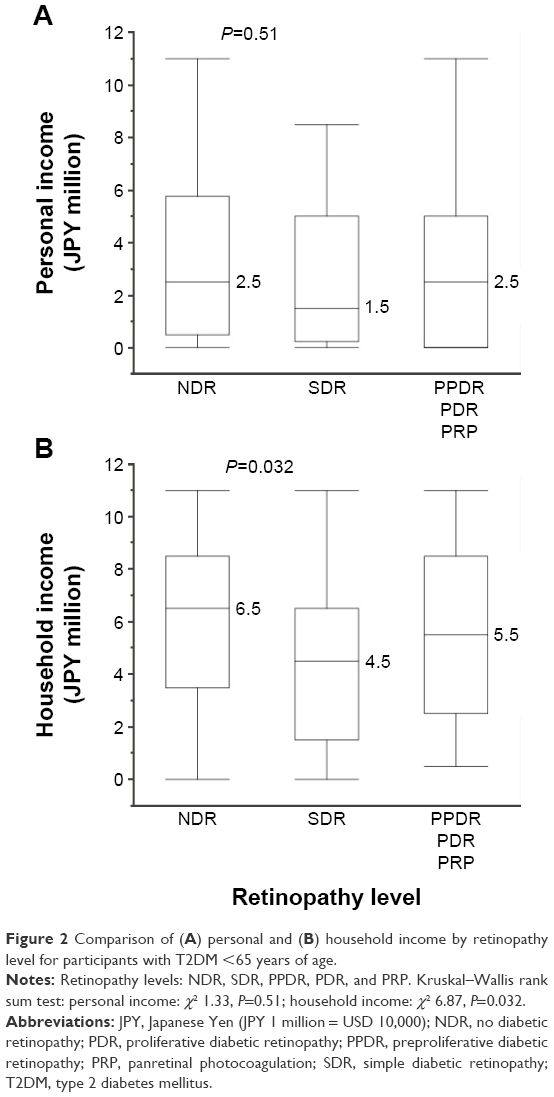 | Figure 2 Comparison of (A) personal and (B) household income by retinopathy level for participants with T2DM <65 years of age. |
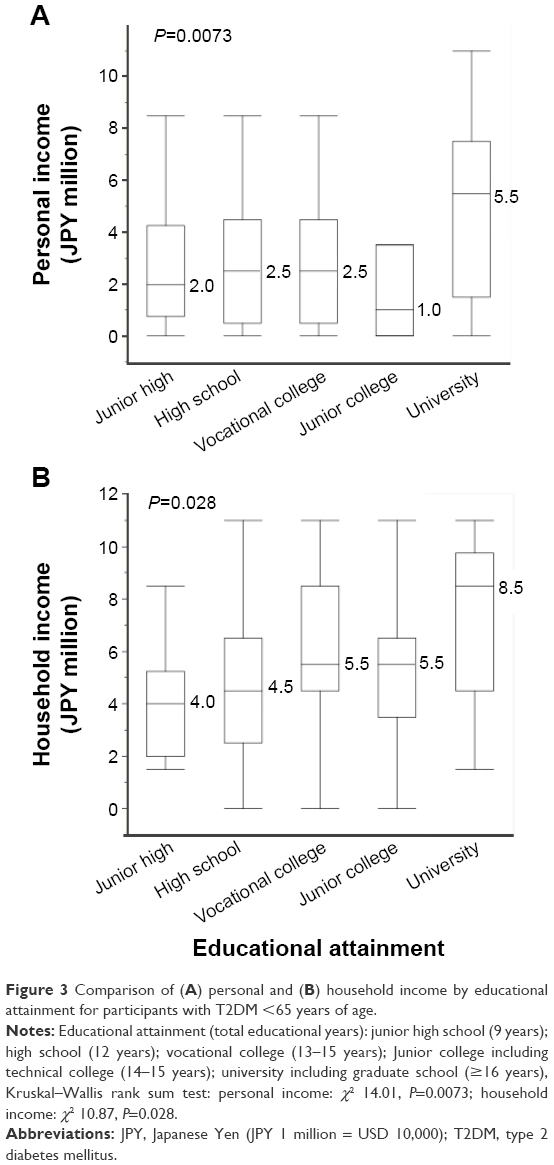 | Figure 3 Comparison of (A) personal and (B) household income by educational attainment for participants with T2DM <65 years of age. |
Discussion
In this study, we demonstrated the impact of educational attainment of the progress of retinopathy in patients with difficult-to-control T2DM. In the participants <65 years of age, educational attainment was the only factor significantly associated with the progression of retinopathy. An educational attainment of high school or lower appeared to be a strong risk factor for this complication. Above high school level, there was no difference between vocational college, junior/technical college, and university/graduate school in the association with retinopathy level. This result suggests that the association between educational attainment and diabetic complications may have a threshold point between gaining a high school diploma and education above high school level.
The reason why highly educated persons are healthier can be attributed to higher income and higher cognitive ability, as well as other factors including time and risk preferences, and self-control.25 In general, educational and income levels are closely related. Individuals of lower SES have limited income, poorer occupational opportunity, and reduced access to health care services and information. The patients with the lowest household income have been shown to have the highest prevalence of retinopathy and neuropathy.15 However, in the present study, we did not find a significant association between income level and retinopathy level. In Japan, it has been suggested that low income may not necessarily be associated with worse health outcome given the universally available and egalitarian Japanese health care system.16 These results suggest that the impact of educational attainment on the progression of retinopathy is independent of personal income level.
It has been reported that lower cognitive function during late adolescence is independently associated with an elevated risk for impaired fasting glucose and diabetes.26,27 We demonstrated in our previous report that patients with T2DM tended to have a preference for risk-seeking compared to those with T1DM. Risk-seeking is weakly associated with nephropathy in older patients (Table 7, Q13 lottery P=0.0102) in the present study, but this result may be due to lower quantitative literacy proficiency, as discussed in the previous report. We also suggested that lower quantitative literacy proficiency among patients with T2DM may not be a result of high glucose levels, but could be a reflection of the essential pathophysiology of T2DM, such as insulin resistance.8 In this context, brain insulin resistance seems the most plausible explanation of the association between cognitive function and T2DM.28–30 Further studies will be necessary to test this hypothesis.
Nephropathy stage was significantly associated with only age and BMI in the participants <65 years of age. Although sex, sleep, unwillingness to accept medical uncertainty, educational attainment, and household income were weakly associated with nephropathy level (P<0.05), SES and behavioral propensity may not be essential factors for the progression of nephropathy. The reason why the effects of educational attainment on the progress of retinopathy and nephropathy were not the same is unknown. Factors other than hyperglycemia, including blood pressure, lipid level, atherosclerosis, and especially the use of renin angiotensin system inhibitors and HMG-CoA reductase inhibitors, may have affected the progress of nephropathy strongly enough to reduce the impact of educational level.31
In older participants, there was no prominent effect of SES on the progress of retinopathy and nephropathy. These results are compatible with general morbidity and mortality in older people.20–24 This is probably because there are social security and health care systems focused on older patients in many developed countries. As a result, the duration of diabetes has the strongest effect on the progress of retinopathy and nephropathy in older patients. Even in this situation, acceptance of medical uncertainty (Q9 in Figure S2) and job status were significantly associated with retinopathy in the older participants in the present study. Older participants who worked during the previous month were less likely to have higher levels of retinopathy, probably because they were independent and active and may have had higher cognitive function. Conversely, the older participants who were less accepting of medical uncertainty (Q9 in Figure S2) were more likely to have higher levels of retinopathy. This result was reversed in participants <65 years of age, although the significance was weak (P<0.05). The reason for these contradictory results is not clear. One possible explanation is that being less willing to accept medical uncertainty may be a result of self-confidence in middle-aged and young participants, whereas in older participants it may simply result in reduced access to health care services.
Limitations of this study include self-reporting and a limited number of cases, especially of patients with difficult-to-control T2DM, in one locality in Japan. The median of self-reported household income in this study was 4.5 million yen, which was compatible with 4.32 million yen reported by Japanese Ministry of Health, Labor and Welfare in 2013. The proportions of participants with a high school diploma or lower (51.7%) and with qualifications above high school (48.3%) did not differ significantly from those in the report of the national census in 2010 (65.3% and 34.7%, respectively). These data support the reliability of the self-reported data in the present study. The survey was performed in a locality of Japan with a limited number of patients. This study is not strictly random sampling. However, characteristics of patients were consistent with the report of Japan Diabetes Complication Study which is a multicenter prospective study by universities and general hospitals in Japan.32 Therefore, the patients in the present study could be considered as representative of the patients with difficult-to-control T2DM in a local area in Japan. In many countries, educational level and economic status are closely related, and it is impossible to examine their effect on diabetic complications independently. The present study demonstrated that the impact of educational attainment on diabetic retinopathy was independent of personal economic status. Two important factors may partially explain this finding: the egalitarian health care system in Japan and the diabetes specialist referral system for patients with difficult-to-control T2DM established in a locality with a relatively large population (of 700,000 people). The essence of the findings of this study could be applied to patients with T2DM worldwide.
In conclusion, this study demonstrated that lower educational attainment, especially attaining only a high school diploma or lower, is a strong risk factor for diabetic retinopathy in patients with T2DM <65 years of age. Some other behavioral propensities were also found to be associated with the progress of diabetic complications, but not to as great an extent as educational attainment. We also demonstrated that the association between diabetic retinopathy and educational attainment level was independent of personal economic status. These results suggest that cognitive function may play an important role in the progression of diabetic retinopathy in patients with T2DM.
Acknowledgment
This study was supported by Grants-in-Aid for scientific research from the Japan Society for the Promotion of Science (KAKENHI) for Research Project #26670256 (FY 2014–2016).
Disclosure
The authors report no conflicts of interest in this work.
References
Inzucchi SE, Bergenstal RM, Buse JB, et al. Management of hyperglycaemia in type 2 diabetes, 2015: a patient-centred approach. Update to a position statement of the American Diabetes Association and the European Association for the study of diabetes. Diabetologia. 2015;58(3):429–442. | ||
Group TDCaCTR. The effect of intensive treatment of diabetes on the development and progression of long-term complications in insulin-dependent diabetes mellitus. N Engl J Med. 1993;329(14):977–986. | ||
Group UPDSU. Intensive blood-glucose control with sulphonylureas or insulin compared with conventional treatment and risk of complications in patients with type 2 diabetes (UKPDS 33). Lancet. 1998;352(9131):837–853. | ||
Zhao G, Ford ES, Li C, Mokdad AH. Compliance with physical activity recommendations in US adults with diabetes. Diabet Med. 2008;25(2):221–227. | ||
Nelson KM, Reiber G, Boyko EJ. Diet and exercise among adults with type 2 diabetes: findings from the third national health and nutrition examination survey (NHANES III). Diabetes Care. 2002;25(10):1722–1728. | ||
Kalenscher T, Pennartz CM. Is a bird in the hand worth two in the future? The neuroeconomics of intertemporal decision-making. Prog Neurobiol. 2008;84(3):284–315. | ||
Reach G. Is there an impatience genotype leading to non-adherence to long-term therapies? Diabetologia. 2010;53(8):1562–1567. | ||
Emoto N, Okajima F, Sugihara H, Goto R. Behavioral economics survey of patients with type 1 and type 2 diabetes. Patient Prefer Adherence. 2015;9:649–658. | ||
Donkers B, Melenberg B, Van Soest A. Estimating risk attitudes using lotteries: a large sample approach. J Risk Uncertain. 2001;22(2):165–195. | ||
Galler A, Lindau M, Ernert A, Thalemann R, Raile K. Associations between media consumption habits, physical activity, socioeconomic status, and glycemic control in children, adolescents, and young adults with type 1 diabetes. Diabetes Care. 2011;34(11):2356–2359. | ||
Saydah SH, Imperatore G, Beckles GL. Socioeconomic status and mortality: contribution of health care access and psychological distress among U.S. adults with diagnosed diabetes. Diabetes Care. 2013;36(1):49–55. | ||
Dalsgaard EM, Skriver MV, Sandbaek A, Vestergaard M. Socioeconomic position, type 2 diabetes and long-term risk of death. PLoS One. 2015;10(5):e0124829. | ||
Rawshani A, Svensson AM, Rosengren A, Eliasson B, Gudbjornsdottir S. Impact of socioeconomic status on cardiovascular disease and mortality in 24,947 individuals with type 1 diabetes. Diabetes Care. 2015;38(8):1518–1527. | ||
Kim SR, Han K, Choi JY, et al. Age- and sex-specific relationships between household income, education, and diabetes mellitus in Korean adults: the Korea National Health and Nutrition Examination Survey, 2008–2010. PLoS One. 2015;10(1):e0117034. | ||
Tao X, Li J, Zhu X, et al. Association between socioeconomic status and metabolic control and diabetes complications: a cross-sectional nationwide study in Chinese adults with type 2 diabetes mellitus. Cardiovasc Diabetol. 2016;15(1):61. | ||
Hayashino Y, Yamazaki S, Nakayama T, Sokejima S, Fukuhara S. The association between socioeconomic status and prevalence of diabetes mellitus in rural Japan. Arch Environ Occup Health. 2010;65(4):224–229. | ||
Ikeda S, Kang MI, Ohtake F. Hyperbolic discounting, the sign effect, and the body mass index. J Health Econ. 2010;29(2):268–284. | ||
Kang MI, Ikeda S. Time discounting and smoking behavior: evidence from a panel survey. Health Econ. 2014;23(12):1443–1464. | ||
Haneda M, Utsunomiya K, Koya D, et al. A new classification of diabetic nephropathy 2014: a report from Joint Committee on diabetic nephropathy. J Diabetes Investig. 2015;6(2):242–246. | ||
Der G, MacIntyre S, Ford G, Hunt K, West P. The relationship of household income to a range of health measures in three age cohorts from the West of Scotland. Eur J Pub Health. 1999;9(4):271–277. | ||
Mustard CA, Derksen S, Berthelot JM, Wolfson M, Roos LL. Age-specific education and income gradients in morbidity and mortality in a Canadian province. Soc Sci Med. 1997;45(3):383–397. | ||
Anderson RT, Sorlie P, Backlund E, Johnson N, Kaplan GA. Mortality effects of community socioeconomic status. Epidemiology. 1997;8(1):42–47. | ||
Beckett M. Converging health inequalities in later life – an artifact of mortality selection? J Health Soc Behav. 2000;41(1):106–119. | ||
Hart CL, Smith GD, Blane D. Inequalities in mortality by social class measured at 3 stages of the lifecourse. Am J Public Health. 1998;88(3):471–474. | ||
Ayyagari P, Grossman D, Sloan F. Education and health: evidence on adults with diabetes. Int J Health Care Finance Econ. 2011;11(1):35–54. | ||
Twig G, Gluzman I, Tirosh A, et al. Cognitive function and the risk for diabetes among young men. Diabetes Care. 2014;37(11):2982–2988. | ||
Cukierman-Yaffe T, Kasher-Meron M, Fruchter E, et al. Cognitive performance at late adolescence and the risk for impaired fasting glucose among young adults. J Clin Endocrinol Metab. 2015;100(12):4409–4416. | ||
Schioth HB, Craft S, Brooks SJ, Frey WH 2nd, Benedict C. Brain insulin signaling and Alzheimer’s disease: current evidence and future directions. Mol Neurobiol. 2012;46(1):4–10. | ||
Young SE, Mainous AG 3rd, Carnemolla M. Hyperinsulinemia and cognitive decline in a middle-aged cohort. Diabetes Care. 2006;29(12):2688–2693. | ||
Heni M, Kullmann S, Preissl H, Fritsche A, Haring HU. Impaired insulin action in the human brain: causes and metabolic consequences. Nat Rev Endocrinol. 2015;11(12):701–711. | ||
Tang SC, Chan GC, Lai KN. Recent advances in managing and understanding diabetic nephropathy. F1000Res. 2016;5. | ||
Horikawa C, Yoshimura Y, Kamada C, et al. Dietary sodium intake and incidence of diabetes complications in Japanese patients with type 2 diabetes: analysis of the Japan Diabetes Complications Study (JDCS). J Clin Endocrinol Metab. 2014;99(10):3635–3643. |
Supplementary materials
 | Figure S1 Study flow diagram. |
 | Figure S2 Survey questionnaires. |
 © 2016 The Author(s). This work is published and licensed by Dove Medical Press Limited. The full terms of this license are available at https://www.dovepress.com/terms.php and incorporate the Creative Commons Attribution - Non Commercial (unported, v3.0) License.
By accessing the work you hereby accept the Terms. Non-commercial uses of the work are permitted without any further permission from Dove Medical Press Limited, provided the work is properly attributed. For permission for commercial use of this work, please see paragraphs 4.2 and 5 of our Terms.
© 2016 The Author(s). This work is published and licensed by Dove Medical Press Limited. The full terms of this license are available at https://www.dovepress.com/terms.php and incorporate the Creative Commons Attribution - Non Commercial (unported, v3.0) License.
By accessing the work you hereby accept the Terms. Non-commercial uses of the work are permitted without any further permission from Dove Medical Press Limited, provided the work is properly attributed. For permission for commercial use of this work, please see paragraphs 4.2 and 5 of our Terms.