")
Back to Journals » International Journal of Chronic Obstructive Pulmonary Disease » Volume 11 » Issue 1
A size-based emphysema severity index: robust to the breath-hold-level variations and correlated with clinical parameters
Authors Hwang J , Lee M , Lee SM , Oh SY, Oh Y , Kim N , Seo JB
Received 4 April 2016
Accepted for publication 3 June 2016
Published 3 August 2016 Volume 2016:11(1) Pages 1835—1841
DOI https://doi.org/10.2147/COPD.S109846
Checked for plagiarism Yes
Review by Single anonymous peer review
Peer reviewer comments 3
Editor who approved publication: Dr Richard Russell
Jeongeun Hwang,1 Minho Lee,2 Sang Min Lee,2 Sang Young Oh,2 Yeon-Mok Oh,3,4 Namkug Kim,2,3,* Joon Beom Seo2,*
1Asan Institute for Life Sciences, 2Department of Radiology, 3Department of Convergence Medicine, 4Department of Pulmonary and Critical Care Medicine, University of Ulsan College of Medicine, Asan Medical Center, Seoul, Republic of Korea
*These authors contributed equally to this work
Objective: To determine the power-law exponents (D) of emphysema hole-size distributions as a competent emphysema index. Robustness to extreme breath-hold-level variations and correlations with clinical parameters for chronic obstructive pulmonary disease (COPD) were investigated and compared to a conventional emphysema index (EI%).
Patients and methods: A total of 100 patients with COPD (97 males and three females of mean age 67±7.9 years) underwent multidetector row computed tomography scanning at full inspiration and full expiration. The diameters of the emphysematous holes were estimated and quantified with a fully automated algorithm. Power-law exponents (D) of emphysematous hole-size distribution were evaluated.
Results: The diameters followed a power-law distribution in all cases, suggesting the scale-free nature of emphysema. D of inspiratory and expiratory computed tomography of patients showed intraclass correlation coefficients >0.8, indicating statistically absolute agreement of different breath-hold levels. By contrast, the EI% failed to agree. Bland–Altman analysis also revealed the superior robustness of D to EI%. D also significantly correlated with clinical parameters such as airflow limitation, diffusion capacity, exercise capacity, and quality of life.
Conclusion: The D of emphysematous hole-size distribution is robust to breath-hold-level variations and sensitive to the severity of emphysema. This measurement may help rule out the confounding effects of variations in breath-hold levels.
Keywords: chronic obstructive pulmonary disease, emphysema, computed tomography, quantitative imaging, breath-hold, power law
Introduction
Chronic obstructive pulmonary disease (COPD) is a leading cause of mortality that imposes significant socioeconomic burden globally.1,2 Emphysema, one of the key components in the pathophysiology of COPD, is characterized by alveolar wall destruction3–6 and can be quantified using computed tomography (CT) scanning.7–9
Reliable and objective quantification of emphysema severity is a key to proper diagnosis and treatment.9–11 Increased emphysema volume fraction, expressed as percent emphysema index (EI%), on CT images in COPD patients has been reported to represent the severity of pulmonary emphysema.7–11 EI% is widely used because it is intuitive and correlates with histopathology measurements12 and scoring by radiologists.13 However, an important limitation of EI% is its susceptibility to occasional variations in breath-hold levels. Thus, EI% in patients with similar emphysema severity may differ, depending on variations in breath-hold levels during CT scanning. These variations, which may result in the over- or underestimation of emphysema severity, are especially problematic in patients with severe airflow limitation or pain while breathing. This limitation has hindered multicenter and/or longitudinal studies, as irregularities in CT image acquisition may be more frequent.
The lung has a scale-free, fractal nature,14–19 with the fractal dimension power-law exponents (D) reflecting intrinsic complexity.20 The distribution of emphysematous hole sizes has been shown to follow a power law, with the exponent associated with clinical parameters.20,21 Moreover, the power-law exponent deduced from the distribution in emphysematous hole sizes may reflect the extent of intrinsic complexity. This study describes the development of a new algorithm to measure the size of emphysematous holes and its application in determining D. This exponent, D, may constitute a new emphysema severity index that is robust to variations in breath-hold levels. It was hypothesized that these variations in breath-hold levels alter the size of emphysematous holes but not the statistical properties of size distribution. The D of emphysematous hole-size distribution may therefore represent the unaltered statistical property. To date, this hypothesis has not been validated using CT images of the same patients at different breath-hold levels.
Patients and methods
Subjects belonging to the Korean obstructive lung disease (KOLD) cohort were retrospectively examined. The exponent D and other indices, such as EI%, pulmonary function test indices, exercise capacity, and quality-of-life indices, were evaluated in these patients. In accordance with the KOLD imaging protocol, CT images of each subject were obtained in consecutive full inspiratory and full expiratory breath-hold levels. The effects of inspiration and expiration on D were compared with their effects on conventional EI%. Their associations with post-bronchodilator (BD) forced expiratory volume in 1 second (% of predicted value; FEV1 [%pred]), corrected diffusing capacity of the lungs for carbon monoxide to hemoglobin (% of predicted value; cDLCO [%pred]), 6-minute-walk-test distance (6MWD), and St George’s Respiratory Questionnaire (SGRQ) score were also evaluated.
Ethics statement
The present study was approved by the institutional review board of the Asan Medical Center (number 2005-0345) and by the institutional review boards of the other 16 hospitals involved. Written informed consent forms were obtained from all patients.
Study subjects
This study retrospectively evaluated subjects belonging to the KOLD cohort. All subjects met the following criteria: 1) a diagnosis of COPD, ie, post-BD FEV1/FVC <0.7 and >10 pack-years of smoking history, as well as no or minimal abnormality on chest radiographs other than emphysema and 2) enrollment from June 2005 to December 2012. The 100 COPD patients included in this study consisted of 97 males and three females of mean ± standard deviation (SD) age of 67±7.8 years, mean ± SD body mass index of 23±3.6 kg/m2, and mean ± SD smoking history of 42±22 pack-years (Table 1).
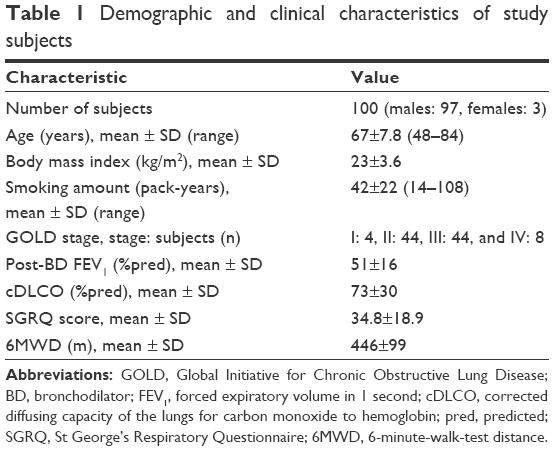 | Table 1 Demographic and clinical characteristics of study subjects |
Pulmonary function tests
The patients underwent pulmonary function tests in accordance with the KOLD cohort study protocol.22 In this study, post-BD pulmonary function was measured to distinguish between the effects of airway symptoms and emphysema. Airflow limitation was determined by measuring post-BD FEV1 (%pred), and lung diffusivity was determined by measuring cDLCO (%pred).
Exercise capacity and quality of life
Patients’ quality of life was measured using the 6MWD and SGRQ total scores (Table 1).
CT-based indices
The patients underwent paired inspiratory–expiratory chest CT scanning according to the KOLD cohort study protocol.9,22 All subjects were scanned by a 16-channel multidetector row CT scanner (SOMATOM Sensation; Siemens Medical Systems, Erlangen, Germany) within 0.75 mm collimation, 100 effective mAs, 140 kVp, and pitch 1.0. The scale of attenuation coefficients in the CT scanner ranged from −1,024 Hounsfield units (HU) to 3,072 HU. The patients were scanned craniocaudally while in the supine position and without contrast medium. All patients were scanned twice at full-inspiratory and full-expiratory breath-hold levels. The CT images were reconstructed to a 512×512-pixel digital imaging and communications in medicine format using a soft kernel (B30f; Siemens Medical Systems) and a standard reconstruction algorithm. Based on the CT scan, low-attenuation masks (<−950 HU) were automatically identified in the lungs during both inspiratory and expiratory CT scans.9,23 EI%s were calculated by dividing the low-attenuation volume by the lung volume of the same CT dataset. The pulmonary function tests were performed within a week before or after CT scanning.
This study utilized an algorithm that quantifies the emphysematous hole sizes in three dimensions. The algorithm iteratively applies a Gaussian low-pass filter from 30 mm to 1 mm kernel sizes at 1 mm intervals to the low-attenuation masks from the largest to the smallest sizes.24
The cumulative frequency distributions of emphysematous hole sizes were found to decrease linearly on a log–log scale. The slopes of the plots varied between subjects. However, in each, the cumulative frequency distribution, Y, can be described by a power law of size X in the form:
Y = a × X−D | (1) |
where a is a constant. The values of D were obtained by linear regression with the least-squares method in the log–log domain, and the square of correlation coefficients R2 was utilized to indicate the goodness of fit of the power law. MATLAB (release 2015a; MathWorks Inc., Natick, MA, USA) was used to visualize the cumulative frequency distributions in the log–log scale and to evaluate the D.
Statistics
The agreement between D values on inspiratory and expiratory CT scans was tested by Bland–Altman plots25 and by determining the intraclass correlation coefficient (ICC; class 1: absolute agreement).26 The breath-hold-level robustness of EI% was also assessed with Bland–Altman plots and ICC. The associations between D and clinical indices, such as post-BD FEV1 (%pred), cDLCO (%pred), SGRQ, and 6MWD, were estimated with Pearson’s correlation coefficient. All statistical analyses were performed using R statistical software (R Foundation for Statistical Computing, Vienna, Austria) Version 3.2.1 and SPSS Version 22 (IBM Corporation, Armonk, NY, USA).
Results
All 100 subjects underwent three-dimensional segmentation of emphysematous holes, with the size of every hole automatically evaluated in inspiratory and expiratory CT pairs (Figure 1). The size distributions of emphysematous holes in all subjects followed a power law, with a mean ± SD R2 value of 0.96±0.03 and all R2 values >0.90.
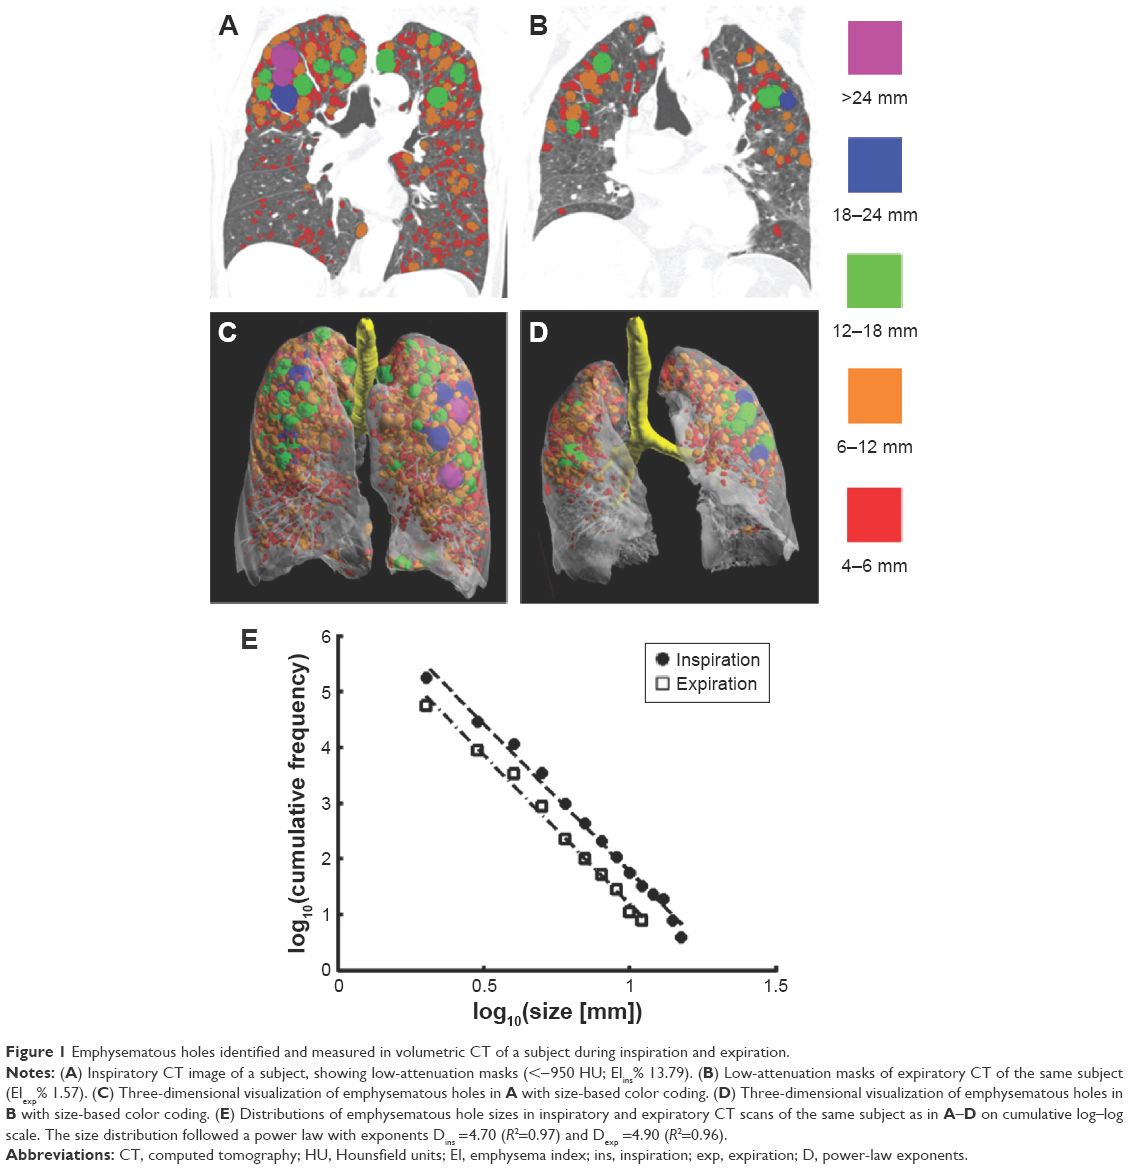 | Figure 1 Emphysematous holes identified and measured in volumetric CT of a subject during inspiration and expiration. |
Figure 1 shows the emphysematous hole sizes in an individual subject. Figure 1A and B represents coronal views of the volumetric CT during inspiration and expiration, respectively. Low-attenuation masks were segmented, and major emphysematous holes were color coded by size during inspiration and expiration, as shown in Figure 1C and D, respectively. Figure 1E shows that the distribution of emphysematous hole sizes followed a power law.
The mean ± SD emphysema indices in inspiration (EIins%) and expiration (EIexp%) were 24.61±15.63 and 14.85±15.07, respectively (Figure 2A), while the mean ± SD D values in inspiration (Dins) and expiration (Dexp) were 5.68±1.03 and 5.65±0.96, respectively (Figure 2B).
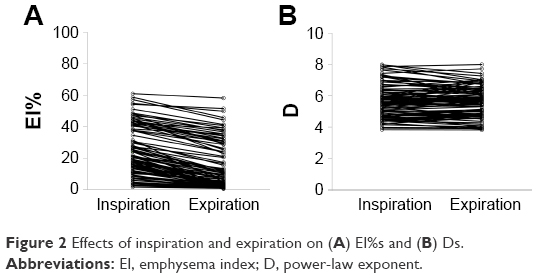 | Figure 2 Effects of inspiration and expiration on (A) EI%s and (B) Ds. |
Robustness of D with respect to breath-hold levels
The robustness of D to breath-hold levels was tested with a Bland–Altman plot and by determining ICC for absolute agreement and compared with those for EI%. Bland–Altman plots showed agreement of the D values of inspiratory and expiratory CT scans, with a mean difference of 0.022 (Figure 3). In comparison, the mean difference in EI% for inspiration and expiration was 9.76. The ICC for absolute agreement between Dinss and Dexps was 0.89, >0.80, which is generally interpreted as reliable. By comparison, the ICC for absolute agreement between EIins% and EIexp% was 0.76, which is <0.80.
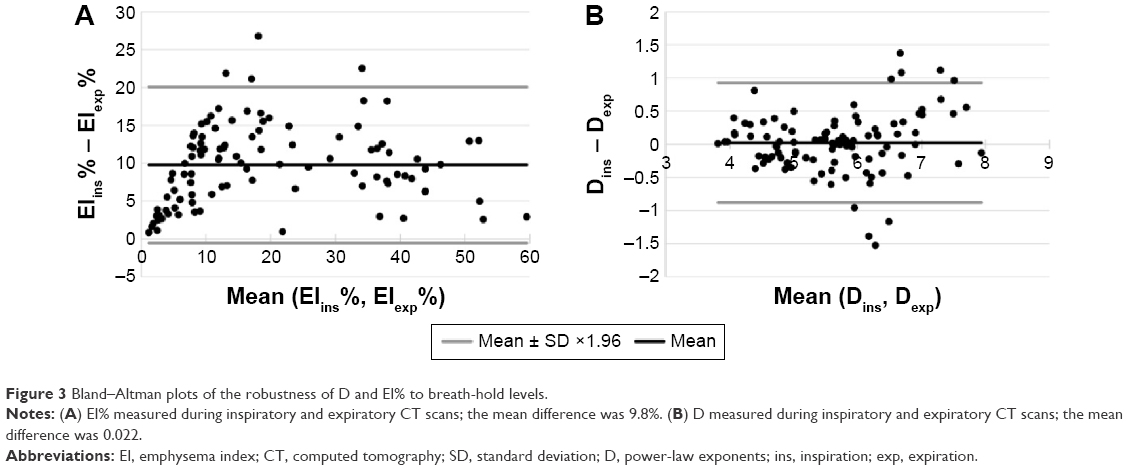 | Figure 3 Bland–Altman plots of the robustness of D and EI% to breath-hold levels. |
Association between D values and clinical COPD indices
D values showed significant associations with clinical indices, including post-BD FEV1 (%pred), cDLCO (%pred), 6MWD, and SGRQ score (Table 2). In general, smaller D values were associated with more severe emphysema.
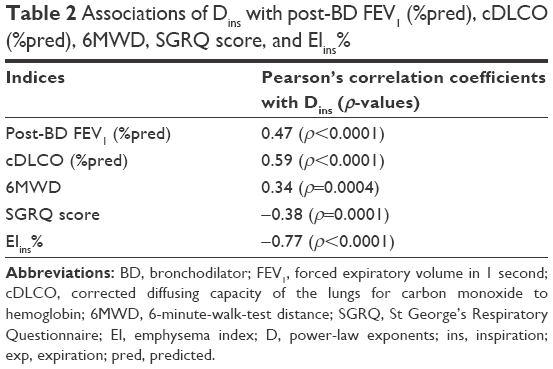 | Table 2 Associations of Dins with post-BD FEV1 (%pred), cDLCO (%pred), 6MWD, SGRQ score, and EIins% |
Discussion
Chest CT images were obtained for COPD patients during inspiration and expiration, and the effects of breath-hold levels on EI% and D were assessed. EI% was affected by breath-hold levels, whereas D was not. The superior robustness of D in relation to differences in breath-hold levels was shown by both ICC and Bland–Altman plots. D values were also associated with clinical measurements of COPD severity, such as post-BD FEV1 (%pred), cDLCO (%pred), 6MWD, and SGRQ.
In this study, all emphysematous holes throughout the lungs were quantified in three dimensions, during both inspiratory and expiratory states. By contrast, earlier studies only evaluated three two-dimensional CT images of a lung during inspiration.20,21 The benefit of the algorithm we used was its ability to directly measure the sizes of all emphysematous holes throughout the whole lung, thus eliminating any possible sampling bias.
The robustness of D to breath-hold levels and its interpatient variability suggest that D may be an intrinsic, systematic characteristic of a patient’s lung. Both breath-hold levels and emphysema severity resulted in EI% variations. The differences in lung volume between inspiration and expiration correlated with changes in EI% (Figure S1A), but not with changes in D (Figure S1B). These findings suggest that the physics underlying these two indices completely differs from each other and that D could distinguish between the effects of emphysema and those of breath-hold levels. The associations between D and clinical COPD severity indices suggest that D is an indicator of the stage of the emphysematous pathophysiologic process and extent of lung function damage.
The breath-hold-level robustness is a novel feature of D. This robustness was revealed on both inspiration and expiration CT scans, the most extreme conditions. Few radiologic indices were found to be robust for inspiration and expiration. Practically, patients undergoing CT scan try to adapt their breath to the instructions of the radiologic technicians’ instructions, struggling with their own hardships in breath control. As a result, in the clinical realm, the confounding effect of breath-hold levels lies in between the extreme and the ideal. Yet, it is not clear how D is affected by various breath-hold levels in between the inspiration and expiration, and additional preclinical studies will be needed to clarify.
CT scans of patients with more than mild COPD were quantified in this study because the lungs of normal individuals and patients with very mild COPD had too few emphysematous holes to determine a proper size distribution line. Emphysematous holes in this study were defined as those of <−950 HU. If D were measured with 15-percentile emphysema definition, all lungs could be quantified and compared with each other.
D can be expanded to evaluate other pulmonary diseases, including asthma, fibrosis, and interstitial lung disease. The robustness of D may not only benefit patients with severe pulmonary symptoms, but suggests its use in multicenter, longitudinal studies. In these studies, considerable portions of CT data are not utilized because of the incompatibilities of CT vendors, reconstruction algorithms, and radiation doses and other factors that hinder fidelity. If D is shown to be robust to these noises, CT data not otherwise useful could be utilized for emphysema research. In addition, D can be used to assess patients with large bullae in the lungs. Although these bullae may have a great effect on EI%, they have little impact on emphysematous hole-size distribution. Additional studies on the robustness of D should assess these possible confounding factors.
Limitations
Although D was associated with EI% and clinical COPD indices, it could not be compared with histological characteristics, as none of the included patients underwent biopsy sampling. Because the algorithm applied a Gaussian low-pass filter iteratively to quantify the sizes of emphysematous holes, the sizes of irregularly shaped holes may have been underestimated. Also, it is not clear whether the progression of emphysema caused a reduction in D or whether patients with smaller D were more susceptible to emphysema. Longitudinal studies should be performed to assess causality and the ability of D to predict the prognosis of patients with COPD.
Conclusion
The D of emphysematous hole-size distribution was found to be an emphysema severity index independent of breath-hold levels. This parameter correlated well with conventional CT-based indices, pulmonary function tests, and quality-of-life indices. D can be measured fully automatically and does not require any additional prescription in image acquisition. D may be especially useful in patients who have difficulty in breathing and those with breath-hold-level issues.
Acknowledgments
The authors thank the members of the KOLD cohort study group and Seung-hyun Choi for improving data visualization and for helpful discussions. This study is supported by a grant from the Korean Health Technology R&D Project, Ministry of Health & Welfare, Republic of Korea (HI11C1552, https://www.khidi.or.kr/eps). The funders had no role in study design, data collection and analysis, decision to publish, or preparation of the manuscript.
Disclosure
The authors report no conflicts of interest in this work.
References
Mannino DM, Buist AS. Global burden of COPD: risk factors, prevalence, and future trends. Lancet. 2007;370(9589):765–773. | ||
Halbert RJ, Natoli JL, Gano A, Badamgarav E, Buist AS, Mannino DM. Global burden of COPD: systematic review and meta-analysis. Eur Respir J. 2006;28(3):523–532. | ||
Hogg JC. Pathophysiology of airflow limitation in chronic obstructive pulmonary disease. Lancet. 2004;364(9435):709–721. | ||
Hogg JC, Chu F, Utokaparch S, et al. The nature of small-airway obstruction in chronic obstructive pulmonary disease. N Engl J Med. 2004;350(26):2645–2653. | ||
Jeffery PK. Remodeling in asthma and chronic obstructive lung disease. Am J Respir Crit Care Med. 2001;164(10 pt 2):S28–S38. | ||
Celli BR, Snider GL, Heffner J, et al. Standards for the diagnosis and care of patients with chronic obstructive pulmonary disease. Am J Respir Crit Care Med. 1995;152(5):S77–S121. | ||
Coxson HO, Dirksen A, Edwards LD, et al; Evaluation of COPD Longitudinally to Identify Predictive Surrogate Endpoints (ECLIPSE) Investigators. The presence and progression of emphysema in COPD as determined by CT scanning and biomarker expression: a prospective analysis from the ECLIPSE study. Lancet Respir Med. 2013;1(2):129–136. | ||
Muller NL, Staples CA, Miller RR, Abboud RT. Density mask: an objective method to quantitate emphysema using computed tomography. Chest. 1988;94(4):782–787. | ||
Lee YK, Oh YM, Lee JH, et al; KOLD Study Group. Quantitative assessment of emphysema, air trapping, and airway thickening on computed tomography. Lung. 2008;186(3):157–165. | ||
Bankier AA, De Maertelaer V, Keyzer C, Gevenois PA. Pulmonary emphysema: subjective visual grading versus objective quantification with macroscopic morphometry and thin-section CT densitometry. Radiology. 1999;211(3):851–858. | ||
Thurlbeck WM, Muller NL. Emphysema: definition, imaging, and quantification. AJR Am J Roentgenol. 1994;163(5):1017–1025. | ||
Madani A, Van Muylem A, de Maertelaer V, Zanen J, Gevenois PA. Pulmonary emphysema: size distribution of emphysematous spaces on multidetector CT images: comparison with macroscopic and microscopic morphometry. Radiology. 2008;248(3):1036–1041. | ||
Gietema HA, Müller NL, Fauerbach PV, et al; Evaluation of COPD Longitudinally to Identify Predictive Surrogate Endpoints (ECLIPSE) investigators. Quantifying the extent of emphysema: factors associated with radiologists’ estimations and quantitative indices of emphysema severity using the ECLIPSE cohort. Acad Radiol. 2011;18(6):661–671. | ||
Barabasi AL, Buldyrev SV, Stanley HE, Suki B. Avalanches in the lung: a statistical mechanical model. Phys Rev Lett. 1996;76(12):2192–2195. | ||
Boser SR, Park H, Perry SF, Ménache MG, Green FHY. Fractal geometry of airway remodeling in human asthma. Am J Respir Crit Care Med. 2005;172(7):817–823. | ||
Nelson TR, West BJ, Goldberger AL. The fractal lung: universal and species-related scaling patterns. Experientia. 1990;46(3):251–254. | ||
Robertson HT, Altemeier WA, Glenny RW. Physiological implications of the fractal distribution of ventilation and perfusion in the lung. Ann Biomed Eng. 2000;28(8):1028–1031. | ||
Sujeer MK, Buldyrev SV, Zapperi S, Andrade JS, Stanley HE, Suki B. Volume distributions of avalanches in lung inflation: a statistical mechanical approach. Phys Rev E. 1997;56(3):3385–3394. | ||
Weibel ER. Fractal geometry: a design principle for living organisms. Am J Physiol. 1991;261(6 pt 1):L361–L369. | ||
Mishima M, Hirai T, Itoh H, et al. Complexity of terminal airspace geometry assessed by lung computed tomography in normal subjects and patients with chronic obstructive pulmonary disease. Proc Natl Acad Sci U S A. 1999;96(16):8829–8834. | ||
Tanabe N, Muro S, Sato S, et al. Longitudinal study of spatially heterogeneous emphysema progression in current smokers with chronic obstructive pulmonary disease. PLoS One. 2012;7(9):e44993. | ||
Park TS, Lee JS, Seo JB, et al; KOLD Study Group. Study design and outcomes of Korean obstructive lung disease (KOLD) cohort study. Tuberc Respir Dis (Seoul). 2014;76(4):169–174. | ||
Gevenois PA, Demaertelaer V, Devuyst P, Zanen J, Yernault JC. Comparison of computed density and macroscopic morphometry in pulmonary-emphysema. Am J Respir Crit Care Med. 1995;152(2):653–657. | ||
Lee M, Kim N, Lee SM, Seo JB, Oh SY. Size-based emphysema cluster analysis on low attenuation area in 3D volumetric CT: comparison with pulmonary functional test. Paper presented at: Proc SPIE 9417, Medical Imaging 2015: Biomedical Applications in Molecular, Structural, and Functional Imaging, 94172V; March 17, 2015; Orlando, FL, USA. | ||
Bland JM, Altman DG. Measuring agreement in method comparison studies. Stat Methods Med Res. 1999;8(2):135–160. | ||
Bartko JJ. The intraclass correlation coefficient as a measure of reliability. Psychol Rep. 1966;19(1):3–11. |
Supplementary material
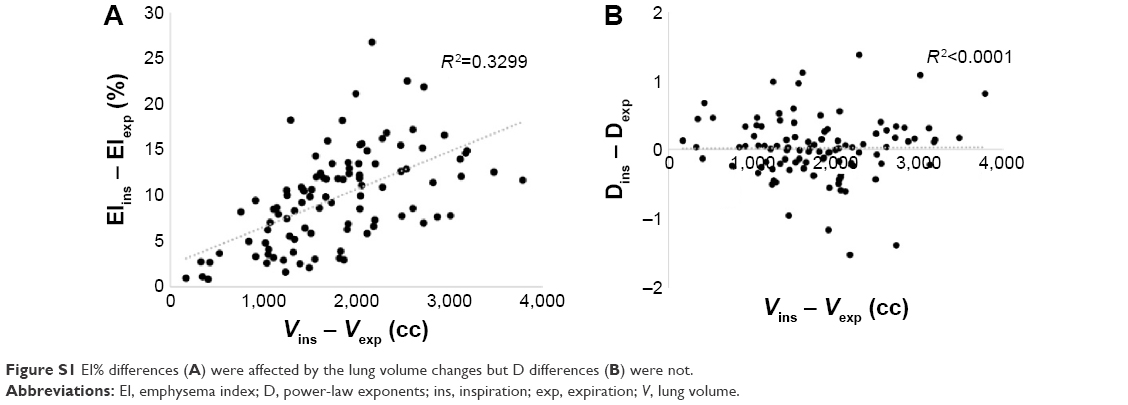 | Figure S1 EI% differences (A) were affected by the lung volume changes but D differences (B) were not. |
 © 2016 The Author(s). This work is published and licensed by Dove Medical Press Limited. The full terms of this license are available at https://www.dovepress.com/terms.php and incorporate the Creative Commons Attribution - Non Commercial (unported, v3.0) License.
By accessing the work you hereby accept the Terms. Non-commercial uses of the work are permitted without any further permission from Dove Medical Press Limited, provided the work is properly attributed. For permission for commercial use of this work, please see paragraphs 4.2 and 5 of our Terms.
© 2016 The Author(s). This work is published and licensed by Dove Medical Press Limited. The full terms of this license are available at https://www.dovepress.com/terms.php and incorporate the Creative Commons Attribution - Non Commercial (unported, v3.0) License.
By accessing the work you hereby accept the Terms. Non-commercial uses of the work are permitted without any further permission from Dove Medical Press Limited, provided the work is properly attributed. For permission for commercial use of this work, please see paragraphs 4.2 and 5 of our Terms.