")
Back to Journals » OncoTargets and Therapy » Volume 13
A Six-Epithelial–Mesenchymal Transition Gene Signature May Predict Metastasis of Triple-Negative Breast Cancer
Authors Wei LY , Zhang XJ, Wang L, Hu LN , Zhang XD , Li L , Gao JN
Received 10 April 2020
Accepted for publication 13 June 2020
Published 3 July 2020 Volume 2020:13 Pages 6497—6509
DOI https://doi.org/10.2147/OTT.S256818
Checked for plagiarism Yes
Review by Single anonymous peer review
Peer reviewer comments 2
Editor who approved publication: Professor Gaetano Romano
Li Yuan Wei,1,* Xiao Jun Zhang,1,* Li Wang,2 Li Na Hu,3 Xu Dong Zhang,4,5 Li Li,3 Jin Nan Gao1
1Department of Breast Surgery, Shanxi Bethune Hospital, Taiyuan, People’s Republic of China; 2School of Basic Medicine Sciences, Academy of Medical Science, Zhengzhou University, Henan 450053, People’s Republic of China; 3Department of Pathology, Shanxi Bethune Hospital, Taiyuan, People’s Republic of China; 4Translational Research Institute, Henan Provincial People’s Hospital, Academy of Medical Science, Zhengzhou University, Henan 450053, People’s Republic of China; 5School of Biomedical Sciences and Pharmacy, The University of Newcastle, Callaghan, NSW, Australia
*These authors contributed equally to this work
Correspondence: Jin Nan Gao
Department of Breast Surgery, Shanxi Bethune Hospital, Taiyuan 030000, People’s Republic of China
Tel +86 0351- 8379761
Email [email protected]
Li Li
Department of Pathology, Shanxi Bethune Hospital, Taiyuan 030000, People’s Republic of China
Tel +86-13453163501
Email [email protected]
Purpose: Pathological complete response (pCR) to neoadjuvant chemotherapy (NACT) is associated with favourable outcomes of patients with triple-negative breast cancer (TNBC). However, a proportion of TNBC patients with the residual disease do not relapse and achieve long-term survival. The aim of this study was to identify biomarkers that predict clinical outcomes in these patients.
Patients and Methods: A retrospective series of 10 TNBC patients who displayed non-pCR to NACT were included in the discovery cohort. Total RNA from pre-NACT core biopsies and paired surgical specimens were subjected to the Affymetrix Human Transcriptome Array. Gene set enrichment analysis (GSEA) was used to identify signal pathways and gene signatures associated with metastasis. The Cox proportional hazard model and Kaplan–Meier survival curves were employed to assess the prognostic value of the identified signature in two independent TNBC datasets included in Gene Expression Omnibus (GEO).
Results: The epithelial–mesenchymal transition (EMT) pathway was markedly more enriched in pre- (NES = 1.92; p.adjust = 0.019) and post-NACT samples (NES = 2.02; p.adjust = 0.010) from patients who developed metastasis after NACT. A subset of 6 EMT genes including LUM, SFRP4, COL6A3, MMP2, CXCL12, and HTRA1 were expressed constantly at higher levels in samples from patients who progressed to metastatic disease. The potential of the 6-EMT gene signature to predict TNBC metastasis after NACT was validated with a GEO dataset (HR=0.36, p=0.0008, 95% CI: 0.200– 0.658). Moreover, the signature appeared of predictive value in another GEO dataset of TNBC patients who received surgery followed by adjuvant chemotherapy (HR = 0.46, 95% CI: 0.225– 0.937).
Conclusion: Expression analysis of the 6-EMT gene signature at diagnosis may be of predictive value for metastasis in TNCB patients who did not achieve pCR to NACT and for patients treated with surgery in combination with adjuvant therapy.
Keywords: triple-negative breast cancer, neoadjuvant chemotherapy, epithelial–mesenchymal transition, distant metastasis
Introduction
Triple-negative breast cancer (TNBC) is characterized immunohistochemically by the absence of estrogen receptor (ER), progesterone receptor (PR) and human epidermal growth factor receptor-2 (HER2), though HER2 deficiency is also defined as the lack of genomic amplification of the gene encoding HER2 as measured using fluorescence in situ hybridization (FISH).1 It constitutes approximately 15–20% of all breast cancers with a higher incidence in young individuals and is commonly of higher grade.2 TNBC is also more aggressive and has greater potential to metastasize to distant sites. Patients with TNBC often suffer from worse clinical outcomes as evidenced by the higher relapse and low survival rates.3,4 Moreover, conventional prognostic markers, such as patient age, tumour size and lymph node involvement are seldomly associated with distant metastasis in TNBC patients.5
Despite the advance in the treatment of other types of breast cancers using endocrine therapy and targeted therapy,6,7 non-surgical management of TNBC remains largely limited to chemotherapy, alone or in combination with poly (ADP-ribose) polymerase (PARP) inhibitors in patients with germline breast cancer gene (BRCA) mutations.8 In particular, neoadjuvant chemotherapy (NACT) is often applied to TNBC patients prior to surgery with an aim to reduce local tumour masses and thus increase the operability and achieve a better cosmetic outcome.9 A pathological complete response (pCR), which is defined as the absence of residual invasive lesions in both breasts and axilla after NACT,10 is associated with favourable disease-free survival (DFS) and overall survival (OS),11,12 and is thus a prognostic marker of TNBC patients.11 Moreover, pCR is commonly used as a surrogate endpoint in clinical trials for developing new NACT drugs or approaches in the treatment of TNBC.13 Nevertheless, fewer than half of TNBC patients achieve pCR.14 Of note, a proportion TNBC patients with residual diseases do not relapse and can achieve long-term survival.15 This calls for further development of tools to predict clinical outcomes of TNBC patients who do not achieve pCR to NACT.
The diverse responses and outcomes in TNBC patients treated with NACT are closely associated with the biologically heterogeneous nature of the disease.2,16 Indeed, according to gene expression profile analyses, TNBC has been dissected into either four or seven genetically distinct subtypes.17,18 For example, the seven-subtype classification independently predicted pCR to NACT in TNBC patients. However, it was not associated with distant metastasis-free survival (DMFS) and OS.19 Similarly, the PAM50 subtype predictor that characterizes intrinsic subtypes of breast cancer using a 50-gene assay predicted pCR to NACT across all breast cancer subtypes, but none of the PAM50 signatures at diagnosis is associated with pCR when the analysis was confined to TNBC.20 Moreover, a number of studies have demonstrated the potential of epigenetic signatures and tumour infiltrating immunophenotypes as predictive and prognostic tools in TNBC patients treated with NACT.21,22
In this study, we have compared gene expression profiles in paired TNBC tissues from patients pre- and post-NACT. We report here that a group of six-epithelial–mesenchymal transition (EMT) genes were expressed at higher levels in TNBC tumours before and after NACT in patients who developed distant metastasis than those who did not, and that these EMT genes were further upregulated in post-NACT residue tumours compared with prior-NACT samples. Interrogating Gene Expression Omnibus (GEO) TNBC datasets validated the 6-EMT gene signature to be predictive of metastasis after NACT and moreover demonstrated that this signature may also serve as a predictive tool of metastasis in TNBC patients treated with surgery followed by adjuvant chemotherapy.
Patients and Methods
Patients and Samples
The discovery cohort consisted of ten retrospectively recruited TNBC patients who received NACT and displayed locally invasive residual disease in the breast and/or regional lymph nodes. All patients received the EC-T regimen (4 cycles of doxorubicin combined with cyclophosphamide followed by 4 cycles of docetaxel or paclitaxel according to the National Comprehensive Cancer Network Guideline23) before surgery at the Department of Breast Surgery of Shanxi Bethune Hospital (Taiyuan, Shanxi, China) between 2014 and 2018. Paired formalin-fixed paraffin-embedded (FFPE) pre-NACT core needle biopsy tissues and post-NACT samples were retrieved from the Department of Pathology of Shanxi Bethune Hospital. All patients gave their written informed consent with the study independently approved by the ethics committee/institutional review board of the Shanxi Bethune Hospital. Validation cohorts used were the MD Anderson Cancer Center (MDACC)-based (Texas, Houston, USA) study that included 178 TNBC patients who received NACT before surgery (GEO dataset GSE25066) and an ICO-UMGC-based (Saint Herblain, France) cohort that encompassed 107 TNBC patients treated with adjuvant chemotherapy following surgery (GSE103091).
Profiling of RNA Expression
Total RNA of FFPE TNBC tissues were subjected to the Affymetrix Human Transcriptome Array to profile the expression of mRNAs after verification of the diagnosis using H&E staining and immunohistochemistry (IHC) with or without FISH tests. Five 10μm FFPE sections were collected for each sample and total RNA extracted using the RecoverAllTM Total Nucleic Acid Isolation Kit (Thermo Scientific, AM1975) with purification using the QIAGEN RNeasy® Mini Kit (Qiagen, 74,104). RNA samples were quantified by NanoDrop ND-2000 (Thermo Scientific) and all considered adequate for microarray analysis (the optical density 260/280 >1.8; total RNA yield >100ng). Samples were then transcribed to double stranded cDNAs, labeled with biotin, and hybridized onto the microarray (GeneChip® Hybridization, Wash, and Stain Kit, Affymetrix, 900,720) followed by scanning with the Affymetrix Scanner 3000 (Affymetrix).
Differential Expression and Gene Signature Analysis
Raw microarray data were extracted using the Affymetrix GeneChip Command Console software (v4.0, Affymetrix) and normalized with RMA Method by Expression Console software (v1.3.1, Affymetrix). Differentially expressed transcripts were identified using the Limma package in R platform (v3.6.2)24 comparing patients with and without development of metastasis after NACT. Fold changes were determined for each case pre- and post-NACT and differences with a |logFC| (log2 fold change)≥1 and a p-value <0.05 were considered significant. The differentially expressed genes were illustrated in volcano plots and heatmaps using ggplot2 and pheatmap packages in R platform, respectively. Gene set enrichment analysis (GSEA) was performed to identify the biological pathways and gene signatures associated with metastasis after NACT by the ClusterProfiler package in R software,25 with the Hallmark gene set, downloaded from MSigDB (Molecular Signatures Database; https://www.gsea-msigdb.org/gsea/msigdb/index.jsp). Gene sets with a normalized enrichment score (NES) ≥1 or ≤-1 and a false discovery rate (FDR) <0.05 after 1000-time permutations were considered enriched significantly. The distribution of common genes was depicted in Venn diagrams (http://bioinformatics.psb.ugent.be/webtools/Venn). The correlation among the selected genes was assessed and visualized by the Hmisc package with Pearson analysis in the R platform.
Statistical Analyses
Prognostic analyses were conducted using R software and survival curves generated with GraphPad Prism 8 software. Mann–Whitney U-test was used to determine the difference between groups. The Cox proportional hazard model was employed to assess the prognostic value of the identified signature. The weighted linear prognostic model combined with gene expression in validation cohorts were used to calculate the prognostic scores of the selected gene signature, and Uno’s concordance index (C-index)26 was used to quantify the accuracy of predicted models in different validated datasets. A patient was classified into the high-risk (with a prognostic score of the signature higher than the cut-off value) or the low-risk (with a prognostic score lower than the cut-off value) group. A cut-off value calculated by Youden index from the time-dependent receiver operating characteristic (ROC) curve.27 The log-rank method (Mantel-Haenszel test) was employed to compare the DMFS between the high- and low-risk group, which was depicted with Kaplan–Meier estimators of the survival function.28 A two-tailed P value <0.05 with 95% CI (Confidence intervals) was considered significant.
Unless otherwise stated, statistical analyses were performed by SPSS software, version 23.0 (IBM Corp., Armonk, NY).
Results
Patient and Disease Characteristics
The demographic information of TNBC patients included in the discovery cohort and the clinicopathological characteristics of their tumours are summarized in Table 1. All patients were initially diagnosed through H&E staining of core needle biopsy tissues in conjunction with immunohistochemistry (IHC) to detect ER, PR and HER2. FISH analysis was conducted to further clarify HER2 mRNA positivity if IHC staining of the HER2 protein in a case was scored ++ according to the guidelines of the American Society of Clinical Oncology (ASCO).29 All patients underwent NACT with doxorubicin/cyclophosphamide followed by docetaxel or paclitaxel (EC-T) before surgery. The patients were reassessed using ultrasonography and mammography after completion of NACT. According to the response evaluation criteria in solid tumours (RECIST),30 five patients reached partial response (PR) and 4 exhibited stable disease (SD), whereas the other 1 developed progressive disease (PD). The median follow-up time of these patients was 25 months, ranging from 14 to 67 months. One patient developed multiple metastatic lesions in the lung, brain, and bone in the 14th month during follow-up, and another was detected with multiple metastases in the lung and bone in the 17th month. The remainders were distant metastasis-free at the latest follow-up.
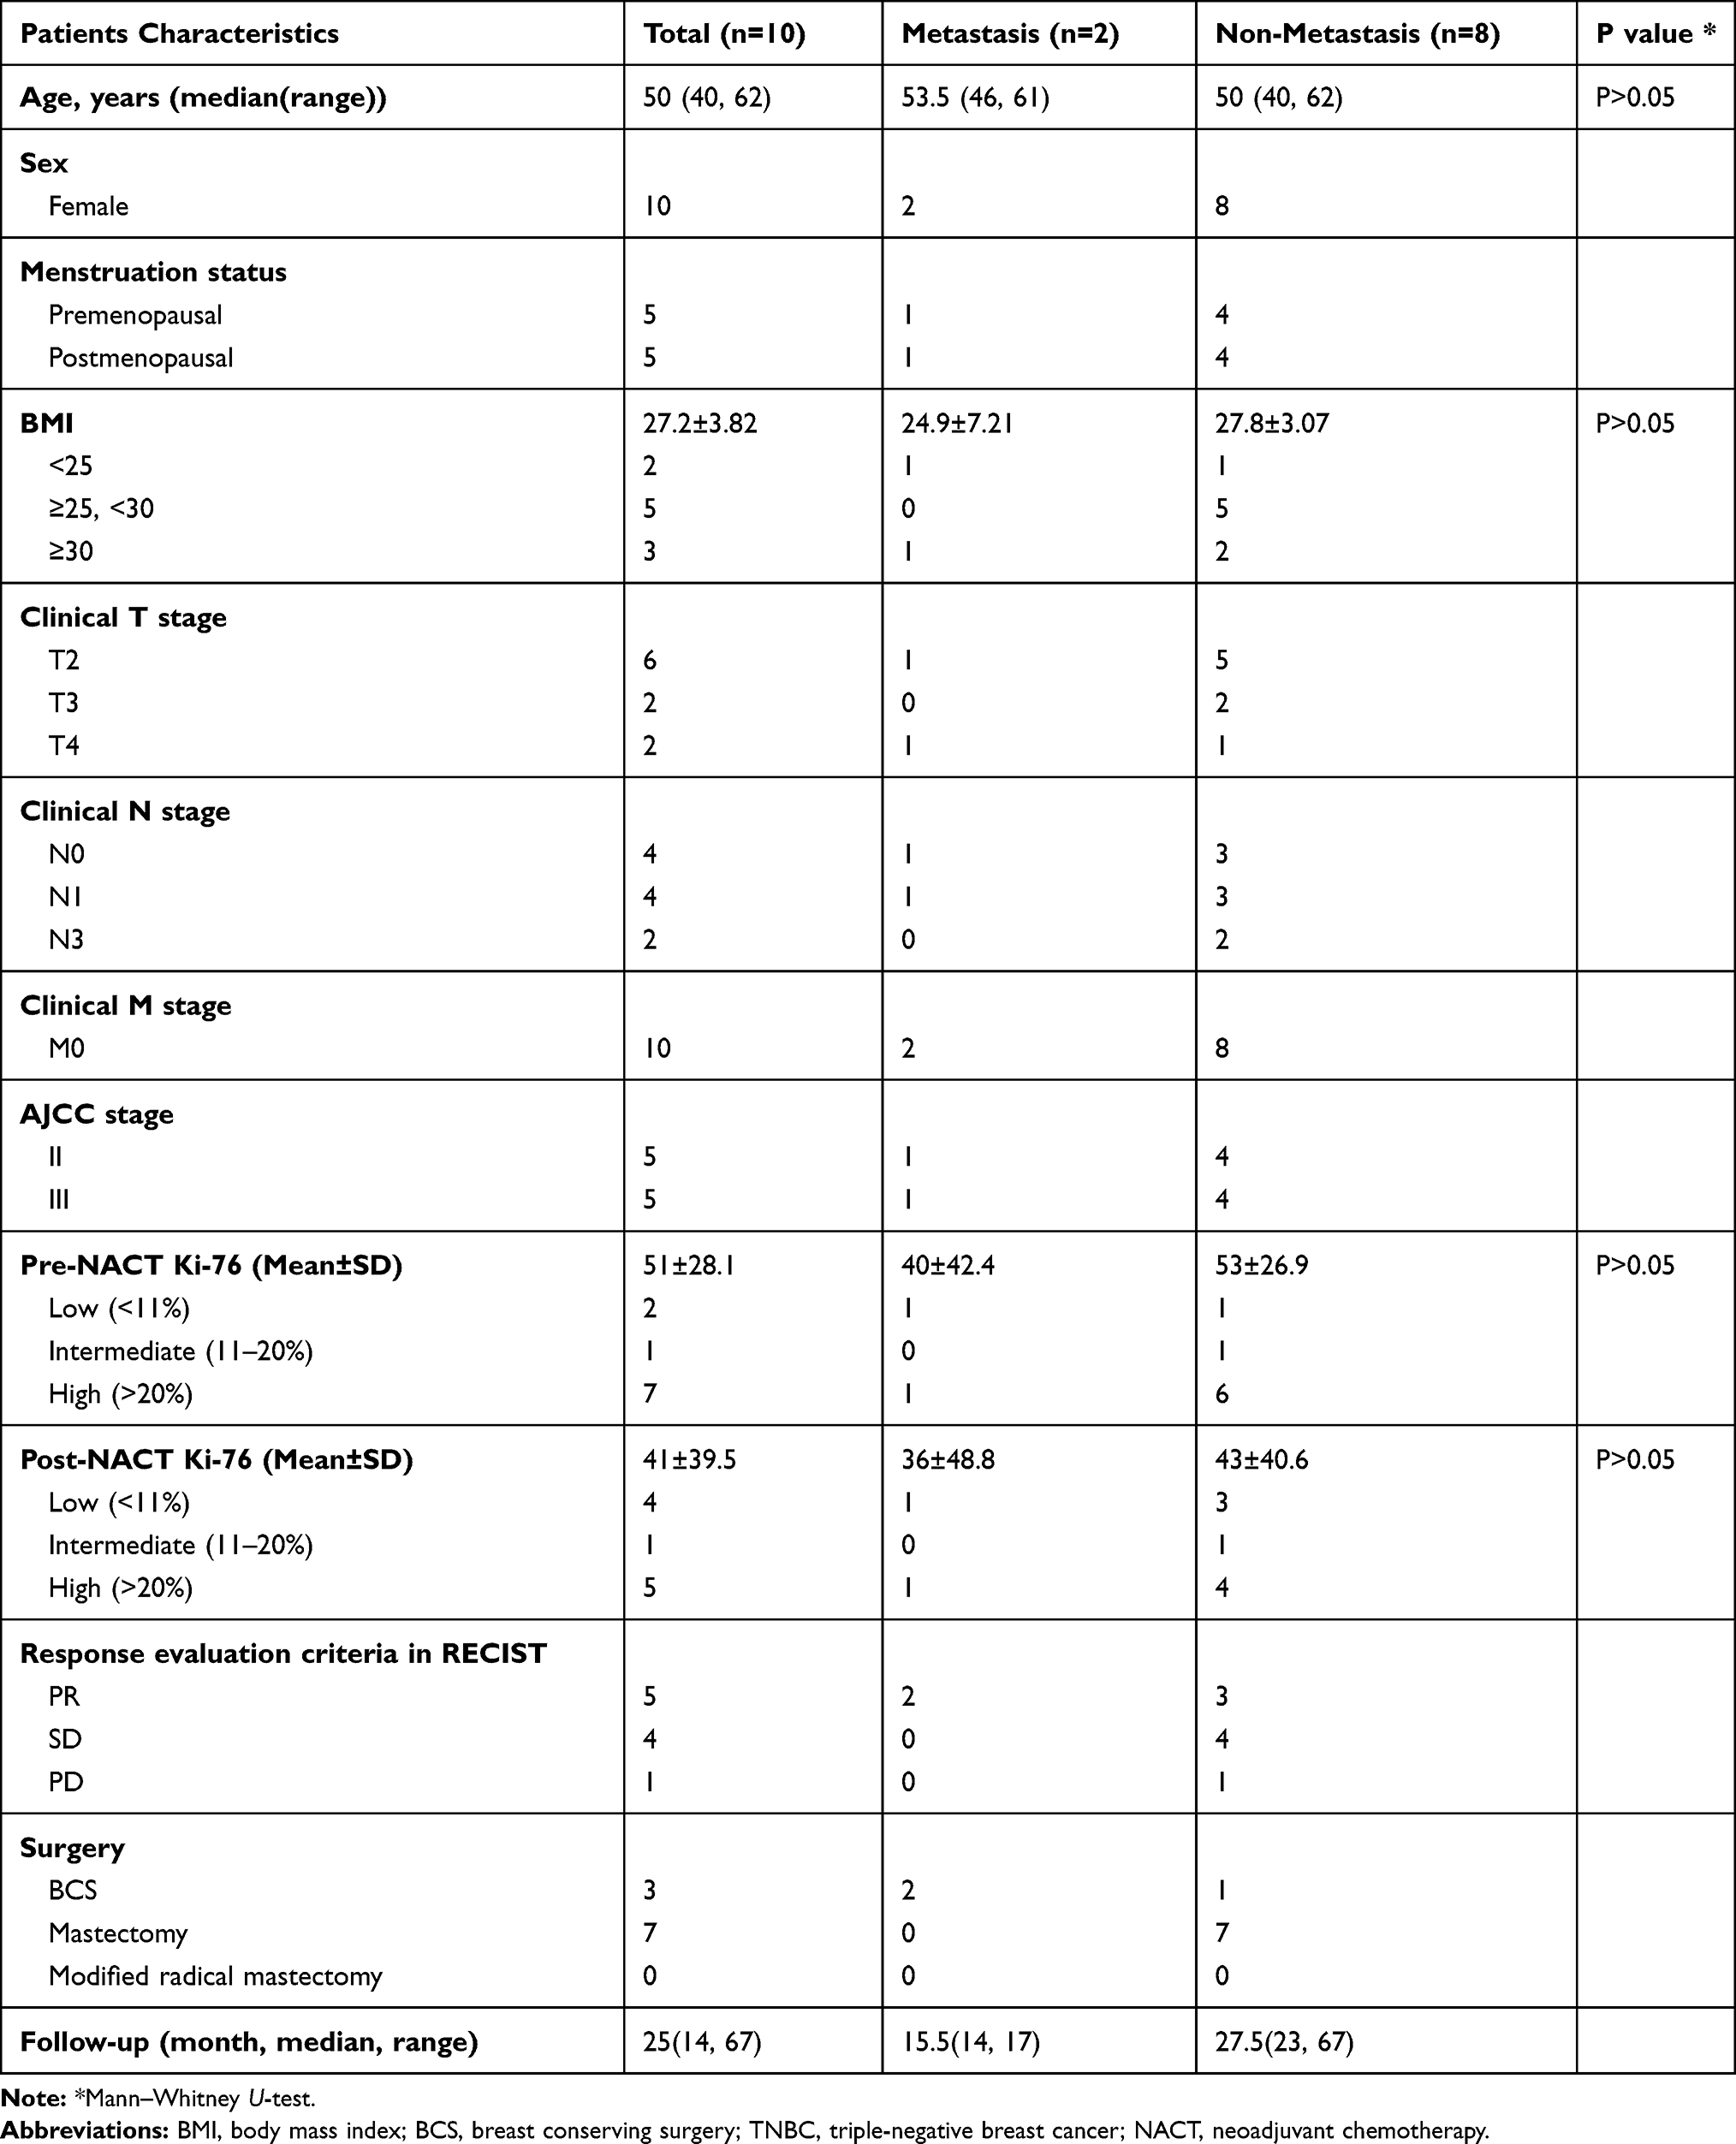 |
Table 1 Characteristics of TNBC Patients and Tumors |
Post-NACT Metastasis of TNBC Is Associated with High Expression of EMT Genes
We carried out microarray-based transcriptomic profiling of paired TNBC tissues before and after NACT (Figure 1). To identify genes potentially involved in metastasis after NACT followed by surgery, we divided patients into metastasis and non-metastasis groups based on whether metastatic lesions were detected at the latest follow-up. Comparative analyses identified 699 significantly upregulated genes and 129 downregulated genes in tumours from the metastasis group at diagnosis (logFC ≥ 1 or =< −1, P<0.05). Similarly, 687 genes were found to be expressed at higher levels whereas 62 genes at lower levels in tumours of the metastasis group after NACT (logFC ≥ 1 or =< −1, P<0.05) (Figure 1A and B; Supplementary Table 1). Hierarchical clustering analysis showed that the tumours in the metastasis group displayed strong similarity in their transcriptomic profiles, whereas the tumours in the non-metastasis groups exhibited wide variations in the composition of their transcriptomes (Figure 1C and D). Consistent with the critical role of EMT in metastasis,31,32 gene set enrichment analysis (GSEA) based on hallmark gene sets revealed that the EMT pathway was highly augmented among the 10 most significantly enriched pathways in metastasis tumours before and after NACT (Figure 2 and Supplementary Table 2).
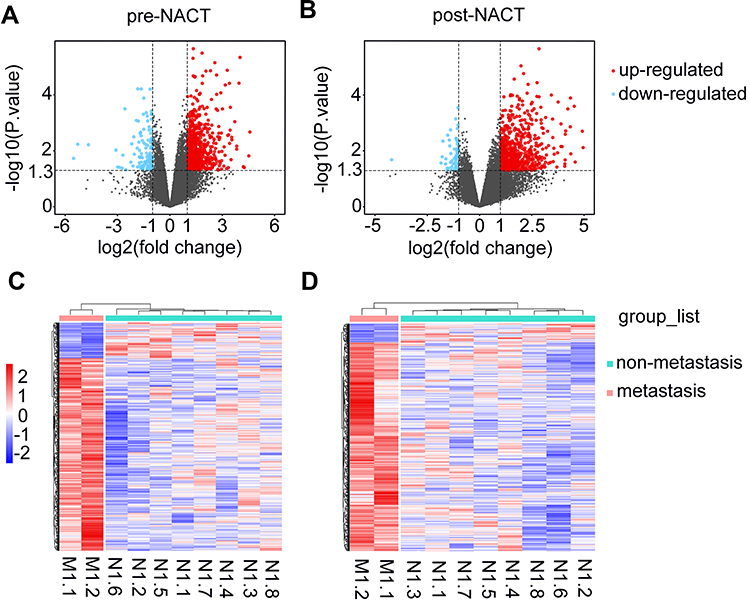 |
Figure 1 Comparison of transcriptomic profiles of TNBCs between the metastasis and non-metastasis group. (A and B) Volcano plots of transcripts of TNBCs of metastasis group relative to non-metastasis group at diagnosis (A) or post-NACT (B). Red and blue dots represent up-regulated and down-regulated genes with |log2(fold change)|≥1.0 and p values <0.05, respectively. (C and D) Heat maps with clusters of differentially expressed genes with |log2(fold change)|≥1.0 and p values <0.05 at diagnosis (C) and post-NACT (D). Abbreviations: M, metastasis; N, non-metastasis; TNBC, triple-negative breast cancer; NACT, neoadjuvant chemotherapy. |
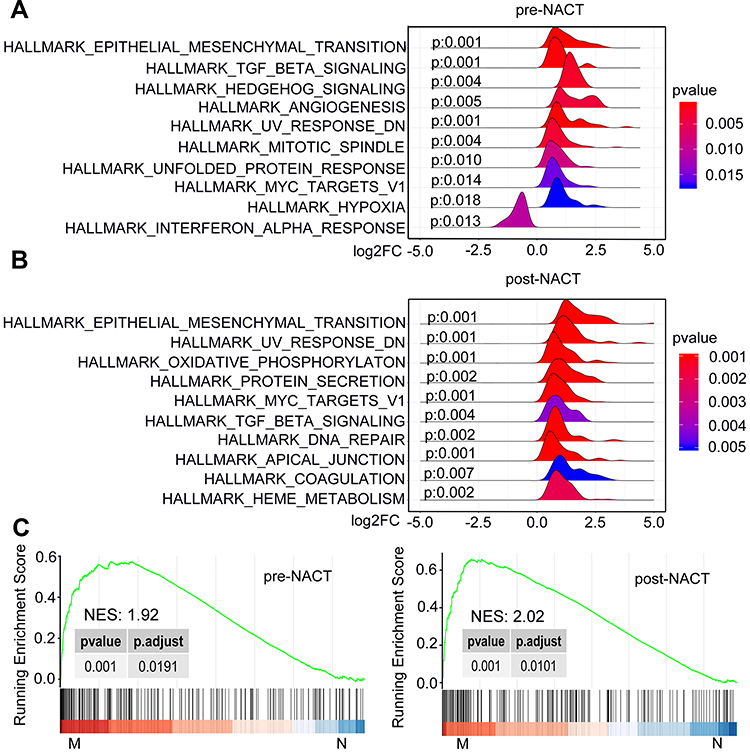 |
Figure 2 GSEA plots depicting the enrichment of signal pathways in tumors of the metastasis relative to non-metastasis group. (A and B) Ridgeline plots of the 10 most significantly enriched pathways based on the hallmark gene sets at diagnosis (A) and post-NACT (B). (C) The EMT pathway is positively enriched in tumors of the metastasis group relative to non-metastasis group at diagnosis (left) and post-NACT (right). Abbreviations: M, metastasis; N, non-metastasis; NES, normalized enrichment score; NACT, neoadjuvant chemotherapy; EMT, epithelial–mesenchymal transition. |
Differential Responses of EMT Genes to EC-T NACT
Having found that the EMT pathway is positively enriched in TNBC tumours that developed metastatic lesions, we examined the potential effect of EC-T NACT on the expression of EMT genes. Strikingly, the EMT pathway responded differently to EC-T NACT in the two metastasis cases. In metastasis case 1, the EMT pathway was further positively enriched post-NACT whereas in metastasis case 2 this pathway was negatively enriched in the post-NACT tumour compared with the pre-NACT tumour (Figure 3A). There were subsets of EMT genes in cases of the metastasis group remained unchanged or were downregulated after NACT (Figure 4A; Supplementary Table 3). Nevertheless, there were 15 EMT genes that were commonly increased in the two metastasis cases, including 2 genes that were upregulated in both cases before NACT, 6 genes that were upregulated in both cases after NACT and 7 genes, before and after NACT (Figure 4A; Supplementary Table 3). Among these 15 EMT genes were 7 genes including lumican (LUM), secreted frizzled-related protein 4 (SFRP4), collagen type VI alpha 3 chain (COL6A3), matrix metalloproteinase-2 (MMP2), C-X-C Motif Chemokine Ligand 12 (CXCL12), decorin (DCN), and high-temperature requirement A serine peptidase 1 (HTRA1) that were commonly expressed at higher levels in each of the tumour in the metastasis group before and after NACT (Figure 4A), suggestive of the potential importance of these genes in metastasis of TNBC after EC-T NACT. As depicted in the correlation matrices (Figure 4B and C), although the expression levels of these 7 EMT genes were largely correlated with one another before NACT (Figure 4B), the expression of COL6A3 was disassociated with the others after NACT (Figure 4C). This finding implied that the other 6 genes (LUM, SFRP4, MMP2, CXCL12, DCN, and HTRA1) were most likely associated with TNBC metastasis after NACT. Similar to the differential responses of EMT genes in the metastasis cases, the EMT genes the non-metastasis group were either increased or decreased after NACT in a patient-dependent manner (Figure 3B).
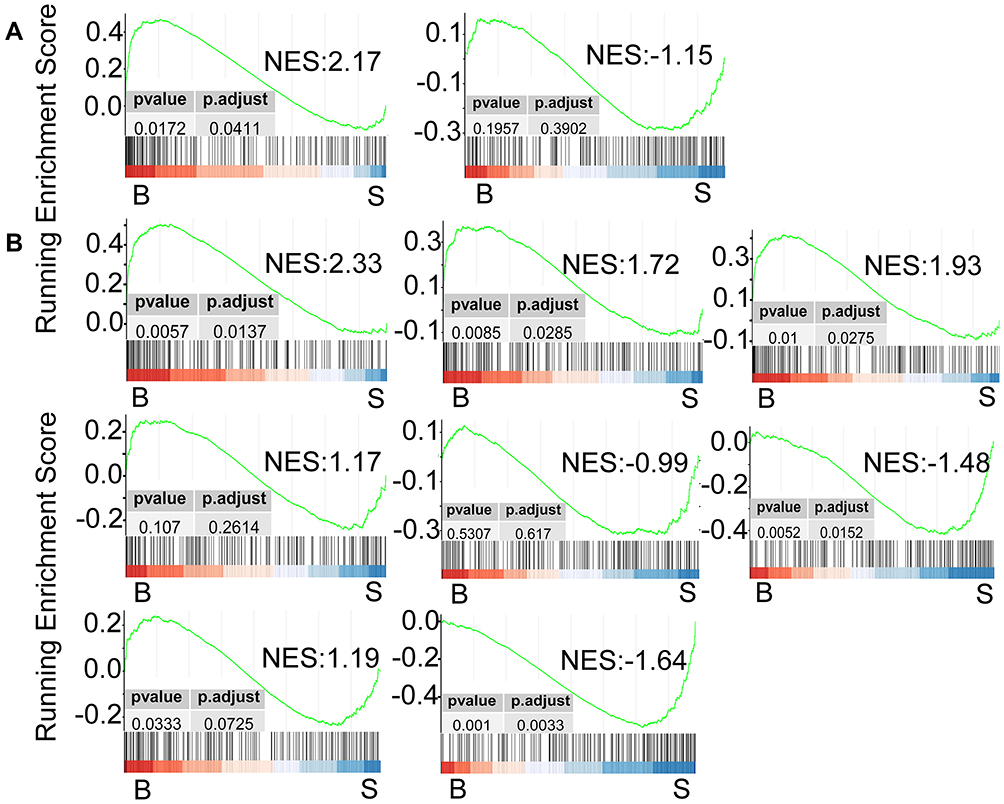 |
Figure 3 GESA plots based on the hallmark gene sets depicting the differential enrichment of the EMT pathway caused by NACT in the individual patients from the metastasis group (A) and the non-metastasis group (B). Abbreviations: B, biopsy samples before the NACT treatment; S, surgery specimens after finishing the NACT treatment; NES, normalized enrichment score; EMT, epithelial–mesenchymal transition; NACT, neoadjuvant chemotherapy. |
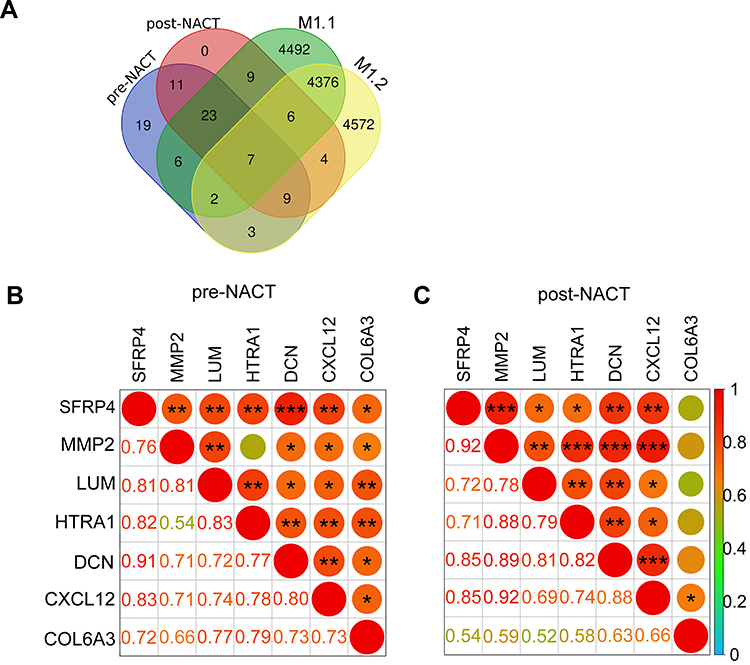 |
Figure 4 (A) The Venn diagram displaying the overlaps among the upregulated EMT genes in pre-NACT (purple) and post-NACT (pink) NACT tumors in the metastasis group. The EMT genes that were upregulated in each of the post-NACT compared with pre-NACT tumors in the metastasis group were also depicted (green and yellow). (B and C) Pearson correlation matrices describing the relationships among the indicated 7 genes in paired tumors pre- (B) and post-NACT (C). The Pearson ρ coefficients were exhibited in various size of circles as well as the shade of colors. Numbers represent the exact values of coefficients. *P<0.05; **P <0.01; ***P <0.001. Abbreviations: M, metastasis; EMT, epithelial–mesenchymal transition; NACT, neoadjuvant chemotherapy. |
The Six-EMT Gene Signature Predicts Post-NACT Metastasis of TNBC
To test the strength of the 6-EMT gene signature in predicting metastasis of TNBC after NACT, we analysed transcriptomic data at diagnosis from the MD Anderson Cancer Center (MDACC)-based cohort of 178 TNBC patients who received sequential taxane and anthracycline neoadjuvant chemotherapy, inclusive of 113 patients who did not achieve pCR (GSE25066).33 Among these 113 patients, 55 developed distant metastases, whereas the remaining 58 patients were metastasis-free at the last follow-up (Table 2).
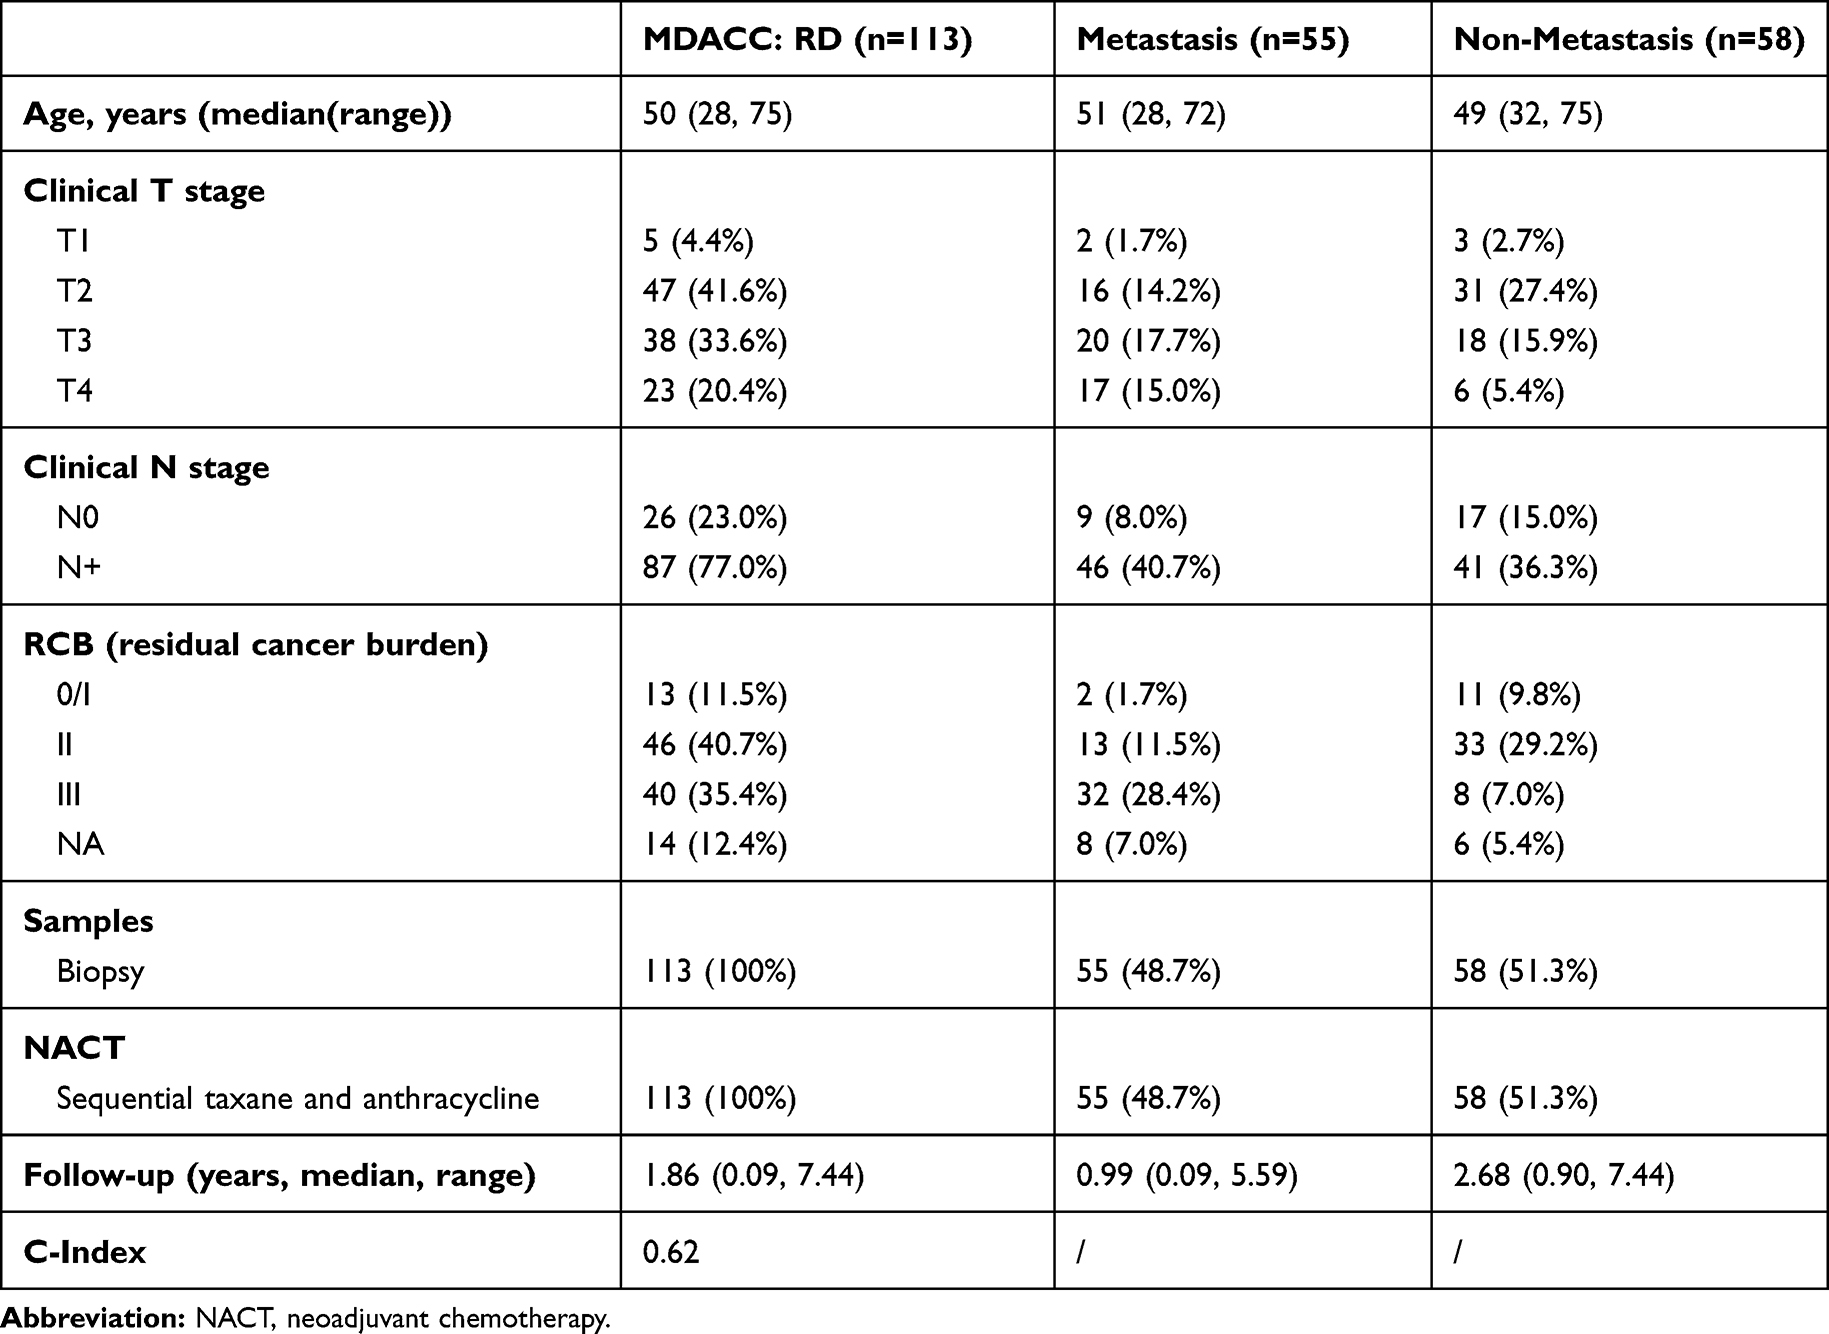 |
Table 2 Patients’ Characteristics in the MDACC Validation Sets |
A time-dependent ROC curve with an AUC (area under curve) at 0.63 (p=0.014) demonstrated the ability of the 6-EMT signature to predict metastasis at 18 months after initial diagnosis in the 113 non-pCR patients (Figure 5A). When the Cox proportional hazard model was applied, an optimal cut-off value of 0.1261 was derived through the Youden index for stratifying patients with and without development of metastasis after NACT (sensitivity: 47.27%; specificity: 79.31%).27 By use of this cut-off value, the 113 patients were divided into high- and low-risk groups. A patient with a predicted score higher than or equal to 0.1261 was assigned to the high-risk group, whereas a patient with a predicted score lower than 0.1261, the low-risk group. The distribution of the prognostic score and the status of metastasis of each patient are shown in Figure 5B. Notably, patients with higher prognostic scores (n=38) appeared prone to metastasis (p=0.0008, HR=0.36, 95% CI: 0.200–0.658) (Figure 5C). Together these results suggest that the 6-EMT gene signature at diagnosis may be useful for prediction of metastasis of TNBC patients who do not achieve pCR to NACT.
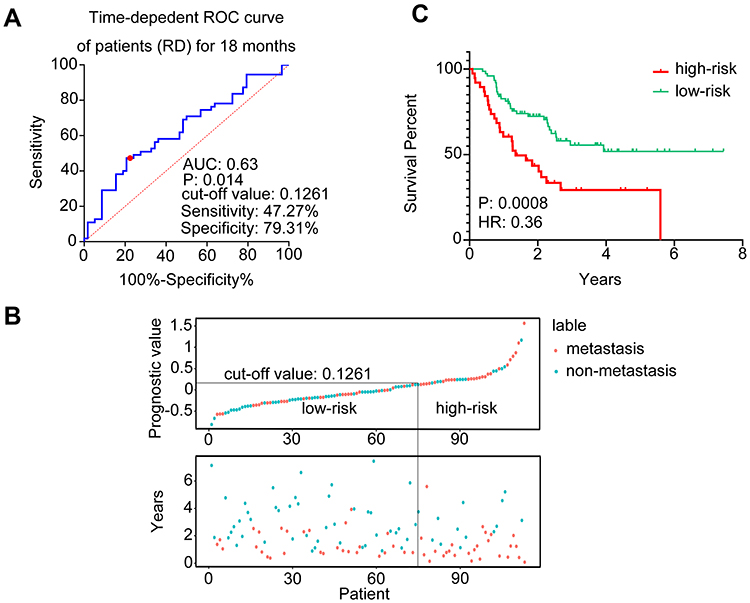 |
Figure 5 Validation of the 6-EMT gene signature in the MDACC-based cohort of the GEO dataset (GSE25066). (A) A time-dependent ROC curve for 18 months among the TNBC patients with residual disease after NACT. The cut-off value was generated with the highest specificity and sensitivity (Youden Index). (B) The distribution of the prognostic values of the TNBC patients with residual disease (top panel) and the corresponding distant relapse-free survival for each patient (bottom panel). Patients were divided into high-risk (right part) and low-risk (left part) groups by a line in the diagram, according to the cut-off value (0.126). (C) Kaplan–Meier analysis of the probability of metastasis-free survival of the patients with residual disease post-NACT in the MADACC cohort. Abbreviations: EMT, epithelial–mesenchymal transition; ROC, receiver operating characteristic curve; AUC, area under curve; RD, residual disease; HR, hazard ratio; TNBC, triple-negative breast cancer; NACT, neoadjuvant chemotherapy. |
The 6-EMT Gene Signature Predicts Metastasis in TNBC Patients Without NACT
To further validate the significance of the 6-EMT gene signature in predicting TNBC metastasis, we applied the Cox proportional hazard model using the cut-off value of 0.1261 to the ICO-UMGC-based cohort comprised 107 TNBC patients treated with adjuvant chemotherapy following surgery, including 31 patients who developed distant metastases during follow-up (GSE103091, Table 3).34 Similar to the observations made with the MDACC-based cohort, the 6-EMT signature classifier divided the 107 patients into high- and low-risk groups based on the optimal cut-off value (0.1261; Figure 6A) with a C-index at 0.66, and the patients with higher prognostic scores (n=48) appeared prone to metastasis (p=0.032, HR=0.46, 95% CI: 0.225–0.937) (Figure 6B). When time-dependent ROC curves created at 1.5, 3, and 5 years were used to evaluate the power of the 6-gene signature to predict metastasis, the AUC increased progressively from 0.52 at 1.5 years to 0.70 at 5 years (Figure 6C). These results suggest that the 6-EMT gene signature may also be useful as a predictive marker in TNBC patients who undergo surgery followed by adjuvant chemotherapy.
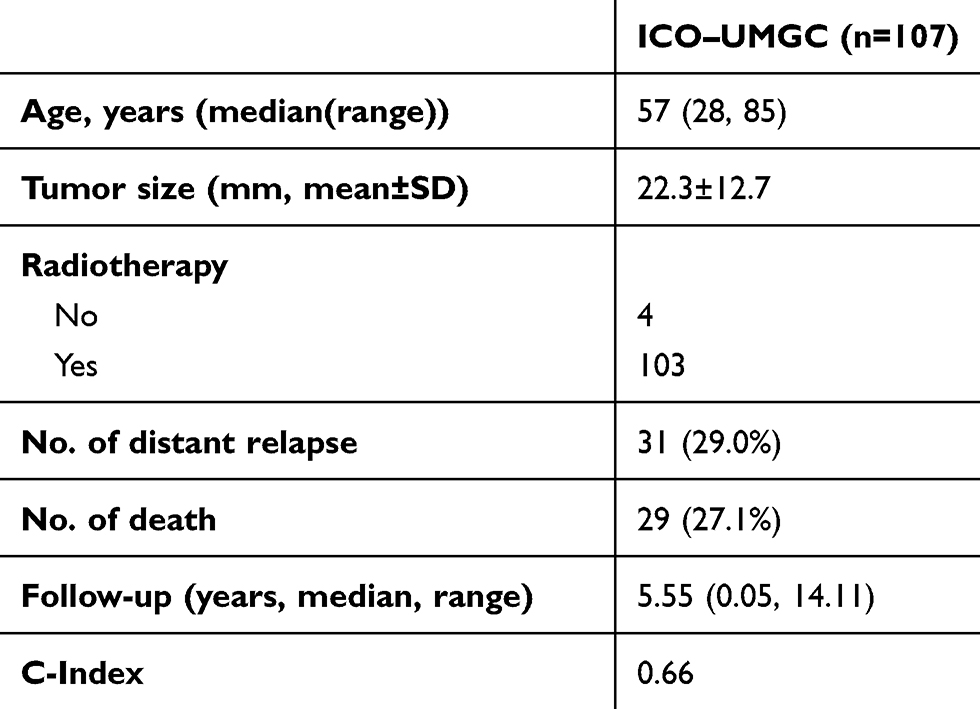 |
Table 3 Patients’ Characteristics in the Extended Validation Sets |
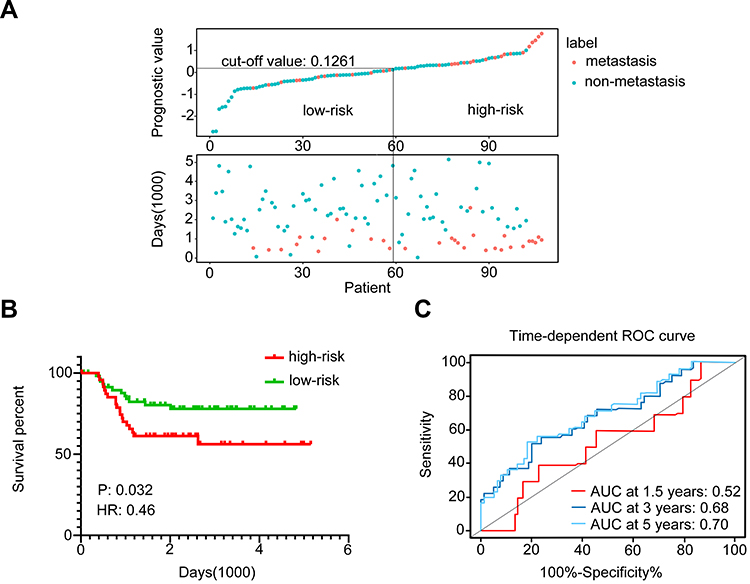 |
Figure 6 The 6-EMT gene signature may predict metastasis of TNBC in patients treated with surgery followed by adjuvant chemotherapy as shown by analysis of the ICO-UMGC-based cohort of the GEO dataset (GSE103091). (A) The distribution of the prognostic values of the 107 TNBC patients who were classified into high-risk and low-risk groups (top panel), and the corresponding distant metastasis-free survival status for each patient (bottom panel). (B) Kaplan–Meier analysis of the probability of metastasis-free survival of the patients in the ICO-UMGC-based cohort. (C) Time-dependent ROC curves for patients in the ICO-UMGC-based cohort. AUCs at 1.5, 3, and 5 years were used to evaluate the accuracy of the prognostic model. Abbreviations: EMT, epithelial–mesenchymal transition; TNBC, triple-negative breast cancer; ROC, receiver operating characteristic; AUC, area under curve; HR, hazard ratio; NACT, neoadjuvant chemotherapy. |
Discussion
Curative treatment of TNBC remains an unmet medical need worldwide and solutions to this problem are hampered by the disease’s inherent heterogeneity.2,16,35 Moreover, genomic evolution resulting from selection pressure afforded by chemotherapy also contributes to the often dismal outcome of patients.35 Although considerable efforts have been made to identify biomarkers and/or molecular targets in order to advance treatment of TNBC,14 longitudinal information concerning the dynamic changes of molecular determinants of diverse TNBC biological behaviours remains scant. By use of paired pre- and post-NACT TNBC tissues, we have identified a 6-EMT gene signature that was not only predictive of metastasis of TNBC after NACT, but also potentially a useful tool for identification of TNBC patients with high metastatic risk who are treated with surgery followed by adjuvant chemotherapy.
As EMT is an enabling feature of cancer cell invasion and metastasis,31,32 it is not surprising that the EMT pathway was positively enriched in TNBCs of the metastasis group compared with those of non-metastasis group before and after NACT. However, it was intriguing that the EMT pathway was either further enhanced or attenuated in TNBCs in both the metastasis and non-metastasis groups, suggesting that the pathway responded to the chemotherapeutic drugs in a highly tumour-dependent manner, consistent with diverse responses of TNBCs to chemotherapy commonly observed in clinical practice.36 Nonetheless, we identified a subset of interrelated EMT genes that were increased in post-NACT relative to pre-NACT tumours. Moreover, these genes were expressed at higher levels in the tumours of the metastasis group compared with those in the non-metastasis group before and after NACT, pointing to the potential importance of these genes in regulating metastasis. Indeed, interrogation of a MDACC-based TNBC cohort that received NACT revealed that the 6-EMT gene signature was predictive of DMFS in those who did not achieve pCR. Unlike those patients in our discovery cohort who received the same NACT regimen, the MDACC patients underwent varying NACT protocols, suggesting that the predictive value of this signature is independent of chemotherapeutic drugs applied.
Further application of 6-EMT gene signature to an ICO-UMGC-based cohort suggested it may also be useful as a predictive marker of metastasis in TNBC patients who do not receive NACT. Although many genetic and epigenetic features have been demonstrated to be potential predictive tools in TNBC,15,37 a predictive biomarker that can be applied broadly to TNBC regardless of the treatment approaches is uncommon. Nevertheless, given the small size of our discovery cohort and the non-coherent nature of the validation cohorts, it is apparent that the usefulness the 6-EMT gene signature needs to be further confirmed in large-scale prospective cohorts of patients. Similarly, whether this signature identifies tumours that overlap with known molecular subtypes of TNBC needs to be clarified. For example, the recently defined claudin-low subtype of TNBC express high levels of EMT genes and is associated with low pCR rates after NACT.38 Should the 6-EMT gene signature withstand further large-scale in-depth validation, it may serve as a useful tool for identifying TNCB patients with a high risk of distant metastasis after NACT who may benefit more from other therapeutic modalities.
Of the proteins encoded by the 6 EMT genes, MMP2 is a member of type IV collagenases that degrades extracellular matrix,39 whereas CXCL12 is a chemokine (C-X-C motif) ligand40 and decorin (DCN), a member of the extracellular matrix small leucine-rich proteoglycan family in the tumor microenvironment that influences the biological behaviour of various types of tumours.41 While the roles of these proteins in breast cancer metastasis have been well established,42–44 the role of HTRA1, a member of the trypsin family of serine proteases, in regulating metastasis of breast cancer remains unclear. Intriguingly. HTRA1 loss was associated with aggressive behaviour and poor survival in breast cancer suggesting tumour suppressive functions.45 In contrast, the SFRP family member SFRP4 promotes cell growth and resistance to chemotherapy in prostate cancer,46 providing a plausible explanation for its inclusion in the 6-EMT gene signature identified for breast cancer. Finally, LUM that encodes an extracellular matrix protein has been shown to inhibit or even reverse several metastatic features that EMT endows in breast cancer.47 Regardless, our results suggest that these six proteins may all contribute to breast cancer metastasis. Nevertheless, further studies are required to clarify how they contribute, particularly HTRA1, SFRP4, and LUM, and whether they functionally cooperate in breast cancer metastasis. Similarly, a caveat of this study is that the transcriptomic data analysed involved bulk tumours which are not homogenous. It is thus possible that data could reflect gene expression by non-tumour cells such as stromal cells.48 Notwithstanding the potential use of the 6-EMT gene signature in diagnostic specimens, single-cell sequencing analysis could be instrumental in delineating the function of these genes in breast cancer metastasis, including their role in response to NACT.
Conclusion
The high expression of a signature of six EMT genes (LUM, SFRP4, MMP2, CXCL12, DCN and HTRA1) at diagnosis may be of predictive value of metastasis in TNBC patients who did not achieve pCR to NACT and in those who are treated with surgery in combination with adjuvant therapy.
Abbreviations
TNBC, triple-negative breast cancer; NACT, neoadjuvant chemotherapy; pCR, pathological complete response; EMT, epithelial–mesenchymal transition; GSEA, gene set enrichment analysis; GEO, Gene Expression Omnibus; ER, estrogen receptor; PR, progesterone receptor; HER2, human epidermal growth factor receptor-2; FISH, fluorescence in situ hybridization; OS, overall survival; DMFS, distant metastasis-free survival; FFPE, formalin-fixed paraffin-embedded; IHC, immunohistochemistry; ROC, receiver operating characteristic curve; AUC, area under curve; CI, confidence intervals; HR, hazard ratio; RD, residual disease.
Funding
This work was supported by the Key Research and Development Plan of Shanxi funded by Shanxi Science and Technology Department (Grant No.201903D421025).
Disclosure
The authors report no conflicts of interest in this work. The abstract of this paper was presented at the 2020 ASCO annual meeting as an abstract (#294,881) with interim findings. The abstract was published in “Abstracts” in Journal of Clinical Oncology 38, no. 15_suppl. DOI: 10.1200/JCO.2020.38.15_suppl.e12617 [https://ascopubs.org/doi/abs/10.1200/JCO.2020.38.15_suppl.e12617].
References
1. Bauer KR, Brown M, Cress RD, Parise CA, Caggiano V. Descriptive analysis of estrogen receptor (ER)-negative, progesterone receptor (PR)-negative, and HER2-negative invasive breast cancer, the so-called triple-negative phenotype: a population-based study from the California Cancer Registry. Cancer. 2007;109(9):1721–1728. doi:10.1002/cncr.22618
2. Garrido-Castro AC, Lin NU, Polyak K. Insights into molecular classifications of triple-negative breast cancer: improving patient selection for treatment. Cancer Discov. 2019;9(2):176–198. doi:10.1158/2159-8290.CD-18-1177
3. Boyle P. Triple-negative breast cancer: epidemiological considerations and recommendations. Ann Oncol. 2012;23(Suppl 6):vi7–vi12. doi:10.1093/annonc/mds187
4. Wang C, Kar S, Lai X, et al. Triple negative breast cancer in Asia: an insider’s view. Cancer Treat Rev. 2018;62:29–38. doi:10.1016/j.ctrv.2017.10.014
5. Hernandez-Aya LF, Chavez-Macgregor M, Lei X, et al. Nodal status and clinical outcomes in a large cohort of patients with triple-negative breast cancer. J Clin Oncol. 2011;29(19):2628–2634. doi:10.1200/JCO.2010.32.1877
6. Burstein HJ, Temin S, Anderson H, et al. Adjuvant endocrine therapy for women with hormone receptor-positive breast cancer: American Society of Clinical Oncology clinical practice guideline focused update. J Clin Oncol. 2014;32(21):2255–2269. doi:10.1200/JCO.2013.54.2258
7. Goutsouliak K, Veeraraghavan J, Sethunath V, et al. Towards personalized treatment for early stage HER2-positive breast cancer. Nat Rev Clin Oncol. 2019:1–18.
8. Odunsi K, Pejovic T. Immune checkpoint and poly(ADP–ribose) polymerase inhibition for recurrent platinum-resistant ovarian and metastatic triple-negative breast cancers. JAMA Oncol. 2019;5(8):1103. doi:10.1001/jamaoncol.2019.1009
9. Lim SK, Lee MH, Park IH, et al. Impact of molecular subtype conversion of breast cancers after neoadjuvant chemotherapy on clinical outcome. Cancer Res Treat. 2016;48(1):133–141. doi:10.4143/crt.2014.262
10. Cortazar P, Geyer CE
11. Cortazar P, Zhang L, Untch M, et al. Pathological complete response and long-term clinical benefit in breast cancer: the CTNeoBC pooled analysis. Lancet. 2014;384(9938):164–172. doi:10.1016/S0140-6736(13)62422-8
12. Liedtke C, Mazouni C, Hess KR, et al. Response to neoadjuvant therapy and long-term survival in patients with triple-negative breast cancer. J Clin Oncol. 2008;26(8):1275–1281. doi:10.1200/JCO.2007.14.4147
13. Prowell TM, Pazdur R. Pathological complete response and accelerated drug approval in early breast cancer. N Engl J Med. 2012;366(26):2438–2441. doi:10.1056/NEJMp1205737
14. Balko JM, Giltnane JM, Wang K, et al. Molecular profiling of the residual disease of triple-negative breast cancers after neoadjuvant chemotherapy identifies actionable therapeutic targets. Cancer Discov. 2014;4(2):232–245. doi:10.1158/2159-8290.CD-13-0286
15. Dieci MV, Criscitiello C, Goubar A, et al. Prognostic value of tumor-infiltrating lymphocytes on residual disease after primary chemotherapy for triple-negative breast cancer: a retrospective multicenter study. Ann Oncol. 2014;25(3):611–618. doi:10.1093/annonc/mdt556
16. Khaled N, Bidet Y. New insights into the implication of epigenetic alterations in the EMT of triple negative breast cancer. Cancers (Basel). 2019;11(4). doi:10.3390/cancers11040559
17. Burstein MD, Tsimelzon A, Poage GM, et al. Comprehensive genomic analysis identifies novel subtypes and targets of triple-negative breast cancer. Clin Cancer Res. 2015;21(7):1688–1698. doi:10.1158/1078-0432.CCR-14-0432
18. Jiang YZ, Ma D, Suo C, et al. Genomic and transcriptomic landscape of triple-negative breast cancers: subtypes and treatment strategies. Cancer Cell. 2019;35(3):428–440 e425. doi:10.1016/j.ccell.2019.02.001
19. Masuda H, Baggerly KA, Wang Y, et al. Differential response to neoadjuvant chemotherapy among 7 triple-negative breast cancer molecular subtypes. Clin Cancer Res. 2013;19(19):5533–5540. doi:10.1158/1078-0432.CCR-13-0799
20. Prat A, Lluch A, Albanell J, et al. Predicting response and survival in chemotherapy-treated triple-negative breast cancer. Br J Cancer. 2014;111(8):1532–1541. doi:10.1038/bjc.2014.444
21. Luen SJ, Salgado R, Dieci MV, et al. Prognostic implications of residual disease tumor-infiltrating lymphocytes and residual cancer burden in triple-negative breast cancer patients after neoadjuvant chemotherapy. Ann Oncol. 2019;30(2):236–242. doi:10.1093/annonc/mdy547
22. Di Cosimo S, Appierto V, Silvestri M, et al. Targeted-gene sequencing to catch triple negative breast cancer heterogeneity before and after neoadjuvant chemotherapy. Cancers (Basel). 2019;11(11):1753. doi:10.3390/cancers11111753
23. National Comprehensive Cancer Network (NCCN). Breast cancer. Available from: https://www.nccn.org/professionals/physician_gls/default.aspx#breast.
24. Ritchie ME, Phipson B, Wu D, et al. Limma powers differential expression analyses for RNA-sequencing and microarray studies. Nucleic Acids Res. 2015;43(7):e47. doi:10.1093/nar/gkv007
25. Yu G, Wang L-G, Han Y, He Q-Y. ClusterProfiler: an R package for comparing biological themes among gene clusters. OMICS. 2012;16(5):284–287. doi:10.1089/omi.2011.0118
26. Uno H, Cai T, Pencina MJ, D’Agostino RB, Wei LJ. On the C-statistics for evaluating overall adequacy of risk prediction procedures with censored survival data. Stat Med. 2011;30(10):1105–1117. doi:10.1002/sim.4154
27. Heagerty PJ, Lumley T, Pepe MS. Time-dependent ROC curves for censored survival data and a diagnostic marker. Biometrics. 2000;56(2):337–344. doi:10.1111/j.0006-341X.2000.00337.x
28. Moskowitz CS, Pepe MS. Quantifying and comparing the accuracy of binary biomarkers when predicting a failure time outcome. Stat Med. 2004;23(10):1555–1570. doi:10.1002/sim.1747
29. Wolff AC, Hammond ME, Hicks DG, et al. Recommendations for human epidermal growth factor receptor 2 testing in breast cancer: American Society of Clinical Oncology/College of American Pathologists clinical practice guideline update. J Clin Oncol. 2013;31(31):3997–4013. doi:10.1200/JCO.2013.50.9984
30. Eisenhauer EA, Therasse P, Bogaerts J, et al. New response evaluation criteria in solid tumours: revised RECIST guideline (version 1.1). Eur J Cancer. 2009;45(2):228–247. doi:10.1016/j.ejca.2008.10.026
31. Gupta PB, Pastushenko I, Skibinski A, Blanpain C, Kuperwasser C. Phenotypic plasticity: driver of cancer initiation, progression, and therapy resistance. Cell Stem Cell. 2019;24(1):65–78. doi:10.1016/j.stem.2018.11.011
32. Pastushenko I, Blanpain C. EMT transition states during tumor progression and metastasis. Trends Cell Biol. 2019;29(3):212–226. doi:10.1016/j.tcb.2018.12.001
33. Hatzis C, Pusztai L, Valero V, et al. A genomic predictor of response and survival following taxane-anthracycline chemotherapy for invasive breast cancer. JAMA. 2011;305(18):1873–1881. doi:10.1001/jama.2011.593
34. Jezequel P, Loussouarn D, Guerin-Charbonnel C, et al. Gene-expression molecular subtyping of triple-negative breast cancer tumours: importance of immune response. Breast Cancer Res. 2015;17(1):43. doi:10.1186/s13058-015-0550-y
35. Pribluda A, de la Cruz CC, Jackson EL. Intratumoral heterogeneity: from diversity comes resistance. Clin Cancer Res. 2015;21(13):2916–2923. doi:10.1158/1078-0432.CCR-14-1213
36. von Minckwitz G, Martin M. Neoadjuvant treatments for triple-negative breast cancer (TNBC). Ann Oncol. 2012;23(Suppl 6):vi35–vi39. doi:10.1093/annonc/mds193
37. Criscitiello C, Bayar MA, Curigliano G, et al. A gene signature to predict high tumor-infiltrating lymphocytes after neoadjuvant chemotherapy and outcome in patients with triple-negative breast cancer. Ann Oncol. 2018;29(1):162–169. doi:10.1093/annonc/mdx691
38. Taube JH, Herschkowitz JI, Komurov K, et al. Core epithelial-to-mesenchymal transition interactome gene-expression signature is associated with claudin-low and metaplastic breast cancer subtypes. Proc Natl Acad Sci U S A. 2010;107(35):15449–15454. doi:10.1073/pnas.1004900107
39. Nagase H, Woessner JF
40. Strieter RM, Polverini PJ, Kunkel SL, et al. The functional role of the ELR motif in CXC chemokine-mediated angiogenesis. J Biol Chem. 1995;270(45):27348–27357. doi:10.1074/jbc.270.45.27348
41. Iozzo RV, Sanderson RD. Proteoglycans in cancer biology, tumour microenvironment and angiogenesis. J Cell Mol Med. 2011;15(5):1013–1031. doi:10.1111/j.1582-4934.2010.01236.x
42. Cawthorn TR, Moreno JC, Dharsee M, et al. Proteomic analyses reveal high expression of decorin and endoplasmin (HSP90B1) are associated with breast cancer metastasis and decreased survival. PLoS One. 2012;7(2):e30992. doi:10.1371/journal.pone.0030992
43. Das K, Prasad R, Ansari SA, Roy A, Mukherjee A, Sen P. Matrix metalloproteinase-2: a key regulator in coagulation proteases mediated human breast cancer progression through autocrine signaling. Biomed Pharmacother. 2018;105:395–406. doi:10.1016/j.biopha.2018.05.155
44. Muller A, Homey B, Soto H, et al. Involvement of chemokine receptors in breast cancer metastasis. Nature. 2001;410(6824):50–56. doi:10.1038/35065016
45. Wang N, Eckert KA, Zomorrodi AR, et al. Down-regulation of HtrA1 activates the epithelial-mesenchymal transition and ATM DNA damage response pathways. PLoS One. 2012;7(6):e39446. doi:10.1371/journal.pone.0039446
46. Sandsmark E, Andersen MK, Bofin AM, et al. SFRP4 gene expression is increased in aggressive prostate cancer. Sci Rep. 2017;7(1):14276. doi:10.1038/s41598-017-14622-3
47. Karamanou K, Franchi M, Piperigkou Z, et al. Lumican effectively regulates the estrogen receptors-associated functional properties of breast cancer cells, expression of matrix effectors and epithelial-to-mesenchymal transition. Sci Rep. 2017;7(1):45138. doi:10.1038/srep45138
48. Lehmann BD, Jovanovic B, Chen X, et al. Refinement of triple-negative breast cancer molecular subtypes: implications for neoadjuvant chemotherapy selection. PLoS One. 2016;11(6):e0157368. doi:10.1371/journal.pone.0157368
 © 2020 The Author(s). This work is published and licensed by Dove Medical Press Limited. The full terms of this license are available at https://www.dovepress.com/terms.php and incorporate the Creative Commons Attribution - Non Commercial (unported, v3.0) License.
By accessing the work you hereby accept the Terms. Non-commercial uses of the work are permitted without any further permission from Dove Medical Press Limited, provided the work is properly attributed. For permission for commercial use of this work, please see paragraphs 4.2 and 5 of our Terms.
© 2020 The Author(s). This work is published and licensed by Dove Medical Press Limited. The full terms of this license are available at https://www.dovepress.com/terms.php and incorporate the Creative Commons Attribution - Non Commercial (unported, v3.0) License.
By accessing the work you hereby accept the Terms. Non-commercial uses of the work are permitted without any further permission from Dove Medical Press Limited, provided the work is properly attributed. For permission for commercial use of this work, please see paragraphs 4.2 and 5 of our Terms.