")
Back to Journals » Pharmacogenomics and Personalized Medicine » Volume 13
A Seven-NF-κB-Related Gene Signature May Distinguish Patients with Ulcerative Colitis-Associated Colorectal Carcinoma
Authors Ge CY , Wei LY , Tian Y, Wang HH
Received 26 August 2020
Accepted for publication 11 November 2020
Published 2 December 2020 Volume 2020:13 Pages 707—718
DOI https://doi.org/10.2147/PGPM.S274258
Checked for plagiarism Yes
Review by Single anonymous peer review
Peer reviewer comments 3
Editor who approved publication: Dr Martin Bluth
Chao-Yi Ge,1,* Li-Yuan Wei,2,* Yu Tian,1 Hua-Hong Wang1
1Department of Gastroenterology, Peking University First Hospital, Beijing, People’s Republic of China; 2Department of Breast Surgery, Shanxi Bethune Hospital, Taiyuan, People’s Republic of China
*These authors contributed equally to this work
Correspondence: Hua-Hong Wang
Department of Gastroenterology, Peking University First Hospital, No. 8 Xishiku Street, Xicheng District, Beijing 100034, People’s Republic of China
Tel +86 010- 83575675
Email [email protected]
Purpose: Ulcerative colitis (UC) patients have an increased risk of colorectal cancer (CRC), and compared with sporadic CRC, ulcerative colitis-associated colorectal cancer (CAC) is more aggressive with a worse prognosis. This study aimed to identify a gene signature to predict the risk of CAC for patients with UC in remission.
Patients and Methods: Series of quiescent UC-related transcriptome data obtained from the Gene Expression Omnibus (GEO) data set were divided into a training set and a validation set. Gene Set Variation Analysis (GSVA), Gene Set Enrichment Analysis (GSEA), and \Weighted Correlation Network Analysis (WGCNA) combined with protein–protein interaction (PPI) analysis were used to identify the pathways and gene signatures related to tumorigenesis among quiescent UC patients. A generalized linear model (GLM) of Poisson regression based on the training set was applied to estimate the diagnostic power of the gene signature in our validation set.
Results: The tumor necrosis factor (TNF) signaling via NF-κB pathway was significantly augmented with the highest normalized enrichment score (NES). The genes in the brown module from WGCNA have shown a significant correlation with CAC (Pearson coefficient = 0.83, p = 6e-06). A subset of NF-κB related genes (FOS, CCL4, CXCL1, MYC, CEBPB, ATF3, and JUNB) were identified with a relatively higher expression level in CAC samples. The diagnostic value of this 7-gene biomarker was estimated by the receiver operating characteristic (ROC) curve with an area under the ROC curve (AUC) at 0.82 (p< 0.0001, 95% CI: 0.7098– 0.9400) in the validation cohort.
Conclusion: In summary, the increased expression of this seven-NF-κB-related gene signature may act as a powerful index for tumorigenesis prediction among patients with UC in remission.
Keywords: ulcerative colitis; UC, remission, colitis-associated colorectal cancer; CAC, diagnostic model
Introduction
Ulcerative colitis (UC) is a kind of chronic idiopathic intestinal inflammatory disease with poorly understood etiology, mainly affecting the epithelial mucosa from the anus to the ileocecal area.1 It has been demonstrated that the extent of colonic involvement, severity of the inflammation, and duration of UC could increase the risk of colorectal cancer (CRC).2,3 Patients with inflammatory bowel disease (IBD) often suffer from CRC within the first 7 years after initial diagnosis.4 Moreover, compared with sporadic CRC, ulcerative colitis-associated colorectal cancer (CAC) is more aggressive and has a worse prognosis as evidenced by the multiple involved sites,5 and hence surveillance of CAC by colonoscopy is recommended among the UC patients during the remission state.5 Whereas, a proportion of dysplastic lesions cannot be detected exactly by surveillance colonoscopy.6 The researches on the assessment of the risk of CRC occurring between each two scheduled surveillance procedures are still limited.7 Therefore, this calls for further development of methods to predict and detect UC patients with high a risk of CAC at an earlier stage to improve the clinical outcomes during the scheduled surveillance procedures.
The progression of CAC from UC including the development from low-grade dysplasia, high-grade dysplasia, to invasive adenocarcinoma, is reported to have a dynamic, heterogeneous, and complex communication between the immune system and cytokines.8 Various immunological and inflammatory pathways including PI3K-Akt signaling, tumor necrosis factor (TNF) signaling, cytokine-cytokine receptor interaction, and extracellular matrix (ECM)-receptor interaction pathways have been confirmed to orchestrate the fate of tumorigenesis and progression.9–11 Moreover, some of the candidate biomarkers were demonstrated to be able to promote colonic tumorigenesis by regulating the immune system, such as CXCL10 and CXCL9,12 IDO1,13 CCR7,14 VCAM115 as well as ICAM1.16
Considering the comprehensive biological process, we have compared the differentially expressed genes in intestinal epithelium biopsy tissues among patients with UC in remission or UC with remote neoplasm and normal individuals from the Gene Expression Omnibus (GEO) database. A group of 7 nuclear factor-kappa B (NF-κB) related genes were generated with up-regulated expression among UC with remote neoplasm tissues and then was validated to be an effective signature for discrimination of UC patients with a high risk of CAC.
Patients and Methods
Patients and Samples
In our study, both the discovery cohort and the validation cohort were based on patients with UC in remission exclusively. The patients with active UC and Crohn’s disease were not included. The discovery cohort consisted of 20 patients from Chicago including 5 normal controls, 4 UC patients in remission, and 11 patients with remote neoplasia.17 The total RNA of the 20 samples extracted from the colonic mucosae was analyzed via the Affymetrix Human U133p2 platform (GLP570) and the normalized microarray data was obtained from GEO (https://www.ncbi.nlm.nih.gov/geo/) repository via the accession number of GSE37283. The validation cohort used in our study was composed of 41 normal controls, 26 UC patients in remission, as well as 15 patients with CRC derived from the other 3 GEO data sets (GSE13367,18 GSE38713,19 and GSE418320), in which the normalized microarray data generated from colonic mucosae of these 82 samples was also analyzed through the GLP570 platform. All of the samples in both discovery cohort and validation cohort were obtained with the ethical approval from their original institutions.17–20
Profiling of RNA Differential Expression
Both the normalized microarray data and the corresponding clinical features were downloaded from the GEO database and statistical analyses were performed in the R platform (version 3.6.2). Differentially expressed genes were identified by the Limma package21 from the comparison among the normal control, UC in remission, CAC, and CRC groups. To merge the microarray data from these 3 different GEO data sets for our validation cohort, the existed bias and variation due to the batch effect of the different high-throughput data were removed by the Combat function of the sva package22 in the R platform.
Gene Set Enrichment Analyses
To investigate the variation of the Hallmark gene set enrichment among each sample in our discovery cohort (downloaded from Molecular Signatures Database (MSigDB); https://www.gsea-msigdb.org/gsea/msigdb/index.jsp), Gene Set variation Analysis (GSVA) was conducted by the GSVA package in R platform to calculate the sample-gene set enrichment scores,23 which were then visualized in a heatmap by the pheatmap package. Furthermore, Gene Set Enrichment Analysis (GSEA) was carried out by the ClusterProfiler package24 to identify the core genes in some significantly enriched pathways based on the Hallmark gene set associated with CAC. Significantly enriched biological pathways were identified if their normalized enrichment scores (NES) were ≥2 or ≤-2 as well as false discovery rates (FDR) <0.05 after 1000-time permutations.
Immune Cell Infiltration
The assessment of immune infiltration of 28 immune cell types among the CAC, UC in remission, and normal control in our discovery cohort was implemented via single-sample gene set enrichment analysis (ssGSEA) by using the GSVA package in R.23 The identified genes matched for each immune cell type were downloaded from the recent published work,25 and the ssGSEA scores for each immune cell type were then visualized in a heatmap. Considering the potential effect of these 28 immune cells on tumorigenesis, they were divided into 2 groups: an anti-tumor group and a pro-tumor group, by suppressing the immune system in the microenvironment.26
Weighted Correlation Network Analysis for the Key Module
The undirected, weighted gene co-expression network was constructed to detect the most correlated cluster of genes with CAC by using the Weighted Correlation Network Analysis (WGCNA) in our discovery cohort. The top 5,000 genes according to their median absolute deviation were extracted from the normalized microarray expression data and used for WGCNA. The selection of soft threshold, construction of correlation networks based on gene expression, detection and selection of highly correlated hub genes in the significantly related modules to CAC, calculation of softConnectivity, intramodularConnectivity, and topological overlap measure (TOM) similarity, as well as visualization of the module structure and network connections were all implemented in the WGCNA package.27
Identification of Diagnostic Gene Signature for CAC Patients
The overlapped genes including those enriched by GSEA and involved in the most significant module of WGCNA were illustrated in a Venn diagram from an online tool (http://bioinformatics.psb.ugent.be/webtools/Venn). The protein–protein interaction (PPI) information of these common genes was then integrated based on the STRING (11.0) online database (https://string-db.org/)28 with the confidence score > 0.7 between each 2 nodes, and 3 clusters were identified by K-means clustering algorithm. After removing the isolated and lower connected nodes, the achieved PPI network was further analyzed for hub genes by CytoHubba plugin29 and visualized in the Cytoscape software.30 The normalized expression of the selected hub genes in both training set and validation set was illustrated in boxplots by ggplot2 package in R platform.
Validation of the Diagnostic Signature for UC Patients with a High Risk of Colorectal Carcinoma
A generalized linear model (GLM) with Poisson regression based on our training set was employed to evaluate the diagnostic power of the identified signature. The predicted diagnostic scores were generated from the weighted linear diagnostic model combined with the gene expression in our validation cohort by the predict function in R software. The predicted risk score = expression of gene1*β1+expression of gene2*β2+expression of genen *βn. The receiver operating characteristic (ROC) curve plotted by ROCR package31 in R platform combined with the corresponding area under the ROC curve (AUC) was applied to quantify the accuracy of the gene signature in the predicted model. A two-tailed P value < 0.05 with 95% confidence intervals (CI) was supposed to be significant.
Results
Profiling of Microarray Data for CAC in the Training Set
Samples of UC patients in remission (quiescent UC), CAC patients, and normal controls were collected from GSE37283 as our discovery data set. Considering the fact that the extent, duration, as well as the severity of inflammation on the intestinal epithelial cells may increase the risk for CAC,17 we first investigated the inherent heterogeneity of the microarray-based transcriptomic profiles of these samples based on 50 pathways of the Hallmark gene set by GSVA. The hierarchical clustering diagram of the 50 gene sets variation analysis showed that the pathways on the regulation of immune system such as interferon alpha/gamma response, allograft rejection, IL6-JAK-STAT3 signaling, IL2-STAT5 signaling, TNF signaling via NF-κB displayed a strong similarity with higher expression in CAC patients compared with those in other 2 groups (Figure 1A). Then, the ssGSEA was carried out to quantify the relative abundance of immune cell infiltration among these patients. Visualized in the heatmap, we observed that UC patients with remote neoplasia could be distinguished from the other 2 groups of patients remarkably (Figure 1B). According to the potential function on tumorigenesis, these 28 immune cell populations were divided into 2 clusters: anti-tumor immunity (activated CD4 T cell (ActCD4), ActCD8, central memory CD4 T cell (TcmCD4), TcmCD8, effector memory CD4 T cell (TemCD4), TemCD8, Th1, Th17, activated dendritic cell (ActDC), CD56 bright natural kill cell (CD56briNK), natural kill T cell (NKT), NK) and pro-tumor reactivity (Treg, Th2, CD56dimNK, immature dendritic cell (imDC), tumor-associated macrophage (TAM), myeloid-derived suppressor cells (MDSCs), Neutrophil, and plasmacytoid dendritic cell (pDC)) by suppressing the immune system.26 As depicted in the correlation diagram (Figure 1C), the relative abundance of anti-tumor immune cell types of these samples was positively related to the pro-tumor ones, especially for CAC samples (R = 0.9676, p = 3.2966e-12). This highly positive correlation may suggest that the enhancement of immune suppression could be fed back by the facilitation of anti-tumor immunity.26 The presence of inflammation caused by UC may have an effect on tumorigenesis for CAC.
 |
Figure 1 Heterogeneity of transcriptomic profiles of samples from patients with quiescent ulcerative colitis, ulcerative colitis with neoplasia, and normal control. (A) Heatmap with clusters displaying the results of GSVA on the Hallmark gene set among the three groups. (B) The heterogeneity of immune cell types for the three groups calculated by ssGSEA. (C) The correlation of immune cell populations of the three groups between anti-tumor clusters (ActCD4, ActCD8, TcmCD4, TcmCD8, TemCD4, TemCD8, Th1, Th17, ActDC, CD56briNK, NK, NKT) and pro-tumor clusters by suppressing the immune system (Treg, Th2, CD56dimNK, imDC, TAM, MDSC, Neutrophil, and pDC). R and the gray shaded area represent the coefficient of correlation and 95% CI, respectively. Abbreviations: GSVA, Gene set variation analysis; ssGSEA, single-sample gene set enrichment analysis; ActCD4, activated CD4 T cell; TcmCD4, central memory CD4 T cell; TemCD4, effector memory CD4 T cell; DC, dendritic cell; CD56birNK, CD56 bright natural kill cell; NK, natural kill cell; NKT, natural kill T cell; TAM, tumor-associated macrophage; MDSC, myeloid-derived suppressor cells; pDC, plasmacytoid dendritic cell; CI, confident interval. |
Functional Pathways Enrichment Analysis
To further explore the special mechanism of tumorigenesis among the quiescent UC patients, GSEA was used to compare the difference between CAC and UC in remission samples, between CAC and normal control samples, and between UC in remission and normal control samples based on the Hallmark gene set. Consistent with the result of GSVA, the TNF signaling via NF-κB pathway was significantly augmented with the highest NES in both CAC patients compared with UC (NES: 2.64, p = 0.0016, p.adjust = 0.0064) as well as normal controls (NES:2.47, p = 0.001, p.adjust = 0.0027) and quiescent UC patients compared with normal controls (NES:2.17, p = 0.001, p.adjust = 0.0018) (Figure 2 and Supplementary Tables 1–3).
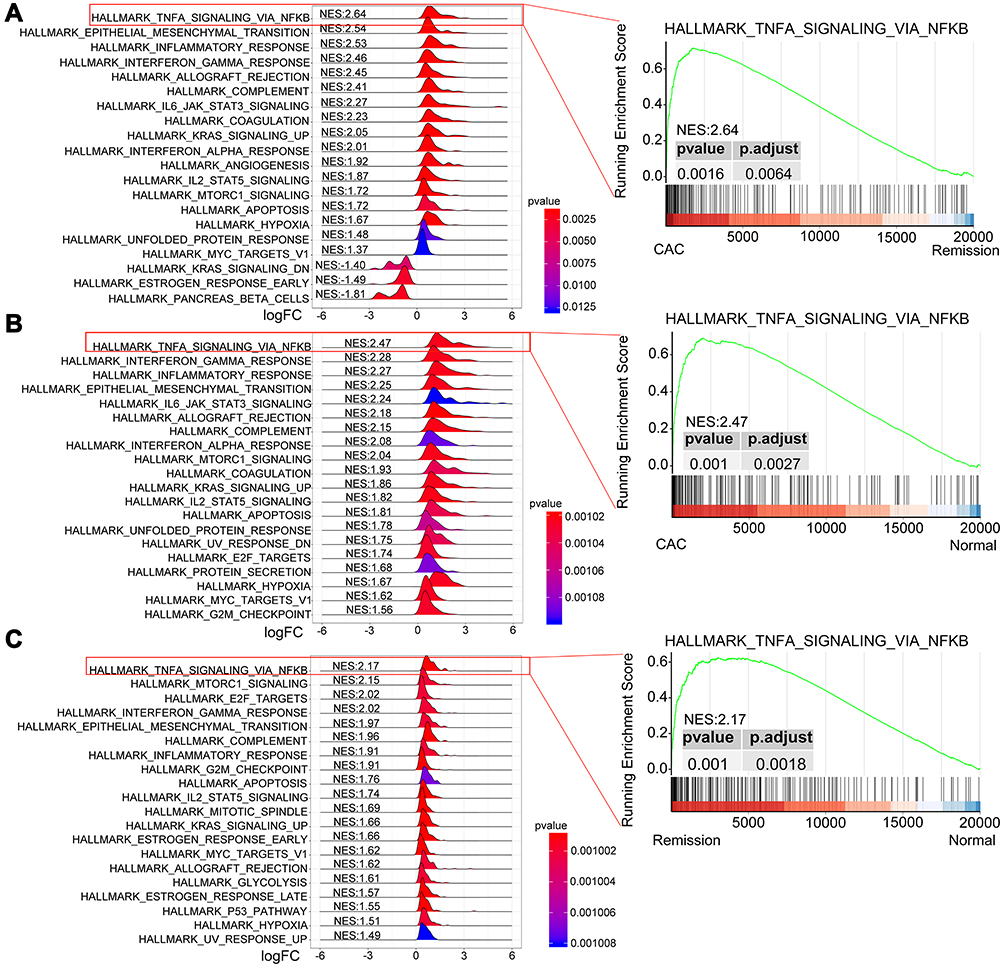 |
Figure 2 GSEA plots depicting the enrichment of signal pathways based on the Hallmark gene set. Ridge plots (left) of the most enriched 20 pathways of CAC patients relative to those with UC in remission (A) or normal patients (B), and patients with UC in remission compared with normal controls (C). The TNF signaling via NF-κB pathway is positively enriched with the highest NES (right). Abbreviations: GSEA, gene set enrichment analysis; CAC, ulcerative colitis-associated colorectal cancer; UC, ulcerative colitis; NES, normalized enrichment score. |
Construction of Co-Expression Networks by WGCNA
Co-expression networks among these 20 samples were established to figure out those genes with a high relationship to CAC. The top 5,000 genes of these samples were clustered into 8 modules (MEblack, MEblue, MEgreen, MEred, MEyellow, MEbrown, MEturquoise, and MEgrey), of which genes in the MEbrown module were most positively related to CAC with significance (Figure 3A and B, Pearson coefficient = 0.83, p = 6e-06). There were a total of 1,234 genes involved in the brown module (Supplementary Table 4), and the correlational analysis of these genes between gene significance to CAC and the module membership was conducted. As shown in Figure 3C, these 1,234 genes presented a significant contribution to both CAC and the brown module membership (correlation coefficient = 0.85, p<1e-200). Besides, the hierarchical clustering analysis indicated that these genes in the CAC group also expressed differently from the other 2 groups (Figure 3D). Therefore, these genes co-expressed with CAC should be paid attention to.
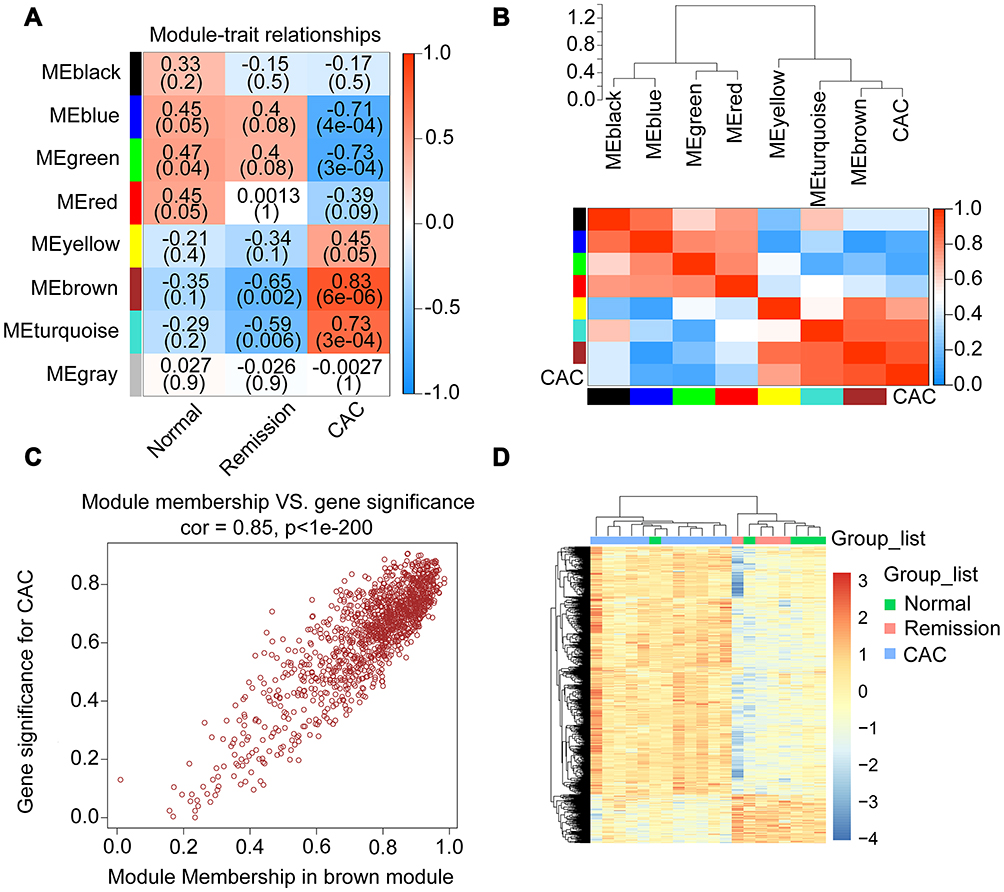 |
Figure 3 Correlated genes in the interested modules of CAC identified by WGCNA. (A) Heatmap depicting the strength of relationships between each module and the clinical features. The ρ coefficients as well as corresponding p values were exhibited in various shade of colors. The positive correlation was exhibited in red and the negative was in blue. (B) The dendrogram (top) and heatmap (bottom) displaying the strength of correlations between CAC and other modules in which the red represented a higher positive adjacency and the blue represented a lower one. (C) The scatterplot of the correlation between gene significance (y-axis) and the selected module (brown) membership for CAC. In this brown module, genes were highly correlated with both the selected module and the clinical feature of CAC. (D) Heatmap with clusters of differentially expressed genes in brown module among the 3 different groups. Abbreviations: CAC, ulcerative colitis-associated colorectal cancer; WGCNA, weighted correlation network analysis. |
Identification of Hub Genes Involved in CAC in the Discovery Cohort
Having found that the TNF signaling via NF-κB pathway was positively enriched both CAC and UC patients, 81 NF-κB related genes were commonly upregulated in CAC patients compared with quiescent UC patients and normal controls (Figure 4A, the common part of the red and green channels). Additionally, considering the NF-κB related genes also enriched in quiescent UC patients compared with normal controls, there were 56 NF-κB related genes commonly increased in both the CAC group and the quiescent UC group (Figure 4A). To further discriminate the NF-κB related genes with a closer correlation with CAC, genes from WGCNA were taken into account and a total of 32 NF-κB related hub genes were found (Figure 4A). The identified genes were then submitted to the STRING online database to map a PPI network and divided into 3 clusters by K-means clustering algorithm (Figure 4B). 23 nodes with high interaction score (confidence > 0.7) were discriminated and further analyzed by 12 topological algorithms including Degree, Edge Percolated Component (EPC), Maximum Neighborhood Component (MNC), Density of Maximum Neighborhood Component (DMNC), Maximal Clique Centrality (MCC) and centralities based on shortest paths, such as Bottleneck (BN), EcCentricity, Closeness, Radiality, Betweenness, and Stress in CytoHubba plugin29 of Cytoscape software (Table 1). Finally, 7 NF-κB related hub genes were identified as follows with a relatively higher expression level in CAC patients: Fos proto-oncogene (FOS), C-C motif chemokine ligand 4 (CCL4), C-X-C motif chemokine ligand 1 (CXCL1), MYC proto-oncogene (MYC), CCAAT enhancer binding protein beta (CEBPB), activating transcription factor 3 (ATF3), and JunB proto-oncogene (JUNB) (Figure 4C and Figure 5A).
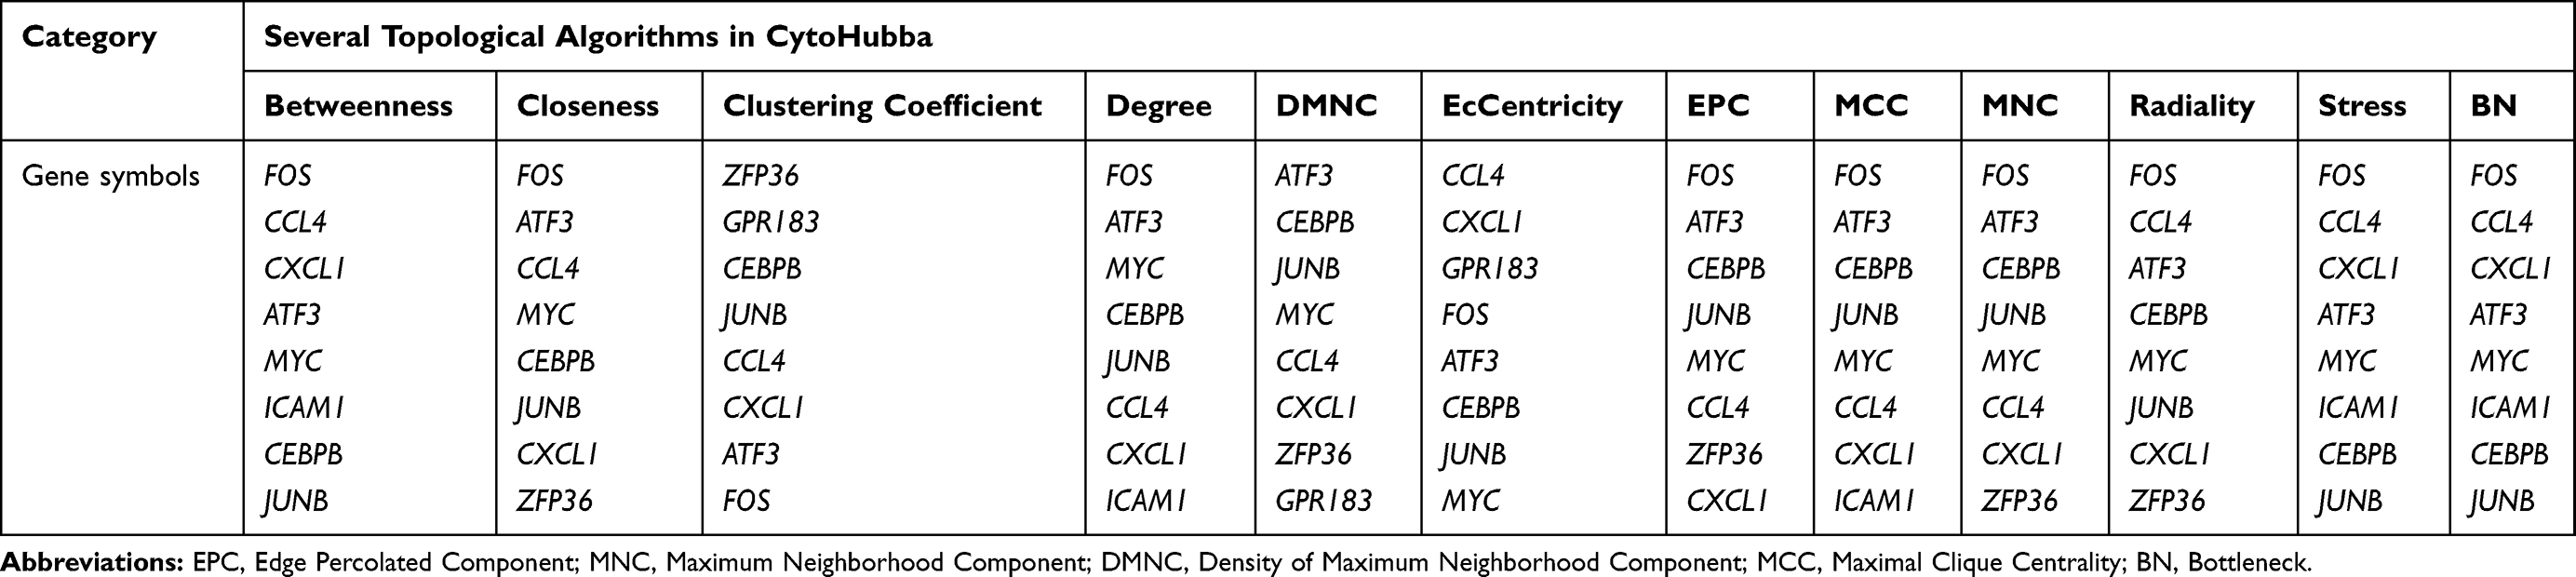 |
Table 1 The Top 8 Genes Calculated by CytoHubba |
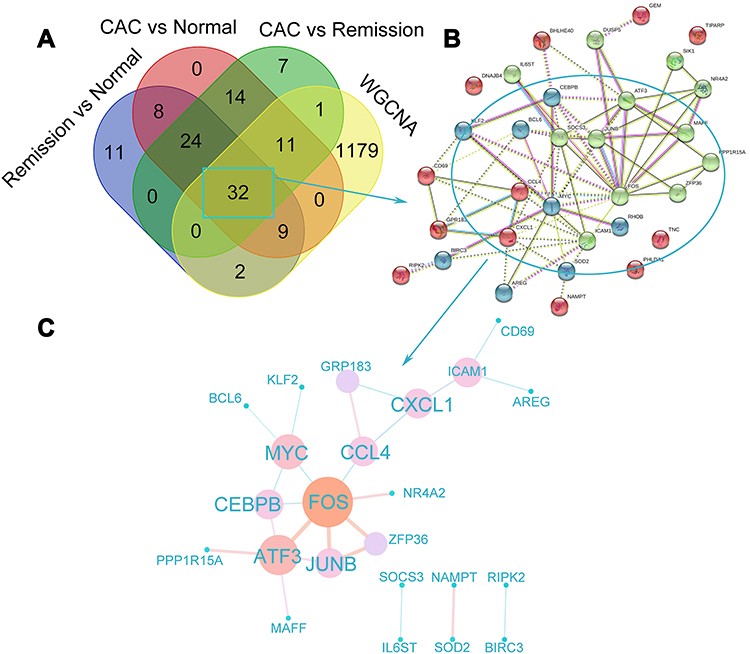 |
Figure 4 Identification of hub genes that may be involved in the tumorigenesis among the ulcerative colitis patients. (A) The Venn diagram exhibiting the overlaps of genes from the results of GSEA and WGCNA. Core genes enriched in the TNF signaling via NF-κB pathway by GSEA were picked out (the green part: CAC compared with UC in remission; the red part: CAC compared with normal control; and the purple part: UC in remission compared with normal control). The yellow part represented the genes in the brown module most associated with CAC analyzed by WGCNA. (B) PPI network of the common 32 NF-κB signaling genes analyzed by STRING database was shown in 3 clusters via K-means clustering algorithm. The different colors of spots represent the different clusters. (C) PPI network of the hub genes with high confidence (interaction score >0.7) extracted from (B), calculated by CytoHubba, and visualized in Cytoscape software. The various sizes as well as the colors (from blue to orange) of dots represented the degree between two genes and the coefficients were exhibited by the different sizes and colors of the edges. Abbreviations: UC, ulcerative colitis; CAC, ulcerative colitis-associated colorectal cancer; WGCNA, weighted correlation network analysis; PPI, protein–protein interaction. |
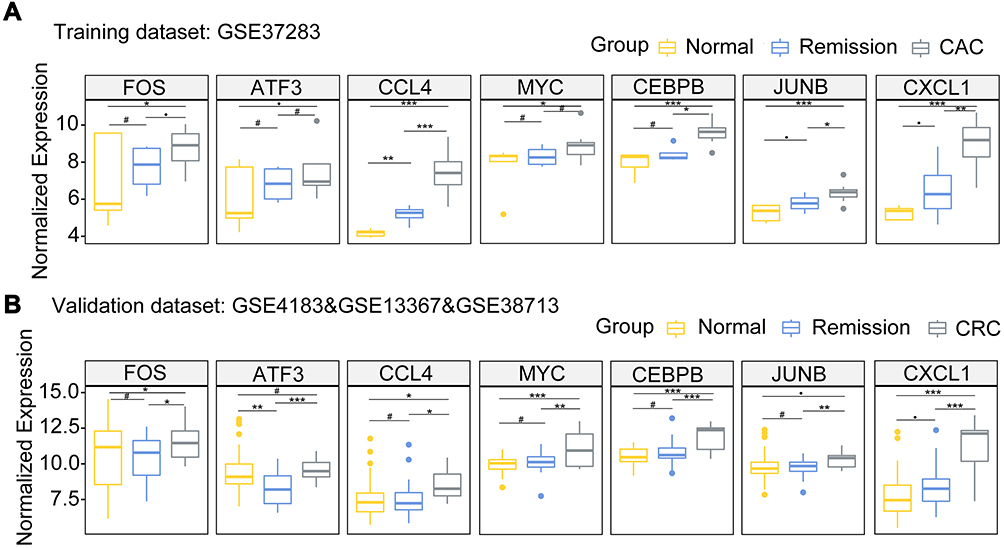 |
Figure 5 The box plots depicting the 7 hub genes differentially expressed in CAC, UC in remission, and normal control groups in our training data set ((A) GSE37283) and validation data set ((B) GSE4183 & GSE13367 & GSE38713). #P≥0.1, ●P<0.1, * P<0.05; ** P <0.01; *** P <0.001. Abbreviations: UC, ulcerative colitis; CAC, ulcerative colitis-associated colorectal cancer. |
Performance of the Diagnostic Seven-Gene Signature in the Validation Cohort
In order to assess the strength of the seven-NF-κB-related gene signature in predicting tumorigenesis among quiescent UC patients, the transcriptomic data of 82 patients were integrated as our validation cohort, including 41 normal controls (20 cases in GSE13367; 13 cases in GSE38713; 8 cases in GSE4183), 15 patients with CRC (GSE4183), and 26 quiescent UC patients (18 patients in GSE13367; 8 patients in GSE38713). Consistent with the expression levels observed in our training set, these 7 NF-κB related genes were also expressed at a higher level in CRC samples, suggestive of the potential role in tumorigenesis of colorectal carcinoma (Figure 5B). Moreover, gene functional analysis also indicated that the TNF signaling via NF-κB pathway was highly augmented in CRC samples compared with quiescent UC patients or normal intestinal mucosae significantly (Figure 6A; Supplementary Table 5 and 6).
 |
Figure 6 (A) GSEA plots depicting the TNF signaling via NF-κB pathway which was positively enriched in CRC patients in our validation cohort compared with patients with UC in remission (top) and normal patients (bottom). (B) The ROC curve with AUC at 0.82 for the diagnosis value of the 7-NF-κB-signaling-gene signature in detecting UC patients with high risk for CRC (p<0.0001, 95% CI: 0.7098–0.9400). Abbreviations: GSEA, gene set enrichment analysis; UC, ulcerative colitis; CRC, colorectal cancer; ROC, receiver operating characteristic; AUC, area under curve. |
According to the clinical feature of our discovery cohort, a GLM with the Poisson regression was then applied to our validation cohort. The ROC curve with an AUC at 0.82 (p<0.0001, 95% CI: 0.7098–0.9400) demonstrated the potential ability of diagnosis for quiescent UC patients with a high risk of colorectal carcinoma (Figure 6B).
Discussion
The elucidation of pathogenesis of CAC remains an unmet need to develop new surveillance tools or therapeutic targets for patients with both UC and CAC. The consistent action of inflammatory on intestinal mucosa has been elucidated to predispose UC to CAC by multiple tumor-related genetic changes in intestinal epithelial cells.32,33 Watanabe et al generated 20 discriminator genes to predict the development of CAC among the UC patients, including the cancer-related genes CYP27B1, RUNX3, SAMSN1, EDIL3, NOL3, CXCL9, ITGB2, and LYN. Nevertheless, they did not distinguish the active UC patients from those in remission.34 Besides, the previous study based on the same population as our discovery cohort has identified nine highly expressed genes in UC patients with neoplasia compared to quiescent UC patients and healthy controls, which might regulate the immune function, inflammation, proliferation, and apoptosis of the intestinal mucosa cells and contribute to neoplastic transformation,17 but without validation in a large clinical cohort. Furthermore, Shi’s group integrated 8 gene profiles and re-analyzed the differentially expressed genes between patients with quiescent UC and active UC, UC and adenoma, as well as UC and CRC. A group of hub genes (CXCL10, VCAM1, CXCL9, MMP9, IDO1, and CCR7) were found to be significantly associated with tumorigenic processes via pathways such as platelet activation, ligand-receptor interaction, immune dysregulation, and inflammation.35 Among the involved pathways, the aberrant stimulation of NF-κB have been detected in intestinal epithelial cells from both IBD and CRC,36 and can contribute to inflammation-associated tissue injury37 as well as tumor cell proliferation via the overexpression of angiogenesis-related genes.33 In our present study, we have identified a 7-NF-κB-related gene signature (FOS, CCL4, CXCL1, MYC, CEBPB, ATF3, and JUNB) which was potentially a tool for the selection of patients UC in remission stage with a high risk of cancerization during the scheduled surveillance procedures.
Considering the crucial role in UC and CAC, there is no doubt that the TNF signaling via NF-κB pathway could be highly enriched in CAC samples with significance in our study. The activation of the NF-κB pathway upregulates the expression of pro-inflammatory cytokines and adhesion factors, inhibits the production of apoptotic factors, and promotes tumor angiogenesis and metastasis.33,38 In azoxymethane (AOM) followed dextran sulfate sodium (DSS) induced CAC mice models, the deletion of IκB kinase β (IKKβ) led to inactivation of the NF-κB pathway and thereby reduced the incidence of tumors, which proved the stimulation on tumor progression.39 On the other hand, the activation of the NF-κB pathway promotes the production of TNF-α, which also plays an important role in tumorigenesis. The expression of TNF-α was observed to be significantly increased in AOM/DSS CAC models, and blocking TNF-α obviously reduced tumors amount and lesion as well as reduced colonic infiltration by neutrophils and macrophages.40 The higher expression level of these identified genes in the CAC group in our discovery and validation cohort might point out the potential importance in tumorigenesis during the development from quiescent UC to CAC. Indeed, interrogation of extra-data which was composed of the normal intestinal mucosa, UC in remission stage, and CRC also revealed an outstanding diagnostic power of this identified gene signature. Nevertheless, given the limited size of the training set and the non-coherent sample features of our validation set, the seven-NF-κB-related gene signature needs to be further validated in large scale cohorts of UC and CAC patients, and it may serve as a useful tool for predicting and identifying UC patients in remission stage with a high risk of CAC after the routine therapy.
Among the 7 NF-κB related genes, CCL4 and CXCL1 encode members of chemotactic cytokines families which are small secreted proteins and are known to control immune cell migration. Besides, they also participate in pathological processes such as tumor occurrence, development, and metastasis.41 MYC is a type of proto-oncogenes encoding nuclear transcriptions which regulates cell cycles. The inhibition of TNF α-induced c-Myc upregulation can be mediated by attenuating NF-κB signaling,42 which can then induce uncontrolled cell proliferation and inhibit apoptosis of colorectal carcinoma.43 ATF3 is a stress-responsive factor that plays a vital role in controlling the expression of cell-cycle regulators and tumor suppressor.44 Intriguingly, it has been reported that ATF3 played a protective role in regulating the gut follicular helper T cells among IBD patients45 and inhibiting the invasion of CRC,46 which may need further investigation. CEBPB encodes a member of the CCAAT/enhancer-binding protein family, which can be activated by the NF-κB and STATS pathways in the inflammatory microenvironment to regulate gene transcription in response to IL-1 and IL-6.47 The deletion of CEBPB would impair the function of regular T cells and thus aggravate the T cell-mediated colitis.48 In contrast, the overexpression of CEBPB may promote tumor cell invasion in CRC individuals,49 and regulate the immunosuppressive environment via MDSCs in CAC.50 The JUNB and FOS encode proteins which belongs to the dimeric transcription factor activator protein 1(AP-1), play roles in regulating tumor cell proliferation, survival, differentiation, invasiveness, or angiogenesis.51 Regardless of the controversial perspective over these NF-κB related genes, our results from discovery and validation cohorts both indicated the potential effect on tumorigenesis from UC in the remission stage.
Nevertheless, there are also some limitations in our study. In terms of the patients in our discovery cohort, the detailed clinical features including the patients’ demographics, the treatment of these patients, and the grade of CAC were not assessable. Therefore, we cannot exclude the confounding factors and make a further investigation on the process of tumor transformation from quiescent UC to CAC. Moreover, unlike the discovery cohort, patients in our validation cohort were collected from 3 different institutions, which could lead to bias and variation due to the batch effect inevitably. Considering the heterogeneity of intestinal mucosa derived from these different institutions, further researches based on the comparison between quiescent UC patients harboring or not CAC after receiving the unified regimen will be more instrumental to delineate the tumorigenesis function of the seven-gene signature in NF-κB pathway.
Conclusion
In summary, we have identified a 7-NF-κB-related gene signature (CCL4, CXCL1, MYC, JUNB, FOS, ATF3, and CEBPB) with high expression in CAC, which may facilitate the tumorigenesis by regulating the immunological and inflammatory reactions via the NF-κB pathway. High levels of this signature may act as a powerful predictor for CAC among quiescent UC patients during their scheduled surveillance.
Abbreviations
UC, Ulcerative colitis; CRC, colorectal cancer; CAC, ulcerative colitis-associated colorectal cancer; TNF, tumor necrosis factor; NF-κB, nuclear factor-kappa B; GSEA, gene set enrichment analysis; ssGSEA, single-sample gene set enrichment analysis; GSVA, gene set variation analysis; DC, dendritic cell; NK, natural kill cell; NKT, natural kill T cell; TAM, tumor-associated macrophage; MDSC, myeloid-derived suppressor cells; pDC, plasmacytoid dendritic cell; PPI, protein–protein interaction; WGCNA, weighted correlation network analysis; NES, normalized enrichment score; GEO, Gene Expression Omnibus; IBD, inflammatory bowel disease; GLM, generalized linear model; ROC, receiver operating characteristic curve; AUC, area under curve; CI, confidence intervals.
Disclosure
The authors report no conflicts of interest in this work.
References
1. Ungaro R, Mehandru S, Allen PB, Peyrin-Biroulet L, Colombel JF. Ulcerative colitis. Lancet. 2017;389(10080):1756–1770. doi:10.1016/S0140-6736(16)32126-2
2. Nadeem MS, Kumar V, Al-Abbasi FA, Kamal MA, Anwar F. Risk of colorectal cancer in inflammatory bowel diseases. Semin Cancer Biol. 2020;64:51–60. doi:10.1016/j.semcancer.2019.05.001
3. O’Connor PM, Lapointe TK, Beck PL, Buret AG. Mechanisms by which inflammation may increase intestinal cancer risk in inflammatory bowel disease. Inflamm Bowel Dis. 2010;16(8):1411–1420. doi:10.1002/ibd.21217
4. Beaugerie L, Itzkowitz SH. Cancers complicating inflammatory bowel disease. N Engl J Med. 2015;372(15):1441–1452. doi:10.1056/NEJMra1403718
5. Yashiro M. Ulcerative colitis-associated colorectal cancer. World J Gastroenterol. 2014;20(44):16389–16397. doi:10.3748/wjg.v20.i44.16389
6. Herrinton LJ, Liu L, Levin TR, Allison JE, Lewis JD, Velayos F. Incidence and mortality of colorectal adenocarcinoma in persons with inflammatory bowel disease from 1998 to 2010. Gastroenterology. 2012;143(2):382–389. doi:10.1053/j.gastro.2012.04.054
7. Choi CH, Rutter MD, Askari A, et al. Forty-year analysis of colonoscopic surveillance program for neoplasia in ulcerative colitis: an updated overview. Am J Gastroenterol. 2015;110(7):1022–1034. doi:10.1038/ajg.2015.65
8. Tatiya-Aphiradee N, Chatuphonprasert W, Jarukamjorn K. Immune response and inflammatory pathway of ulcerative colitis. J Basic Clin Physiol Pharmacol. 2018;30(1):1–10. doi:10.1515/jbcpp-2018-0036
9. Zhang X, Wei L, Wang J, et al. Suppression colitis and colitis-associated colon cancer by anti-S100a9 antibody in mice. Front Immunol. 2017;8:1774. doi:10.3389/fimmu.2017.01774
10. Fang K, Grisham MB, Kevil CG. Application of comparative transcriptional genomics to identify molecular targets for pediatric IBD. Front Immunol. 2015;6:165. doi:10.3389/fimmu.2015.00165
11. Low END, Mokhtar NM, Wong Z, Raja Ali RA. Colonic mucosal transcriptomic changes in patients with long-duration ulcerative colitis revealed colitis-associated cancer pathways. J Crohns Colitis. 2019;13(6):755–763. doi:10.1093/ecco-jcc/jjz002
12. Shukla PK, Chaudhry KK, Mir H, et al. Chronic ethanol feeding promotes azoxymethane and dextran sulfate sodium-induced colonic tumorigenesis potentially by enhancing mucosal inflammation. BMC Cancer. 2016;16(1):189. doi:10.1186/s12885-016-2180-x
13. Thaker AI, Rao MS, Bishnupuri KS, et al. IDO1 metabolites activate beta-catenin signaling to promote cancer cell proliferation and colon tumorigenesis in mice. Gastroenterology. 2013;145(2):
14. McNamee EN, Masterson JC, Veny M, et al. Chemokine receptor CCR7 regulates the intestinal TH1/TH17/Treg balance during Crohn’s-like murine ileitis. J Leukoc Biol. 2015;97(6):1011–1022. doi:10.1189/jlb.3HI0614-303R
15. Mlecnik B, Tosolini M, Charoentong P, et al. Biomolecular network reconstruction identifies T-cell homing factors associated with survival in colorectal cancer. Gastroenterology. 2010;138(4):1429–1440. doi:10.1053/j.gastro.2009.10.057
16. Wu XF, Ouyang ZJ, Feng LL, et al. Suppression of NF-kappaB signaling and NLRP3 inflammasome activation in macrophages is responsible for the amelioration of experimental murine colitis by the natural compound fraxinellone. Toxicol Appl Pharmacol. 2014;281(1):146–156. doi:10.1016/j.taap.2014.10.002
17. Pekow J, Dougherty U, Huang Y, et al. Gene signature distinguishes patients with chronic ulcerative colitis harboring remote neoplastic lesions. Inflamm Bowel Dis. 2013;19(3):461–470. doi:10.1097/MIB.0b013e3182802bac
18. Bjerrum JT, Hansen M, Olsen J, Nielsen OH. Genome-wide gene expression analysis of mucosal colonic biopsies and isolated colonocytes suggests a continuous inflammatory state in the lamina propria of patients with quiescent ulcerative colitis. Inflamm Bowel Dis. 2010;16(6):999–1007. doi:10.1002/ibd.21142
19. Planell N, Lozano JJ, Mora-Buch R, et al. Transcriptional analysis of the intestinal mucosa of patients with ulcerative colitis in remission reveals lasting epithelial cell alterations. Gut. 2013;62(7):967–976. doi:10.1136/gutjnl-2012-303333
20. Galamb O, Gyorffy B, Sipos F, et al. Inflammation, adenoma and cancer: objective classification of colon biopsy specimens with gene expression signature. Dis Markers. 2008;25(1):1–16. doi:10.1155/2008/586721
21. Ritchie ME, Phipson B, Wu D, et al. limma powers differential expression analyses for RNA-sequencing and microarray studies. Nucleic Acids Res. 2015;43(7):e47. doi:10.1093/nar/gkv007
22. Leek JT, Johnson WE, Parker HS, Jaffe AE, Storey JD. The sva package for removing batch effects and other unwanted variation in high-throughput experiments. Bioinformatics. 2012;28(6):882–883. doi:10.1093/bioinformatics/bts034
23. Hanzelmann S, Castelo R, Guinney J. GSVA: gene set variation analysis for microarray and RNA-seq data. BMC Bioinform. 2013;14(1):7. doi:10.1186/1471-2105-14-7
24. Yu G, Wang LG, Han Y, He QY. clusterProfiler: an R package for comparing biological themes among gene clusters. OMICS. 2012;16(5):284–287. doi:10.1089/omi.2011.0118
25. Charoentong P, Finotello F, Angelova M, et al. Pan-cancer immunogenomic analyses reveal genotype-immunophenotype relationships and predictors of response to checkpoint blockade. Cell Rep. 2017;18(1):248–262. doi:10.1016/j.celrep.2016.12.019
26. Jia Q, Wu W, Wang Y, et al. Local mutational diversity drives intratumoral immune heterogeneity in non-small cell lung cancer. Nat Commun. 2018;9(1):5361. doi:10.1038/s41467-018-07767-w
27. Langfelder P, Horvath S. WGCNA: an R package for weighted correlation network analysis. BMC Bioinform. 2008;9(1):559. doi:10.1186/1471-2105-9-559
28. Szklarczyk D, Gable AL, Lyon D, et al. STRING v11: protein-protein association networks with increased coverage, supporting functional discovery in genome-wide experimental datasets. Nucleic Acids Res. 2019;47(D1):D607–D613.
29. Chin CH, Chen SH, Wu HH, Ho CW, Ko MT, Lin CY. cytoHubba: identifying hub objects and sub-networks from complex interactome. BMC Syst Biol. 2014;8(Suppl 4):S11. doi:10.1186/1752-0509-8-S4-S11
30. Shannon P, Markiel A, Ozier O, et al. Cytoscape: a software environment for integrated models of biomolecular interaction networks. Genome Res. 2003;13(11):2498–2504. doi:10.1101/gr.1239303
31. Sing T, Sander O, Beerenwinkel N, Lengauer T. ROCR: visualizing classifier performance in R. Bioinformatics. 2005;21(20):3940–3941. doi:10.1093/bioinformatics/bti623
32. Eaden JA, Abrams KR, Mayberry JF. The risk of colorectal cancer in ulcerative colitis: a meta-analysis. Gut. 2001;48(4):526–535. doi:10.1136/gut.48.4.526
33. Hirano T, Hirayama D, Wagatsuma K, Yamakawa T, Yokoyama Y, Nakase H. Immunological mechanisms in inflammation-associated colon carcinogenesis. Int J Mol Sci. 2020;21(9):9. doi:10.3390/ijms21093062
34. Watanabe T, Kobunai T, Yamamoto Y, et al. Predicting ulcerative colitis-associated colorectal cancer using reverse-transcription polymerase chain reaction analysis. Clin Colorectal Cancer. 2011;10(2):134–141. doi:10.1016/j.clcc.2011.03.011
35. Robles AI, Traverso G, Zhang M, et al. Whole-exome sequencing analyses of inflammatory bowel disease-associated colorectal cancers. Gastroenterology. 2016;150(4):931–943.
36. Yao D, Dong M, Dai C, Inflammation WS. Inflammatory cytokine contribute to the initiation and development of ulcerative colitis and its associated cancer. Inflamm Bowel Dis. 2019;25(10):1595–1602. doi:10.1093/ibd/izz149
37. Karin M. Nuclear factor-kappaB in cancer development and progression. Nature. 2006;441(7092):431–436. doi:10.1038/nature04870
38. Luo C, Zhang H. The role of proinflammatory pathways in the pathogenesis of colitis-associated colorectal cancer. Mediators Inflamm. 2017;2017:5126048. doi:10.1155/2017/5126048
39. Greten FR, Eckmann L, Greten TF, et al. IKKbeta links inflammation and tumorigenesis in a mouse model of colitis-associated cancer. Cell. 2004;118(3):285–296. doi:10.1016/j.cell.2004.07.013
40. Popivanova BK, Kitamura K, Wu Y, et al. Blocking TNF-alpha in mice reduces colorectal carcinogenesis associated with chronic colitis. J Clin Invest. 2008;118(2):560–570.
41. Mukaida N, Sasaki SI, Baba T. CCL4 signaling in the tumor microenvironment. Adv Exp Med Biol. 2020;1231:23–32.
42. Zhong X, Lee HN, Surh YJ. RvD1 inhibits TNFalpha-induced c-Myc expression in normal intestinal epithelial cells and destabilizes hyper-expressed c-Myc in colon cancer cells. Biochem Biophys Res Commun. 2018;496(2):316–323. doi:10.1016/j.bbrc.2017.12.171
43. Elbadawy M, Usui T, Yamawaki H, Sasaki K. Emerging roles of C-Myc in cancer stem cell-related signaling and resistance to cancer chemotherapy: a potential therapeutic target against colorectal cancer. Int J Mol Sci. 2019;20(9):9. doi:10.3390/ijms20092340
44. Rohini M, Haritha Menon A, Selvamurugan N. Role of activating transcription factor 3 and its interacting proteins under physiological and pathological conditions. Int J Biol Macromol. 2018;120(Pt A):310–317. doi:10.1016/j.ijbiomac.2018.08.107
45. Cao Y, Yang Q, Deng H, et al. Transcriptional factor ATF3 protects against colitis by regulating follicular helper T cells in Peyer’s patches. Proc Natl Acad Sci U S A. 2019;116(13):6286–6291. doi:10.1073/pnas.1818164116
46. Inoue M, Uchida Y, Edagawa M, et al. The stress response gene ATF3 is a direct target of the Wnt/beta-catenin pathway and inhibits the invasion and migration of HCT116 human colorectal cancer cells. PLoS One. 2018;13(7):e0194160.
47. Ramji DP, Foka P. CCAAT/enhancer-binding proteins: structure, function and regulation. Biochem J. 2002;365(Pt 3):561–575. doi:10.1042/bj20020508
48. Collins CB, Puthoor PR, Nguyen TT, et al. C/EBPbeta deletion promotes expansion of poorly functional intestinal regulatory T cells. J Crohns Colitis. 2018;12(12):1475–1485.
49. Ji Y, Li J, Li P, Wang L, Yang H, Jiang G. C/EBPbeta promotion of MMP3-dependent tumor cell invasion and association with metastasis in colorectal cancer. Genet Test Mol Biomarkers. 2018;22(1):5–10. doi:10.1089/gtmb.2017.0113
50. Wu T, Wang C, Wang W, et al. Embelin impairs the accumulation and activation of MDSCs in colitis-associated tumorigenesis. Oncoimmunology. 2018;7(11):e1498437. doi:10.1080/2162402X.2018.1498437
51. Hasselblatt P, Gresh L, Kudo H, Guinea-Viniegra J, Wagner EF. The role of the transcription factor AP-1 in colitis-associated and beta-catenin-dependent intestinal tumorigenesis in mice. Oncogene. 2008;27(47):6102–6109. doi:10.1038/onc.2008.211
 © 2020 The Author(s). This work is published and licensed by Dove Medical Press Limited. The full terms of this license are available at https://www.dovepress.com/terms.php and incorporate the Creative Commons Attribution - Non Commercial (unported, v3.0) License.
By accessing the work you hereby accept the Terms. Non-commercial uses of the work are permitted without any further permission from Dove Medical Press Limited, provided the work is properly attributed. For permission for commercial use of this work, please see paragraphs 4.2 and 5 of our Terms.
© 2020 The Author(s). This work is published and licensed by Dove Medical Press Limited. The full terms of this license are available at https://www.dovepress.com/terms.php and incorporate the Creative Commons Attribution - Non Commercial (unported, v3.0) License.
By accessing the work you hereby accept the Terms. Non-commercial uses of the work are permitted without any further permission from Dove Medical Press Limited, provided the work is properly attributed. For permission for commercial use of this work, please see paragraphs 4.2 and 5 of our Terms.