")
Back to Journals » International Journal of Nanomedicine » Volume 17
A SERS Platform for Rapid Detection of Drug Resistance of Non-Candida albicans Using Fe3O4@PEI and Triangular Silver Nanoplates
Authors Gu F, Hu S, Wu Y, Wu C, Yang Y, Gu B, Du H
Received 11 April 2022
Accepted for publication 24 July 2022
Published 9 August 2022 Volume 2022:17 Pages 3531—3541
DOI https://doi.org/10.2147/IJN.S369591
Checked for plagiarism Yes
Review by Single anonymous peer review
Peer reviewer comments 2
Editor who approved publication: Prof. Dr. Anderson Oliveira Lobo
Feng Gu,1,2,* Shan Hu,3,* Yunjian Wu,4,* Changyu Wu,4 Ying Yang,5 Bing Gu,6 Hong Du1
1Department of Clinical Laboratory, The Second Affiliated Hospital of Soochow University, Suzhou, 215004, People’s Republic of China; 2Department of Laboratory Medicine, Xuzhou Central Hospital, Xuzhou, 221000, People’s Republic of China; 3Department of Laboratory Medicine, Xuzhou Tumor Hospital, Xuzhou, 221005, People’s Republic of China; 4School of Medical Imaging, Xuzhou Medical University, Xuzhou, 221004, People’s Republic of China; 5Department of Biotechnology, Beijing Institute of Radiation Medicine, Beijing Key Laboratory of New Molecular Diagnosis Technologies for Infectious Diseases, Beijing, 100850, People’s Republic of China; 6Guangdong Provincial People’s Hospital, Guangdong Academy of Medical Sciences, Guangzhou, 510000, People’s Republic of China
*These authors contributed equally to this work
Correspondence: Hong Du; Ying Yang, Email [email protected]; [email protected]
Purpose: Candida infection has a high mortality rate, and the increasing prevalence of non-Candida albicans drug resistance in recent years poses a potential threat to human health. Non-Candida albicans has long culture cycles, and its firm cell walls making it difficult to isolate DNA for sequencing.
Materials and Methods: Fe3O4@PEI (PEI, polyvinyl imine) was mixed with clinical samples to form Fe3O4@PEI@non-Candida albicans and enriched them with magnets. Triangular silver nanoplates enhanced the surface-enhanced Raman scattering (SERS) signal. SERS was used to detect the fingerprint spectrum of non-Candida albicans. Then, orthogonal partial least squares discriminant analysis (OPLS-DA) was used to analyze the drug resistance of non-Candida albicans.
Results: SERS combined with OPLS-DA could well analyze the drug resistance of non-Candida albicans. Through 10-fold-cross validation, the accuracy of training and test data is greater than 99%, indicating that the model has good classification ability. We used SERS for the first time to detect the drug resistance of non-Candida albicans directly.
Conclusion: This approach can be utilized without causing damage to the cell wall and can be accomplished in as little as 90 minutes. It can provide timely guidance for the treatment of patients with good clinical application potential.
Keywords: non-Candida albicans, SERS, drug resistance, OPLS-DA
Introduction
The extensive use of broad-spectrum antibiotics, immunosuppressants, and glucocorticoids in clinical treatment, as well as the growing use of invasive therapeutic interventions, have all contributed to an increase in the prevalence of invasive fungal infections.1 The mortality rate of patients with invasive infection is very high, and Candida is the pathogen causing the highest proportion of fungal infections in clinical practice.2 In recent years, the proportion of non-Candida albicans isolated from Candida infection patients, such as Candida tropicalis, Candida glabrata, and Candida parapsilosis, has increased,3 and the drug resistance rate has also amplified year by year.4 They demonstrated a high level of resistance not only to fluconazole (FLC) but also to voriconazole (VRC) and amphotericin B (AMB) over time.5,6 VRC is one of the most commonly used Candida treatment drugs in clinical applications. Recently, its drug resistance form has become more severe.7
Patients with Candida infection always have fever, dyspnea, nausea, vomiting, and other non-specific clinical symptoms, which are difficult for doctors to diagnose directly through clinical manifestations,7 resulting in late treatment timing and increased mortality.8 Additionally, doctors frequently administer broad-spectrum antibiotics and antifungal medications occasionally to buy patients time while they wait for a clinical laboratory diagnosis and the pathogen’s medication sensitivity is unknown, leading to enhanced strain resistance. The dismal state of non-Candida albicans resistance has deteriorated significantly in recent years.9 Rapid and accurate identification of non-Candida albicans and detection of drug resistance are of great significance to improve the therapeutic effect and reduce mortality in patients.
The “golden standard” for pathogen detection is isolation and culture method, but fungi are difficult to be cultured in vitro, and the culture cycle is lengthy. Coupled with the time of drug sensitivity identification, it takes at least one week to obtain the drug sensitivity test report.10,11 Clinical detection using matrix-assisted laser desorption ionization time-of-flight mass spectrometry (MALDI-TOF MS) requires pure culture and cannot be conducted immediately.12 Sequence-based methods such as DNA sequencing and polymerase chain reaction (PCR) have many limitations in application because there is no efficient method to extract DNA by destroying fungal cell walls.13,14 Surface-enhanced Raman Spectroscopy (SERS) can directly detect fungi without destroying fungal cell walls, which is a huge advantage of fungal detection. This method has the features of simple operation, low cost, and fast detection, etc. It has been demonstrated to be a promising tool for fungal identification.15,16 Fungal species can be distinguished by SERS fingerprint combined with orthogonal partial least squares discriminant analysis (OPLS-DA).11 However, due to the similar components of drug-resistant strains and sensitive strains, SERS technology is rarely used to distinguish fungal drug resistance.
In order to improve the reproducibility of this detection method, we prepared very stable and pour triangular silver nanoplates as the improved substrate for SERS.17 We first identified C. tropicalis, C. glabrata, and C. parapsilosis, and then distinguished their sensitive and VRC resistant strains. The specific steps are as follows: non-Candida albicans from samples was captured with polyethylene imine (PEI) modified Fe3O4 to form Fe3O4@PEI@non-Candida albicans mixture. After the mixture was enriched by triangular silver nanoplates, SERS detection was conducted directly to identify non-Candida albicans. The OPLS-DA algorithm was used to distinguish the sensitive and drug-resistant strains. It provides a new method for clinical fungal resistance detection.
Material and Methods
Chemicals
Silver nitrate (AgNO3, 98% pure), sodium borohydride (NaBH4), 97% sodium hydroxide (NaOH), ferric oxide hexahydrate (FeCl3·6H2O), sodium acetate (NaOAc), ethylene glycol ((CH2OH)2), cetyl trimethyl ammonium bromide (CTAB), and 99% pure ascorbic acid were prepared by Sinopharm Group (Beijing, China). Xuzhou Tongxin Optoelectronic Technology Co., LTD provided a monocrystalline silicon chip, and the PEI was acquired from Sigma Aldrich (China). Sabouraud Dextrose Agar (SDA) medium was purchased from Qingdao Rishui Biotechnology Co., LTD. The ultra-pure water was purchased from China Resources Ebao Beverage (China) Co., LTD. Clinical specimens of C. tropicalis, C. glabrata, and C. parapsilosis used in this study were provided by Guangdong Provincial People’s Hospital.
Instrumentation
The i-Raman Plus BWS465-785 H Raman spectrometer was purchased from B&W Tek Co., LTD., (USA). HITACHI SU8020 scanning electron microscope (SEM) and Ht-7700 transmission electron microscope (TEM) were obtained from HITACHI (Japan), and FEI Tecnai G2 F30 TEM was obtained from FEI (USA). Thermo Fisher Scientific Nanodrop One C UV-Visible spectrophotometer was purchased from Thermo Fisher Scientific (USA). The size of nanomaterials was recorded by Malvern Nano-ZS90 Zetasizer laser. Bsm-120.4 Electronic balance was acquired from Shanghai Zhuojing Electronic Technology Co., LTD., the heating electromagnetic stirrer was provided by Henan Aibot Technology Co., LTD, in China, and the Fungus incubator was provided by Shanghai Yuejin Medical Instrument Co., LTD.
Collection and Drug Sensitivity Test of Samples
The non-Candida albicans in samples such as urine, alveolar lavage fluid were cultured on SDA medium and identified by MALDI-TOF MS (Mérieux, France) in Guangdong Provincial People’s Hospital. The drug resistance was detected through Kirby-Bauer (KB) drug sensitivity test.
Preparation for Substrate
Triangular silver nanoplates were prepared as the SERS substrate for this experiment. Silver seed nanoparticles were prepared for synthesizing triangular silver nanoplates. The synthesis steps of silver seed nanoparticles were as follows: first, 36.45 mg CTAB was dissolved in 1mL ultra-pure water to prepare 100 mM CTAB solution. The CTAB solution was diluted 250 times to obtain a concentration of 0.4 mM. A 10 mL of the diluted solution was poured on a magnetic stirrer and stirred, then 15 mg AgNO3 and 0.3 mL of 10 mM NaBH4 solution was added and stirred for another 2–5 minutes. The seed solution was kept away from light for 60 minutes.18,19
Further, the triangular silver nanoplates were prepared. CTAB (36.45 mg) was dissolved in 10 mL ultra-pure water to prepare 10 mM CTAB solution, and 250 µL of 20 mM AgNO3 and 500 µL of 100 mM ascorbic acid solution were mixed with the freshly prepared CTAB solution. Silver seed nanoparticles (100 µL) were poured into the mixture. Finally, 100 µL of 1 M NaOH solution was added to the mixture and shook well for 10 minutes. When the solution turned dark blue, the experiment was successful, and the reaction was complete.18,20
Preparation for Fe3O4
Large size Fe3O4 particles were prepared following procedure: FeCl3·6H2O (3.35 g) was added into 100 mL (CH2OH)2 and stirred for half an hour; 2.5 g of PEG6000 and 6.75g of NaAc were poured into the mixture. The dissolved solution was poured into a high-pressure reactor and then heated at 210 °C for 12 h. The reaction products were washed with ethanol and ultra-pure water followed by drying in a vacuum at 60 °C for about 6 hours.11,21
SERS Detection
Fe3O4 (500 mg) was mixed with 0.5 g/100 mL of PEI solution under ultrasound for about 1 hour. Because the Fe3O4 and PEI can attract each other by electrostatic force, they were fully mixed to form Fe3O4@PEI, washing it with ultra-pure water for Fe3O4@PEI 5 times (Figure 1A). Fe3O4@PEI was added to the specimens with non-Candida albicans, fully mixed, and incubated on an oscillator for 20 min. Fe3O4@PEI could capture non-Candida albicans to form Fe3O4@PEI@ non-Candida albicans complex (Figure 1B). After the compound was enriched with a magnet, the supernatant was removed. The precipitate was mixed with an equal volume of triangular silver nanoplates. A drop of the mixture was absorbed and placed on a monocrystalline silicon wafer to dry for standby use. The Raman spectrometer has a spot diameter of about 105 µm, a maximum laser power of 275 mW, and a laser wavelength of 785 nm. The parameters set during detection were as follows: the integration time was 0.5 minutes, the excitation power was 15% of the maximum power. Five spectrums of the same sample were taken, and the average intensity was calculated as SERS fingerprint spectrum data of the sample (Figure 1C). The fingerprint spectrum tested may contain fluorescence and thermal background, and we used the software accompanying the spectrometer to deduce the baseline to get a flat baseline spectrum. After removing the baseline, the spectrum was smoothed based on the signal intensity of the spectrum. The fingerprint spectrum was compared using Origin 2021.
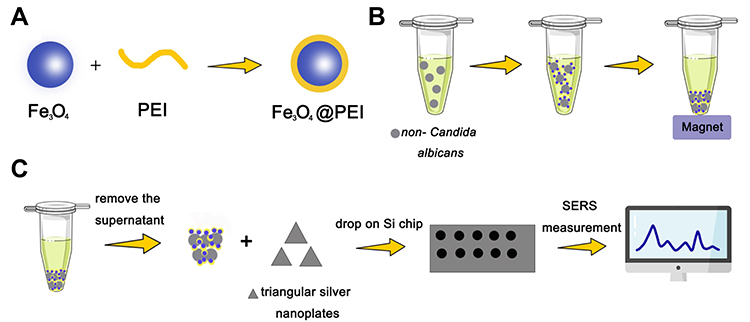 |
Figure 1 SERS detection of non-Candida albicans. (A) Fe3O4 was mixed with PEI. (B) Non-Candida albicans is captured by Fe3O4@PEI. (C) SERS detection of non-Candida albicans using Fe3O4@PEI and triangular silver nanoplates. |
Statistical Analysis
Principal component analysis (PCA) is an unsupervised dimension reduction method, which can effectively process high-dimensional data. However, PCA is insensitive to variables with small correlation, while Partial least squares discriminant analysis (PLS-DA) can effectively solve this problem. OPLS-DA combines orthogonal signals with PLS-DA to screen differential variables. Moreover, OPLS-DA is suitable for pairwise analysis, so we chose OPLS-DA to analyze the drug resistance of non-Candida albicans. SIMCA 14.1 software was used to perform statistical analysis on the collected spectrum using OPLS-DA. The difference model between the groups is constructed using OPLS-DA. R2X and R2Y represent the explanatory rate of the model to the X matrix and Y matrix, respectively. Q2 represents the predictive power of the model. The more R2 and Q2 tend to 1, the better the quasi-precision of the model. R2 and Q2 of clinical sample results greater than 0.4 indicated that the established OPLS-DA model had good adaptability and predictability.22,23 The classification ability was evaluated by 10-fold-cross validation.24
Results
Characterization of Triangular Silver Nanoplates
Figure 2A depicts a dark blue liquid with the appearance of triangular silver nanoplates. TEM images of triangular silver nanoplates in the presence of a common factor are shown in Figure 2B and C, triangular silver nanoplates are equilateral triangles with uniform size. In the presence of serial correlation, Figure 2D–F illustrates an elemental analysis of triangular silver nanoplates, where Ag is concentrated and dispersed on the triangular silver nanoplates while O and Na are evenly distributed in the solution. As illustrated in Figure 2E, the particle size of triangular silver nanoplates is around 60 nm. Because non-Candida albicans has a bigger size than most bacteria, nano-silver with a large particle size was better suitable for SERS detection of non-Candida albicans.25,26 The UV absorption of triangular silver nanoplates is 636nm, and its UV spectrum is shown in Figure 2F.
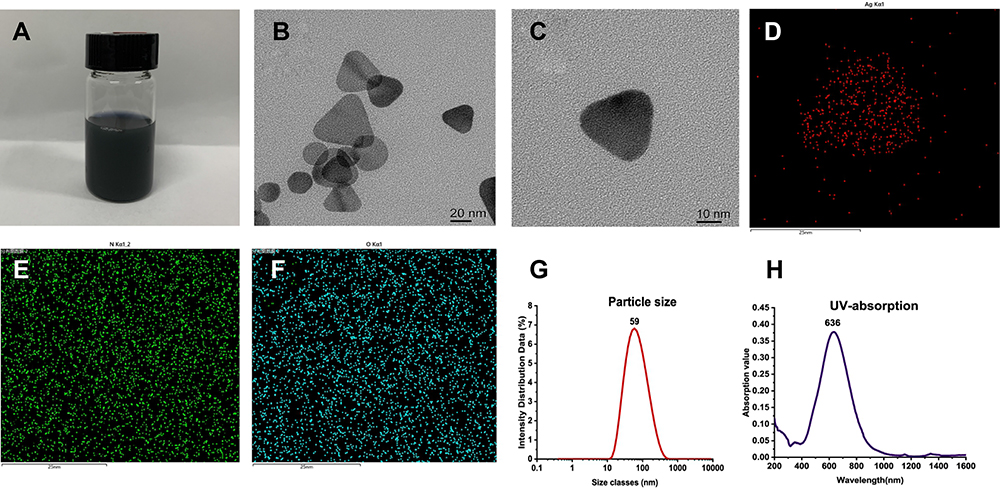 |
Figure 2 Characterization of triangular silver nanoplates. (A) The appearance of triangular silver nanoplates is a dark blue liquid. (B and C) TEM image of triangular silver nanoplates shown that triangular silver nanoplates are equilateral triangles with uniform size. (D–F) Elemental analysis of triangular silver nanoplates in the presence of stationarity, Ag is concentrated and dispersed on the triangular silver nanoplates while O and Na are evenly distributed in the solution. (G) Particle size of triangular silver nanoplates is 59nm. (H) UV spectrum of triangular silver nanoplates, the UV absorption of triangular silver nanoplates is 636nm. |
Characterization of Fe3O4@PEI
The SEM picture of Fe3O4@PEI in Figure 3A demonstrates that it is uniformly scattered in solution and has a spherical shape, and the size of Fe3O4@PEI is about 300 nm; large particle sizes of Fe3O4@PEI are more suited for fungus detection. Figure 3B shows a TEM picture of Fe3O4@PEI, demonstrating that PEI adheres to the surface of Fe3O4 and forms a thin layer of uniform thickness. PEI has good hydrophilicity and can self-assemble onto the surface of other nanoparticles to aminate the surface of nanoparticles.27 Figure 3C–E depicts the element analysis diagram of Fe3O4@PEI, where O and Fe are densely distributed in Fe3O4@PEI.
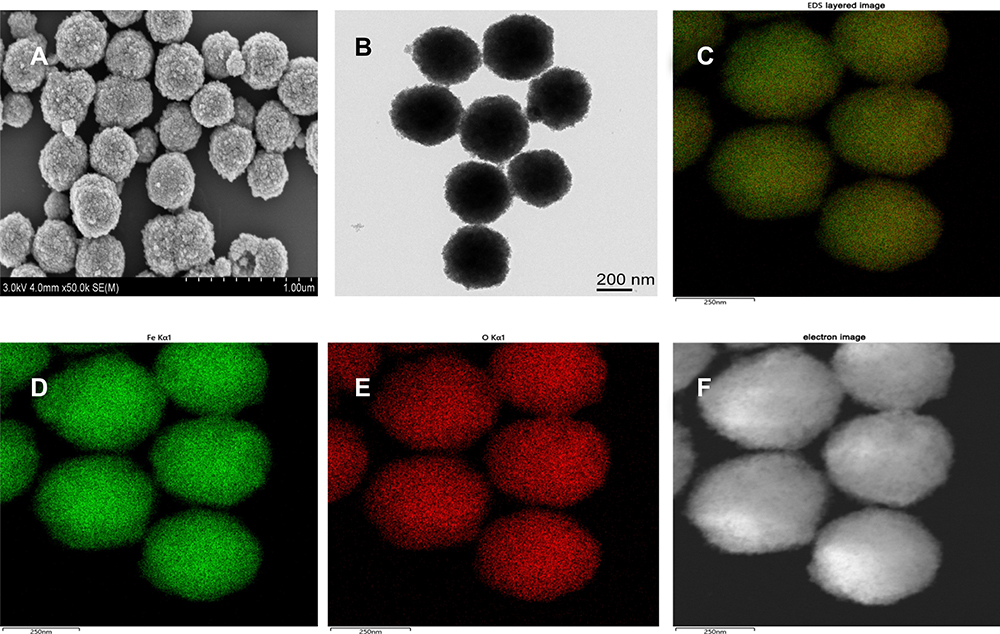 |
Figure 3 Characterization of Fe3O4@PEI. (A) SEM image of Fe3O4@PEI, Fe3O4@PEI demonstrates uniformly scattered in solution and has a spherical shape, and the size of Fe3O4@PEI is about 300 nm. (B) TEM image of Fe3O4@PEI, PEI adheres to the surface of Fe3O4 and forms a thin layer of uniform thickness. (C–F) Element analysis diagram of Fe3O4@PEI, O and Fe are densely distributed in the Fe3O4@PEI. |
Fe3O4@PEI Capture Non-Candida albicans
We observed the products formed by Fe3O4@PEI after capturing non-Candida albicans by SEM. As can be seen from Figure 4A–C, Fe3O4@PEI was firmly adsorbed on non-Candida albicans and formed Fe3O4@PEI@non-Candida albicans, indicating that Fe3O4@PEI could capture non-Candida albicans from samples. After enrichment of Fe3O4@PEI@non-Candida albicans with magnets, we calculated [1-(the number of fungi remaining in supernatant/the number of fungi in the original specimen)] × 100% that Fe3O4@PEI captured 97%, 95.6%, and 96.2% of C. tropicalis, C. glabrata, and C. parapsilosis, respectively, as shown in Figure 4D. The results indicated that non-Candida albicans could be rapidly enriched by this method.
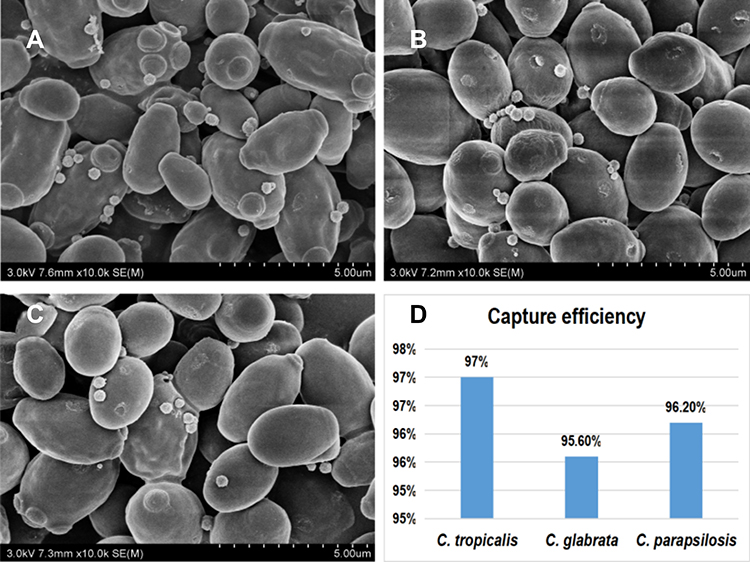 |
Figure 4 Fe3O4@PEI Capture non-Candida albicans. (A) SEM image of Fe3O4@PEI@C. tropicalis, Fe3O4@PEI was firmly adsorbed on C. tropicalis. (B) SEM image of Fe3O4@PEI@C. glabrata, Fe3O4@PEI was firmly adsorbed on C. glabrata. (C) SEM image of Fe3O4@PEI@C. parapsilosis Fe3O4@PEI was firmly adsorbed on C. parapsilosis. (D) Capture efficiency of C. tropicalis, (C) glabrata, and C. parapsilosis are all >95%. |
SERS Detection of Non-Candida albicans
SERS detected a total of 34 strains of non-Candida albicans. Four strains of C. tropicalis were sensitive to VRC and 6 strains of C. tropicalis were resistant to VRC; their SERS spectrums are shown in Figure 5A. There were 3 strains of C. glabrata sensitive to VRC and 3 strains of C. glabrata resistant to VRC (Figure 5B). Twelve strains of C. parapsilosis were sensitive to VRC, and 6 strains were resistant to VRC, as the SERS spectrums are shown in Figure 5C. The Raman spectra of sensitive and resistant strains to VRC of the same non-Candida albicans are similar, but there are still differences.
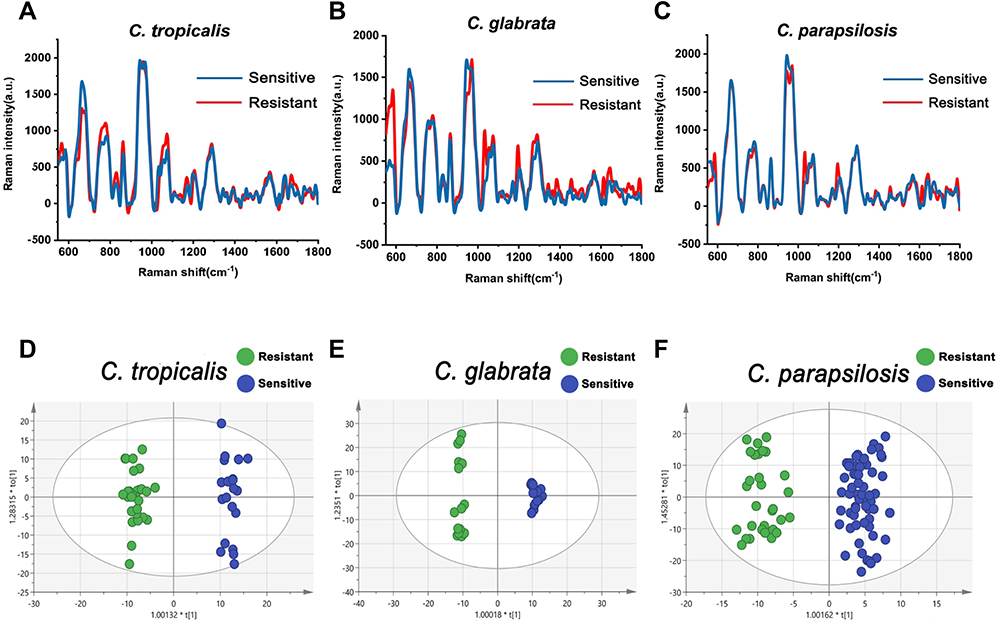 |
Figure 5 SERS detection results of non-Candida albicans. (A) SERS spectrum of C. tropicalis. (B) SERS spectrum of C. glabrata. (C) SERS spectrum of C. parapsilosis. (D) OPLS-DA result of VRC sensitive strains and VRC resistant strains of C. tropicalis. (E) OPLS-DA result of VRC sensitive strains and VRC resistant strains of C. glabrata. (F) OPLS-DA result of VRC sensitive strains and VRC resistant strains of C. parapsilosis. |
Statistical Analysis
OPLS-DA was used to distinguish VRC sensitive strains and VRC resistant strains of the three species of non-Candida albicans. Figure 5D displays that, according to the OPLS-DA score plot, there was a significant separation between VRC sensitive and VRC resistant strains of C. tropicalis. Model parameters of OPLS-DA analysis (as shown in Table 1) indicate that the model is well established and has a good predictive ability. Ten-fold-cross validation has been performed to evaluate the model classification accuracy. The average accuracy of training and test data is 100% and 100%, respectively. We used OPLS-DA to distinguish VRC sensitive strains and VRC resistant strains of C. glabrata, and they were well differentiated in the scoring diagram (Figure 5E). Model parameters of OPLS-DA analysis are shown in Table 1. The average accuracy of training and test data are 100% and 100%, respectively, which indicates that the model has good performance. Finally, OPLS-DA scores of VRC sensitive strains and VRC resistant strains of C. parapsilosis were compared. Figure 5F illustrates that the two fungal strains are well separated. Model parameters of OPLS-DA analysis (Table 2), showing good predictive ability. We also apply the 10-fold-cross validation to evaluate the classification ability of the model. The average training and test data accuracy was 99.05% and 99.83%, respectively, indicating that the model has good performance.
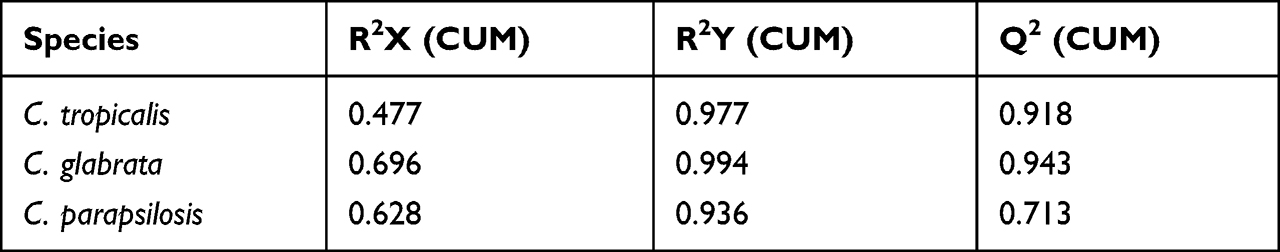 |
Table 1 Model Parameters of OPLS-DA Analysis |
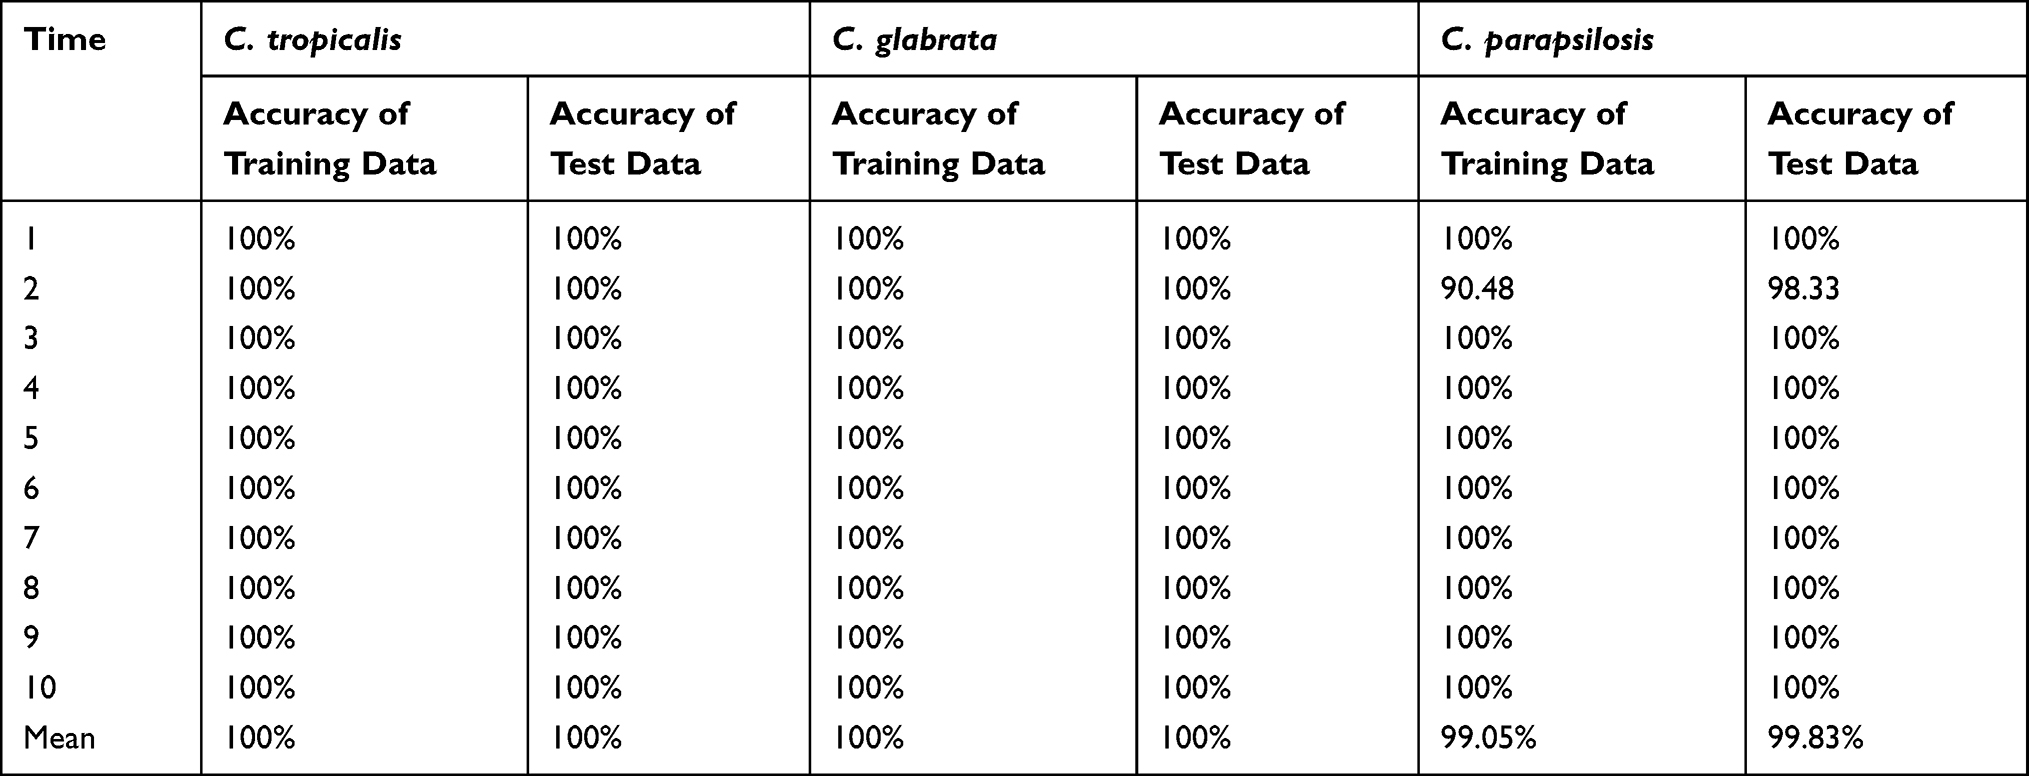 |
Table 2 10-Fold-Cross Experimental Validation Results |
Discussion
In this study, the SERS spectrum combined with OPLS-DA statistical analysis method was used to swiftly and non-destructively identify C. tropicalis, C. glabrata, and C. parapsilosis sensitive strains and VRC resistant strains. In clinical practice, the most commonly used approach for detecting drug sensitivity in fungi is still a pure culture of patient materials, identification of the cultured fungi, and then identification of drug sensitivity by fungal drug sensitivity plate. Because fungi are difficult to be cultured in vitro, the missed detection rate is high, and even the culture takes a long time; it may take ten days or more from patient samples to the drug sensitivity report.28,29 The clinical application of MALDI-TOF MS still needs to be based on pure culture. At the same time, the sequencing method has significant restrictions in clinical application because of the lack of an efficient wall-breaking method to extract DNA. Due to the high equipment cost, MALDI-TOF MS and sequencing applications are still limited in developing countries and grassroots units.30–32 Therefore, we used Fe3O4@PEI to capture non-Candida albicans from specimens directly and then enriched them. Using triangular silver nanoplates as the base and the characteristics of the SERS detection method with strong specificity and high sensitivity, non-Candida albicans were directly detected.33,34 Then, the principal component analysis of VRC resistance of non-Candida albicans was carried out by OPLS-DA, and the whole process was completed within 90min.
Compared with silver nanoparticles, silver nano-stars, silver nanorods and other nanomaterials commonly used as Raman substrate, triangular silver nanoplates we prepared have high stability, are difficult to decompose or degenerate, and are simple to standardize for clinical application and promotion. Particle size of triangular silver nanoplates is greater than 50 nm, which is more suitable for detecting non-Candida albicans with large particle sizes. What is more important is that the nano triangular plate is very pure and has no impurities, and it can be used as the reinforcement base to get more accurate and more stable Raman spectrum.19,35,36 Fe3O4@PEI has a high capture efficiency for negatively charged fungi because of its positive surface charge (C. tropicalis: 97%, C. glabrata: 95.6%, and C. parapsilosis: 96.2%), and Fe3O4@PEI@non-Candida albicans can be separated by a simple and rapid method. The size of the Fe3O4 synthesized in this study is very uniform, and coupled with the high stability of triangular silver nanoplates, the spectrum is very stable. For the future clinical application of this technology, the standardization of operation provides a good reference.
SERS identified and distinguished the resistance of fungi by detecting the fungal cell wall without destroying it. It could be detected in a few minutes or even seconds, very fast.37 The intensity differences among Raman peaks are mainly caused by the contents of nucleic acids, amino acids and lipids. Nucleic acids, amino acids and lipids play key roles in biochemical reactions, such as synthesizing the structural composition of fungal cell walls and maintaining fungal metabolism.38 Thus, changes associated with fungal resistance can be reflected by differences in spectral intensity in fungi. The mechanisms of resistance of fungi to azole antifungal drugs can be divided into five categories, namely, decreased affinity between target protein and drug; Overexpression of target protein; Overexpression of efflux system; Intracellular or extracellular degradation of drugs; Rescue mechanism, namely the formation of new metabolic pathways to replace the original blocked metabolic pathways to synthesize the original metabolites.39 OPLS-DA is required for principal component analysis of the spectrum. OPLS-DA divides the differences in data table X into two parts based on the differences in data table Y. The first part represents the difference associated with Y, and the second part represents the difference independent of Y (orthogonal vertical). OPLS-DA can distinguish the difference between these two parts. This section aims to control and filter out changes in X that directly intersect or are independent of Y. Therefore, OPLS-DA can easily distinguish differences between groups and improve the validity and analytical ability of the model. OPLS-DA score plots of the three models established in this study showed clustering in the same groups, and a significant separation trend was observed between the different groups.40,41 The OPLS-DA score diagram of the SERS spectrum of C. tropicalis sensitive strains, C. tropicalis VRC resistant strains, C. glabrata sensitive strain, C. glabrata VRC resistant strain, C. parapsilosis sensitive strain, and C. parapsilosis VRC resistant strain revealed that the sensitive strains of each strain and the VRC resistant strains were distributed on both sides. There was no intersection of these data. The results showed that OPLS-DA could distinguish non-Candida albicans sensitive strains from VRC resistant strains. As can be seen from Table 1, R2X(CUM), R2Y(CUM), and Q2(CUM) are all greater than 0.4, and the results of 10-fold-cross validation training data and test data are greater than 99%, indicating that this model is well established and has good classification ability.
This study found that SERS technology could be used to detect the drug resistance of non-Candida albicans directly from specimens. There was no need to break the wall of non-Candida albicans, and it could be directly detected, which made great use of the feature of SERS non-destructive detection. The size of the Fe3O4 synthesized in this study is very uniform, and coupled with the high stability of triangular silver nanoplates, the spectrum is very stable. For the future clinical application of this technology, the standardization of operation provides a good reference. SERS technology was utilized to directly identify non-Candida albicans drug resistance, introducing a novel concept for the problematic diagnosis and treatment of non-Candida albicans.
Conclusions
We explored a novel method for directly detecting drug resistance in non-Candida albicans from samples. Triangular silver nanoplates were used as SERS substrate to detect the SERS spectrum of non-Candida albicans captured by Fe3O4@PEI. This approach has a high detection rate and can be finished in less than 1.5 hours. This method has the advantages of simple operation, high accuracy, high specificity and no need to destroy the cell wall for the detection of fungi, which makes up for the deficiency of the commonly used methods for the identification of drug-resistant fungi in clinic. It provides a new idea for early diagnosis and early treatment of patients, and lays a foundation for establishing the standardized operation process of this method in the future, which has good application potential. However, the sensitivity of SERS technology for clinical microbial test is still relatively low at present, so there is still a long way to go for direct clinical application, and SERS fungus database needs to be established for clinical test matching.
Ethical Statement
This study has been approved by the ethics review committee of the Guangdong Provincial People’s Hospital, China. Comply with the World Medical Association Declaration of Helsinki, the relevant Chinese laws and regulations, and other ethical principles to protect the rights and interests of the subjects, as well as the regulations of the ethics committee of Guangdong (accession number: KY-Q-2022-055-01). The informed consent of the patient was exempted.
Acknowledgments
This research was supported by the National Natural Science Foundation of China (81871734, 81471994), Research foundation for advanced talents of Guangdong Provincial People’s Hospital (KJ012021097), the Science Foundation of Jiangsu Province Health Department (ZDB2020014), the Science Foundation of Suzhou Health Department (LCZX202106).
Author Contributions
All authors made a significant contribution to the work reported, whether that is in the conception, study design, execution, acquisition of data, analysis and interpretation, or in all these areas; took part in drafting, revising or critically reviewing the article; gave final approval of the version to be published; have agreed on the journal to which the article has been submitted; and agree to be accountable for all aspects of the work.
Disclosure
The authors report no conflicts of interest in this work.
References
1. Arastehfar A, Carvalho A, Nguyen MH, et al. COVID-19-Associated Candidiasis (CAC): an underestimated complication in the absence of immunological predispositions?. J Fungi. 2020;6(4):211. doi:10.3390/jof6040211
2. Enoch DA, Yang H, Aliyu SH, Micallef C. The changing epidemiology of invasive fungal infections. Methods Mol Biol. 2017;1508:17–65. doi:10.1007/978-1-4939-6515-1_2
3. Sadeghi G, Ebrahimi-Rad M, Mousavi SF, Shams-Ghahfarokhi M, Razzaghi-Abyaneh M. Emergence of non-Candida albicans species: epidemiology, phylogeny and fluconazole susceptibility profile. J Mycol Med. 2018;28(1):51–58. doi:10.1016/j.mycmed.2017.12.008
4. Chen PY, Chuang YC, Wu UI, et al. Clonality of fluconazole-nonsusceptible Candida tropicalis in bloodstream infections, Taiwan, 2011–2017. Emerg Infect Dis. 2019;25(9):1660–1667. doi:10.3201/eid2509.190520
5. McCarty TP, Lockhart SR, Moser SA, et al. Echinocandin resistance among Candida isolates at an academic medical centre 2005–15: analysis of trends and outcomes. J Antimicrob Chemother. 2018;73(6):1677–1680. doi:10.1093/jac/dky059
6. Fujimoto K, Takemoto K. Efficacy of liposomal amphotericin B against four species of Candida biofilms in an experimental mouse model of intravascular catheter infection. J Infect Chemother. 2018;24(12):958–964. doi:10.1016/j.jiac.2018.08.011
7. Bačová E, Chovanec F, Makohusová M, et al. Invasive rhino-orbito-cerebral mucormycosis in pediatric patient with acute leukemia. Klin Onkol. 2020;33(2):138–144. doi:10.14735/amko2020138
8. Hani U, Shivakumar HG, Vaghela R, Osmani RA, Shrivastava A. Candidiasis: a fungal infection–current challenges and progress in prevention and treatment. Infect Disord Drug Targets. 2015;15(1):42–52. doi:10.2174/1871526515666150320162036
9. Silva S, Negri M, Henriques M, Oliveira R, Williams DW, Azeredo J. Candida glabrata, Candida parapsilosis and Candida tropicalis: biology, epidemiology, pathogenicity and antifungal resistance. FEMS Microbiol Rev. 2012;36(2):288–305. doi:10.1111/j.1574-6976.2011.00278.x
10. Lee SC, Lo HJ, Fung CP, Lee N, See LC. Disk diffusion test and E-test with enriched Mueller-Hinton agar for determining susceptibility of Candida species to voriconazole and fluconazole. J Microbiol Immunol Infect. 2009;42(2):148–153.
11. Hu S, Kang H, Gu F, et al. Rapid detection method for pathogenic Candida captured by magnetic nanoparticles and identified using SERS via AgNPs+. Int J Nanomedicine. 2021;6:941–950. doi:10.2147/IJN.S285339
12. Patel R. MALDI-TOF MS for the diagnosis of infectious diseases. Clin Chem. 2015;61(1):100–111. doi:10.1373/clinchem.2014.221770
13. Boers SA, Jansen R, Hays JP. Understanding and overcoming the pitfalls and biases of next-generation sequencing (NGS) methods for use in the routine clinical microbiological diagnostic laboratory. Eur J Clin Microbiol Infect Dis. 2019;38(6):1059–1070. doi:10.1007/s10096-019-03520-3
14. Chen M, Hong N, Hu S, et al. Molecular identification of Cryptococcus gattii from cerebrospinal fluid using single-cell sequencing: a case study. J Infect. 2020;81(4):634–638. doi:10.1016/j.jinf.2020.06.040
15. Tahir MA, Dina NE, Cheng H, Valev VK, Zhang L. Surface-enhanced Raman spectroscopy for bioanalysis and diagnosis. Nanoscale. 2021;13(27):11593–11634. doi:10.1039/D1NR00708D
16. Yu D, Yin Q, Wang J, et al. SERS-based immunoassay enhanced with silver probe for selective separation and detection of Alzheimer’s disease biomarkers. Int J Nanomedicine. 2021;16:1901–1911.
17. Hegde H, Santhosh C, Sinha RK. Seed mediated synthesis of highly stable CTAB capped triangular silver nanoplates for LSPR sensing. Mater Res Express. 2019;6(10):105075. doi:10.1088/2053-1591/ab3d8c
18. Zhang Q, Li N, Goebl J, Lu Z, Yin Y. A systematic study of the synthesis of silver nanoplates: is citrate a “magic” reagent? J Am Chem Soc. 2011;133(46):18931–18939. doi:10.1021/ja2080345
19. Ahmed B, Elgorban AM, Bahkali AH, Lee J, Syed A. SPR based gold nano-probe as optical sensor for cysteine detection via plasmonic enhancement in the presence of Cr3. Spectrochim Acta A Mol Biomol Spectrosc. 2022;265:120356. doi:10.1016/j.saa.2021.120356
20. Ahmed B, Syed A, Ali K, et al. Synthesis of gallotannin capped iron oxide nanoparticles and their broad spectrum biological applications. RSC Adv. 2021;11(17):9880–9893. doi:10.1039/D1RA00220A
21. Cheng S, Tu Z, Zheng S, et al. An efficient SERS platform for the ultrasensitive detection of Staphylococcus aureus and Listeria monocytogenes via wheat germ agglutinin-modified magnetic SERS substrate and streptavidin/aptamer co-functionalized SERS tags. Anal Chim Acta. 2021;1187:339155. doi:10.1016/j.aca.2021.339155
22. Song X, Canellas E, Nerin C. Screening of volatile decay markers of minced pork by headspace-solid phase microextraction-gas chromatography-mass spectrometry and chemometrics. Food Chem. 2021;342:128341. doi:10.1016/j.foodchem.2020.128341
23. Piras C, Pibiri M, Leoni VP, et al. Analysis of metabolomics profile in hypothyroid patients before and after thyroid hormone replacement. J Endocrinol Invest. 2021;44(6):1309–1319. doi:10.1007/s40618-020-01434-y
24. Li J, Wang C, Shi L, et al. Rapid identification and antibiotic susceptibility test of pathogens in blood based on magnetic separation and surface-enhanced Raman scattering. Mikrochim Acta. 2019;186(7):475. doi:10.1007/s00604-019-3571-x
25. Soliman AM, Abdel-Latif W, Shehata IH, Fouda A, Abdo AM, Ahmed YM. Green approach to overcome the resistance pattern of Candida spp. using biosynthesized silver nanoparticles fabricated by Penicillium chrysogenum F9. Biol Trace Elem Res. 2021;199(2):800–811. doi:10.1007/s12011-020-02188-7
26. Hu S, Gu F, Chen M, et al. A novel method for identifying and distinguishing Cryptococcus neoformans and Cryptococcus gattii by surface-enhanced Raman scattering using positively charged silver nanoparticles. Sci Rep. 2020;10(1):12480. doi:10.1038/s41598-020-68978-0
27. Wang CW, Xu JW, Wang JF, et al. Polyethylenimine-interlayered silver-shell magnetic core microspheres as multifunctional SERS substrates. J Mater Chem C. 2015;3(33):8684–8693. doi:10.1039/C5TC01839K
28. Posteraro B, Vella A, De Carolis E, Sanguinetti M. Molecular detection of resistance to azole components. Methods Mol Biol. 2017;1508:423–435.
29. Cuenca-Estrella M. Antifungal drug resistance mechanisms in pathogenic fungi: from bench to bedside. Clin Microbiol Infect. 2014;20(Suppl 6):54–59. doi:10.1111/1469-0691.12495
30. Paul S, Singh P, Sharma S, et al. MALDI-TOF MS-based identification of melanized fungi is faster and reliable after the expansion of in-house database. Proteomics Clin Appl. 2019;13(3):e1800070. doi:10.1002/prca.201800070
31. Sacheli R, Henri AS, Seidel L, et al. Evaluation of the new id-fungi plates from Conidia for MALDI-TOF MS identification of filamentous fungi and comparison with conventional methods as identification tool for dermatophytes from nails, hair and skin samples. Mycoses. 2020;63(10):1115–1127. doi:10.1111/myc.13156
32. Bonito G, Isikhuemhen OS, Vilgalys R. Identification of fungi associated with municipal compost using DNA-based techniques. Bioresour Technol. 2010;101(3):1021–1027. doi:10.1016/j.biortech.2009.08.109
33. Zhou Y, Zhao G, Bian J, et al. Multiplexed SERS barcodes for anti-counterfeiting. ACS Appl Mater Interfaces. 2020;12(25):28532–28538. doi:10.1021/acsami.0c06272
34. Restaino SM, White IM. A critical review of flexible and porous SERS sensors for analytical chemistry at the point-of-sample. Anal Chim Acta. 2019;1060:17–29. doi:10.1016/j.aca.2018.11.057
35. Sholkamy EN, Ahamd MS, Yasser MM, Eslam N. Anti-microbiological activities of bio-synthesized silver nano-stars by Saccharopolyspora hirsuta. Saudi J Biol Sci. 2019;26(1):195–200. doi:10.1016/j.sjbs.2018.02.020
36. Islam MA, Jacob MV, Antunes E. A critical review on silver nanoparticles: from synthesis and applications to its mitigation through low-cost adsorption by biochar. J Environ Manage. 2021;281:111918. doi:10.1016/j.jenvman.2020.111918
37. Zhou X, Hu Z, Yang D, et al. Bacteria detection: from powerful SERS to its advanced compatible techniques. Adv Sci. 2020;7(23):2001739. doi:10.1002/advs.202001739
38. Wang W, Mu M, Zou Y, et al. Label-free Raman spectroscopy characterizes signatures of inflammation and fibrosis in the silicosis. Biochem Biophys Res Commun. 2022;606:114–120. doi:10.1016/j.bbrc.2022.03.107
39. Hagiwara D, Watanabe A, Kamei K, et al. Epidemiological and genomic landscape of azole resistance mechanisms in Aspergillus Fungi. Front Microbiol. 2016;7:1382. doi:10.3389/fmicb.2016.01382
40. Jiang W, Si L, Li P, et al. Serum metabonomics study on antidiabetic effects of fenugreek flavonoids in streptozotocin-induced rats. J Chromatogr B. 2018;1092:466–472. doi:10.1016/j.jchromb.2018.06.041
41. Morvan D, Demidem A. NMR metabolomics of fibroblasts with inherited mitochondrial Complex I mutation reveals treatment-reversible lipid and amino acid metabolism alterations. Metabolomics. 2018;14(5):55. doi:10.1007/s11306-018-1345-9
 © 2022 The Author(s). This work is published and licensed by Dove Medical Press Limited. The full terms of this license are available at https://www.dovepress.com/terms.php and incorporate the Creative Commons Attribution - Non Commercial (unported, v3.0) License.
By accessing the work you hereby accept the Terms. Non-commercial uses of the work are permitted without any further permission from Dove Medical Press Limited, provided the work is properly attributed. For permission for commercial use of this work, please see paragraphs 4.2 and 5 of our Terms.
© 2022 The Author(s). This work is published and licensed by Dove Medical Press Limited. The full terms of this license are available at https://www.dovepress.com/terms.php and incorporate the Creative Commons Attribution - Non Commercial (unported, v3.0) License.
By accessing the work you hereby accept the Terms. Non-commercial uses of the work are permitted without any further permission from Dove Medical Press Limited, provided the work is properly attributed. For permission for commercial use of this work, please see paragraphs 4.2 and 5 of our Terms.