")
Back to Journals » Journal of Multidisciplinary Healthcare » Volume 10
A safety culture assessment by mixed methods at a public maternity and infant hospital in China
Authors Listyowardojo TA, Yan X, Leyshon S, Ray-Sannerud B, Yu XY, Zheng K, Duan T
Received 14 March 2017
Accepted for publication 25 May 2017
Published 3 July 2017 Volume 2017:10 Pages 253—262
DOI https://doi.org/10.2147/JMDH.S136943
Checked for plagiarism Yes
Review by Single anonymous peer review
Peer reviewer comments 3
Editor who approved publication: Dr Scott Fraser
Tita Alissa Listyowardojo,1 Xiaoling Yan,2,3 Stephen Leyshon,1 Bobbie Ray-Sannerud,1 Xin Yan Yu,4 Kai Zheng,4 Tao Duan2,3
1Life Sciences Program, Group Technology and Research, DNV GL, Hovik, Norway; 2Quality and Safety Department, Shanghai First Maternity and Infant Hospital, 3Tongji University School of Medicine, Shanghai, 4Healthcare Department, Business Assurance, DNV GL, Beijing, China
Objective: To assess safety culture at a public maternity hospital in Shanghai, China, using a sequential mixed methods approach. The study was part of a bigger study looking at the application of the mixed methods approach to assess safety culture in health care in different organizations and countries.
Methodology: A mixed methods approach was utilized by first distributing the Safety Attitudes Questionnaire measuring six safety culture dimensions and five independent items to all hospital staff (n=1482) working in 18 departments at a single hospital. Afterward, semistructured interviews were conducted using convenience sampling, where 48 hospital staff from nine departments at the same hospital were individually interviewed.
Results: The survey received a response rate of 96%. The survey findings show significant differences between the hospital departments in almost all safety culture dimensions and independent items. Similarly, the interview findings revealed that there were different, competing priorities between departments perceived to result in a reduced quality of collaboration and bottlenecks in care delivery. Another major finding was that staff who worked more hours per week would perceive working conditions significantly more negatively. Issues related to working conditions were also the most common concerns discussed in the interviews, especially the issue on high workload. High workload was also reflected in the fact that 91.45% of survey respondents reported that they worked 40 hours or longer per week. Finally, interview findings complemented survey findings, thus providing a more complete and accurate picture of safety culture.
Conclusion: Hospital leaders need to prioritize interventions focused on improving the quality of cross-department collaboration and reducing workload. A mixed methods assessment of safety culture provides more meaningful, targeted results, enabling leaders to prioritize and tailor improvement efforts to increase the impact of an intervention.
Keywords: semi-structured interview, survey, one child policy, the safety attitudes questionnaire, safety climate
Introduction
Safety culture can be defined as the organizational culture that directly or indirectly influences patient safety.1–5 Studies have found a link between safety culture and staff safety behaviors and patient outcomes.6–9 For example, several studies have found a link between improved safety culture and reduced readmission rates, length of stay, medication errors,6 and occurrence of adverse events.9 Improving safety culture is, thus, important for patient safety especially because ~10% of the 421 million hospitalizations globally are associated with some degree of adverse event, making unsafe care “the 14th leading cause of morbidity and mortality, comparable to the burden from tuberculosis or malaria”.10 In China, the Chinese Hospital Association estimated that adverse events affect ~1.6 to 7.6 million hospitalizations annually in Chinese hospitals.11 The quality of care has gradually become a concern, especially because hospitalization in China has significantly increased due to factors such as China’s public health reforms12 and the move to universal health insurance coverage.13 A study highlights the importance of improving safety culture in Chinese health care especially regarding staffing, nonpunitive response to error, and openness in communication.9 This study concludes that the improvement of safety culture can reduce adverse events by, for example, instilling a nonpunitive and just culture in the organization. Another study found that fear of shame and blame may be important barriers to improving the quality and safety of care in Chinese public hospitals.14
The assessment of safety culture has been described as a critical part of the journey to improve quality and safety in health care.8,15–17 Safety culture assessment can provide valuable information to organizational leaders regarding strengths and weaknesses in different areas. The findings can be used as a basis to tailor, adopt, and develop interventions that are likely to make an impact in the respective areas. Importantly, safety culture assessment is crucial because different cultural underlying issues of health care workers in different countries, organizations, and units18,19 are strong determinants of successful implementation of an intervention. As an example, a study found that health care workers of public hospitals in China were mostly concerned with blame and shame if and when they make an error during care delivery, which was the opposite to the findings in the USA where fear of shame was the least problematic concern of health care workers.14 As a result, Chinese public hospitals and US hospitals need different interventions to improve their safety culture.
Safety culture in health care is typically assessed using a questionnaire.7,8,20 This is also the case in China.14,21,22 Questionnaires are relatively fast, economical, and easy to use when assessing a large population. Quantitative results from questionnaires can be compared over time and between different organizations or parts of organizations.7 However, quantitative results cannot always explain why the safety culture survey scores are the way they are, and limit the possibility to explore the underlying factors that form the safety culture in the area being assessed.3,8,23,24 If quantitative results are to be used as a basis for creating improvement efforts, there is a risk that efforts may not target the most important issues.25 Contrary to quantitative assessment, qualitative assessment such as thorough interviews can be relatively demanding on time and resources if conducted on a large scale or in large organizations.24,26 Although it can be difficult to compare safety culture between departments using qualitative data, qualitative assessment allows deeper and more nuanced exploration on the topic being studied. As a result, qualitative data can provide rich and descriptive information, which can be valuable if used as a basis for improvement.27 Therefore, to capture better safety culture, an assessment that combines both quantitative and qualitative methods, termed “mixed methods”, is considered indispensable if results are to be used for improvement.3,23,26,27 Despite this, there is still little research using mixed methods to assess safety culture in health care, both in general and specifically in China.22,24
To our knowledge, our study is the first of its kind assessing safety culture in a Chinese public maternity and infant hospital using a mixed methods approach. The quality and safety of Chinese maternity hospitals is of interest because 1) the “one child policy” has been relaxed since 201328 and has been replaced with the “two child policy”29 put into effect in 2016, 2) the number of elective cesarean deliveries in China has increased dramatically,30 and 3) subsidies for delivering in hospitals and women’s preference to deliver in hospitals have increased considerably.31 The results of the safety culture mixed methods assessment can pave the way for hospital leaders to prioritize and tailor improvement efforts. The study was part of a bigger study looking at the application of the mixed methods approach to assess safety culture in health care in different organizations and countries.32
Methods
A sequential mixed methods approach was used, meaning that a survey was conducted prior to interviewing.26,27 The study was conducted at the Shanghai First Maternity and Infant Hospital, a public hospital in China. The hospital has 850 beds in three campuses (i.e., East, West, and South campuses). The average of the total annual occupancy of the hospital in the past 3 years is 119,000 outpatients and 45,000 inpatients. In the past 3 years, the hospital on average performed annually 22,500 surgical operations and over 14,000 deliveries. The hospital offers various clinical services organized into 18 departments. Three departments were nonclinical: Medical Records, Logistics, Medical Equipment, IT, and Administration. Because midwifery as an occupation has been diminished and replaced by obstetrics nurses and physicians in Chinese health care since 1993,33,34 the term “nurses” instead of the term “midwives” was used in this study.
Ethical consideration
The study was approved by the hospital’s Institutional Review Board and complied with required ethical and legal standards relating to participant anonymity and confidentiality. Participation in the survey and interviews was voluntary. All interviewees gave informed consent orally and were informed that they could refuse or withdraw from the study at any time without giving a reason. The interviewer (i.e., XYY) was external to, and had never worked at, the hospital, to ensure anonymity and confidentiality. All notes and data from interviews were anonymized, removing all identifiable identification prior to analysis and sharing within the research team.
Stage 1: survey
The questionnaire
The safety attitudes questionnaire (SAQ) “short form”17 that has been translated and validated for mainland China35 was used (Supplementary materials, Appendix 1). The original SAQ has been validated in health care, is publicly available, and, in addition to Chinese, has been translated and validated into many different languages.36–39 The SAQ consists of 36 items assessing six safety culture dimensions (i.e., Teamwork Climate, Safety Climate, Job Satisfaction, Stress Recognition, Perceptions of Unit and Hospital Management, and Working Conditions17). Five of SAQ items were independent items (i.e., items that were not part of any dimensions). Items 2, 11, and 36 were negatively worded (Appendix 1).
The SAQ responses were scored on a 5-point Likert scale: 1 for “disagree strongly”, 2 for “disagree slightly”, 3 for “neutral”, 4 for “agree slightly”, and 5 for “agree strongly”; including a “not applicable” option for each item. An additional seven demographic questions (i.e., department, gender, direct patient contact or not, period of work in the hospital, period of work in the department, number of hours worked by staff per week, and type of work contract) were added to the questionnaire. In general, it took participants 10–15 minutes to complete the survey.
Participants
All hospital staff (n=1,482) were invited to the survey to assess quantitatively the safety culture of the whole hospital.
Data collection
A paper-based SAQ for mainland China was distributed to hospital staff during departmental and units’ meetings in August and September 2014. At these meetings, participants were informed about the purpose of the survey and were encouraged to ask questions if they did not understand the questionnaire. Paper-based questionnaires with a return envelope were also made available at each hospital unit for the staff members who could not attend the meetings. The hospital’s Institutional Review Board was aware that each participant was to receive a pen to promote the survey. The survey was anonymous, and all survey responses were transferred into a password-protected Excel spreadsheet for analysis.
Data analysis
Negatively worded items were reverse scored so that higher survey scores were always interpreted as more positive than lower scores. The survey responses were analyzed using the Statistical Package for Social Sciences (IBM SPSS Statistics version 23 SPSS Inc, Chicago, IL, USA) and also by computing scores for each safety culture dimension and independent item. This was conducted by calculating the mean score for the individual items within each dimension and each independent item. Pearson correlation coefficients were computed between all dimensions and independent items. Multivariate stepwise regression analysis was used to identify the demographic variables that were significantly associated with safety culture dimensions and independent items. One-way analysis of variances and posthoc tests were used to compare mean scores between departments for each dimension and independent item. A significance level of p<0.05 was set for all analyses. Bonferroni correction was used for pairwise comparisons between departments within each dimension and independent item. The comparisons between departments were based on the rationale that safety culture is created locally,3,40 such that units or departments within a hospital can potentially have different safety cultures.1,41 An assessment conducted at the unit or departmental level was suggested to provide a more precise picture of safety culture than on an organizational level.36,41
Stage 2: semistructured interviews
Study design
Semistructured interviews were used to probe the topic deeper, make interviews more conversational, and make sure all interview participants were asked the same questions. An interview guide originally developed in the transportation field42 was modified and previously used in four hospitals in the UK and one hospital in Scandinavia.32 The interview guide was translated from English to Chinese. This guide was piloted to three staff at the hospital using a random sampling for feedback regarding whether the interview questions were understandable. The feedback was that most questions were difficult to understand, too specific, and staff did not feel that they had sufficient knowledge to answer the questions. In addition, the staff often hesitated to share their thoughts during the pilot interviews because they said that they were concerned that their responses would not necessarily please leaders or other staff. None of the staff consented for their interviews to be tape-recorded.
On the basis of the pilot, the interview questions were revised (Appendix 2). In addition, we decided not to tape-record the interviews to increase participation rates and quality of interview responses. Interview responses were noted contemporaneously and the interview notes were confirmed with interviewees at the end of the interviews. The interviews were conducted in an informal manner to allow probing and exploring interviewees’ responses in greater detail.
Participants
Interviews were taking the staff’s clinical time; therefore, to minimize efforts for hospital staff to participate in the interviews, convenience sampling was used to recruit staff who were available and willing to be interviewed during the interviewing period. A total of 48 hospital staff participated in the interviews.
Data collection
The interviews lasted between 30 and 60 minutes each and were conducted on-site in December 2014 and January 2015. Consent was given by all interviewees. Data saturation was achieved, meaning that no new information was gathered from new interviews.43 All interview responses were noted and collated together in an Excel spreadsheet for qualitative analysis.
Data analysis
All interview notes were translated from Chinese to English. Researchers conducted content analysis to the interview notes to extract significant words or phrases from each interview.44 The meaning for each extracted word or phrase was defined and those expressing similar meanings were compared and either collated, rephrased, or divided into multiple themes. Common viewpoints from the notes and individual or alternate viewpoints by department were identified. Next, patterns that supported or did not support survey findings were identified. During these iterative processes through team meetings, team consensus was used to resolve any disagreements. Finally, the themes were defined and classified against the best fit for each SAQ dimension as the reference framework, for example, safety climate and teamwork climate.
Results
Survey results
Of the 1,482 questionnaires sent, 1,427 were returned (96.29%). The demographic characteristics of the survey participants are listed in Table 1. Mean scores for all SAQ dimensions and independent items were higher than 3 (i.e., the neutral point) of 5 possible points (Appendix 3). This implies that, in general, participants “agreed slightly” with the survey items. Overall, Cronbach’s alpha calculated for the questionnaire was 0.834, indicating a high level of internal consistency. Significant positive correlation was found between all dimensions and independent items, except for the stress recognition dimension (Appendix 4).
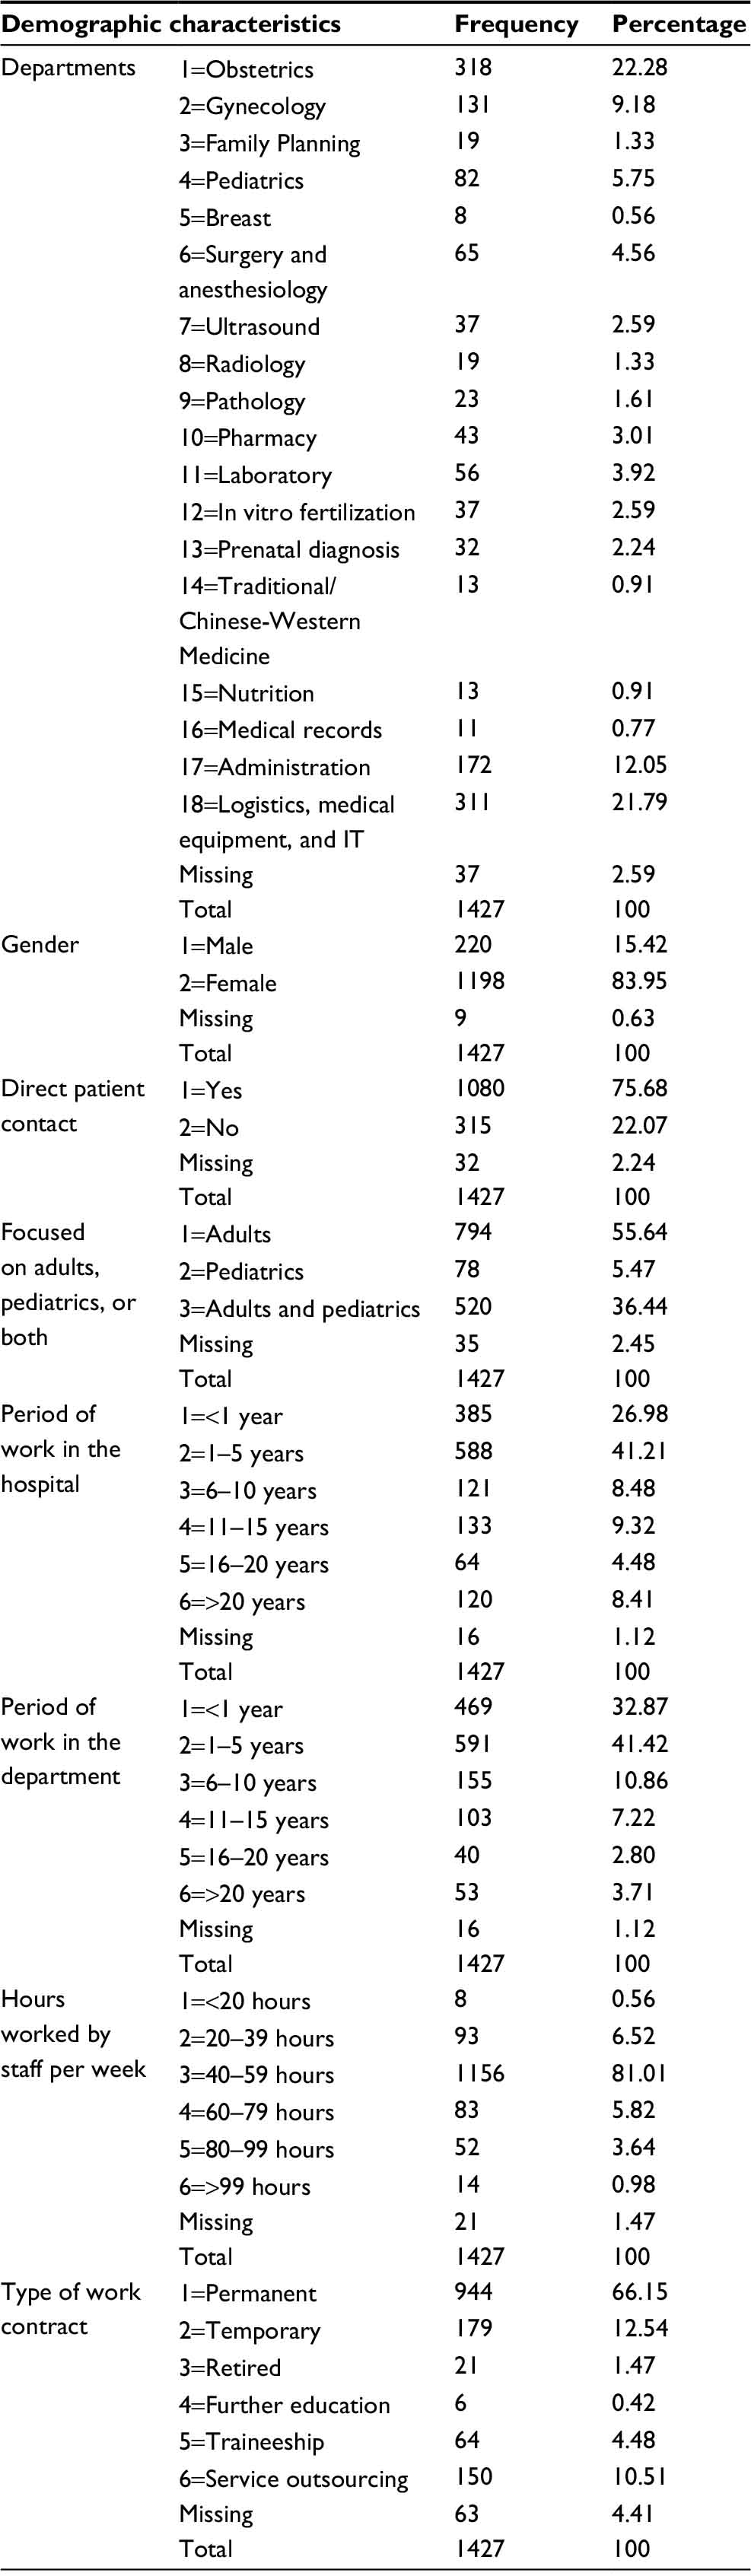 | Table 1 Demographic characteristics of survey participants |
Results of a multiple stepwise regression analysis show that all demographic characteristics, except for the period of work in the department, were significantly associated with at least one safety culture dimension or independent item (Table 2). The strongest association was found between the demographic characteristic hours worked by staff per week and the dimension working conditions (F (1,1089)=44.897, p<0.001) with an R2 of 0.040 and a standardized β coefficient of −0.184 (a negative association). Hours worked by staff per week were also significantly associated negatively with most of the dimensions and independent items including teamwork climate (F (1,1084)=8.805, p<0.01) with an R2 of 0.007, safety climate (F (1,1084)=14.433, p<0.000) with an R2 of 0.012, perceptions of hospital management (F (1,1094)=29.820, p<0.000) with an R2 of 0.026, safety suggestions acted upon by management (F (1,1068)=10.573, p<0.01) with an R2 of 0.009, and communication breakdowns being uncommon (F (1,1054)=14.943, p<0.000) with an R2 of 0.013.
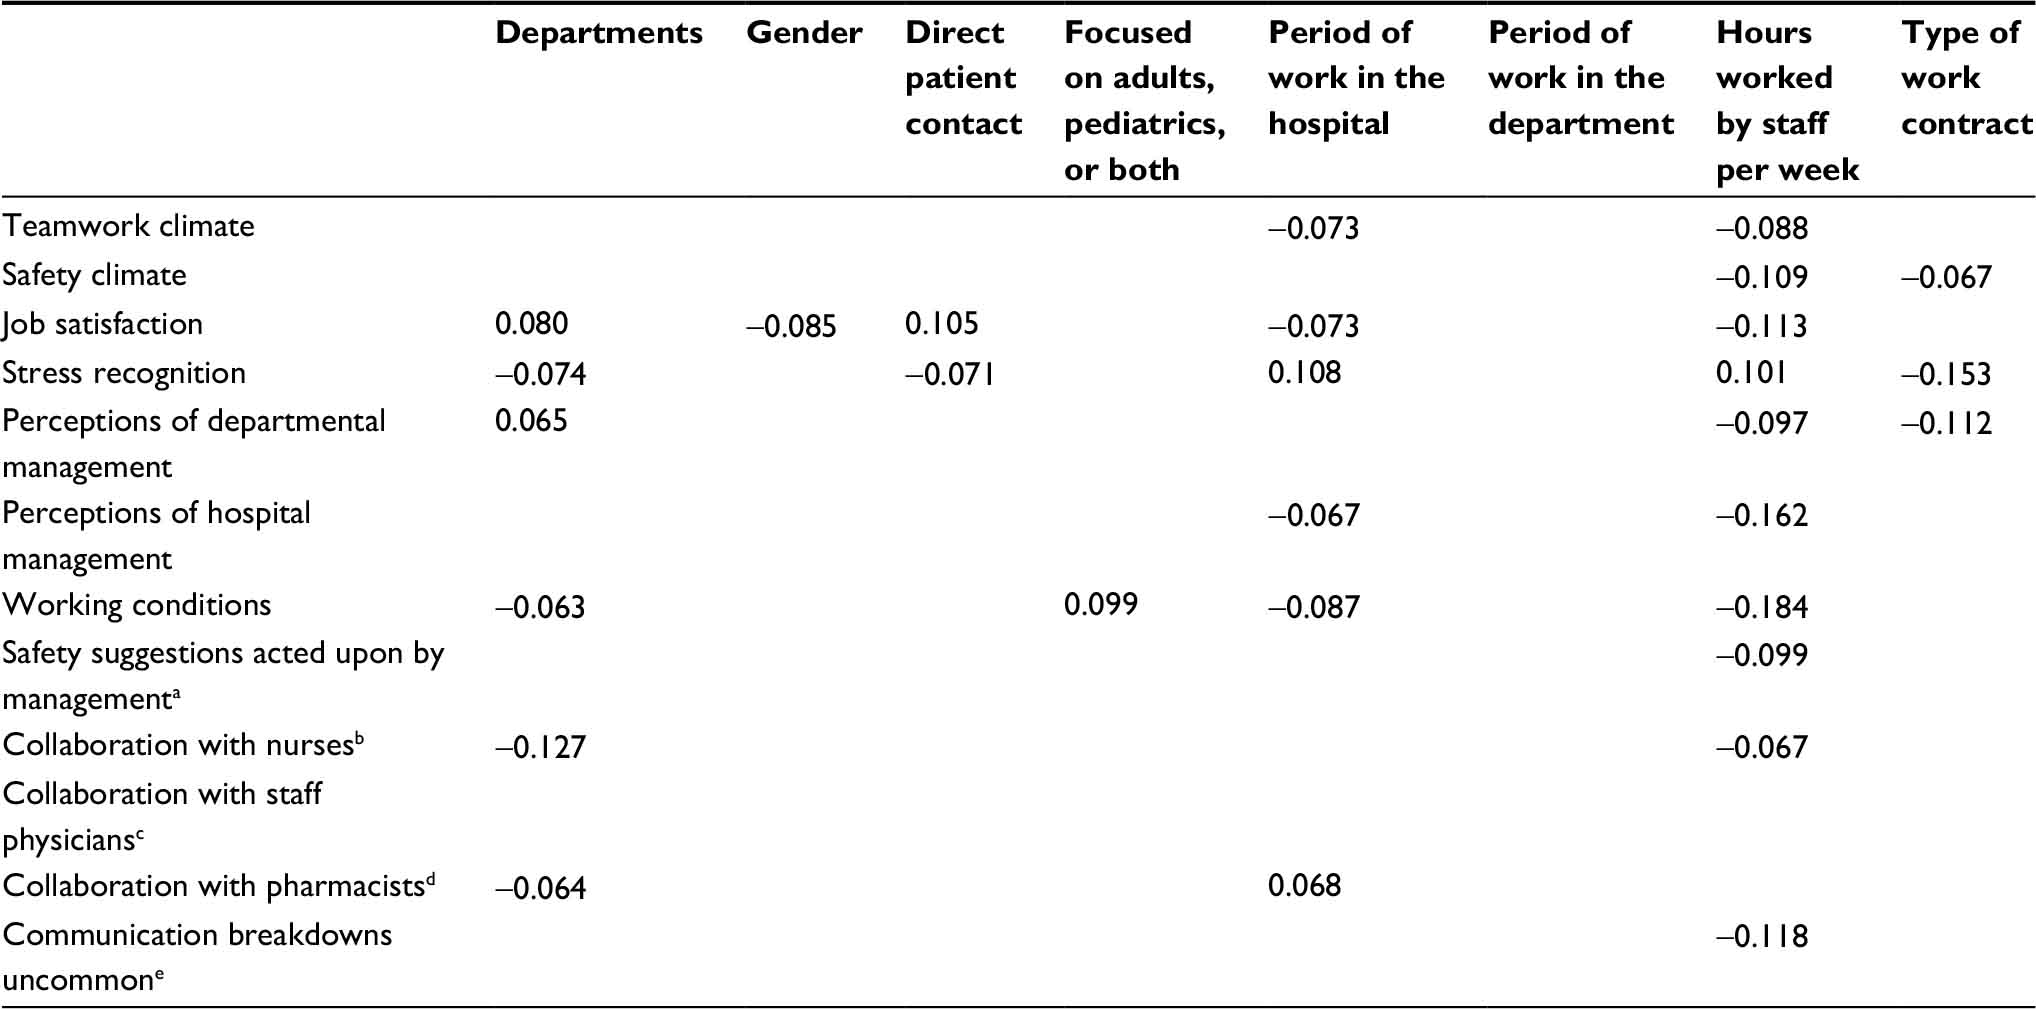 | Table 2 Demographic characteristics associated with the SAQ scores by dimension and independent item using multivariate stepwise regression analysis (standardized β coefficients with statistical significance at p<0.05) Notes: See Table 1 for categories and order of each demographic characteristic. aShortened from “My suggestions about safety would be acted upon if I expressed them to management.” bShortened from “I experience good collaboration with nurses in this clinical area.” cShortened from “I experience good collaboration with staff physicians in this clinical area.” dShortened from “I experience good collaboration with pharmacists in this clinical area.” eShortened and reverse coded from “Communication breakdowns that lead to delays in delivery of care are common.” Abbreviation: SAQ, safety attitudes questionnaire. |
Significant differences between departments were found for all dimensions and independent items at p>0.001 (Appendix 5). Posthoc tests were conducted to identify within-group differences by dimension and independent item, using Bonferroni correction at p<0.00028 (Appendix 6). In general, the departments of Ultrasound and Logistics, Medical Equipment, and IT had significantly lower mean scores than the other departments in all safety culture dimensions, except for the independent item “I experience good collaboration with staff physicians in this clinical area.” On the contrary, the mean scores by dimension and independent item for the departments Surgery and Anesthesiology, Administration, Obstetrics, and Pharmacy were in general significantly higher than were the other departments.
Interview results
A total of 48 interviews were conducted during the course of 2 months. Four main themes (i.e., working conditions, teamwork climate, safety climate, and perceptions of hospital management) extracted from the 48 interviews were analyzed (Appendix 7). Issues related to working conditions and teamwork climate were the most common themes across departments.
Working conditions were related to issues about high workload, staff compensation systems, inconsistent and perceived poor quality of training, barriers to career and professional development, and the perceived poor quality of equipment and security systems (e.g., continued use of outdated, defective equipment, and the lack of access control in some areas leading to increased risk of tailgating). The factors that could be classed under high workload included 1) increased patient admission and patient turnover rates without an increase in the number of staff, 2) the perception that staff-to-patient ratios did not consider staff absence and workload, 3) the perception of lack of staff, and 4) the perceived difficulty of finding qualified staff within and outside the hospital. As an example, the Obstetrics department with 200 beds at 100% occupancy rate had five medical doctors assigned. If there were emergency operations at the Surgery and Anesthesiology department, two of the Obstetrics medical doctors would have to support the operations, leaving the entire workload to the three remaining Obstetrics medical doctors. Ultrasound doctors reported that there were between 5 and 7 doctors assigned to care for ~600 patients a day. The high workload was also said to be the result of the compensation system for clinical staff, which was based on the number of patients they cared for or treatment they provided. Interviewees desired a change in the compensation system such that clinical staff should be compensated on the basis of not only quantity but also, more importantly, quality of care. Some medical doctors from the Pediatrics and Surgery and Anesthesiology departments reported that medical doctors did not receive training to conduct research. This training was perceived as significant for medical doctors who wished to develop professionally. Inconsistent training on how to use new equipment, especially for new staff, was also mentioned by Pediatrics staff as a bottleneck to care delivery.
Teamwork climate issues were mainly related to mismatched perceptions toward assigned and expected responsibilities between departments, tasks, and functions. For example, Administration and Logistics, Medical Equipment and IT staff perceived that there were many overlapping functions between nonclinical departments and units that led to confusion regarding who was responsible for which tasks. Surgery and Anesthesiology staff perceived that collaboration with medical records staff was poor due to differences in priorities and expectations. Pharmacy staff perceived that the handling of medication was assigned exclusively as their responsibility, whereas they believed themselves that the responsibility should be shared with clinical staff. Pharmacy staff also perceived that medical doctors often prescribed unfamiliar medications to pharmacists, causing delay of care because pharmacists had to find more information and sometimes the pharmacy did not have the prescribed medications in stock. There were mismatched expectations between clinical and laboratory staff on who was responsible for collecting and sending samples to and from the laboratory; clinical staff perceived that laboratory staff should be collecting and sending samples to and from the laboratory, whereas laboratory staff perceived that this was the responsibility of clinical staff. Administration staff perceived that patient safety and care were solely the responsibility of clinical staff; thus, they did not feel that they should prioritize activities to support patient care. Tension influenced teamwork between Ultrasound and Obstetrics staff because of the lack of agreed criteria to decide whether an ultrasound test was needed at all and whether a patient needed an urgent or a scheduled ultrasound test. Staff at both departments mentioned that this had resulted in an excessive number of potentially unnecessary ultrasound tests, and they expressed a desire for hospital management to develop criteria for deciding when to perform ultrasound tests and standardizing care.
Discussion and conclusion
The study findings show that competing priorities between hospital departments and high workload are the most common issues affecting safety culture in the Chinese public maternity hospital.
Variation in safety culture between departments
The survey response rate in this study was much higher than response rates reported in similar studies assessing safety culture using a survey by Sexton et al (i.e., 67%),17 Lee et al (i.e., 69.4%) in Taiwan,45 and Nie et al (i.e., 77%) in China.46 This may be due to the fact that the questionnaires were distributed in departmental and unit meetings, an observation supported by Deilkås and Hofoss,36 who found in their study that the response rate for the SAQ questionnaires distributed in meetings was much higher (i.e., 96%) than those distributed through mailing systems (i.e., 50%).
Importantly, the survey findings show significant differences between the hospital departments in almost all safety culture dimensions and independent items (Appendix 5 and Appendix 6), as also found in other similar studies.1,18,19,41 The findings confirm that culture is created locally,3,40 and thus, efforts to improve safety culture are most likely to have impact if implemented on a departmental, rather than organizational, level.36,41,47 Similarly, the interview findings revealed that there were different, competing priorities between departments (Appendix 7). More worryingly, the different priorities between departments were perceived to result in bottlenecks to care delivery, which lowered the quality of care.
The interview findings corroborated the survey finding that the lowest mean score in the survey (i.e., 3.25 with an SD of 1.00) was for the independent item “Communication breakdowns that lead to delays in delivery of care are uncommon.” These findings indicate that although the hospital departments need to respond to specific challenges and thus require department-specific interventions, the interventions need to be anchored to an organizational-level objective to increase their impact. In this case, the interventions need to target improving collaboration between relevant departments to deal with competing priorities between them. This can be achieved by, for example, defining and standardizing care processes, covering antenatal to neonatal care,48–51 the implementation of which is tailored to different departments. For example, Ultrasound and Obstetrics staff are likely to benefit from standardized processes to perform ultrasound tests that include agreed criteria between the two departments. The agreed criteria implemented in the Obstetrics department can include an additional criterion specific for the department, such as the possibility to consult with an Ultrasound doctor should there be any doubt with a test result prior to sending the patient to an ultrasound examination.
As importantly, because efforts focused on improving the quality of collaboration between departments are likely to improve safety climate by proxy (Appendix 4), departmental leaders need to tackle specific issues in their individual departments by not only engaging their staff but also collaborating with other departmental leaders and staff to surmount barriers and improve understanding of different priorities between departments.52 This can be achieved by, for example, implementing cross-department improvement programs such as multidisciplinary safety walkrounds led by staff53,54 that focus on improving understanding and communication between disciplines.
Hours worked by staff per week and workload
The survey findings identified the association with more hours worked by staff per week with significantly more negative safety culture perceptions (Table 2). Of 91.45% of survey respondents reported that they worked 40 hours or longer per week (Table 1). The number is much higher than the numbers reported in several studies investigating burnout on Chinese clinicians. For example, only 15.56% of 527 nurses working in Shanghai,55 61.9% of 1618 registered Chinese doctors,56 and 46.8% of 1337 Chinese nurses reported working longer than 40 hours per week.57 It is possible that staff in this study who worked 40 hours per week and staff who worked longer than 40 hours per week both ticked the same category of working for 40 hours or longer per week. Nevertheless, it is also relatively common for hospital staff to work extended hours than scheduled.58–60 An alternate explanation is that the other studies were not focused on staff working in Chinese maternity hospitals. In addition, 10.44% staff in this study reported working for more than 59 hours per week. These reported hours worked by staff per week are a matter of concern because a national study in the US previously found that nurses who worked more than 40 hours per week significantly increased the risks of making an error.61
The strongest association from the survey findings was between hours worked by staff per week and staff perceptions of working conditions (e.g., staffing, training, and equipment).17 The association was negative, meaning that staff who worked more hours per week would perceive working conditions more negatively. Issues related to working conditions were also the most common concerns discussed in the interviews, especially on high workload. A study conducted in Shanghai found that workload was the most frequently identified workplace stressor among Chinese nurses, on a par with dealing with death and dying.62 Therefore, hospitals, as part of their management strategy, may need to consider implementing serious measures to support staff dealing with high workload and the effect of the two-child policy change29 by, for example, recalculating the staff to patient ratio, reconsidering the compensation system for clinical staff, recruiting new staff, and distributing workload across departments. Standardization of care processes48–51 may also reduce unnecessary workload likely to be caused by competing priorities between hospital departments. The hospital staff may also benefit from techniques and tools to maximize hospital flows applied on a micro and macro levels to match demands to capacity63 as well as implementation of demand and capacity management throughout the organization.64
Mixed methods for assessing safety culture
The study findings show the importance of using mixed methods for assessing safety culture, especially if results are to be used for improvement. For example, almost all interview responses pinpointed challenges related to care delivery. Only one strong area was mentioned in the interviews, which was specific to the standardized process of handling medication for outpatient services, as expressed by Pharmacy staff. This interview finding is contrary to the survey finding which showed all mean scores of the safety culture dimensions and independent items to be positive, specifically above the neutral point of 3.00 (Appendix 3). If the survey finding had been the only source of data used as a basis for improvement, it might misinform the management by giving the impression that safety culture was perceived as relatively positive. In addition, the fact that interview responses identified mostly challenges rather than positive practices related to care delivery is probably the result of the strong focus in health care culture to achieve perfection.65 Perfectionism in health care may be even more widespread in Chinese public hospitals where blame and shame culture is still very dominant14 as well as an increase in patient violence against clinical staff.66,67 Chinese health care may need to prioritize efforts to shift the focus from blaming individuals to promoting learning culture as a fundamental first step to improving health care quality and safety.65,68–70
Another advantage of the mixed methods approach is that findings can provide more information regarding safety culture by compensating for weaknesses of quantitative and qualitative methods, thus improving assessment results.3,23,24 For example, the survey findings identified a strong and significant association between hours worked by staff per week and working conditions. The interview findings reveal high workload as an issue perceived as being important across several departments. Improvement efforts, thus, can be targeted more specifically to reduce high workload. Without interviews, such information would not have been accessible and improvement efforts might target other less relevant issues, thus reducing the impact of the efforts.
Limitations
The study is not without limitations. First, it was conducted at a single public maternity hospital in Shanghai, China, and thus may limit the generalizability of the findings to other health care settings and geographical areas. Second, both the survey and interview responses relied on the participants’ personal opinions and perceptions of safety culture in their respective departments. The findings in the study thus summarized expressed attitudes and perceptions underlying local safety culture, rather than direct observations of clinical practice. Third, interview responses were transcribed manually instead of being tape-recorded, which might pose some bias to interview notes used for further analysis, although the interviewer confirmed her notes with each interviewee for clarification in an effort to reduce the interviewer’s bias. Fourth, demographic characteristics other than the interview participants’ department were not included in the analysis to preserve anonymity and confidentiality of the individual interview participants. Finally, the safety culture in the study was described as it existed during data collection periods (i.e., August, September, and December 2014, and January 2015) and thus findings may not be extrapolated to other, later times especially if significant changes have taken place.
Acknowledgment
Authors would like to thank Dr. Sharmini Alagaratnam for critically reviewing the manuscript.
Disclosure
The authors report no conflicts of interest in this work.
References
Listyowardojo TA, Nap RE, Johnson A. Variations in hospital worker perceptions of safety culture. Int J Qual Health Care. 2012;24(1):9–15. | ||
Guldenmund FW. The nature of safety culture: a review of theory and research. Safety Science. 2000;34(1–3):215–257. | ||
Antonsen S. Safety culture: theory, method and improvement. Farnham: Ashgate; 2009. | ||
Westrum R. A typology of organisational cultures. Qual Saf Health Care. 2004;13(Suppl 2):ii22–ii27. | ||
Parker D, Lawrie M, Hudson P. A framework for understanding the development of organisational safety culture. Safety Science. 2006;44(6):551–562. | ||
Does improving safety culture affect patient outcomes?; 2011. Available from: http://www.health.org.uk/publications/does-improving-safety-culture-affect-patient-outcomes/. Accessed December 23, 2015. | ||
Halligan M, Zecevic A. Safety culture in healthcare: a review of concepts, dimensions, measures and progress. BMJ Qual Saf. 2011;20(4):338–343. | ||
Measuring safety culture. 2011. Available from: http://www.health.org.uk/sites/default/files/MeasuringSafetyCulture.pdf. Accessed December 23, 2015. | ||
Wang X, Liu K, You LM, et al. The relationship between patient safety culture and adverse events: a questionnaire survey. Int J Nurs Stud. 2014;51(8):1114–1122. | ||
Jha AK, Larizgoitia I, Audera-Lopez C, Prasopa-Plaizier N, Waters H, Bates DW. The global burden of unsafe medical care: analytic modelling of observational studies. BMJ Qual Saf. 2013;22(10):809–815. | ||
Cao RG. Medical quality and patient safety in China. Chinese Hospitals. 2007;11(11):1–4. | ||
Blumenthal D, Hsiao W. Lessons from the East–China’s rapidly evolving health care system. N Engl J Med. 2015;372(14):1281–1285. | ||
Yu H. Universal health insurance coverage for 1.3 billion people: what accounts for China’s success? Health Policy. 2015;119(9):1145–1152. | ||
Zhou P, Bundorf MK, Gu J, He X, Xue D. Survey on patient safety climate in public hospitals in China. BMC Health Serv Res. 2015;15(1):53. | ||
Quality AfHRa. Hospital Survey on Patient Safety Culture; 2014. Available from: http://www.ahrq.gov/professionals/quality-patient-safety/patientsafetyculture/hospital/index.html, 2014. | ||
Nieva VF, Sorra J. Safety culture assessment: a tool for improving patient safety in healthcare organizations. Qual Saf Health Care. 2003;12(Suppl 2):ii17–ii23. | ||
Sexton JB, Helmreich RL, Neilands TB, et al. The Safety Attitudes Questionnaire: psychometric properties, benchmarking data, and emerging research. BMC Health Ser Res. 2006;6(1):44. | ||
Singer SJ, Gaba DM, Geppert JJ, Sinaiko AD, Howard SK, Park KC. The culture of safety: results of an organization-wide survey in 15 California hospitals. Qual Saf Health Care. 2003;12(2):112–118. | ||
Singer SJ, Gaba DM, Falwell A, Lin S, Hayes J, Baker L. Patient safety climate in 92 US hospitals: differences by work area and discipline. Med Care. 2009;47(1):23–31. | ||
Patel S, Wu AW. Safety Culture in Indian Hospitals: a cultural adaptation of the safety attitudes questionnaire. J Patient Saf. 2016;12(2):75–81. | ||
Liu Y, Kalisch BJ, Zhang L, Xu J. Perception of safety culture by nurses in hospitals in China. J Nurs Care Qual. 2009;24(1):63–68. | ||
Xuanyue M, Yanli N, Hao C, Pengli J, Mingming Z. Literature review regarding patient safety culture. J Evid Based Med. 2013;6(1):43–49. | ||
Guldenmund FW. The use of questionnaires in safety culture research–an evaluation. Safety Science. 2007;45(6):723–743. | ||
Pumar-Méndez MJ, Attree M, Wakefield A. Methodological aspects in the assessment of safety culture in the hospital setting: a review of the literature. Nurse Educ Today. 2014;34(2):162–170. | ||
Allen S, Chiarella M, Homer CS. Lessons learned from measuring safety culture: An Australian case study. Midwifery. 2010;26(5):497–503. | ||
Venkatesh V, Brown SA, Bala H. Bridging the qualitative-quantitative divide: Guidelines for conducting mixed methods research in information systems. Mis Quarterly. 2013;37(1):21–54. | ||
Creswell JW, Klassen AC, Plano Clark VL, Smith KC. Best practices for mixed methods research in the health sciences. Bethesda, MD: National Institutes of Health; 2011:10. | ||
Chan K. Newborn Screening and the Relaxation of One Child Policy in Mainland China. Paper presented at: 143rd APHA Annual Meeting and Exposition; October 31–November 4; 2015; China. | ||
China unveils proposal for formulating nation’s five-year plan; 2015. Available from: http://english.gov.cn/news/top_news/2015/11/03/content_28,14,75,22,69,95,108.htm. Accessed December 23, 2015. | ||
Hellerstein S, Feldman S, Duan T. China’s 50% caesarean delivery rate: is it too high? BJOG. 2015;122(2):160–164. | ||
Raven J, van den Broek N, Tao F, Kun H, Tolhurst R. The quality of childbirth care in China: women’s voices: a qualitative study. BMC Pregnancy Childbirth. 2015;15(1):113. | ||
Tita Listyowardojo SL, Eva Turk, Bobbie Ray-Sannerud, Vibeke Vallevik, Melinda Lyons, Morten Pytte. Mixed methods: Improving assessment of safety culture in healthcare. 2014; 2016. Available from: https://issuu.com/dnvgl/docs/dnvgl_pospaper_safety_culture. Accessed June 13, 2017. | ||
Cheung NF, Mander R, Cheng L. The’doula-midwives’ in Shanghai. EBM. 2005;3(2):73–80. | ||
Cheung NF. Chinese midwifery: the history and modernity. Midwifery. 2009;25(3):228–241. | ||
Guo XZW. Revision of the safety attitudes questionnaire and evaluation. Chinese J Nursing Education. 2010;7(4):151–154. | ||
Deilkås ET, Hofoss D. Psychometric properties of the Norwegian version of the Safety Attitudes Questionnaire (SAQ), generic version (short form 2006). BMC Health Serv Res. 2008;8(1):191. | ||
Kaya S, Barsbay S, Karabulut E. The Turkish version of the safety attitudes questionnaire: psychometric properties and baseline data. Qual Saf Health Care. 201019(6):572–577. | ||
Zimmermann N, Küng K, Sereika SM, Engberg S, Sexton B, Schwendimann R. Assessing the safety attitudes questionnaire (SAQ), German language version in Swiss university hospitals-a validation study. BMC Health Serv Res. 2013;13(1):347. | ||
Gutiérrez-Cía I, de Cos PM, Juan AY, et al. Percepción de la cultura de seguridad en los servicios de medicina intensiva españoles. [Perception of Safety Culture in Spanish Intensive Care Units]. Med Clín (Barc). 2010;135(Suppl 1):37–44. Spanish. | ||
Berger PL, Luckmann T. The social construction of reality. A treatise in the sociology of knowledge. UK: Penguin; 1991:298–300. | ||
Huang DT, Clermont G, Sexton JB, et al. Perceptions of safety culture vary across the intensive care units of a single institution. Crit Care Med. 2007;35(1):165–176. | ||
Hauland G, Serck-Hanssen C, Rolfsen J. Exploring methodology for change processes: an aviation case of combined behaviour-and culture change to improve safety. In: Aven T, Vinnem JE, editors, Risk Reliability and Societal Safety. Vol 2. Taylor & Francis; 2007:1665–1662. | ||
Marshall MN. Sampling for qualitative research. Fam Pract. 1996; 13(6):522–526. | ||
Yin RK. Case study research: Design and methods. Vol 5. London, UK: Sage; 2009. | ||
Lee WC, Wung HY, Liao HH, et al. Hospital safety culture in Taiwan: a nationwide survey using Chinese version safety attitude questionnaire. BMC Health Serv Res. 2010;10(1):234. | ||
Nie Y, Mao X, Cui H, He S, Li J, Zhang M. Hospital survey on patient safety culture in China. BMC Health Ser Res. 2013;13(1):228. | ||
Morello RT, Lowthian JA, Barker AL, McGinnes R, Dunt D, Brand C. Strategies for improving patient safety culture in hospitals: a systematic review. BMJ Qual Saf. 2013;22(1):11–18. | ||
Kurtin P, Stucky E. Standardize to excellence: improving the quality and safety of care with clinical pathways. Pediatr Clin North Am. 2009;56(4):893–904. | ||
de Luc K. Care pathways: an evaluation of their effectiveness. J Adv Nurs. 2000;32(2):485–496. | ||
Escuriet R, White J, Beeckman K, et al. Assessing the performance of maternity care in Europe: a critical exploration of tools and indicators. BMC Health Serv Res. 2015;15(1):491. | ||
Li X, Cui X, Tian M. Implementation of clinical pathway in maternity department. Chinese Nurs Management. 2007;11:021. | ||
Sujan MA, Chessum p, Rudd M, et al. Managing competing organizational priorities in clinical handover across organizational boundaries. J Health Serv Res Policy. 2015;20(1 Suppl):17–25. | ||
Shaw KN, Lavelle J, Crescenzo K, Noll J, Bonalumi N, Baren J. Creating unit-based patient safety walk-rounds in a pediatric emergency department. Clin Pediatr Emerg Med. 2006;7(4):231–237. | ||
Montgomery VL. Impact of staff-led safety walk rounds. In: Henriksen K, Battles JB, Keyes MA, et al., editors. Advances in Patient Safety: New Directions, Alternative Approaches. Rockville (MD): Agency for Healthcare Research and Quality (US); 2008. | ||
Xie Z, Wang A, Chen B. Nurse burnout and its association with occupational stress in a cross-sectional study in Shanghai. J Adv Nurs. 2011;67(7):1537–1546. | ||
Wu H, Liu L, Wang Y, Gao F, Zhao X, Wang L. Factors associated with burnout among Chinese hospital doctors: a cross-sectional study. BMC Public Health. 2013;13(1):786. | ||
Wang Y, Chang Y, Fu J, Wang L. Work-family conflict and burnout among Chinese female nurses: the mediating effect of psychological capital. BMC Public Health. 2012;12(1):915. | ||
Lockley SW, Cronin JW, Evans EE, et al. Effect of reducing interns’ weekly work hours on sleep and attentional failures. N Engl J Med. 2004;351(18):1829–1837. | ||
Lockley SW, Barger LK, Ayas NT, Rothschild JM, Czeisler CA, Landrigan CP. Effects of health care provider work hours and sleep deprivation on safety and performance. Jt Comm J Qual Patient Saf. 2007;33(Suppl 11):7–18. | ||
Scott LD, Rogers AE, Hwang WT, Zhang Y. Effects of critical care nurses’ work hours on vigilance and patients’ safety. Am J Crit Care. 2006;15(1):30–37. | ||
Rogers AE, Hwang WT, Scott LD, Aiken LH, Dinges DF. The working hours of hospital staff nurses and patient safety. Health Aff (Millwood). 2004;23(4):202–212. | ||
Lambert V, Lambert CE, Petrini M, Li XM, Zhang YJ. Predictors of physical and mental health in hospital nurses within the People’s Republic of China. Int Nurs Rev. 2007;54(1):85–91. | ||
Kosnik L. Breakthrough demand-capacity management strategies to improve hospital flow, safety, and satisfaction. Patient Flow: Reducing Delay in Healthcare Delivery: US: Springer; 2006:101–122. | ||
Jack EP, Powers TL. A review and synthesis of demand management, capacity management and performance in health-care services. Int J Management Rev. 2009;11(2):149–174. | ||
Kohn LT, Corrigan J, Donaldson MS. To Err is Human: Building a Safer Health System. Vol 6. Washington, D.C: National Academy Press; 2000. | ||
Sun S, Wang W. Violence against Chinese health-care workers. Lancet. 2011;377(9779):1747. | ||
Hesketh T, Wu D, Mao L, Ma N. Violence against doctors in China. BMJ. 2012;345:e5730. | ||
Dekker S. Just culture: Balancing safety and accountability. Hampshire: Ashgate Publishing, Ltd.; 2012. | ||
Leyshon S. Principles of risk management in community nursing. Br J Community Nurs. 2005;10(7):330–333. | ||
Carroll J, Quijada M. Redirecting traditional professional values to support safety: changing organisational culture in health care. Qual Saf Health Care. 2004;13(Suppl 2):ii16–ii21. |
 © 2017 The Author(s). This work is published and licensed by Dove Medical Press Limited. The full terms of this license are available at https://www.dovepress.com/terms.php and incorporate the Creative Commons Attribution - Non Commercial (unported, v3.0) License.
By accessing the work you hereby accept the Terms. Non-commercial uses of the work are permitted without any further permission from Dove Medical Press Limited, provided the work is properly attributed. For permission for commercial use of this work, please see paragraphs 4.2 and 5 of our Terms.
© 2017 The Author(s). This work is published and licensed by Dove Medical Press Limited. The full terms of this license are available at https://www.dovepress.com/terms.php and incorporate the Creative Commons Attribution - Non Commercial (unported, v3.0) License.
By accessing the work you hereby accept the Terms. Non-commercial uses of the work are permitted without any further permission from Dove Medical Press Limited, provided the work is properly attributed. For permission for commercial use of this work, please see paragraphs 4.2 and 5 of our Terms.