")
Back to Journals » Nanotechnology, Science and Applications » Volume 9
A role of ZnO nanoparticle electrostatic properties in cancer cell cytotoxicity
Authors Wingett D, Louka P, Anders C, Zhang J, Punnoose A
Received 3 November 2015
Accepted for publication 7 January 2016
Published 15 July 2016 Volume 2016:9 Pages 29—45
DOI https://doi.org/10.2147/NSA.S99747
Checked for plagiarism Yes
Review by Single anonymous peer review
Peer reviewer comments 3
Editor who approved publication: Professor Israel (Rudi) Rubinstein
Denise Wingett,1–3 Panagiota Louka,1 Catherine B Anders,2 Jianhui Zhang,4 Alex Punnoose2,4
1Department of Biological Sciences, 2Biomolecular Sciences PhD Program, Boise State University, Boise, ID, 3Department of Medicine, Division of Gerontology and Geriatric Medicine, University of Washington, Seattle, WA, 4Department of Physics, Boise State University, Boise, ID, USA
Abstract: ZnO nanoparticles (NPs) have previously been shown to exhibit selective cytotoxicity against certain types of cancerous cells suggesting their potential use in biomedical applications. In this study, we investigate the effect of surface modification of ZnO NPs on their cytotoxicity to both cancerous and primary T cells. Our results show that polyacrylic acid capping produces negatively charged ZnO NPs that are significantly more toxic compared to uncapped positively charged NPs of identical size and composition. In contrast, the greatest selectivity against cancerous cells relative to normal cells is observed with cationic NPs. In addition, differences in NP cytotoxicity inversely correlate with NP hydrodynamic size, propensity for aggregation, and dissolution profiles. The generation of reactive oxygen species (ROS) was also observed in the toxicity mechanism with anionic NPs generating higher levels of mitochondrial superoxide without appreciably affecting glutathione levels. Additional experiments evaluated the combined effects of charged ZnO NPs and nontoxic cationic or anionic CeO2 NPs. Results show that the CeO2 NPs offer protective effects against cytotoxicity from anionic ZnO NPs via antioxidant properties. Altogether, study data indicate that surface modification of NPs and resulting changes in their surface charge affect the level of intracellular ROS production, which can be ameliorated by the CeO2 ROS scavenger, suggesting that ROS generation is a dominant mechanism of ZnO NP cytotoxicity. These findings demonstrate the importance of surface electrostatic properties for controlling NP toxicity and illustrate an approach for engineering NPs with desired properties for potential use in biological applications.
Keywords: nanotechnology, metal oxide, cancer, toxicity, reactive oxygen species
Introduction
Nanoparticles (NPs) are natural or manufactured materials that have at least one dimension <100 nm. They can be synthesized from a variety of materials and methods, and usually have a crystalline structure. The small size of nanomaterials is comparable to naturally occurring proteins and other molecules found in cells, and this can facilitate interactions with biomolecules which potentially alter cell function. The reduction to the nanoscale is sometimes accompanied by unique physical, chemical, and biological properties.1 Metal oxide NPs, which are increasingly being used in industrial applications including electronics and cosmetics, are also being considered for use in biological applications.2,3 However, the inherent cytotoxicity of ZnO NPs against certain human cells reported in vitro4,5 has raised some concerns regarding their potential health hazards, including occupational or incidental exposure.6 On the other hand, their inherent cytotoxicity can represent a desirable quality if it can be tailored to be specific against pathogenic cells. Indeed, recent studies have shown that ZnO NPs exhibit cytotoxicity against cancerous cells at concentrations producing negligible effects on normal cells of the same lineage.4,7,8 These findings suggest that if ZnO NP cancer cell selectivity can be further improved, they could potentially be used in cancer treatment.
The unique properties of NPs are believed to be dependent on their physicochemical characteristics.1 For example, ZnO NPs are cytotoxic, whereas their bulk counterparts are not,7,9 and their cytotoxicity is further improved with a decrease in NP size.9–11 One possible approach to improve the selective cancer cell killing is to modulate NP surface characteristics to better promote electrostatic interactions with cancerous cells. With regard to this goal, it is important to note that eukaryotic cell membranes are typically negatively charged12 and likely to interact with positively charged NPs, and that cancerous cells can overexpress negatively charged phospholipids on their cell membranes relative to normal cells,13–15 thus being even more likely to interact with positive NPs. Thus, it is possible that alterations in NP surface charge could affect their inherent selectivity against cancerous cells. One way to modulate NPs charge is by coating their surface with molecules such as polyacrylic acid (PAA), or dextran carboxyl (–COOH) or amine (NH2) groups.16,17 In the present study, ZnO NPs were coated with increasing amounts of PAA, which bear a negative charge at physiological pH,18 and the effects of ZnO NP charge on cancer cytotoxicity and potential mechanisms of action investigated.
The most well-studied mechanism of action of ZnO NPs to date is the generation of reactive oxygen species (ROS).19 ROS are naturally produced during cell metabolism, and their concentration is tightly controlled by cellular antioxidant systems (eg, glutathione [GSH], superoxide dismutase, catalase). These components of the cell’s antioxidant system are important for normal cell function, and physiological levels of ROS can act as second messengers and activators of cellular pathways.20 In contrast, excessive ROS can damage biomolecules resulting in the activation of apoptotic signals.21,22 A better understanding of the underlying mechanisms of NP-induced ROS will allow for rational engineering of NPs that provide the greatest therapeutic benefit with minimum undesirable effects.
Another goal of the current study is to expand our knowledge regarding the biological responses of cells following concurrent exposure to NPs of different material systems. For example, CeO2 and ZnO NPs can be found in the same environment (eg, industrial settings combining welding and fuel additives) increasing the chance of concurrent human exposure to these materials. CeO2 NPs have been reported to lack appreciable cytotoxicity,16 and have been shown to scavenge ROS.23–25 In contrast, ZnO NPs have been shown to generate ROS and display appreciable toxicity.7,21,26,27 In this study, we examine the combined cytotoxic effects of CeO2 and ZnO NPs with respect to alterations in particle surface and ROS-scavenging properties of CeO2 particles. The overarching goal of this study is to determine the extent to which ZnO NP electrostatic properties modulate selective toxicity against cancer cells and mechanisms of action.
Materials and methods
Preparation and characterization of ZnO NPs
ZnO NPs were synthesized using a modified forced-hydrolysis method.7,28,29 In brief, 2 g of Zn(Ac)2·2H2O, PAA (molecular weight [MW] =1,800 Da, 0–60 mg), and 100 mL of diethylene glycol were sequentially added into a flask with a stopper. The system was heated at 180°C in an oil bath under magnetic stirring for 30 minutes. After cooling, the resulting product was washed with ethanol and water several times via centrifugation and sonication before drying for 24 hours at 50°C, resulting in a powder sample. The powdered samples were dispersed in nanopure water to prepare 5 mM aqueous solutions for measuring zeta potential (ZP) and hydrodynamic size with a Zetasizer NanoZS (Malvern Instruments, Malvern, UK) unit. The temperature was equilibrated to 25°C prior to collecting the data. At least eight data collections per run were performed on three separate aliquots of the ZnO NP suspension for each sample. For cellular studies, the powdered NP samples were reconstituted in phosphate-buffered saline (PBS) solution to obtain the desired stock concentration. After reconstitution, NPs were sonicated for 30 minutes and immediately vortexed prior to addition to cell cultures.
X-ray diffraction
X-ray diffraction (XRD) studies were performed to determine NP purity. Spectra were recorded at room temperature on a Philips X’Pert X-ray diffractometer with a Cu Kα source (λ=1.5418 Å) in Bragg–Brentano geometry. The loose powder samples were leveled in the sample holder to ensure a smooth surface and mounted on a fixed horizontal sample plane. Data analyses were carried out using profile fits of select individual XRD peaks.
Transmission electron microscopy
High-resolution transmission electron microscopy analysis was performed to determine NP size, shape, and size distribution. Analysis was carried out on a JEM-2100HR (JEOL, Tokyo, Japan) microscope with a specified point-to-point resolution of 0.23 nm. The operating voltage of the microscope was 200 kV. Image processing was performed using the DigitalMicrograph® software from Gatan (Pleasanton, CA, USA).
X-ray photoelectron spectroscopy
X-ray photoelectron spectroscopy (XPS) studies were used to analyze the chemical composition of samples. The powder samples were dispersed onto Si wafers for collecting XPS spectra on a Versaprobe spectrometer (Physical Electronics, Chanhassen, MN, USA), which uses a raster-scanned microfocused monochromatic Al Kα X-ray (1,486.7 eV) source. The X-ray beam used was a 25 W, 100 μm diameter beam to probe a single sample point, with incident along the sample normal, and the analyzer was at 45° off-normal. The high-energy resolution spectra were collected using a pass energy of 23.5 eV capable of full width at half maximum of better than 0.75 eV for Ag 3d5/2. The binding energy scale was calibrated using the Cu 2p3/2 feature at 932.67±0.05 eV and Au 4f at 84.0±0.05 eV measured on freshly sputter-cleaned thin films. To minimize sample charging, neutralization was handled by irradiation with low-energy electrons and Ar+ ions. The binding energy scales of the high-resolution spectra shown in this study have been shifted referencing the C 1s peak at 284.8 eV.
NP sedimentation studies
To evaluate the sedimentation behavior of the NPs under conditions used for cellular toxicity assays, 25 mM NP stock solutions were prepared in PBS as previously described and then introduced at a concentration of 0.3 mM into complete cellular media and vortexed for 30 seconds. The room temperature experiments were performed using a CARY® 5000 spectrophotometer. Changes in the maximum optical absorbance intensity (λmax≈378 nm) were depicted relative to the initial absorbance intensity.
Synthesis of ceria NPs
Ceria NPs were prepared by a forced-hydrolysis process using cerium dissolved along with lithium hydroxide in ethanol, heated to 70°C in a silicon oil bath, and held while stirring for 90 minutes. After heating, the solution was mixed with n-heptane to facilitate crystal growth, and allowed to rest for 20–24 hours. The ZP of the CeO2 NPs was controlled by using different ceria precursors in the reaction solution including cerium (III) chloride (–35 mV), cerium (III) nitrate (–9.7 mV), and cerium (IV) ammonium nitrate (9.3 mV). The resulting precipitate was centrifuged out and washed in ethanol to remove any remaining precursor, and twice washed in nanopure water to remove any residual hydroxide and ethanol. The final product was dried in an oven at 50°C. CeO2 NPs were thoroughly characterized using all the techniques described for ZnO NPs.
Cell culture
Written informed consent was obtained from all blood donors, and the Boise State University institutional review board approved this study. Peripheral blood mononuclear cells were obtained by Ficoll-Hypaque (Histopaque-1077; Sigma, St Louis, MO, USA) gradient centrifugation using heparinized phlebotomy samples.7 Cells were washed three times with Hank’s buffer (Sigma) and incubated at 1×10⁶ cells/mL in Roswell Park Memorial Institute (RPMI)-1640 (Sigma) containing 10% fetal bovine serum (FBS). CD4+ T cells were obtained by negative immunomagnetic selection per manufacturer’s instructions using a cocktail of antibodies against CD45RO, CD8, CD19, CD14, CD16, CD56, and glycophorin A (Stemcell Technologies, Vancouver, BC, Canada) with collection of unlabeled T cells (typically >96% purity as assessed by flow cytometry). Purified CD4+ T cells were cultured in RPMI-1640/10% FBS at 1×10⁶ cells/mL in 200 μL total volume in 96-well microtiter plates. The Jurkat and Hut-78 T cell lines (ATCC, Manassas, VA, USA) were cultured in RPMI-1640 supplemented with 10% FBS and 2 mM l-glutamine, 1.5 g/L sodium bicarbonate, 4.5 g/L glucose, 10 mM HEPES, and 1.0 mM sodium pyruvate. Cells were maintained in log phase at 37°C and 5% CO2, and seeded at 1×10⁵ cells/well in 96-well microtiter plates for individual experiments.
Cell viability
Cell viability was determined by flow cytometry and propidium iodide (PI) staining. Cells were identified using fluorescent antibodies against surface markers; cancer T cells were stained with HLA-ABC-FITC (BD Biosciences, San Jose, CA, USA), and primary T cells were stained with CD4-FITC antibodies (Immunotech; Beckman Coulter, Inc., Brea, CA, USA). Dead cells were stained positive for PI which is a cell membrane-impermeable red fluorescent nuclear stain. Following PI staining (50 μg/mL), fluorescent CountBright™ beads (Thermo Fisher Scientific, Waltham, MA, USA) were added to the samples to determine absolute cell numbers and quantify cell death. NPs were nonfluorescent and were excluded from the analysis by flow cytometric gating.
An alternate viability assay was used to verify experimental results and included either the alamar blue metabolic assay or the LIVE/DEAD® viability/cytotoxicity assay for mammalian cells (Thermo Fisher Scientific). Alamar blue (resazurin), a fluorogenic/chromogenic indicator dye, is reduced to a fluorescent product (resorufin) by mitochondrial electron transport chain enzymes and cytoplasmic enzymes of metabolically active cells. Alamar blue (10% of total volume) dye was added to the samples for 4–6 hours, and changes in fluorescence were evaluated spectrophotometrically using excitation/emission at 530/590 nm in a Synergy MX® plate reader (Biotek, Winooski, VT, USA). Viability was calculated as the percentage of untreated control samples.
For studies employing the dual-dye LIVE/DEAD® viability assay, the cell-permeable calcein AM dye (green) is converted to the highly green fluorescent product calcein by cellular esterases, and the cell-impermeable ethidium homodimer-1 dye produces red fluorescence upon binding to nucleic acids. To determine the concentration at which 50% of the cells remain viable (IC50), cancerous and primary T cells were treated with various concentrations of differently charged ZnO NPs, and cell viability was determined by flow cytometry and PI staining.
For all assays used in this study, cell viability was plotted against the logarithm of NP concentration and the IC50 calculated by nonlinear regression analysis to fit a variable slope dose–response curve using GraphPad Prism® (GraphPad Software, La Jolla, CA, USA).
NP uptake
ZnO NP uptake was determined via inductively coupled plasma mass spectrometry (ICP-MS). The effect of ZnO NP charge on cellular uptake was determined using Jurkat cells treated with 0.15 mM of differently charged ZnO NPs for 8 hours. Cells were washed in PBS and then separated from extracellular NPs via positive immunomagnetic selection using an anti-HLA-ABC-FITC antibody per manufacturer’s protocol (Stemcell Technologies) followed by extensive washing to remove unbound NPs. Recovered cells were counted (more than three times) using a hemocytometer (a minimum of 100 cells per field of view ± 9% variance), and 5×10⁵ cells/sample were washed in PBS and mechanically lysed with a probe-tip sonicator. Samples were subsequently treated with 10 N trace metal-grade HCl acid to ensure that all NPs were dissolved, and filtered using a 10 kDa MW cut-off Eppendorf filter (Sartorius Vivaspin® 500) to remove cellular debris prior to analysis of free zinc ion content using ICP-MS. Control samples using NPs devoid of cells demonstrated that a sham immunomagnetic selection procedure did not significantly affect the zinc ion level in experimental samples relative to control medium.
Quantitative analyses of the solutions described earlier were performed on an XSeries 2 (Thermo Fisher Scientific, Waltham, MA, USA) quadrupole inductively-coupled plasma mass spectrometer under normal operating conditions (ie, no collision cell technology and Xt cone set) in the Boise State University Biotrace Laboratory. Instrument performance was evaluated and optimized for each run. The instrument was calibrated against single-element Zn solutions in 2% trace metal-grade HNO3 at concentrations of ~1, 10, and 100 ppb. Instrument drift was monitored and corrected using 20 ppb indium as an internal standard introduced online. An external check standard solution of ~10 ppb Zn was run prior to and after each set of unknowns as a secondary drift monitor.
NP dissolution
ZnO NP dissolution (occurring in intracellular or extracellular spaces) was determined using ICP-MS as described earlier. To determine the intracellular zinc concentration derived from NP dissolution occurring inside the cell, Jurkat cells were treated with 0.15 mM of differently charged ZnO NPs for 8 hours. Cells were counted as described earlier, and 5×10⁵ cells/sample washed in PBS and mechanically lysed. Intact NPs were subsequently removed from the cell lysate by high-speed centrifugation at 18,000× g for 30 minutes, followed by filtration using a 10 kDa MW cut-off Eppendorf filter (1 nm pore size) to remove intact NPs while allowing free zinc ions to pass through. The concentration of dissolved zinc ions in the filtrate was then quantitated via ICP-MS. Control experiments were performed to demonstrate that >99% NP-derived zinc ions are recoverable using this methodology.
NP extracellular dissolution was determined after 24-hour incubation of 0.15 mM ZnO NP solutions in PBS at 37°C and 5% CO2. Solid phase NPs were removed from the solution as described earlier, and the zinc concentration was determined by ICP-MS.
ROS detection
Mitochondrial superoxide levels were determined by flow cytometry and MitoSOX™ Red staining (Thermo Fisher Scientific). MitoSOX™ Red is a cell-permeable dye that specifically targets mitochondria and becomes oxidized by interacting with superoxide. The fluorescent signal is a result of the binding of the oxidized dye to nucleic acids. Control samples were treated with 0.2 nM antimycin A, an inhibitor of mitochondrial electron transport complex III, to ensure that cells were capable of producing ROS. Cells were stained with fluorescent-labeled antibodies for cell identification (cancer cells were stained with anti-HLA-ABC-FITC; BD Biosciences), and primary cells with anti-CD4-FITC (Immunotech; Beckman Coulter, Inc.) and 5 μM MitoSOX™ Red for 30 minutes, and mitochondrial superoxide levels determined by flow cytometry (Epics XL; Coulter, Miami, FL, USA).
Measurement of GSH activity
GSH is an indicator of oxidative stress in the cell. Total GSH levels (reduced and oxidized) were determined using a GSH assay kit31 (Sigma-Aldrich, St Louis, MO, USA). Briefly, GSH was measured using a kinetic assay where GSH is oxidized to GSSG while catalyzing the conversion of 5,5′-dithiobis(2-nitrobenzoic acid) to thionitrobenzoic acid, which absorbs light at 412 nm. To detect the oxidized form, GSH reductase is added to the reaction mixture to allow the conversion of GSSG to GSH, which causes a continued substrate reduction. A standard curve was used to translate optical density values into GSH concentration.
Concurrent exposure to CeO2 and ZnO NPs
Jurkat cells were concurrently treated with varying concentrations of CeO2 NPs ± 0.25 mM ZnO NPs, and cell viability or superoxide anion generation was determined 24 hours later as described earlier using flow cytometry and PI staining or MitoSOX™ Red staining, respectively.
Statistical analysis
Data were analyzed using SAS version 9.1 software (SAS Institute, Cary, NC, USA). The IC50 values shown in Table 2 were calculated using GraphPad Prism® (GraphPad Software) and nonlinear regression, and the IC50 values for differently charged ZnO NPs were compared using GraphPad Prism® and one-way analysis of variance (ANOVA). Results were analyzed using ANOVA and post hoc comparisons. Significance levels were defined as P<0.05. Correlation between NP cytotoxicity and NP size and dissolution was performed using Microsoft Excel and linear regression analysis.
Results
Given reports that eukaryotic cancer cell membranes possess a preponderance of negatively charged phospholipids compared to the relative abundance of neutral-charged zwitterionic phospholipids on normal cell membranes,13,15,32 we hypothesized that the inherent cytotoxicity of ZnO NPs could be enhanced by modulating surface electrostatic properties. For these studies, size-controlled ZnO NPs (8 nm) with +44, –9, and –30 mV surface charge were synthesized by coating their surface with increasing amounts of biocompatible PAA.33 As shown in Table 1, ZP measurements were performed to confirm the systematic variation of the surface charge of ZnO NPs. As an n-type semiconductor, the Fermi level of ZnO NPs is typically higher than that in an intrinsic semiconductor, and this allows for electrons to be easily transferred from ZnO NPs into the surrounding solution, leading to positive surface charge for the NPs.34 As expected, the pure (uncoated) ZnO sample synthesized for these studies displayed a high-positive ZP of +44.2 mV (Table 1). In a water solution at neutral pH, many of the side chains of PAA will lose their protons and acquire a negative charge. This makes PAA an ideal surfactant to change the surface charge from positive to negative. As seen in Table 1, with increasing PAA from 0 to 60 mg, the surface charge of the ZnO NPs is continuously modified from highly positive (ZP of +44.2 mV) to highly negative values (ZP of –30.9 mV). It should be noted that all the ZnO aqueous solutions (5 mM) for the ZP measurements are weakly basic with a pH value of 7.6, well within the favorable range for most biological assays.
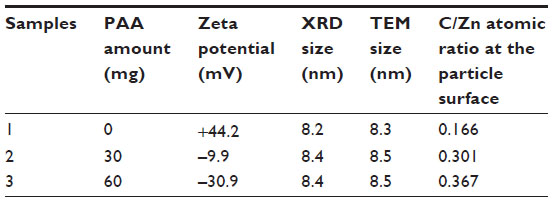 | Table 1 The zeta potential, average particle size estimated by XRD and TEM, and the atomic ratio of C to Zn (based on XPS data) of the ZnO NP samples made with different amounts of PAA |
As shown by the XRD patterns in Figure 1, all the samples with different surface charges have the same pure wurtzite ZnO phase (P63mc, lattice parameters a=0.325 nm, c=0.456 nm). Coating the NPs with increasing amounts of PAA did not cause any noticeable change in the lattice parameters, suggesting that the PAA coating did not modify the crystal structure appreciably. The average crystallite size of the ZnO NPs, estimated using the Scherrer formula,35 was 8.5±0.3 nm, and differences in the PAA amounts and surface charges did not vary the size appreciably. The corresponding transmission electron microscopy images (Figure 2) show that NP samples are dominated by the semi-spheres with narrow size distribution centering around 8.3–8.9 nm, which agrees well with the XRD results and further confirms that the crystallite size is independent of surface PAA layers.
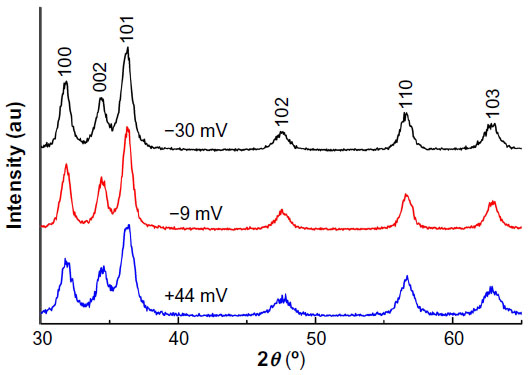 | Figure 1 XRD patterns of the samples with different surface charges. |
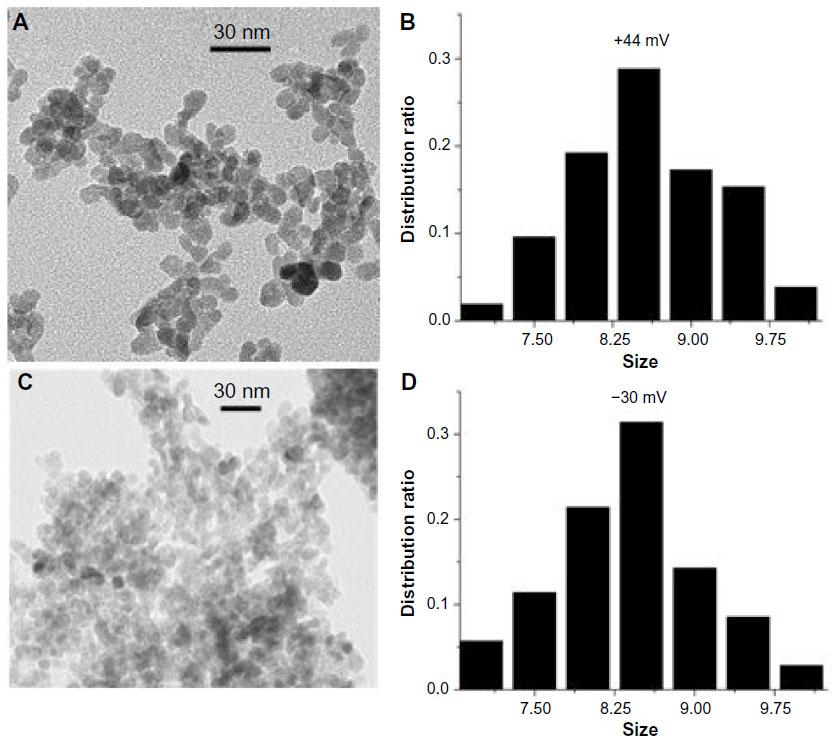 | Figure 2 TEM characterization of ZnO nanoparticles. |
Additional NP characterization was performed using XPS spectral analysis to further analyze the chemical composition of the samples. This technique has exceptional ability to probe the top few nanometers of the NP surface structure. As shown in Figure 3, only Zn, O, and C peaks were observed in the samples, confirming that all the ZnO NP samples prepared for this work consist of pure ZnO chemical phase, which is in agreement with XRD results. It should be noted that the carbon component of the most positive ZnO sample made without PAA should arise from the absorbed carbon from the air, and it is generally unavoidable for the XPS measurement. With the surface charge changing from +44.2 to –30.9 mV, the atomic ratio of carbon to zinc in the samples estimated from the XPS data increases from 0.166 to 0.367, again showing that the amount of PAA on the NP surface is systematically increasing. This is also in agreement with the amount of PAA used in the synthesis reaction to modify the surface charge (Table 1).
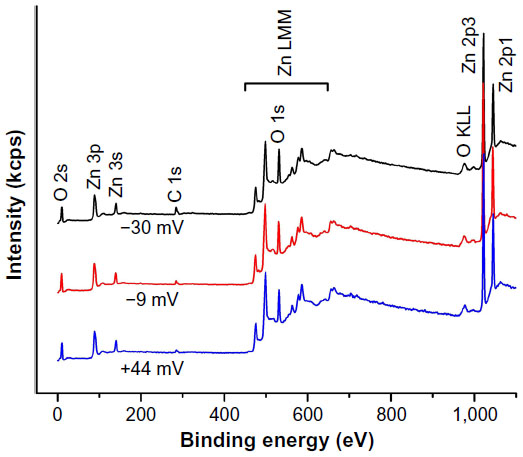 | Figure 3 Survey XPS spectra of ZnO NP samples with different surface charges. |
The effect of ZnO NP charge on NP cytotoxicity against cancerous (Jurkat leukemia and Hut-78 lymphoma cells) and normal primary T cells was assessed using flow cytometry and the alamar blue metabolic assay. Primary CD4+ T cells were isolated from peripheral blood of healthy volunteers by negative immunomagnetic selection, and compared to CD4+ leukemia or lymphoma cells. As shown in Figure 4, negatively charged ZnO NPs (–30 and –9 mV) exhibited greater cytotoxicity compared to positively charged ZnO NPs (+44 mV) in both primary T cells (A and B) and Jurkat leukemic T cells (C and D). Although there was a similar trend in Hut-78 T lymphoma cells, statistical significance was not achieved in this case (E and F).
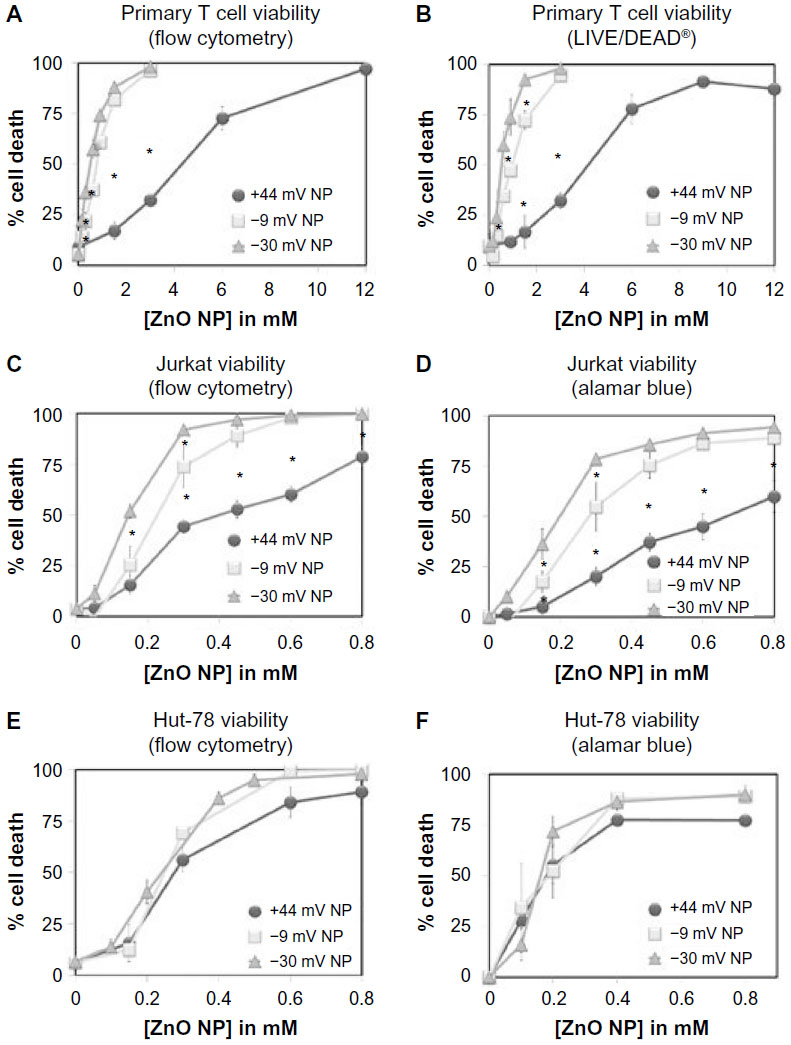 | Figure 4 Cytotoxicity effects of differently charged ZnO NPs on cancerous and normal human CD4+ T cells. |
These data show that NP charge can affect cytotoxicity, with most pronounced differences being observed in noncancerous cells compared to their transformed counterparts of identical lineage. As summarized in Table 2, negatively charged NPs show only an ~3.5- to 3.7-fold difference in cell selectivity (Jurkat leukemia T cells vs primary T cells), while positively charged +44 mV NPs produce a heightened selectivity against cancerous Jurkat cells (~9.3-fold). Both negatively charged ZnO NPs are significantly more cytotoxic compared to positively charged NPs, with –30 mV NPs being significantly more cytotoxic than –9 mV (in Jurkat and primary T cells only).
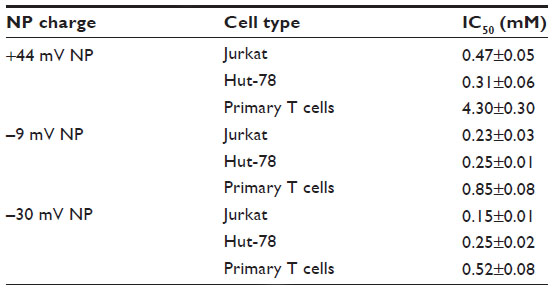 | Table 2 ZnO NP IC50 |
The somewhat unexpected finding that positively charged NPs display the least amount of cancer cell cytotoxicity despite their preponderance of negatively charged phospholipids on cell membranes13,15,32 indicates that factors in addition to electrostatic interactions appear to be involved in the cytotoxic mechanism. Subsequent studies were performed to determine the extent to which NP charge affects particle uptake. For these experiments, the amount of Zn ions derived from NPs taken up by cells was determined using a protocol involving immunomagnetic selection to exclude extracellular NPs and ICP-MS to determine the intracellular Zn ion concentration. As shown in Figure 5, only modest levels of NP uptake were observed regardless of the particle charge. The –30 mV NP showed the lowest level of uptake, while the –9 and +44 mV NP samples did not significantly differ. A positive control sample (figure inset) of intact ZnO NP demonstrated that essentially 100% of the zinc ions are recoverable using this methodology.
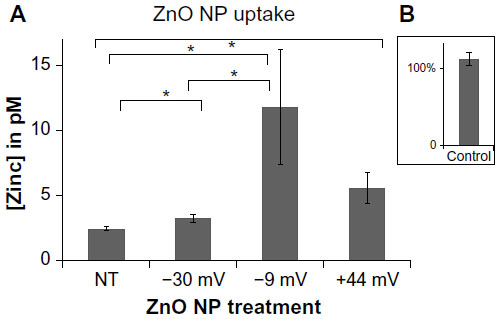 | Figure 5 Effects of NP charge on particle uptake. |
Additional studies were performed to determine the extent to which ZnO NPs dissolve in either intracellular or extracellular environments. In the first series of experiments, the concentration of intracellular zinc derived from NP dissolution occurring inside the cell was determined (Figure 6A). A charge-dependent increase in intracellular zinc was observed where cells exposed to +44 mV NP had significantly higher concentrations of intracellular zinc compared to untreated cells or cells exposed to either –30 or –9 mV NPs. The intracellular zinc concentration detected in untreated cells is consistent with reported data.36,37
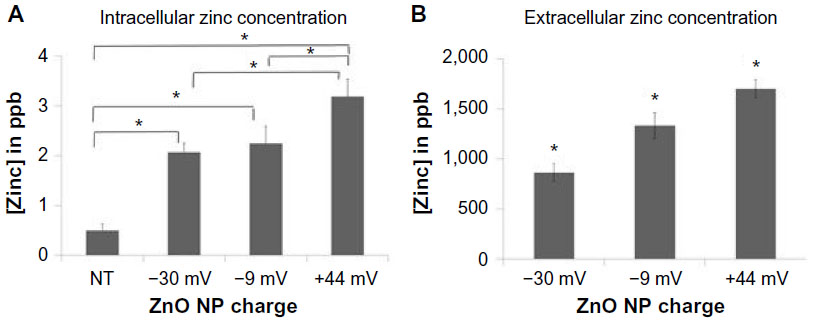 | Figure 6 Dissolution of ZnO NPs in intracellular and extracellular environments. |
The second series of experiments evaluated the extent to which the differently charged ZnO NPs dissolved extracellularly. As shown in Figure 6B, incubation of NPs in cell-free medium resulted in significant dissolution and release of free zinc ions with the +44 mV NPs again showing significantly more dissolution than –9 mV NPs, which dissolved more than –30 mV NPs. Thus, both the extracellular dissolution of ZnO NP and the intracellular dissolution of ZnO NPs follow the same relative pattern. Taken together with the cytotoxicity results shown in Figure 4, NP dissolution shows an inverse correlation with cytotoxicity profiles suggesting that the NPs that dissolve most readily (either intracellularly or extracellularly) are less cytotoxic (R2[intracellular zinc] =0.99, R2[extracellular zinc] =0.89).
When considering mechanisms of action of differently charged NPs, it is important to note that the presence of the PAA coating on the surface of negatively charged NPs may affect their dispersion in aqueous solutions.38 Experiments addressed this possibility by evaluating the relationship between increasing amounts of PAA coating and particle sedimentation and hydrodynamic size. A decrease in interparticle repulsive forces results in particle–particle interaction and formation of NP agglomerates that sediment out of solution. Hydrodynamic size refers to the size of these agglomerates, including the water molecules that are attracted to the particle’s surface. NP sedimentation was measured spectrophotometrically as the decrease in optical density. As shown in Figure 7A, the +44 mV NPs sediment the fastest, followed by –9 mV, with the –30 mV particles staying in solution the longest. Interestingly, this pattern mimics the cytotoxicity data shown in Figure 4, indicating that the particles that stay in solution the longest have the greatest toxicity.
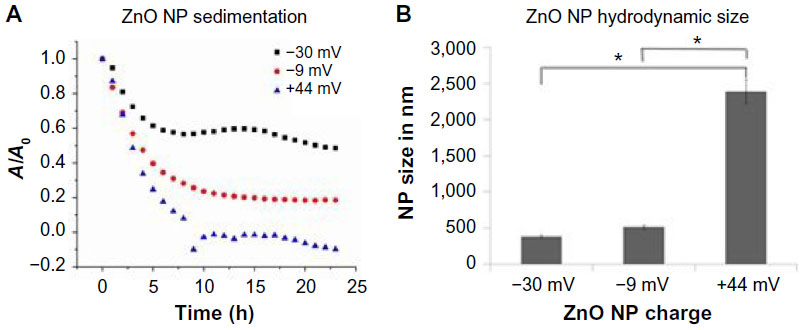 | Figure 7 ZnO NP sedimentation and hydrodynamic size as a function of particle charge. |
The data shown in Figure 7B show that the hydrodynamic size of the NPs inversely correlates with cytotoxicity profiles. Particles with the smallest hydrodynamic size (–30 mV < –9 mV < +44 mV) display the greatest cytotoxicity (–30 mV < –9 mV < +44 mV).
Previous studies demonstrated that ZnO NPs can promote the induction of ROS, and cause an increase in mitochondrial superoxide levels and a loss of mitochondrial cell membrane potential.2,11,21,39 In this study, we examined the extent to which differently charged ZnO NPs affect mitochondrial superoxide production in cancerous and primary T cells, using flow cytometry and MitoSOX™ Red staining. MitoSOX™ Red is targeted to the cell’s mitochondria and upon oxidation by superoxide yields red fluorescence (excitation/emission 510/580 nm). Figure 8 shows that all of the NPs used in this study were capable of inducing mitochondrial superoxide in a time- and concentration-dependent manner. In particular, negatively charged NPs were capable of inducing significantly higher levels compared to positively charged NPs in all cell types tested (albeit not at all lower NP concentrations or time points). Overall, these results are consistent with the cytotoxicity data presented in Figure 4, with the more cytotoxic NPs inducing higher levels of mitochondrial superoxide.
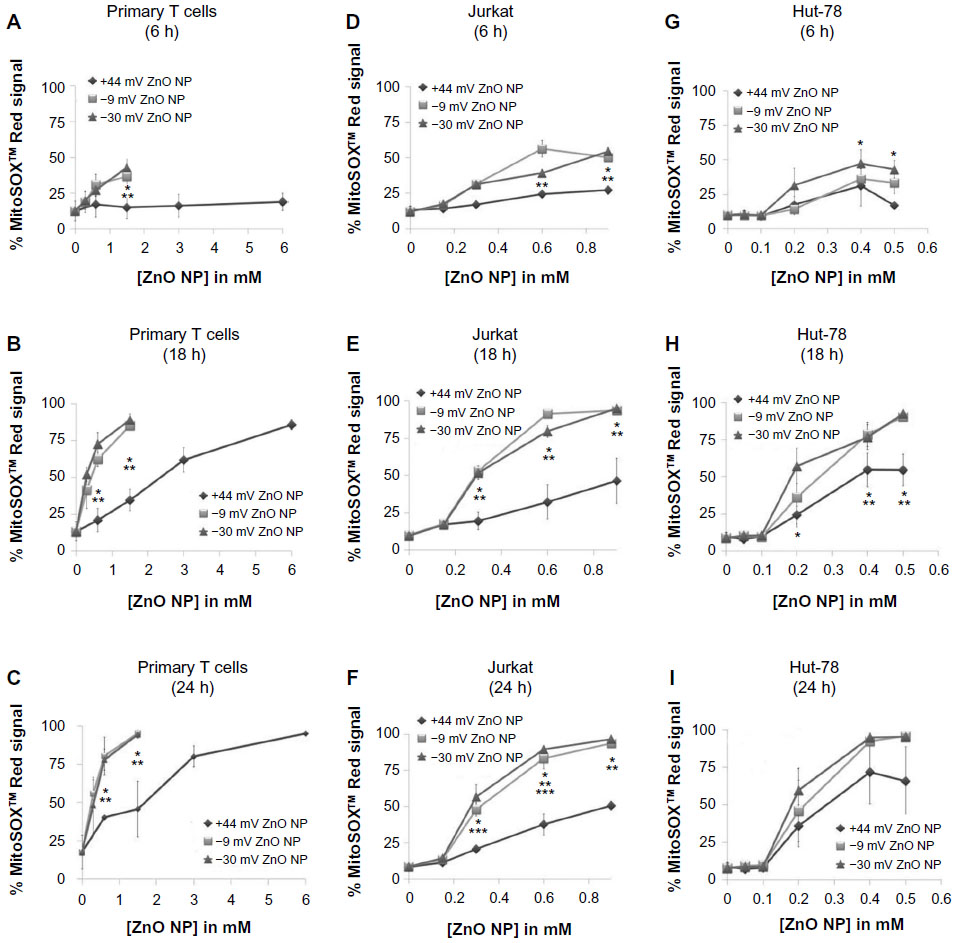 | Figure 8 Kinetics of mitochondrial superoxide generation by differently charged (–30, –9, and +44 mV) ZnO NPs at doses ranging from 0 to 6 mM. |
These findings were validated using fluorescent microscopy. Representative images shown in Figure 9 demonstrate that more than twice as many T cells stained positive for MitoSOX™ Red when exposed to negatively charged NPs versus positively charged particles.
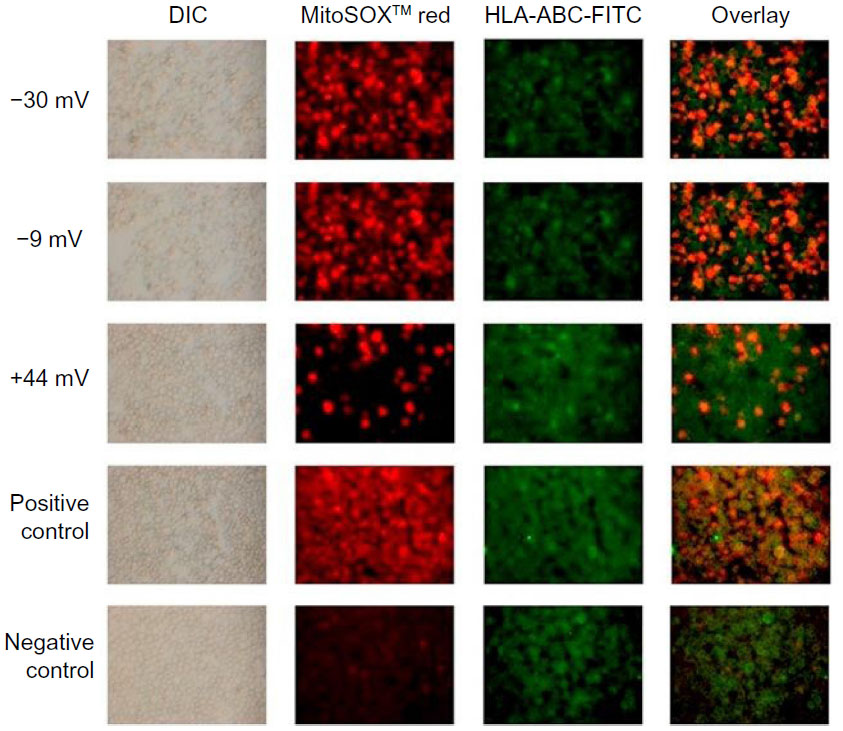 | Figure 9 Fluorescence microscopy images of MitoSOX™ Red-stained Jurkat cells exposed to differently charged (–30, –9, and +44 mV) ZnO NPs. |
So far, little is known regarding how ZnO NPs cause generation of ROS. As semiconductors, they have valence electrons on their surface and oxygen vacancies that enable them to participate in redox reactions and damage cell membranes, proteins, lipids, and enzymes.2,40 The observed elevation in ROS following NP exposure could be a result of inactivation of cellular antioxidant defense mechanisms, activation of oxidative stress pathways, or direct damage of proteins, membranes, and organelles. Experiments were performed to assess whether the less cytotoxic NPs caused an increase in GSH that protected cells from NP-induced cell death. Jurkat cells were exposed to various concentrations of ZnO NPs, and total GSH levels determined using a kinetic assay. As shown in Figure 10, none of the differently charged ZnO NPs produced a significant effect on GSH levels at 6 hours. However, a modest yet significant difference was observed between the +44 mV and negatively charged NPs at 18 hours of treatment but only at the highest concentration tested. The decrease in GSH at 18-hour exposure relative to baseline for negatively charged NPs could indicate that cells were in the early stages of cell death.40 Overall, these findings indicate that differential activation of GSH by differently charged NPs is not a major component of the toxicity mechanism.
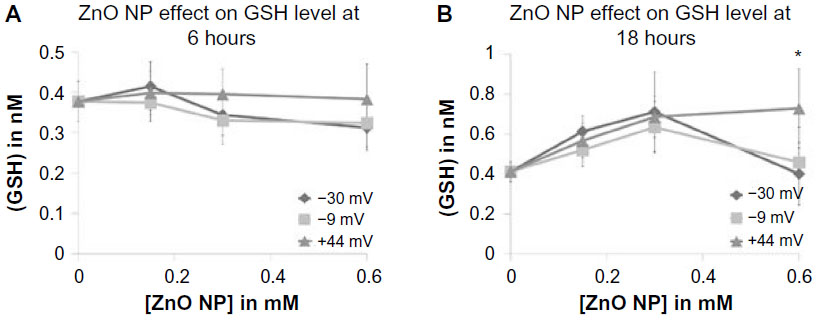 | Figure 10 Intracellular concentration of total GSH, in response to exposure to differently charged (–30, –9, and +44 mV) ZnO NPs. |
The last series of experiments evaluated the combined effects of different types of NPs that are found in common environmental settings. For example, CeO2 NPs are found in fuel additives, and ZnO NPs are produced by welding fumes in industrial settings,41 potentially increasing the risk of concurrent human exposure. Experiments were performed to determine the effect of variously charged ZnO (–30, –9, and +44 mV) and CeO2 NPs (–35 mV; Table 3) on cancer T cell viability when acting alone or in combination. CeO2 NPs did not show any significant cytotoxicity in Jurkat cells at concentrations as high as 1.5 mM (Figure 11A). Concurrent exposure of Jurkat cells to CeO2 NPs and ZnO NPs showed a protective effect against negatively charged ZnO NP-induced cell death (Figure 11B). Interestingly, the anionic CeO2 NPs failed to have an appreciable effect on positively charged ZnO NP-induced cytotoxicity. This is possibly due to favorable attractive forces between the two particle types that interfere with particle adsorption onto cell membranes.
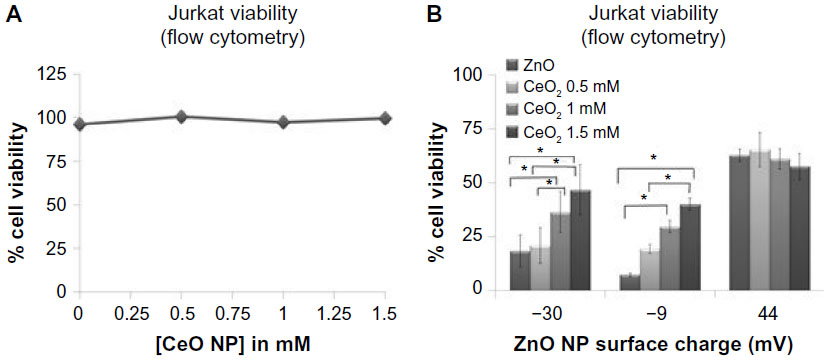 | Figure 11 Cerium oxide NPs modulate ZnO NP-induced cell death. |
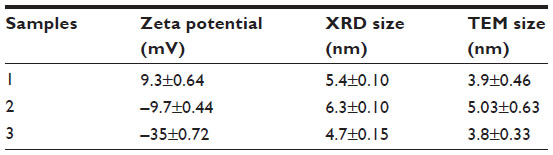 | Table 3 The zeta potential and the average particle size estimated by XRD of the CeO2 NP samples |
Given that CeO2 NPs have been reported to have ROS-quenching activities,23,42 additional studies were performed to demonstrate that the protective effects of CeO2 NP against ZnO NP-induced cell death are associated with antioxidant effects. As shown in Figure 12, all three of the differently charged CeO2 NPs (–35, –10, +9 mV) provided a significant level of reduction in ZnO NP-induced mitochondrial superoxide production. The results strongly suggest that the ability of CeO2 NPs to protect against ZnO NP toxicity is due to the antioxidant properties of the nanoceria, and that the protective effect can occur regardless of the charge of the CeO2 particle.
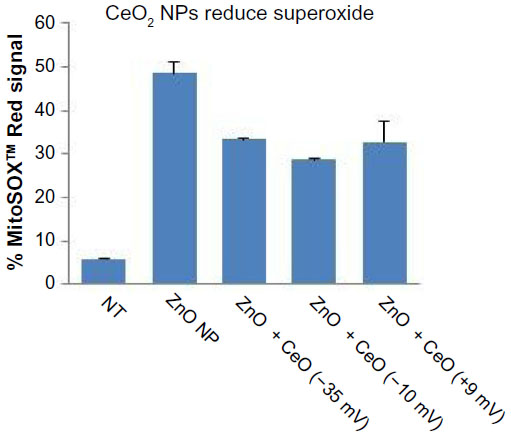 | Figure 12 Reduction in ZnO NP-induced mitochondrial superoxide generation by differently charged (–35, –10, and +9 mV) CeO2 NPs. |
Discussion
The unique properties of nanomaterials hold promise for providing new tools for biological and technology-driven applications. One of the key properties of NPs, by definition, is their small size. This exposes more molecules on the surface, thereby increasing the available surface area for interactions with biomolecules. This is of relevance for biomedical applications where improved approaches for drug targeting and drug delivery are needed. While several nanomaterial-based drugs such as Abraxane® and Doxil® are already on the market,2,43 toxicity issues of NPs remain of concern.1 Thus, studies aimed at reducing undesirable toxicity of ZnO NPs against normal body tissues, while exploiting their reported inherent toxicity against cancerous cells,2,4,7,8,44 are of interest.
It is generally recognized that NP properties depend on their physicochemical characteristics such as size, chemical composition, and surface charge.2,45 This allows for the possibility of engineering ZnO NPs in such a way as to enhance their inherent cytotoxicity against cancerous cells. Recent studies provide evidence for ZnO NP size-dependent cytotoxicity,11,45 but data on the effect of surface charge on ZnO NP preferential cytotoxicity remain controversial.30,46,47 The purpose of this study is to increase our knowledge regarding the effects that electrostatic properties have on ZnO NP cytotoxicity in cancerous and primary T cells.
Results suggest that while NP surface charge can contribute to NP-mediated cytotoxicity, it is not the only mechanism involved. Contrary to our initial hypothesis based on attractive interactions between charged NPs and anionic eukaryotic cell membranes,13,32 negatively charged ZnO NPs were shown to produce the highest level of cytotoxicity (–30 mV > –9 mV> +44 mV NPs; Figure 4). Additional experiments revealed that other factors contributing to cytotoxicity include the degree to which NPs aggregate and dissolve into free zinc ions. There was a strong correlation for the least cytotoxic NPs (ie, –44 mV > –9 mV > –30 mV) to have the largest hydrodynamic size (R2=0.96) and exhibit the greatest degree of aggregation in aqueous solution (Figure 7). In addition, the intracellular (R2=0.99) and extracellular (R2=0.89) zinc concentration derived from NP dissolution also exhibited an inverse correlation with NP cytotoxicity (Figure 6).
It is of interest to note that the ability of NPs to induce mitochondrial superoxide production also followed the same trend as NP cytotoxicity, with the negatively charged NPs showing the greatest induction of ROS compared to positively charged NPs (Figures 8 and 9). In contrast, intracellular particle uptake did not appear to be a major contributor to the cytotoxicity but rather to the maintenance of intact particles, and those with a lesser propensity to sediment in solution (Figures 5–7). Thus, it is possible that NP-mediated induction of ROS may occur at or near the cell surface and simply requires the presence of intact particles rather than appreciable NP uptake. Alternatively, it is possible that the sampling times used in our uptake studies did not encompass the optimal time frame for particle uptake. Nevertheless, our results demonstrate that the mechanism(s) controlling NP cytotoxicity are multifactorial and likely interrelated with a variety of physical parameters including electrostatics, particle stability, agglomeration, and ability to induce ROS.
One of the goals of this study was to determine if modulating NP surface charge could affect the cancer cell-killing ability of ZnO NPs. Our results show that NP surface charge does affect the differential cytotoxicity against cancer cells. In particular, ZnO NPs with negative surface charge (–9 and –30 mV) exhibit a lower IC50 compared to more positively charged NPs (+44 mV) in both cancerous Jurkat and primary T cells. We also observed that NPs with negative surface charge have a narrower NP concentration range for inducing cancer cell death while sparing normal cells (~3.7- and ~3.5-fold difference in IC50 values, respectively; Table 2). In contrast, positively charged NPs are less cytotoxic but provide a wider NP concentration range for preferentially inducing cancer cell death (~9.3-fold difference in IC50 values; Table 2). Although these results suggest that positively charged NPs may be better candidates for use in cancer treatment, their rapid clearance from the circulation by the reticuloendothelial system may prevent cationic NPs from reaching their target site48 and is an important consideration. Future studies are needed to identify the optimal balance between NP cytotoxicity, NP charge, and in vivo circulation time for potential use in biological applications.
The molecular basis for the greater cancer cell selectively of cationic ZnO NPs is presently unknown. However, it is recognized that cancer cell membranes possess a relative preponderance of negatively charged phospholipids,12,15,32 which is expected to facilitate the adhesion of cationic NPs involving electrostatic interaction. We propose this as a primary mechanism accounting for the greater selectivity of cationic NPs in killing cancerous cells. However, other physical characteristics of the cationic NPs lead to an overall reduced toxicity in both cancerous and normal cells. These include the propensity of cationic ZnO NPs to more readily dissolve in both intracellular and extracellular spaces, and to aggregate and sediment at faster rates than anionic ZnO NPs. These properties act to reduce the overall bioavailabilty of cationic NPs for cellular uptake, which can explain their lower toxicity profile in both cancerous and normal cells.
In contrast, anionic ZnO NPs were found to be more toxic to both cancerous and normal cells, yet display less cancer cell selectivity. We postulate that their different cytotoxicity profile reflects their greater bioavailability for uptake into the cells, as well as an altered process for membrane bioadhesion and/or uptake. While cell membranes contain comparatively scarcer cationic sites, these regions have been reported to facilitate the adsorption of other types of anionic NPs which then form clusters due to their repulsive interactions with the large negatively charged domains of the cell membrane.30,49 The NPs already bound to the membrane then result in a reduced charge density which may favor aggregation with other free NPs. Although the precise mechanism remains unclear, the end result is uptake of anionic NPs, which occurs at a similar extent in both cancerous and normal cells. Because anionic ZnO NPs remain as individual intact particles by dissolving less and staying in solution longer, this contributes to their greater bioavailability and increased toxicity to both cancerous and normal cells. As a consequence, the selectivity of anionic NP against cancerous cells is lessened, but some degree of selectivity remains due to the lower level of ROS generated in quiescent normal cells compared to rapidly dividing cancer cells.
Previous studies have indicated that the preferential cancer cell cytotoxicity of ZnO NPs is likely related to the proliferative potential of the cell.7,11,22 Consistent with these reports, we found that cancerous T cells (~48- to 65-hour doubling time) had greater susceptibility to all of the ZnO NPs used in our study compared to the nonproliferative resting primary T cells. However, one of the unexpected findings in our study was that Jurkat and Hut-78 cells have very different cytotoxicity profiles to charged NPs despite their similar doubling times. This suggests that other factors, in addition to the cell’s proliferation potential, must be involved. Although the exact basis for this difference is presently unknown, it is recognized that Hut-78 cells constitutively express high levels of the NF-kB inhibitor, IkB-α, whereas Jurkat cells express normal levels of this transcriptional regulator.50 This may be relevant given that expression of activated NF-kB is implicated in the three-tier oxidative stress model described to explain the ZnO NP cytotoxicity,19 although direct manipulation of the NF-kB signaling pathway is required to verify its direct involvement in NP susceptibility.
Data presented here indicate that the characteristics of the most highly cytotoxic NPs evaluated in this study are anionic charge, lower aggregation and sedimentation profiles, lower extracellular and intracellular dissolution profiles, and an increased ability to induce ROS production. These combined characteristics suggest that ROS production facilitated by intact NPs at or near the cell surface is a key consideration for highly cytotoxic NPs, and that dissolution into free zinc ions is of considerably lesser importance. This is consistent with reported findings that NP-induced cytotoxicity requires NP contact with cells but is independent from the concentration of free zinc ions.51 However, other studies report that dissolution of ZnO NPs into free zinc ions is a major component of cytotoxicity.8,21 It is important to note, however, that the ZnO NPs used in those studies were produced using different synthesis methods than the particles described in this study and may display markedly different dissolution profiles and use a different cytotoxicity mechanism. Regardless, our observation that coating the ZnO NP surface with polyelectrolytes such as PAA improves particle dispersion is a relevant finding for biological applications where NP aggregation should be minimized.
The importance of ZnO NPs structure in their cytotoxicity is likely due to the presence of oxygen vacancies and electrons/holes on the surface which facilitates redox reactions leading to ROS generation.40,52 To provide a better understanding of the ZnO NP mechanism of action, we examined the ability of differently charged ZnO NPs to generate intracellular ROS. ZnO NPs induce a time- and concentration- dependent increase in mitochondrial superoxide levels in all cells tested. The increase in ROS levels corresponds to NP cytotoxicity, with the negatively charged NPs (–30 and –9 mV) being the most toxic and able to generate higher levels of mitochondrial superoxide, compared to positively charged NPs (+44 mV) (Figures 8 and 9). The lower levels of ROS induced by cationic NPs could be due to faster aggregation, and the higher level of dissolution and loss of solid phase NPs. Data are consistent with ROS generation requiring intact NP interactions at or near the cell membrane.
To gain an improved understanding of how ZnO NPs cause an increase in intracellular ROS levels, experiments were performed to determine the effect of differently charged ZnO NPs on GSH, the smallest cellular thiol and major antioxidant in the cell.53 In almost all cases, the differently charged ZnO NPs had no appreciable effect on GSH levels (Figure 10), indicating that the ROS induction is unlikely to be due to charge-specific alterations in GSH. The lower levels of GSH observed at longer exposures to negatively charged NPs, however, likely reflect a greater proportion of dying cells40,54 induced by anionic NP vs cationic NP at these experimental conditions. Further examination of the antioxidant cellular capacity and involvement of oxidative stress in ROS generation needs to be done in order to fully understand how ZnO NPs increase ROS production in cells.
While a large body of scientific literature describing the toxicity profiles and mechanism of action of single nanomaterial systems is accumulating, relatively few studies have evaluated the combined effects of multiple nanomaterials. The increasing use of nanomaterials in a growing number of manufacturing applications increases the likelihood of occupational exposure to multiple nanomaterial types. For example, in industrial settings combining welding fumes and diesel exhaust, both ZnO and CeO2 NPs can be present. This underscores the need to understand and identify interactions between nanomaterials where occupational exposure may be relevant. Given this rationale, experiments were performed to determine the effect of ZnO NPs surface charge and their cytotoxic response in the presence of CeO2 NPs. Under concurrent exposure conditions, the cytotoxicity of negatively charged ZnO NPs was decreased (Figure 11). In contrast, concurrent exposure to CeO2 and positively charged ZnO NPs had no effect on ZnO NP-induced cytotoxicity. These results suggest that CeO2 NP can protect cells from negatively charged ZnO NP-induced cytotoxicity. Additional experiments demonstrated that regardless of the charge of the CeO2 NP, a significant reduction in the level of mitochondrial superoxide was observed in cells co-treated with both CeO2 and ZnO NPs. These data are consistent with the reported antioxidant properties of CeO2.24,42,55,56 These results indicate that the protective effects of CeO2 against ZnO NP-induced cytotoxicity may be useful for protecting cells from unwanted cytotoxicity.
In general, the results presented in this study show that ZnO NP cytotoxicity is multifactorial with surface charge representing just one of the factors contributing to NP cytotoxicity. The positively charged ZnO NPs evaluated in this study appear to offer the greatest cancer cell selectivity, while other factors of these cationic particles may work to limit their use as anticancer agents, including their faster rate of aggregation and dissolution. On the other hand, the negatively charged ZnO NPs studied in this work offered lower cancer cell selectivity but had more desirable factors for potential therapeutic use such as a lower degree of dissolution and better dispersion properties. Future studies involving the fine-tuned engineering to produce smaller increments of NP charge are warranted to identify the optimal particle surface charge that offers the greatest degree of cancer cell selectivity while retaining desirable dissolution and aggregation profiles. Variations in ZnO NP surface charge did not induce any detectable effect on the NP mechanism of action, and all three differently charged ZnO NPs seem to mediate their effect through ROS production. In addition, variations in ZnO NP surface charge affect ZnO NP cytotoxicity in the presence of CeO2 NPs. In particular, CeO2 NPs can decrease negatively charged ZnO NP-induced cytotoxicity suggesting the possibility of sequential use of ZnO and CeO2 NPs in biological regimens to curtail unwanted ROS-induced injury of normal cells after desirable anticancer activities of ZnO NPs had occurred. Altogether, data presented in this study provide important information regarding the effect of NPs surface charge on their cytotoxicity and subsequently improve our understanding on how to better engineer ZnO NPs with desired properties.
Acknowledgments
This work was supported in part by NIH 1R15 CA141358, NSF 0821233 and EAGER DMR-1137419, ARO W911NF-09-1-0051, and NSF CBET 1134468 grants.
Disclosure
The authors report no conflicts of interest in this work.
References
Nel A, Xia T, Madler L, Li N. Toxic potential of materials at the nanolevel. Science. 2006;311(5761):622–627. | |
Rasmussen JW, Martinez E, Louka P, Wingett DG. Zinc oxide nanoparticles for selective destruction of tumor cells and potential for drug delivery applications. Expert Opin Drug Deliv. 2010;7(9):1063–1077. | |
Gupta AK, Gupta M. Synthesis and surface engineering of iron oxide nanoparticles for biomedical applications. Biomaterials. 2005;26:3995–4021. | |
Akhtar MJ, Ahamed M, Kumar S, Khan MM, Ahmad K, Alrokayan SA. Zinc oxide nanoparticles selectively induce apoptosis in human cancer cells through reactive oxygen species. Int J Nanomedicine. 2012;7:845–857. | |
Lin W, Xu Y, Huang CC, et al. Toxicity of nano- and micro-sized ZnO particles in human lung epithelial cells. J Nanoparticle Res. 2009;11(1):25–39. | |
Smijs TG, Pavel S. Titanium dioxide and zinc oxide nanoparticles in sunscreens: focus on their safety and effectiveness. Nanotechnol Sci Appl. 2011;4(1):95–112. | |
Hanley C, Layne J, Punnoose A, et al. Preferential killing of cancer cells and activated human T cells using ZnO nanoparticles. Nanotechnology. 2008;19(29):295103. | |
Sasidharan A, Chandran P, Menon D, Raman S, Nair S, Koyakutty M. Rapid dissolution of ZnO nanocrystals in acidic cancer microenvironment leading to preferential apoptosis. Nanoscale. 2011;3(9):3657–3669. | |
Reddy KM, Feris K, Bell J, Wingett DG, Hanley C, Punnoose A. Selective toxicity of zinc oxide nanoparticles to prokaryotic and eukaryotic systems. Appl Phys Lett. 2007;90(213902):213902–213903. | |
Nair S, Sasidharan A, Divya RV, et al. Role of size scale of ZnO nanoparticles and microparticles on toxicity toward bacteria and osteoblast cancer cells. J Mater Sci Mater Med. 2009;20:S235–S241. | |
Hanley C, Thurber A, Hanna C, Punnoose A, Zhang J, Wingett DG. The influences of cell type and ZnO nanoparticle size and immune cell cytotoxicity and cytokine induction. Nanoscale Res Lett. 2009;4(12):1409–1420. | |
Madani F, Lindberg S, Langel U, Futaki S, Graslund A. Mechanisms of cellular uptake of cell-penetrating peptides. J Biophys. 2011:2011:414729. | |
Abercrombie M, Ambrose EJ. The surface properties of cancer cells: a review. Cancer Res. 1962;22:525–548. | |
Bockris JO’M, Habib MA. Are there electrochemical aspects of cancer? J Biol Phys. 1982;10:227–237. | |
Papo N, Shahar M, Eisenbach L, Shai Y. A novel lytic peptide composed of DL-amino acids selectively kills cancer cells in culture and in mice. J Biol Chem. 2003;278(23):21018–21023. | |
Asati A, Santra S, Kaittanis C, Perez JM. Surface-charge-dependent cell localization and cytotoxicity of cerium oxide nanoparticles. ACS Nano. 2010;4(9):5321–5331. | |
Bhattacharjee S, de Haan LH, Evers NM, et al. Role of surface charge and oxidative stress in cytotoxicity of organic monolayer-coated silicon nanoparticles towards macrophage NR8383 cells. Part Fibre Toxicol. 2010;7:25. | |
Boisvert JP, Malgat A, Pochard I, Daneault C. Influence of the counter-ion on the effective charge of polyacrylic acid in dilute condition. Polymer. 2002;43:141–148. | |
Xia T, Kovochich M, Brant J, et al. Comparison of the abilities of ambient and manufactured nanoparticles to induce cellular toxicity according to an oxidative stress paradigm. Nano Lett. 2006;6(8):1794–1807. | |
Hamanaka RB, Chandel NS. Mitochondrial reactive oxygen species regulate cellular signaling and dictate biological outcomes. Trends Biochem Sci. 2010;35:505–513. | |
Xia T, Kovochich M, Liong M, et al. Comparison of the mechanism of toxicity of zinc oxide and cerium oxide nanoparticles based on dissolution and oxidative stress properties. ACS Nano. 2008;2(10):2121–2134. | |
Taccola L, Raffa V, Riggio C, et al. Zinc oxide nanoparticles as selective killers of proliferating cells. Int J Nanomedicine. 2011;6:1129–1140. | |
Korsvik C, Patil S, Seal S, Self WT. Superoxide dismutase mimetic properties exhibited by vacancy engineered ceria nanoparticles. Chem Commun. 2007;(10):1056–1058. | |
Heckert EG, Karakoti AS, Seal S, Self WT. The role of cerium redox state in the SOD mimetic activity of nanoceria. Biomaterials. 2008;29(18):2705–2709. | |
Tarnuzzer RW, Colon J, Patil S, Seal S. Vacancy engineered ceria nanostructures for protection from radiation-induced cellular damage. Nano Lett. 2005;5(12):2573–2577. | |
Sharma V, Anderson D, Dhawan A. Zinc oxide nanoparticles induce oxidative DNA damage and ROS-triggered mitochondria mediated apoptosis in human liver cells (HepG2). Apoptosis. 2012;17:852–870. | |
Pujalte I, Passagne I, Brouillaud B, et al. Cytotoxicity and oxidative stress induced by different metallic nanoparticles on human kidney cells. Part Fibre Toxicol. 2011;8:10. | |
Guo D, Wu C, Jiang H, Li Q, Wang X, Chen B. Synergistic cytotoxic effect of different sized ZnO nanoparticles and daunorubicin against leukemia cancer cells under UV irradiation. J Photochem Photobiol B. 2008;93(3):119–126. | |
Osaka T, Nakanishi T, Shanmugam S, Takahama S, Zhang H. Effect of surface charge of magnetite nanoparticles on their internalization into breast cancer and umbilical vein endothelial cells. Colloids Surf B Biointerfaces. 2009;71(2):325–330. | |
Wilhelm C, Billotey C, Roger J, Pons JN, Bacri JC, Gazeau F. Intracellular uptake of anionic superparamagnetic nanoparticles as a function of their surface coating. Biomaterials. 2003;24:1001–1011. | |
Birch CS, Brasch NE, McCaddon A, Willaims JH. A novel role for vitamin B(12): cobalamins are intracellular antioxidants in vitro. Free Radic Biol Med. 2009;47(2):184–188. | |
Leroueil PR, Hong S, Mecke A, Baker JR, Orr BG. Nanoparticle interaction with biological membranes: does nanotechnology present a Janus face? Acc Chem Res. 2007;40(5):335–342. | |
Bromberg L. Polymeric micelles in oral chemotherapy. J Control Release. 2008;128(2):99–112. | |
Ghosh M, Raychaudhuri AK. Shape transition in ZnO nanostructures and its effect on blue-green photoluminescence. Nanotechnology. 2008;19(44):445704. | |
Punnoose A, Magnone H, Seehra, MS, Bonevich J. Bulk to nanoscale magnetism and exchange biase in CuO nanoparticles. Phys Rev B. 2001;64:174420. | |
Kao YY, Chen YC, Cheng TJ, Chiung YM, Liu PS. Zinc oxide nanoparticles interfere with zinc ion homeostasis to cause cytotoxicity. Toxicol Sci. 2012;125(2):462–472. | |
Zalups RK, Koropatnick DJ. Cellular and Molecular Biology of Metals. Boca Raton, FL: CRC Press/Taylor and Francis Groups; 2010. | |
Othman SH, Rashid SA, Ghazi TIM, Abdullah N. Dispersion and stabilization of photocatalytic TiO2 nanoparticles in aqueous suspension for coatings applications. J Nanomater. 2012;2012:10. | |
Song W, Zhang J, Guo J, et al. Role of the dissolved zinc ion and reactive oxygen species in cytotoxicity of ZnO nanoparticles. Toxicol Lett. 2010;199:389–397. | |
Circu ML, Aw TY. Glutathione and apoptosis. Free Radic Res. 2008;42(8):689–706. | |
Park B, Donaldson K, Duffin R, et al. Hazard and risk assessment of a nanoparticulate cerium oxide-based diesel fuel additive – a case study. Inhal Toxicol. 2008;20(6):547–566. | |
Niu J, Wang K, Kolattukudy PE. Cerium oxide nanoparticles inhibit oxidative stress and nuclear factor-kappaB activation in H9c2 cardiomyocytes exposed to cigarette smoke extract. J Pharmacol Exp Ther. 2011;338(1):53–61. | |
Nie S, Xing Y, Kim GJ, Simons JW. Nanotechnology applications in cancer. Annu Rev Biomed Eng. 2007;9:257–288. | |
Wang H, Wingett D, Engelhard MH, et al. Fluorescent dye encapsulated ZnO particles with cell-specific toxicity for potential use in biomedical applications. J Mater Sci Mater Med. 2009;20(1):11–22. | |
Nabeshi H, Yoshikawa T, Matsuyama K, et al. Size-dependent cytotoxic effects of amorphous silica nanoparticles on Langerhans cells. Pharmazie. 2010;65(3):199–201. | |
Baek M, Kim MK, Cho HJ, et al. Factors influencing the cytotoxicity of zinc oxide nanoparticles: particle size and surface charge. J Phys Conf Ser. 2011;304(1):012044. | |
Verma A, Stellacci F. Effect of surface properties on nanoparticle-cell interactions. Small. 2010;6(1):12–21. | |
Thanh NTK, Green LAW. Functionalisation of nanoparticles for biomedical applications. Nano Today. 2010;5(3):213–230. | |
Patil S, Sandberg A, Heckert E, Self W, Seal S. Protein adsorption and cellular uptake of cerium oxide nanoparticles as a function of zeta potential. Biomaterials. 2007:28:4600–4607. | |
Giri DK, Aggarwal BB. Constitutive activation of NF-kappaB causes resistance to apoptosis in human cutaneous T cell lymphoma HuT-78 cells. Autocrine role of tumor necrosis factor and reactive oxygen intermediates. J Biol Chem. 1998;273:14008–14014. | |
Moos PJ, Chung K, Woessner D, Honeggar M, Cutler NS, Veranth JM. ZnO particulate matter requires cell contact for toxicity in human colon cancer cells. Chem Res Toxicol. 2010;23(4):733–739. | |
Pacchioni G. Oxygen vacancy: the invisible agent on oxide surfaces. Chemphyschem. 2003;4(10):1041–1047. | |
Franco R, Cidlowski JA. Apoptosis and glutathione: beyond an antioxidant. Cell Death Differ. 2009;16:1303–1314. | |
Franco R, Panayiotidis MI, Cidlowski JA. Glutathione depletion is necessary for apoptosis in lymphoid cells independent of reactive oxygen species formation. J Biol Chem. 2007;282(42):30452–30465. | |
Das M, Patil S, Bhargava N, et al. Auto-catalytic ceria nanoparticles offer neuroprotection to adult rat spinal cord neurons. Biomaterials. 2007;28(10):1918–1925. | |
Hirst SM, Karakoti AS, Tyler RD, Sriranganathan N, Seal S, Reilly CM. Anti-inflammatory properties of cerium oxide nanoparticles. Small. 2009;5(24):2848–2856. |
 © 2016 The Author(s). This work is published and licensed by Dove Medical Press Limited. The full terms of this license are available at https://www.dovepress.com/terms.php and incorporate the Creative Commons Attribution - Non Commercial (unported, v3.0) License.
By accessing the work you hereby accept the Terms. Non-commercial uses of the work are permitted without any further permission from Dove Medical Press Limited, provided the work is properly attributed. For permission for commercial use of this work, please see paragraphs 4.2 and 5 of our Terms.
© 2016 The Author(s). This work is published and licensed by Dove Medical Press Limited. The full terms of this license are available at https://www.dovepress.com/terms.php and incorporate the Creative Commons Attribution - Non Commercial (unported, v3.0) License.
By accessing the work you hereby accept the Terms. Non-commercial uses of the work are permitted without any further permission from Dove Medical Press Limited, provided the work is properly attributed. For permission for commercial use of this work, please see paragraphs 4.2 and 5 of our Terms.