")
Back to Journals » International Journal of Women's Health » Volume 9
A revisit of the fetal foot length and fetal measurements in early pregnancy sonography
Authors Wong HS
Received 17 September 2016
Accepted for publication 8 March 2017
Published 13 April 2017 Volume 2017:9 Pages 199—204
DOI https://doi.org/10.2147/IJWH.S122586
Checked for plagiarism Yes
Review by Single anonymous peer review
Peer reviewer comments 2
Editor who approved publication: Professor Elie Al-Chaer
Hong Soo Wong1,2
1Australian Women’s Ultrasound Centre, Brisbane, Queensland, Australia; 2Department of Paediatrics and Adolescent Medicine, The University of Hong Kong, Hong Kong
Objectives: To present the fetal measurements in relation to the foot length at 10–16 weeks gestation on antenatal ultrasound.
Materials and methods: We reviewed the fetal measurements in 47 scans performed at 10–16 weeks gestation in women attending routine antenatal care. The fetal measurements and measurement ratios were examined in relation to the foot length.
Results: The fetal biparietal diameter, head circumference, abdominal circumference, femur length and foot length increase linearly with the gestational age at 10–16 weeks gestation. The correlation between fetal foot length and fetal biparietal diameter, head circumference, abdominal circumference and femur length are better than with the crown rump length. The femur length to foot length ratio and the femur length to abdominal circumference ratios increase with the gestational age in an inverse relationship throughout the same period.
Conclusion: Fetal foot length is an accurate estimate of the gestational age in early pregnancy. Compared with crown rump length, the correlation between foot length and other fetal measurements is better. The fetal measurements ratios are gestational age dependent between 10–16 weeks. Gestational age specific ratio should be used in this period.
Keywords: obstetrics, pregnancy, first trimester, diagnosis, ultrasonography, prenatal, growth and development, statistics and numerical data
Introduction
Almost a century ago, a linear correlation was observed between gestational age (GA) and foot length (FT) in 704 human fetal specimens from around 50 days postconception until birth.1 The correlation has been confirmed by studies in utero,2–6 in abortus,6–8 or in stillborn,9,10 and in neonates to other measurements.11 Normograms for the first trimester and later gestation have been constructed for assessment of GA. However, there is less information on the correlation of fetal FT to the other parameters in the early part of pregnancy. This information may be helpful when fetal abnormality is suspected at an early gestation.12,13 In this paper, we explore the relationship of fetal FT with the other fetal measurements at 10–16 weeks gestation.
Materials and methods
During the period from March 7, 2014 to September 7, 2016, women attending an obstetric clinic with normal pregnancies were recruited. A transabdominal ultrasound scan was performed as a part of antenatal assessment (Accuvix V20 Prestige, Medison with 4–8 MHz volumetric transducer or EPIQ 7, Philips with X6-1 matrix transducer). Fetal measurements in millimeters were taken, including biparietal diameter (BPD), head circumference (HC), abdominal circumference (AC), femur length (FL) and FT. The crown rump length (CRL) was measured if the patient presented at <15 completed weeks of pregnancy. Cases were excluded if the entire foot could not be clearly visualized during the ultrasound examination. The fetal FT was taken as the longest distance from the most posterior point of the foot to the tip of the first or the second toe, whichever was longer (Figure 1). The estimated GA in weeks was calculated from the last normal menstrual period or from the first trimester dating scan if there was a discrepancy of more than a week. The ultrasound examination was performed as a part of routine antenatal assessment to the patients’ understanding. Therefore, no written consent was signed and the patients remained anonymous in the study. Although the fetal measurements were taken prospectively, this was a retrospective analysis involving negligible risk. It conformed to the standards established by the Australian Government National Health and Medical Research Council (NHMRC) not requiring ethical review (Clauses 2.1.7, 5.1.22, 5.1.23), and ethics approval was not sought within the institution.14
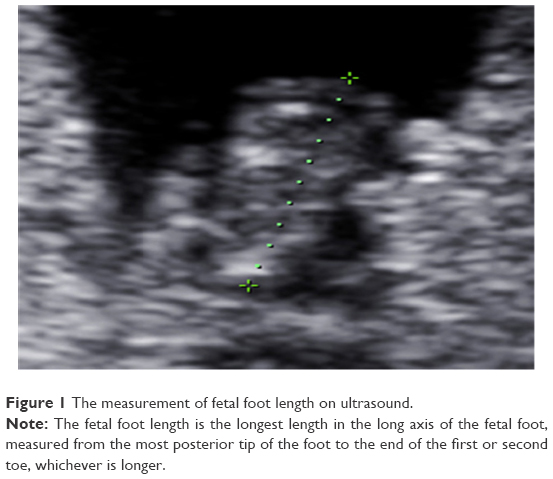 | Figure 1 The measurement of fetal foot length on ultrasound. |
Results were analyzed with Statistical Package for the Social Sciences version 17.0 (SPSS Inc., Chicago, IL, USA). A two-sided probability (P) value of <0.05 was considered statistically significant.
Results
Forty-seven women at 10–16 completed weeks of pregnancy were recruited. The mean and standard deviation of their age, gravidity and parity were 32.2±4.3 years, 2.3±1.5 and 0.7±0.7, respectively.
The fetal FT (mm) is plotted against the GA (weeks), as shown in Figure 2. The BPD, HC, AC, FL and CRL (mm) are plotted against FT in Figures 3–7, respectively. A linear relationship was observed between FT and BPD, HC, AC, FL and CRL (P<0.001). The graphs of fetal FL to FT ratio against the FT and the GA are shown in Figures 8 and 9, respectively. The graph of the ratio of FL to AC against the GA is shown in Figure 10. The regression models for Figures 2–7 are shown within the legend for each figure and are summarized in Table 1. The Pearson coefficient is 0.992 for intraobserver correlation (P<0.001) and 0.990 for interobserver correlation (P<0.001) in the measurement of fetal FT.
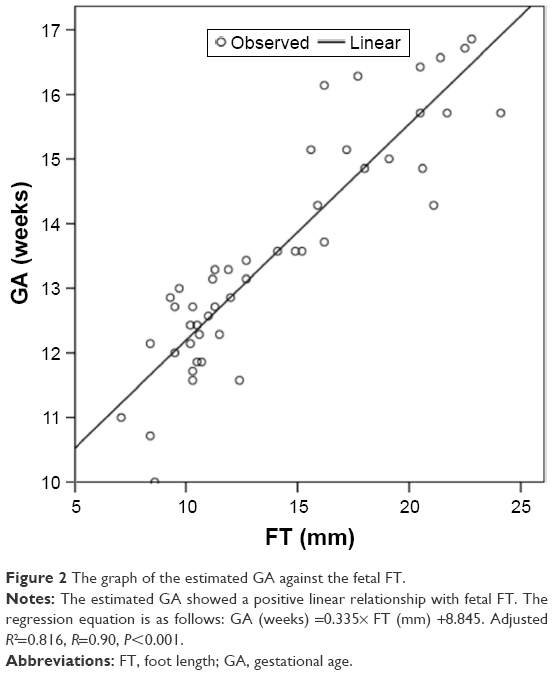 | Figure 2 The graph of the estimated GA against the fetal FT. |
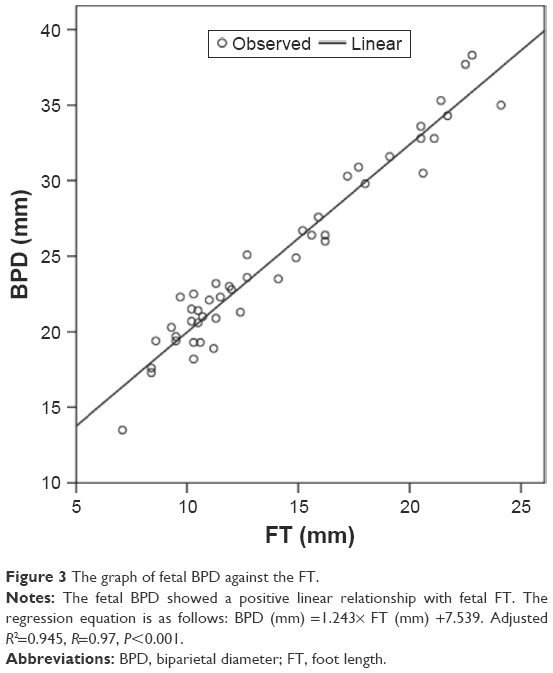 | Figure 3 The graph of fetal BPD against the FT. |
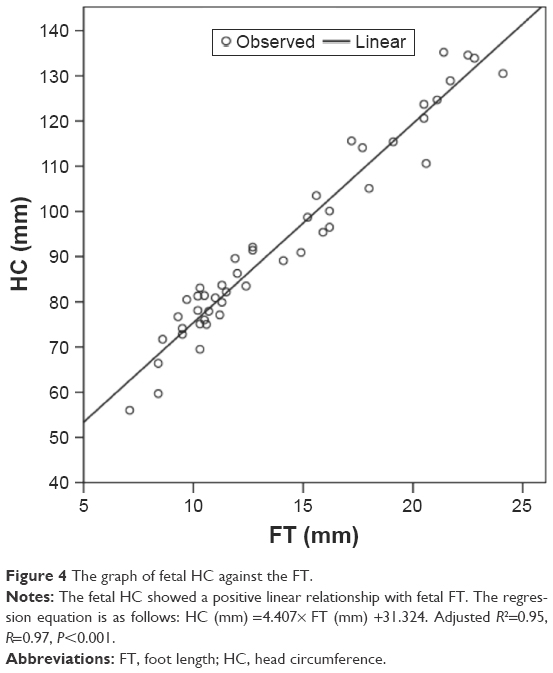 | Figure 4 The graph of fetal HC against the FT. |
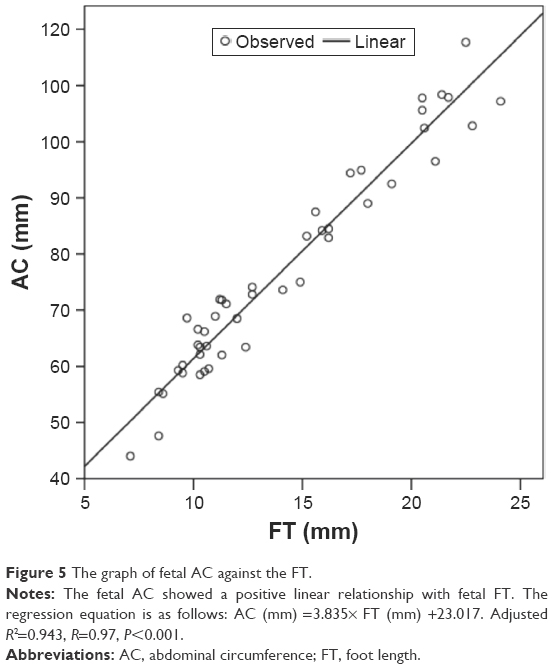 | Figure 5 The graph of fetal AC against the FT. |
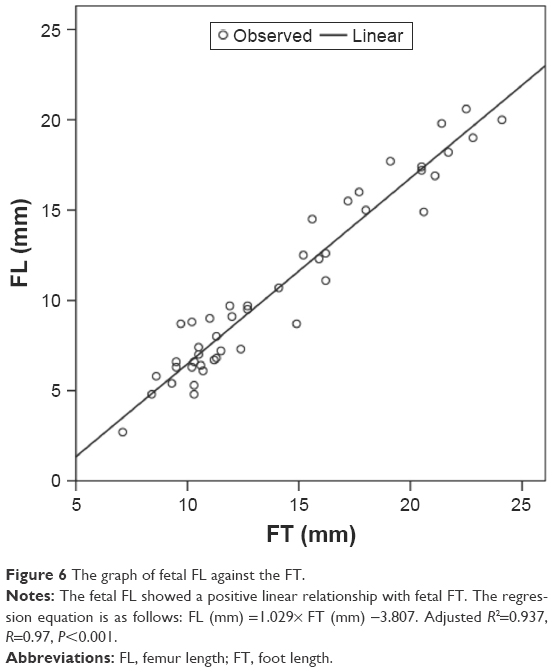 | Figure 6 The graph of fetal FL against the FT. |
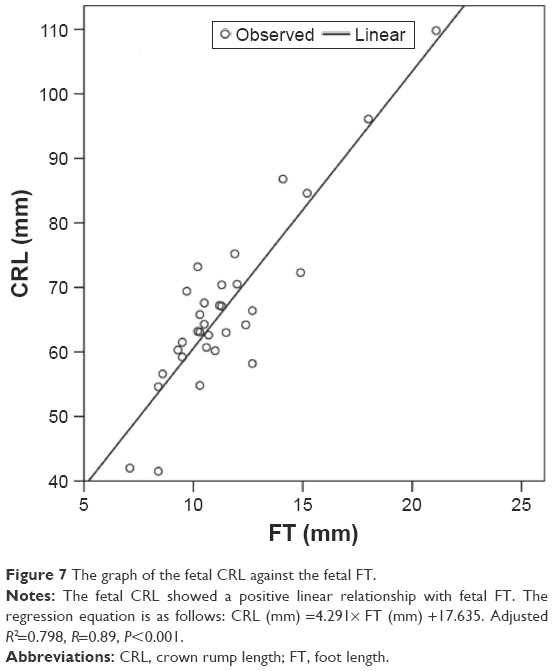 | Figure 7 The graph of the fetal CRL against the fetal FT. |
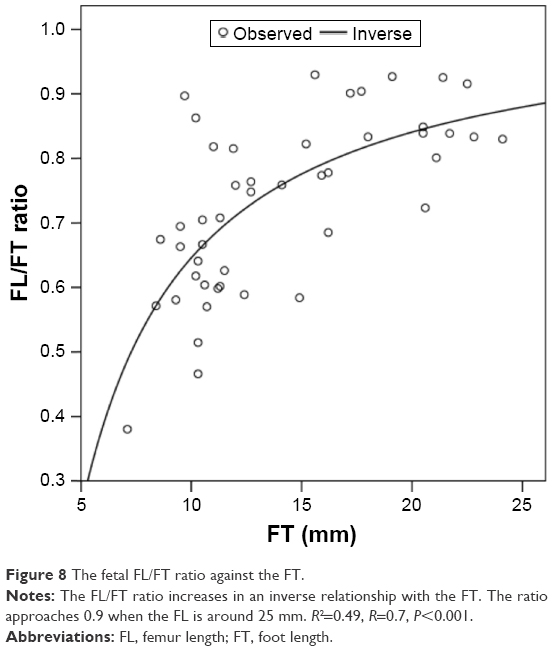 | Figure 8 The fetal FL/FT ratio against the FT. |
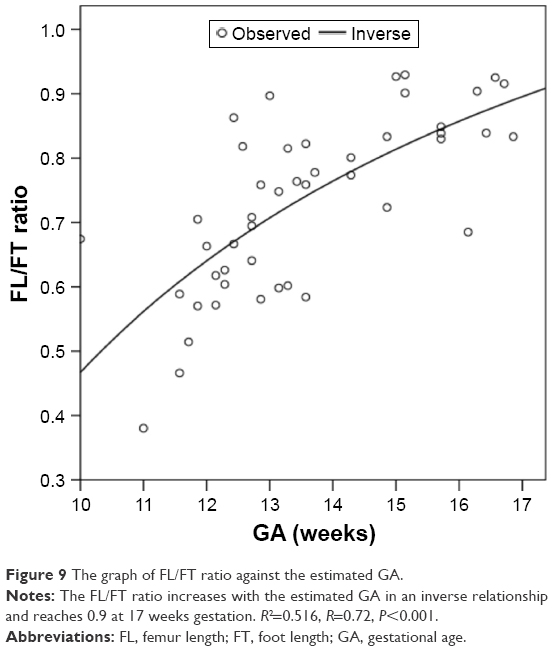 | Figure 9 The graph of FL/FT ratio against the estimated GA. |
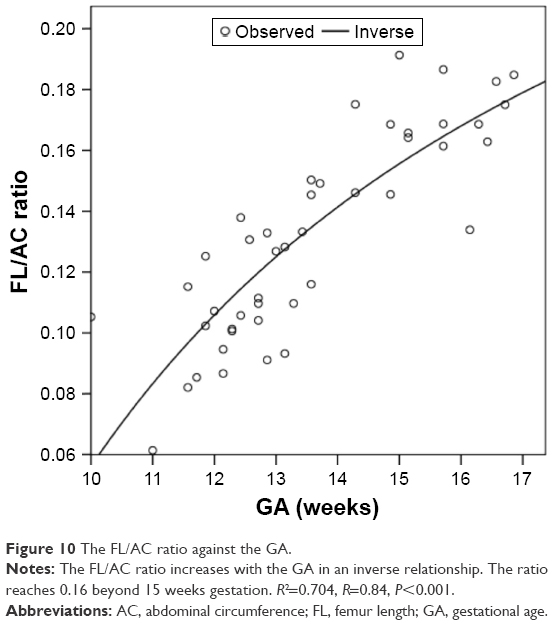 | Figure 10 The FL/AC ratio against the GA. |
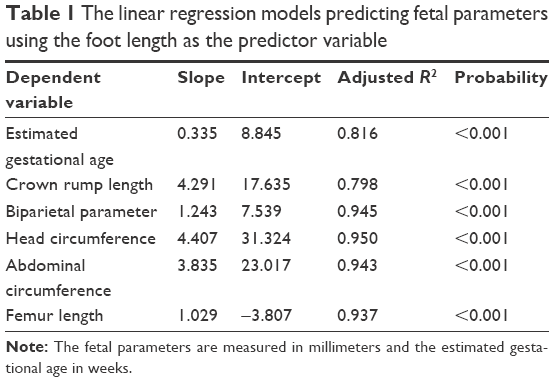 | Table 1 The linear regression models predicting fetal parameters using the foot length as the predictor variable |
Discussion
The fetal FT showed a linear correlation with GA, BPD, HC, AC, FL and CRL between 10 and 16 weeks gestation (P<0.001; Figures 2–7). The correlation was the highest with HC, with the adjusted R2 being 0.950, followed by BPD (0.945), AC (0.943), FL (0.937), GA (0.816) and was the least with CRL (0.798; Table 1). This is consistent with the histologic findings that the fetal FT bears a linear relationship with the GA, even at an earlier gestation.15 As fetal FT is noted to be independent of gender, environmental tobacco smoke, maternal smoking and alcohol consumption in human abortus up to 69 days postconception15 (or below 12 weeks by last normal menstrual period), it could be used to estimate the fetal GA, even at an early gestation, as observed in previous studies.1,2,8
The GA could be estimated from the FT by the following equation (Figure 2; Table 1):
GA =0.335× FT +8.845 (adjusted R2=0.816, P<0.001)
Among all fetal parameters measured in our study, the correlation was the best between the fetal FT and HC. The HC could be estimated from the FT measurement by the following equation (Figure 4; Table 1):
HC =4.407× FL +31.324 (adjusted R2=0.950, P<0.001)
All the fetal measurements are in millimeters and the estimated GA is in weeks.
In our study, CRL, though showing a linear correlation with the fetal FT, had the least correlation with the fetal FT among the measured fetal parameters (Table 1). There was a wider scatter compared with the other measurements (Figure 7). It is known that there could be variation of CRL measurement as a result of fetal flexion or extension. Although, in current practice, CRL is commonly used to assess the GA in early pregnancy, a combination with other parameters, for example, BPD, HC or FT, could be helpful in increasing the accuracy.
Nowadays, more and more fetal abnormalities could be detected in an early gestation. The fetal FL to FT ratio of 1 is often used in prenatal diagnosis of fetal skeletal dysplasia.16 In this study, the fetal FL to FT ratio increased with the FT (Figure 8) or the GA (Figure 9) in an inverse relationship (R2=0.49, P<0.001 and R2=0.516, P<0.001, respectively). It approached 0.9 when the FT was around 25 mm (Figure 8) or beyond 17 weeks gestation (Figure 9). Therefore, one would have to refer to the GA-related FL to FT ratio when fetal abnormality is suspected in early gestation (eg, Down syndrome17 or skeletal dysplasia13), instead of using a uniform figure of 1 which researchers have established for later gestation.18
The FL to AC ratio, a parameter also used for prenatal assessment of skeletal dysplasia,13 was found to increase with the GA in early pregnancy in this study as well, and reached 0.16 only beyond 15 weeks gestation (Figure 10).
Limitations
The main limitation of this study is the small sample size. However, the correlation of the parameters was statistically highly significant (P<0.001). Our results also correlated well with the results of other studies.3,15 This is a retrospective analysis, although the data have been collected prospectively.
Conclusion
The fetal FT correlated linearly with other fetal measurements including BPD, HC, AC, FL, CRL and estimated GA at 10–16 weeks gestation. It could be used alone or in combination with other fetal parameters for assessment of fetal GA. The correlation with CRL is the least among the fetal measurements. A combination of fetal parameters may be better than CRL alone in the assessment of fetal GA in early pregnancy. Caution is required when using the FL to FT ratio and FL to AC ratio for the assessment of fetal abnormality in this period, as these are not of a fixed value but rather increase with the GA.
Disclosure
The author reports no conflicts of interest in this work.
References
Streeter GL. Weight, sitting height, head size, foot length, and menstrual age of the human embryo. Contrib Embryol Carnegie Inst. 1920;11:143. | ||
Mercer BM, Sklar S, Shariatmadar A, Gillieson MS, D’Alton ME. Fetal foot length as a predictor of gestational age. Am J Obstet Gynecol. 1987;156(2):350–355. | ||
Platt LD, Medearis AL, DeVore GR, Horenstein JM, Carlson DE, Brar HS. Fetal foot length: relationship to menstrual age and fetal measurements in the second trimester. Obstet Gynecol. 1988;71(4):526–531. | ||
Goldstein I, Reece EA, Hobbins JC. Sonographic appearance of the fetal heel ossification centers and foot length measurements provide independent markers for gestational age estimation. Am J Obstet Gynecol. 1988;159(4):923–926. | ||
Kustermann A, Zorzoli A, Spagnolo D, Nicolini U. Transvaginal sonography for fetal measurement in early pregnancy. Br J Obstet Gynaecol. 1992;99(1):38–42. | ||
Manjunata BN, Nithin MD, Sameer S. Cross sectional study to determine gestational age by metrical measurements of foot length. Egypt J Forensic Sci. 2012;2(1):11–17. | ||
Croft MS, Desai G, Seed PT, Pollard JI, Perry ME. Application of obstetric ultrasound to determine the most suitable parameters for the aging of formalin-fixed human fetuses using manual measurements. Clin Anat. 1999;12(2):84–93. | ||
Hern WM. Correlation of fetal age and measurements between 10 and 26 weeks of gestation. Obstet Gynecol. 1984;63(1):26–32. | ||
Conway DL, Hansen NI, Dudley DJ, et al. An algorithm for the estimation of gestational age at the time of fetal death. Paediatr Perinat Epidemiol. 2013;27(2):145–157. | ||
Hirst JE, Ha LT, Jeffery HE. The use of fetal foot length to determine stillborn gestational age in Vietnam. Int J Gynaecol Obstet. 2012;116(1):22–25. | ||
Embleton ND, Deshpande SA, Scott D, Wright C, Milligan DW. Foot length, an accurate predictor of nasotracheal tube length in neonates. Arch Dis Child Fetal Neonatal Ed. 2001;85(1):F60–F64. | ||
Khalil A, Pajkrt E, Chitty LS. Early prenatal diagnosis of skeletal anomalies. Prenat Diagn. 2011;31(1):115–124. | ||
Schramm T, Gloning KP, Minderer S, et al. Prenatal sonographic diagnosis of skeletal dysplasias. Ultrasound Obstet Gynecol. 2009;34(2):160–170. | ||
Australian Government National Health and Medical Research Council. National statement on ethical conduct in human research, 2007 [Updated May 2015]. | ||
Lutterodt MC, Rosendahl M, Yding Andersen C, Skouby SO, Byskov AG. Age determination enhanced by embryonic foot bud and foot plate measurements in relation to Carnegie stages, and the influence of maternal cigarette smoking. Hum Reprod. 2009;24(8):1825–1833. | ||
Krakow D, Lachman RS, Rimoin DL. Guidelines for the prenatal diagnosis of fetal skeletal dysplasia. Genet Med. 2009;11(2):127–133. | ||
Grandjean H, Sarramon MF. Femur/foot length ratio for detection of Down syndrome: results of a multicenter prospective study. The Association Francaise pour le Depistage et la Prevention des Handicaps de I’Enfant Study Group. Am J Obstet Gynecol. 1995;173(1):16–19. | ||
Campbell J, Henderson A, Campbell S. The fetal femur/foot length ratio: a new parameter to assess dysplastic limb reduction. Obstet Gynecol. 1988;72(2):181–184. |
 © 2017 The Author(s). This work is published and licensed by Dove Medical Press Limited. The full terms of this license are available at https://www.dovepress.com/terms.php and incorporate the Creative Commons Attribution - Non Commercial (unported, v3.0) License.
By accessing the work you hereby accept the Terms. Non-commercial uses of the work are permitted without any further permission from Dove Medical Press Limited, provided the work is properly attributed. For permission for commercial use of this work, please see paragraphs 4.2 and 5 of our Terms.
© 2017 The Author(s). This work is published and licensed by Dove Medical Press Limited. The full terms of this license are available at https://www.dovepress.com/terms.php and incorporate the Creative Commons Attribution - Non Commercial (unported, v3.0) License.
By accessing the work you hereby accept the Terms. Non-commercial uses of the work are permitted without any further permission from Dove Medical Press Limited, provided the work is properly attributed. For permission for commercial use of this work, please see paragraphs 4.2 and 5 of our Terms.