")
Back to Journals » International Journal of Nanomedicine » Volume 11
A reduced graphene oxide-based fluorescence resonance energy transfer sensor for highly sensitive detection of matrix metalloproteinase 2
Received 15 December 2015
Accepted for publication 7 February 2016
Published 15 April 2016 Volume 2016:11 Pages 1537—1547
DOI https://doi.org/10.2147/IJN.S102517
Checked for plagiarism Yes
Review by Single anonymous peer review
Peer reviewer comments 2
Editor who approved publication: Professor Lei Yang
Gaina Xi,1 Xiaoping Wang,2 Tongsheng Chen1
1MOE Key Laboratory of Laser Life Science & College of Biophotonics, South China Normal University, 2Department of Pain Management, The First Affiliated Hospital of Jinan University, Guangzhou, People’s Republic of China
Abstract: A novel fluorescence nanoprobe (reduced nano-graphene oxide [nrGO]/fluorescein isothiocyanate-labeled peptide [Pep-FITC]) for ultrasensitive detection of matrix metalloproteinase 2 (MMP2) has been developed by engineering the Pep-FITC comprising the specific MMP2 substrate domain (PLGVR) onto the surface of nrGO particles through non-covalent linkage. The nrGO was obtained by water bathing nano-graphene oxide under 90°C for 4 hours. After mixing the nrGO and Pep-FITC for 30 seconds, the fluorescence from Pep-FITC was almost completely quenched due to the fluorescence resonance energy transfer between fluorescein isothiocyanate (FITC) and nrGO. Upon cleavage of the amide bond between Leu and Gly in the Pep-FITC by protease-MMP2, the FITC bound to nrGO was separated from nrGO surface, disrupting the fluorescence resonance energy transfer process and resulting in fluorescence recovery of FITC. Under optimal conditions, the fluorescence recovery of nrGO/Pep-FITC was found to be directly proportional to the concentration of MMP2 within 0.02–0.1 nM. The detection limit of the nrGO/Pep-FITC was determined to be 3 pM, which is approximately tenfold lower than that of the unreduced carboxylated nano-graphene oxide/Pep-FITC probe.
Keywords: graphene oxide, reduction, high sensitive detection, fluorescence
Introduction
Matrix metalloproteinases (MMPs) are a family of zinc-dependent endoproteases capable of degrading virtually all kinds of extracellular matrix and basement membrane components.1 MMPs target substrates, including proteinases, proteinase inhibitors, clotting factors, cell–cell adhesion molecules, chemotactic molecules, latent growth factors, growth factor-binding proteins, and cell surface receptors.2 MMPs were also found to interfere with the induction of apoptosis in malignant cells, especially after chemotherapy, by cleaving Fas ligand from the surface of cancer cells with MMP7.3 Tumors are highly vascularized tissues, and the formation of new blood vessels can be triggered by the release of vascular endothelial growth factor that is mainly facilitated by MMP2 and MMP9.4 In addition, degradation of extracellular matrix components and other extracellular molecules by MMPs may generate fragments with new bioactivities inhibiting angiogenesis.5 For example, it was reported that degradation of plasminogen by MMP2, MMP9, and MMP12 produced significant amounts of angiostatin, a cleavage product with antiangiogenic function.6,7
Sensitive, rapid, and accurate detection of MMPs is of great significance for clinical disease diagnosis, therapy, and MMP inhibitors screening. High levels of MMPs have been observed in the serum/blood,8,9 saliva,10 and urine11 of patients with cancers, and in the plasma of patients with diabetes12 or hypertensions.13 Gelatin zymography is a qualitative MMPs detection method.14 Enzyme-linked immunosorbent assay, a conventional and most widely used method in clinical assay, is very sensitive, but the antibody proteins are expensive and difficult to be acquired. In addition, enzyme-linked immunosorbent assay method needs tedious separation operations with at least 5 hours to detect the activity of MMPs.15 Fluorescence resonance energy transfer (FRET) refers to the energy transfer between donor and acceptor fluorophores within 1–10 nm distance range, and the rate of this long-range resonance energy transfer was suggested to have a (distance)−6 dependence.16 Therefore, many FRET-based sensors have been developed for sensitive and rapid detection of MMPs17,18 and other trace molecules.19
Graphene oxide (GO), a novel one-atom-thick two-dimensional carbon material, has been demonstrated to be a remarkable FRET acceptor for various fluorescent dyes owing to the excellent ability for absorbing visible light.19–22 Many kinds of GO-based FRET sensors have been developed for sensitive MMP2 detection.23–25 Reduced graphene oxide (rGO) is a more effective quencher due to the higher ability to absorb visible light over GO.26–28 There are many ways to prepare rGO by using strong alkaline, alcohols, natural extracts, or overheated supercritical water in sealed container as reductant.29–32 We recently bathed covalently PEGylated nano-graphene oxide (nGO-PEG, here “PEG” means polyethylene glycol) in pure water under 90°C for 24 hours to obtain the reduced nGO-PEG that had an ~7.6-fold increment in near-infrared (NIR) absorption at 808 nm over nGO-PEG and was stable for >3 months under 4°C.33,34
In this study, we developed a reduced nano-graphene oxide (nrGO)-based FRET sensor (nrGO/fluorescein isothiocyanate-labeled peptide [Pep-FITC]) for highly sensitive MMP2 detection. As illustrated in Figure 1, the functionalized nrGO/Pep-FITC sensor was prepared by non-covalent binding of Pep-FITC (H2N-PEG-CALNNGPLGVRGRAK-FITC) containing the core cleavage substrate sequence (PLGVR) of MMP225 to nrGO that was reduced by bathing carboxylated nano-graphene oxide (c-nGO) in water at 90°C for 4 hours. The nrGO/Pep-FITC sensor was able to quantitatively detect the concentration of MMP2 in the range of 0.02–0.1 nM. The detection limit of the nrGO/Pep-FITC was determined to be 3 pM, which is approximately tenfold lower than that of the c-nGO/Pep-FITC probe. To the best of our knowledge, this is the first report on an nrGO-based biosensing platform for analyzing MMP2.
 | Figure 1 Strategy of nrGO/Pep-FITC probe for MMP2 detection. |
Materials and methods
Chemicals and materials
Pep-FITC (H2N-PEG-CALNNGPLGVRGRAK-FITC) was synthesized by Shanghai ABBiochem Co, Ltd (Shanghai, People’s Republic of China). Graphite powder was purchased from Nanjing XFNano Materials Tech Co, Ltd (Nanjing, People’s Republic of China). Latent proMMP2 was purchased from Sino Biological Inc Co, Ltd (Beijing, People’s Republic of China). 4-Aminophenylmercuric acetate (APMA), 1,10-phenanthroline, and dimethyl sulfoxide were purchased from Sigma-Aldrich (St Louis, MO, USA). Other reagents employed were all of analytical grade, and were used without further purification. All the buffers were prepared with tri-distilled water, which was purified with a water purification system (ELGA; High Wycombe, Bucks, UK) to a specific resistance of 18.2 MΩ·cm.
Synthesis of c-nGO and nrGO
GO was prepared by a modified Hummer’s method utilizing expandable graphite flake.35,36 GO was sonicated with Ultrasonic Cell Crusher (JY92-2D; Xinzhi Ultrasonic Equipment Co, Ningbo, People’s Republic of China) for 1.5 hours to give a clear solution in an ice bath to obtain nano-graphene oxide (nGO) suspension. c-nGO was obtained by the reaction with NaOH (1.2 g) and ClCH2COOH (1 g) for 0.5 hour following the known procedure.37
c-nGO solution (~1 mg/mL) was transferred to a sealed glass bottle and then bathed at 90°C for 4 or 12 hours to get nrGO (nrGO [4 h] or nrGO [12 h]).
Characterizations
The hydrodynamic diameters and ζ-potentials of nGO, c-nGO, nrGO (4 h), and nrGO (12 h) were measured by Zetasizer Nano ZS (Malvern Instruments Ltd, Malvern, UK). The materials were imaged with tapping mode atomic force microscope (OLTESPA probe, Bruker Dimension Icon; Bruker, Ettlingen, Germany) on a mica substrate. The images of all samples were recorded using a digital camera (Nikon, Tokyo, Japan) with 1,280×1,280 pixels resolution. Ultraviolet–visible (UV–vis) spectra were obtained by a UV–vis spectrometer (Lambda 35; PerkinElmer, Waltham, MA, USA) with a 1 cm quartz cuvette. Fourier transfer infrared (FTIR) spectra were recorded on a Nicolet 6700 FTIR spectrometer (Thermo Fisher Scientific, Waltham, MA, USA). Raman spectra were taken with a Renishaw (Wotton-under-Edge, UK) inVia micro-Raman spectroscopy system equipped with a 514.5 nm Ar+ laser. X-ray diffraction spectra were obtained using a D8 ADVANCE (Bruker) using Cu Kα (1.5406 Å) radiation. Luminescence Spectrometer (LS 55; PerkinElmer) was used to measure fluorescence emission. The excitation wavelength and emission wavelength were 480 and 518 nm, respectively. Both the excitation and emission slits were set at 10 nm.
Preparation of c-nGO/Pep-FITC and nrGO/Pep-FITC sensors
Unless otherwise noted, nrGO/Pep-FITC sensor was prepared by treating the Pep-FITC (100 nM) with nrGO (1 μg/mL) in the TCNB (50 mM Tris, 10 mM CaCl2, 150 mM NaCl, and 0.05% Brij 35; pH 7.5) buffer. c-nGO/Pep-FITC was prepared as described for the nrGO/Pep-FITC.
Detection of MMP2 with c-nGO/Pep-FITC and nrGO/Pep-FITC sensors
Before detection, latent proMMP2 was first activated with APMA according to the known procedure.38 MMP2 in TCNB buffer was added with 1 mM APMA (final concentration), and the mixture was incubated in heating thermostat blender (LTH-100; Shanghai LNB Instrument Co, Ltd, Shanghai, People’s Republic of China) at 37°C for 1 hour with gentle shaking.
In an Eppendorf tube loaded with 100 nM c-nGO/Pep-FITC or nrGO/Pep-FITC (final concentration), 1 μg/mL of activated MMP2 was added, and the mixtures were incubated at 37°C with gentle shaking for 2 hours, and fluorescence intensity of each sample was then recorded with λex/em =480/518 nm.
Results and discussion
Preparation and characterization of nrGO
The hydrodynamic sizes of nGO, c-nGO, nrGO (4 h), and nrGO (12 h) nanoparticles were firstly analyzed by dynamic light scattering (DLS). In order to assess the effect of bathing time on GO reduction degree, we bathed GO under 90°C for 4 and 12 hours. As shown in Figure 2A, the DLS hydrodynamic diameter of nGO, c-nGO, nrGO (4 h), and nrGO (12 h) was holding ~50, 50, 50, and 120 nm, respectively, during 1 month. We next used atomic force microscopy (AFM) images to further measure the diameters of the nGO, c-nGO, nrGO (4 h), and nrGO (12 h) nanoparticles. AFM data showed sheets of ~80 nm diameter (assuming that these are in round shape) for nGO, c-nGO, nrGO (4 h), and nrGO (12 h), and the sheet thickness of nGO, c-nGO, nrGO (4 h), and nrGO (12 h) was ~1.5 nm (Figure 2B and C). Difference between AFM size and DLS hydrodynamic size may be due to the sheet-like structures of GO and rGO.
 | Figure 2 Size of nano-materials. |
It is well known that the edges of nGO or/and some parts of its basal plane are terminated by hydrogen, hydroxyl, carboxylic, and epoxy groups.39 Reduction reaction is unable to remove all oxygen groups of nGO, and the residual negatively charged oxygen functional groups allow nrGO solution to be dispersed well in water due to electrostatic repulsion mechanism,40,41 which may be the reason why the sizes of nrGO remain stable during 1 month at 4°C (Figure 2A). This view was further confirmed by the stable ζ-potential values (~−40 mV) of the nGO, c-nGO, nrGO (4 h), and nrGO (12 h) during 1 month (Figure 3A). The stable diameter and ζ-potential demonstrated that the nGO, c-nGO, nrGO (4 h), and nrGO (12 h) solutions were very stable at 4°C during at least a month, which was also further verified by the stable images of nGO, c-nGO, nrGO (4 h), and nrGO (12 h) (Figure 3B). The suspension remained clear under the same conditions. Moreover, the color of nGO, c-nGO, nrGO (4 h), and nrGO (12 h) solutions changed from brown to yellowish brown, dark brown, and black brown (Figure 3B), an evidence for the reduction of nGO. Furthermore, UV–vis spectrometer was used to detect the UV–vis spectra of nGO, c-nGO, nrGO (4 h), and nrGO (12 h). As shown in Figure 3C, nGO had a strong optical absorption peak at 228 nm and a weak shoulder at 300 nm. Compared with nGO, c-nGO exhibited higher absorbance at long wavelength (>300 nm), probably due to the partial and slight reduction of nGO under strong alkaline conditions.29 Compared with c-nGO, nrGO (4 h) and nrGO (12 h) exhibited ~4.29- and 6.88-fold increment in NIR absorption at 808 nm (Figure 3C), which further verified the degree of reduction. Moreover, the absorption peak (226.5 nm) of c-nGO corresponding to π→π* transitions of aromatic C=C bonds red-shifted to ~235.5 and 249.5 nm for nrGO (4 h) and nrGO (12 h), respectively, and the shoulder peak (300 nm) nearly disappeared for both nrGO (4 h) and nrGO (12 h), indicating partial restoration of the π-conjugation network of GO carbon structure and the effect of deoxygenation.42
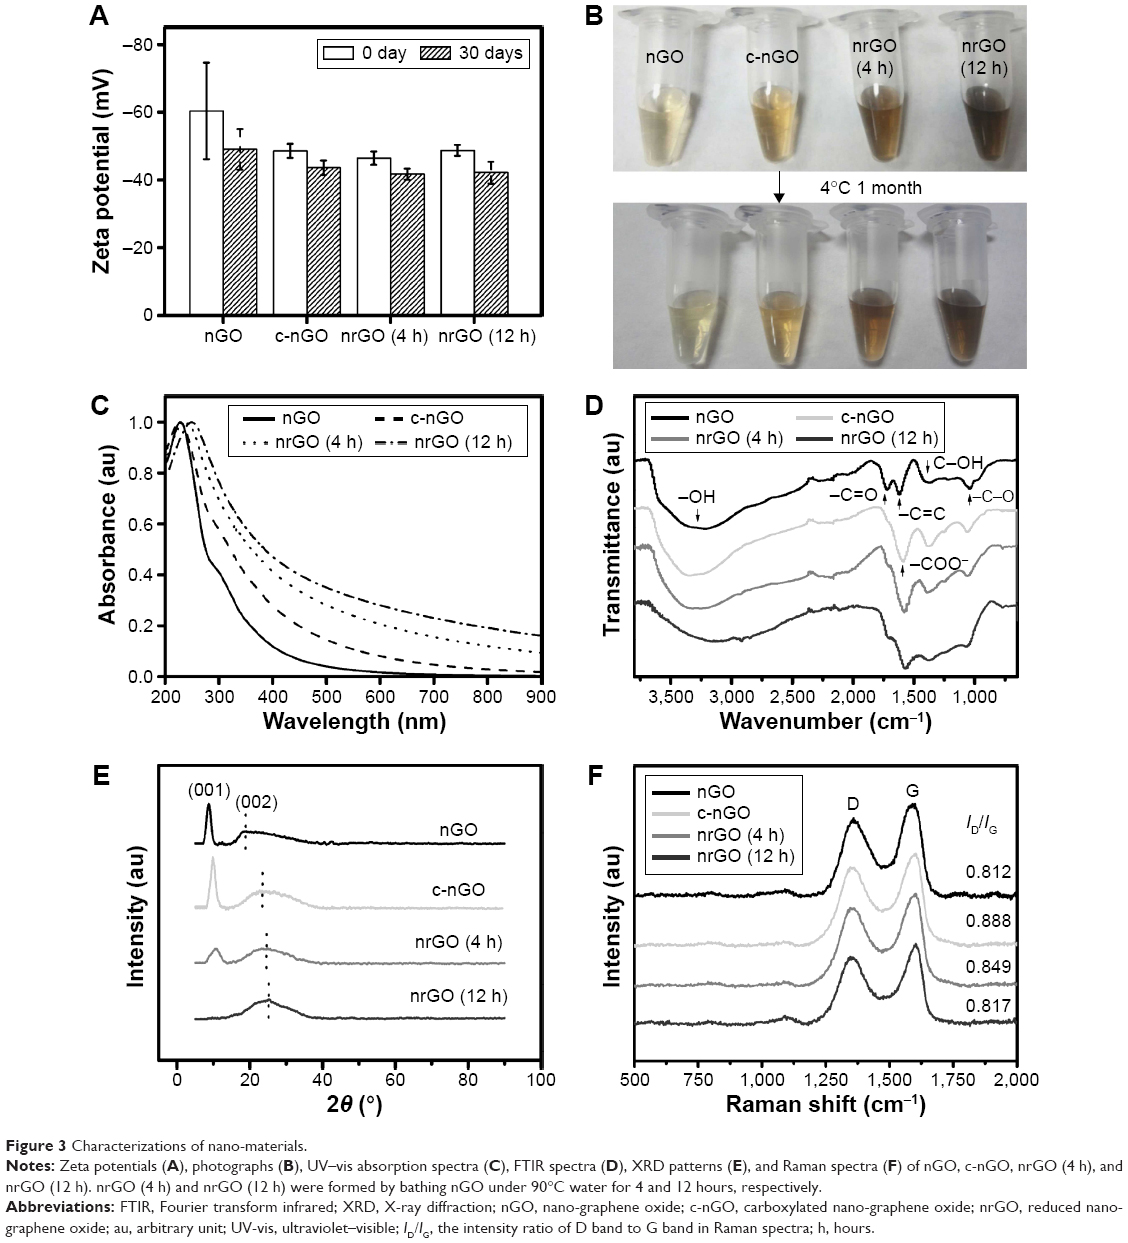 | Figure 3 Characterizations of nano-materials. |
FTIR spectroscopy revealed the existence of OH (~3,400 cm−1), C=O (~1,720 cm−1), C=C (~1,620 cm−1), C–OH (~1,380 cm−1), and C–O (~1,060 cm−1) functional groups in the nGO (Figure 3D),43 which indicated that the abundant oxygen-containing moieties were present on nGO surfaces. We activated nGO sample with chloroacetic acid under strongly basic conditions in order to activate epoxide and ester groups, and to convert hydroxyl groups to carboxylic acid moieties.44 This c-nGO having good water solubility and more carboxylic acid groups exhibited the characteristic peak of ~1,600 cm−1 for carboxyl groups (–COO–).25 After water-bathing treatment, the FTIR spectra of nrGO (4h) and nrGO (12h) were similar to that of c-nGO, indicating similar structure of the reduced graphene material with the c-nGO.
As shown in the X-ray diffraction patterns (Figure 3E), the d-spacing of sharp feature peak (001) was 1.01 nm (at 8.74°) for nGO, 0.89 nm (at 9.84°) for c-nGO, 0.86 nm (at 10.25°) for nrGO (4 h), and disappeared for nrGO (12 h), which indicated that most of the oxygen functional groups, having marked effects on the d-spacing, had been reduced in this condition. The d-spacing of sharp feature peak (002) was 0.48 nm (at 18.22°) for nGO, 0.39 nm (at 22.46°) for c-nGO, 0.37 nm (at 23.40°) for nrGO (4 h), and 0.36 nm (at 24.38°) for nrGO (12 h), further confirming the gradual reduction of c-nGO with increasing water bath-treated times at 90°C.45
Raman spectroscopy was used to characterize nGO, c-nGO, nrGO (4 h), or nrGO (12 h) (Figure 3F). The typical features in Raman spectra are the G band at 1,600 cm−1 and the D band at 1,350 cm−1. The G band is usually assigned to the E2g phonon of C sp2 atoms, while the prominent D band is an indication of disorder corresponding to defects associated with vacancies, grain boundaries, and amorphous carbon species.34 The intensity ratio (ID/IG) of D band to G band was ~0.812 for nGO, 0.888 for c-nGO, 0.849 for nrGO (4 h), and 0.817 for nrGO (12 h). Compared with nGO, c-nGO had larger ID/IG value. However, the ID/IG value of nrGO (4 h) or nrGO (12 h) was lower than that of c-nGO, suggesting that the reduction reaction in this facile and green reduction strategy developed here was able to recover the aromatic structures by repairing defects.
Preparation and optimization of nrGO/Pep-FITC sensors
nrGO/Pep-FITC sensor was prepared by treating Pep-FITC (100 nM) with nrGO (1 μg/mL) in TCNB buffer, and c-nGO/Pep-FITC served as a control. The binding of biomolecules to GO is generally through π–π and electrostatic interactions,46 and thus, the electrically charged nature of c-nGO and nrGO needs to be examined. As shown in Figure 3B, the ζ-potential values of the c-nGO, nrGO (4 h), and nrGO (12 h) were ~−40 mV, indicating that c-nGO, nrGO (4 h), and nrGO (12 h) were negatively charged. The pI value of our peptide calculated by ProtParam47 was 11.3, so the peptide (Pep-FITC) would be positively charged at physiological pH of ~7.24 In addition, the left side of the peptide chain was linked with PEG-NH2, which was more conducive to the formation of the probes. In order to optimize the amount of nrGO or c-nGO as nanoquencher, different volumes of c-nGO, nrGO (4 h), or nrGO (12 h) solution (0.1 mg/mL) were mixed with Pep-FITC (100 nM) in TCNB buffer, and the fluorescence intensity of the solution was measured after incubation for 10 minutes. We found that the fluorescence-quenching efficiency (QE [%] =100× [1−β], where β is the ratio of fluorescence of the quenched-to-completely dequenched state) of Pep-FITC gradually increased along with the increasing concentration of c-nGO, nrGO (4 h), and nrGO (12 h), and the QE value was 72.82%, 90.18%, and 92.91% for 1 μg/mL of c-nGO, nrGO (4 h), and nrGO (12 h), respectively (Figure 4A). The higher QE of nrGO over the unreduced c-nGO is due to the higher ability of nrGO to absorb visible light. Compared with c-nGO, nrGO showed a significant increment in NIR absorption (Figure 3C), leading to a bigger overlap area between the absorption spectrum of nrGO, the acceptor here, and the emission spectrum of the donor-FITC, and increasing the fluorescence-quenching efficiency of nrGO. Since there was no significant difference in the fluorescence-quenching ability between nrGO (12 h) and nrGO (4 h) (Figure 4A), we chose nrGO (4 h) as nrGO for following test without indication.
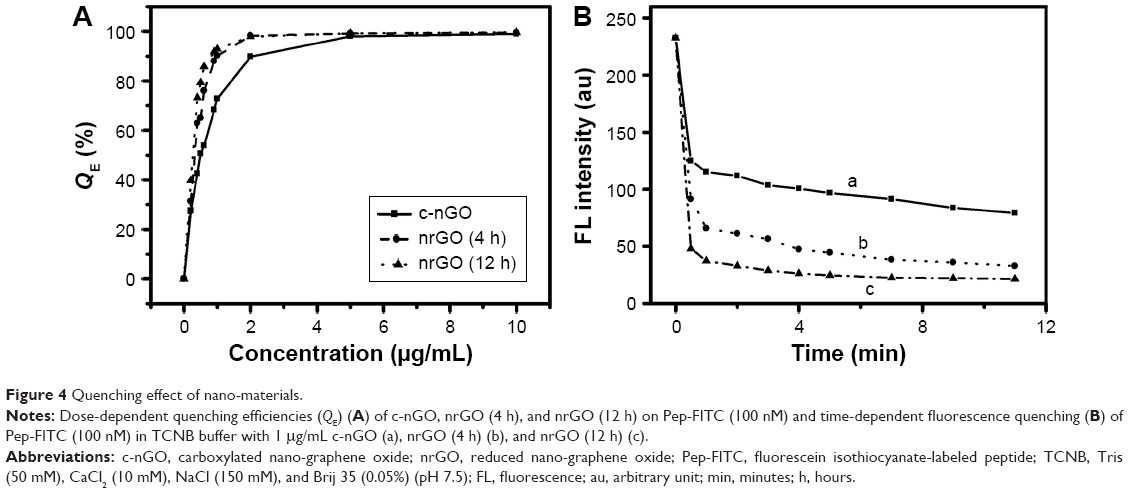 | Figure 4 Quenching effect of nano-materials. |
We next investigated time dependence of the fluorescence quenching between nrGO and Pep-FITC. The fluorescence intensity (λex/em =480/518 nm) of nanoprobes during preparation was monitored as a function of time using microplate reader (Infinite M200; Tecan, Männedorf, Switzerland). The fluorescence quenching of Pep-FITC by nrGO was very fast (<30 seconds) after adding nrGO (1 mg/mL) to the Pep-FITC solution (100 nM), and the quenched fluorescence remained quite stable thereafter (Figure 4B), indicating that the binding equilibrium between nrGO and Pep-FITC was achieved immediately, ensuring a constant background for the subsequent MMP2 sensing.
Detection of MMP2 using nrGO/Pep-FITC sensor
We first examined the principle of nrGO/Pep-FITC for MMP2 detection. The fluorescence spectrum of c-nGO/Pep-FITC sensors (100 nM) after adding the target MMP2, activated with APMA according to the known procedure,38 was obviously enhanced (Figure 5, curve b compared with curve a). However, the enhanced fluorescence spectrum of c-nGO/Pep-FITC sensors after adding the mixture of MMP2 (1.4 nM) and 10 μM 1,10-phenanthroline, a broad-spectrum inhibitor of MMPs, was largely abolished (Figure 5, curve d compared with b), indicating that the MMPs inhibitor inhibited MMP2 activation largely. We further assessed the effect of the inhibitor on the fluorescence intensity, and found that there was hardly any change in the fluorescence intensity of c-nGO/Pep-FITC (Figure 5, curve a and c) or free Pep-FITC (Figure 6) before and after adding the inhibitor, suggesting that the inhibitor had no direct effect on the fluorescence intensity of the sensor or free FITC. These data demonstrated that fluorescence recovery of the c-nGO/Pep-FITC sensor in the presence of MMP2 was due to the cleavage of the peptide by the activated MMP2.
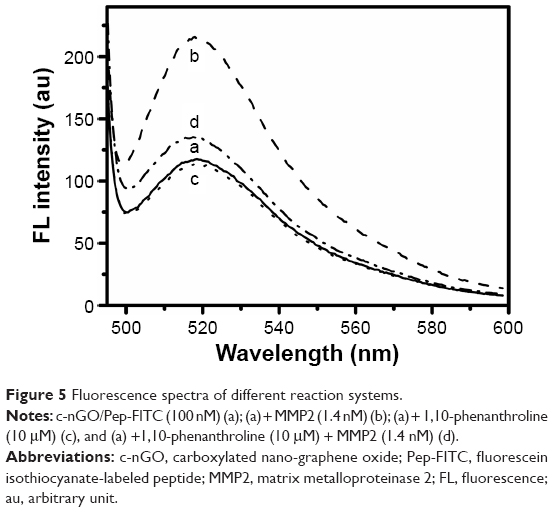 | Figure 5 Fluorescence spectra of different reaction systems. |
 | Figure 6 Effect of additional MMP2 inhibitor (1,10-phenanthroline) on the FITC fluorescence intensity. |
Before we applied the nrGO/Pep-FITC sensor to detect the protease activities of MMP2, the reaction time for the detecting system was optimized. After adding MMP2 (0.28 nM), the fluorescence intensity of nrGO/Pep-FITC sensor (100 nM) increased gradually along with the cleavage time until it reached a plateau at 2 hours under 37°C in TCNB buffer (Figure 7). We thus chose 2 hours for the following detection.
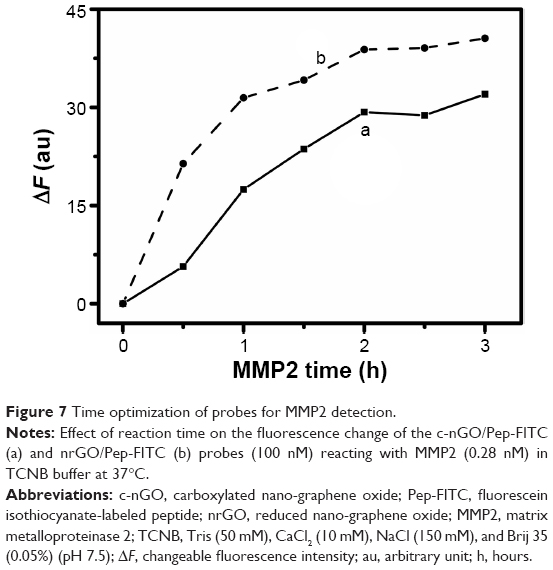 | Figure 7 Time optimization of probes for MMP2 detection. |
After mixing 100 nM nrGO/Pep-FITC with MMP2 at 37°C for 2 hours with gentle shaking, we detected the enhanced fluorescence intensity ΔF (ΔF = F–F0, where F and F0 stand for the fluorescence intensity of nrGO/Pep-FITC sensor after and before reacting with MMP2, respectively) of nrGO/Pep-FITC sensor in the presence of various concentrations (0–1.4 nM) of MMP2. As shown in Figure 8A, the fluorescence recovery of FITC was dependent on the concentration of MMP2 introduced. Moreover, the enhanced fluorescence intensity ΔF was linearly correlated with the MMP2 concentration in the range of 0.02–0.1 nM (inset in Figure 8A). The detection limit (3S/m, in which S is the standard deviation of blank measurements, n=10, and m is the slope of the linear equation)24 of the nrGO/Pep-FITC was determined to be 3 pM, which is approximately tenfold lower than that of the c-nGO/Pep-FITC probe (Figure 8B), attributing to the higher ability of nrGO to absorb visible light (Figure 3C). The 3 pM detection limit of nrGO/Pep-FITC for MMP2 is at least elevenfold lower than that of the GO-Pep-FITC sensor developed by Song et al25 as well as 16-fold lower than that of the GO-peptide sensor developed by Feng et al.24
 | Figure 8 Linear concentration range of probes for MMP2 detection. |
To test the selectivity, the reaction of the nrGO/Pep-FITC (100 nM) with KCl (150 mM), MgCl2 (2.5 mM), ZnCl2 (2.5 mM), glucose (10 mM), glycine (1 mM), glutamine (1 mM), bovine serum albumin (100 nM), human serum albumin (100 nM), MMM9 (another member of MMPs, 2 nM), and MMP2 (2 nM) was examined in parallel under the same conditions (incubated at 37°C for 2 hours). As shown in Figure 9, the nrGO/Pep-FITC sensor exhibited the strongest fluorescence response to 2 nM of MMP2 and very weak fluorescence response to 2 nM of MMP9, and did not show obvious response to KCl, MgCl2, ZnCl2, glucose, glycine, glutamine, bovine serum albumin, and human serum albumin even with micromole-level concentrations. These data clearly indicate that the nrGO/Pep-FITC sensor possesses a high specificity for MMP2, which is ascribed to the cleavage of the specific substrate by MMP2.
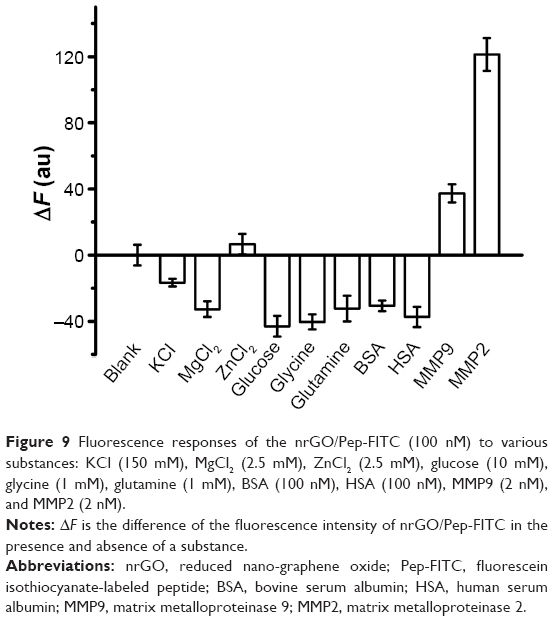 | Figure 9 Fluorescence responses of the nrGO/Pep-FITC (100 nM) to various substances: KCl (150 mM), MgCl2 (2.5 mM), ZnCl2 (2.5 mM), glucose (10 mM), glycine (1 mM), glutamine (1 mM), BSA (100 nM), HSA (100 nM), MMP9 (2 nM), and MMP2 (2 nM). |
Based on the powerful light quenching of rGO, we here devoted ourselves to develop the nrGO/Pep-FITC sensor for rapid and ultrasensitive measurement of MMP2. In fact, the nrGO/Pep-FITC sensor can also be used to monitor the trace amount of other proteases and protease inhibitors by changing polypeptide chain. For example, the expression of MMP10 in healthy human plasma is commonly ~0.03 nM,13 and the levels of MMPs in urine and saliva are much lower than that in plasma.48,49 We can replace the MMP2 cleavage substrate in the Pep-FITC with MMP10 cleavage substrate for the sensitive MMP10 detection. In reality, the nrGO/Pep-FITC sensor tends to be destroyed when other similar molecules competitively bind with nrGO, limiting its practical application in complex biological samples, which is a key issue to be overcome in the near future.
Conclusion
In summary, a novel nrGO/Pep-FITC sensor for sensitive, rapid, and accurate analysis of a protease biomarker (MMP2) has been developed through non-covalent binding of Pep-FITC to nrGO. Compared with the unreduced c-nGO/Pep-FITC, nrGO/Pep-FITC developed here has lower background signals and a tenfold lower detection limit for MMP2. Attributed to the simple preparation and facile manipulation, we envision that this work may inspire many people to develop multifunctional rGO-based biosensor platforms for the ultrasensitive detection of trace elements by functionalizing rGO with many kinds of functional probes and expand the application fields of rGO-based sensor.
Acknowledgments
This work was supported by the National Natural Science Foundation of China (Nos 61527825, 81471699, and 61178078) and the Guangdong Province Science and Technology Plan Project (2014B090901060) as well as the Guangzhou Science and Technology Plan Project (No 2014J4100055).
Author contributions
Tongsheng Chen and Xiaoping Wang contributed to conception and study design. Gaina Xi was involved in data acquisition. Gaina Xi and Tongsheng Chen were involved in data analysis and interpretation. Gaina Xi performed the statistical analyses. Gaina Xi and Tongsheng Chen drafted the article. All of the authors contributed to writing and revising the manuscript for scientific content, approved the final version before submission and agree to be accountable for all aspects of the work.
Disclosure
The authors report no conflicts of interest in this work.
References
Chau Y, Padera RF, Dang NM, Langer R. Antitumor efficacy of a novel polymer-peptide-drug conjugate in human tumor xenograft models. Int J Cancer. 2006;118(6):1519–1526. | ||
Sternlicht MD, Werb Z. How matrix metalloproteinases regulate cell behavior. Annu Rev Cell Dev Biol. 2001;17:463–516. | ||
Mitsiades N, Yu WH, Poulaki V, Tsokos M, Stamenkovic I. Matrix metalloproteinase-7-mediated cleavage of Fas ligand protects tumor cells from chemotherapeutic drug cytotoxicity. Cancer Res. 2001;61(2):577–581. | ||
Littlepage LE, Sternlicht MD, Rougier N, et al. Matrix metalloproteinases contribute distinct roles in neuroendocrine prostate carcinogenesis, metastasis, and angiogenesis progression. Cancer Res. 2010;70(6):2224–2234. | ||
Ribatti D. Endogenous inhibitors of angiogenesis: a historical review. Leuk Res. 2009;33(5):638–644. | ||
Cornelius LA, Nehring LC, Harding E, et al. Matrix metalloproteinases generate angiostatin: effects on neovascularization. J Immunol. 1998;161(12):6845–6852. | ||
Patterson BC, Sang QA. Angiostatin-converting enzyme activities of human matrilysin (MMP-7) and gelatinase B/type IV collagenase (MMP-9). J Biol Chem. 1997;272(46):28823–28825. | ||
Patel S, Sumitra G, Koner BC, Saxena A. Role of serum matrix metalloproteinase-2 and -9 to predict breast cancer progression. Clin Biochem. 2011;44(10–11):869–872. | ||
Incorvaia L, Badalamenti G, Rini G, et al. MMP-2, MMP-9 and activin A blood levels in patients with breast cancer or prostate cancer metastatic to the bone. Anticancer Res. 2007;27(3B):1519–1525. | ||
Shpitzer T, Hamzany Y, Bahar G, et al. Salivary analysis of oral cancer biomarkers. Br J Cancer. 2009;101(7):1194–1198. | ||
Smith ER, Zurakowski D, Saad A, Scott RM, Moses MA. Urinary biomarkers predict brain tumor presence and response to therapy. Clin Cancer Res. 2008;14(8):2378–2386. | ||
Tayebjee MH, Lip GY, MacFadyen RJ. What role do extracellular matrix changes contribute to the cardiovascular disease burden of diabetes mellitus? Diabetic Med. 2005;22(12):1628–1635. | ||
Friese RS, Rao F, Khandrika S, et al. Matrix metalloproteinases: discrete elevations in essential hypertension and hypertensive end-stage renal disease. Clin Exp Hypertens. 2009;31(7):521–533. | ||
Yamane T, Mitsumata M, Yamaguchi N, et al. Laminar high shear stress up-regulates type IV collagen synthesis and down-regulates MMP-2 secretion in endothelium. A quantitative analysis. Cell Tissue Res. 2010;340(3):471–479. | ||
Wang YH, Shen P, Li C, Wang YY, Liu ZH. Upconversion fluorescence resonance energy transfer based biosensor for ultrasensitive detection of matrix metalloproteinase-2 in blood. Anal Chem. 2012;84(3):1466–1473. | ||
Lakowicz JR. Principles of Fluorescence Spectroscopy. 3rd ed. Singapore: Springer; 2006:443–452. | ||
Li X, Deng D, Xue JP, Qu LZ, Achilefu S, Gu YQ. Quantum dots based molecular beacons for in vitro and in vivo detection of MMP-2 on tumor. Biosens Bioelectron. 2014;61:512–518. | ||
Akers WJ, Xu B, Lee H, et al. Detection of MMP-2 and MMP-9 activity in vivo with a triple-helical peptide optical probe. Bioconjug Chem. 2012;23(3):656–663. | ||
Qiu HZ, Wu NM, Zheng YJ, et al. A robust and versatile signal-on fluorescence sensing strategy based on SYBR Green I dye and graphene oxide. Int J Nanomed. 2015;10:147–156. | ||
He S, Song B, Li D, et al. A graphene nanoprobe for rapid, sensitive, and multicolor fluorescent DNA analysis. Adv Funct Mater. 2010;20(3):453–459. | ||
Morales-Narváez E, Merkoçi A. Graphene oxide as an optical biosensing platform. Adv Mater. 2012;24(25):3298–3308. | ||
Wen J, Xu Y, Li H, Lu A, Sun S. Recent applications of carbon nanomaterials in fluorescence biosensing and bioimaging. Chem Commun. 2015;51(57):11346–11358. | ||
Li J, Lu CH, Yao QH, et al. A graphene oxide platform for energy transfer-based detection of protease activity. Biosens Bioelectron. 2011;26(9):3894–3899. | ||
Feng D, Zhang YY, Feng TT, Shi W, Li XH, Ma HM. A graphene oxide-peptide fluorescence sensor tailor-made for simple and sensitive detection of matrix metalloproteinase 2. Chem Commun. 2011;47(38):10680–10682. | ||
Song EQ, Cheng D, Song Y, Jiang MD, Yu JF, Wang YY. A graphene oxide-based FRET sensor for rapid and sensitive detection of matrix metalloproteinase 2 in human serum sample. Biosens Bioelectron. 2013;47:445–450. | ||
Kim J, Cote LJ, Kim F, Huang J. Visualizing graphene based sheets by fluorescence quenching microscopy. J Am Chem Soc. 2010;132(1):260–267. | ||
Zhu XL, Shen YL, Cao JP, et al. Detection of microRNA SNPs with ultrahigh specificity by using reduced graphene oxide-assisted rolling circle amplification. Chem Commun. 2015;51(49):10002–10005. | ||
Hu H, Xin JH, Hu H, Wang X, Lu X. Organic liquids-responsive beta-cyclodextrin-functionalized graphene-based fluorescence probe: label-free selective detection of tetrahydrofuran. Molecules. 2014;19(6):7459–7479. | ||
Fan XB, Peng WC, Li Y, et al. Deoxygenation of exfoliated graphite oxide under alkaline conditions: a green route to graphene preparation. Adv Mater. 2008;20(23):4490–4493. | ||
Dreyer DR, Murali S, Zhu Y, Ruoff RS, Bielawski CW. Reduction of graphite oxide using alcohols. J Mater Chem. 2011;21(10):3443–3447. | ||
Wang Y, Shi ZX, Yin J. Facile synthesis of soluble graphene via a green reduction of graphene oxide in tea solution and its biocomposites. ACS Appl Mater Interfaces. 2011;3(4):1127–1133. | ||
Zhou Y, Bao QL, Tang LAL, Zhong YL, Loh KP. Hydrothermal dehydration for the “green” reduction of exfoliated graphene oxide to graphene and demonstration of tunable optical limiting properties. Chem Mater. 2009;21(13):2950–2956. | ||
Chen JQ, Liu HY, Zhao CB, et al. One-step reduction and PEGylation of graphene oxide for photothermally controlled drug delivery. Biomaterials. 2014;35(18):4986–4995. | ||
Chen JQ, Wang XP, Chen TS. Facile and green reduction of covalently PEGylated nanographene oxide via a ‘water-only’ route for high-efficiency photothermal therapy. Nanoscale Res Lett. 2014;9(1):1–10. | ||
Hummers Jr WS, Offeman RE. Preparation of graphitic oxide. J Am Chem Soc. 1958;80(6):1339–1339. | ||
Dikin DA, Stankovich S, Zimney EJ, et al. Preparation and characterization of graphene oxide paper. Nature. 2007;448(7152):457–460. | ||
Sun X, Liu Z, Welsher K, et al. Nano-graphene oxide for cellular imaging and drug delivery. Nano Res. 2008;1(3):203–212. | ||
Lee S, Cha EJ, Park K, et al. A near-infrared-fluorescence-quenched gold-nanoparticle imaging probe for in vivo drug screening and protease activity determination. Angew Chem Int Ed. 2008;47:2804–2807. | ||
He HY, Klinowski J, Forster M, Lerf A. A new structural model for graphite oxide. Chem Phys Lett. 1998;287(1–2):53–56. | ||
Li D, Muller MB, Gilje S, Kaner RB, Wallace GG. Processable aqueous dispersions of graphene nanosheets. Nat Nanotechnol. 2008;3(2):101–105. | ||
Luo JY, Cote LJ, Tung VC, et al. Graphene oxide nanocolloids. J Am Chem Soc. 2010;132(50):17667–17669. | ||
Liu KP, Zhang JJ, Cheng FF, Zheng TT, Wang CM, Zhu JJ. Green and facile synthesis of highly biocompatible graphene nanosheets and its application for cellular imaging and drug delivery. J Mater Chem. 2011;21(32):12034–12040. | ||
Cataldo F. Structural analogies and differences between graphite oxide and C-60 and C-70 polymeric oxides (fullerene ozopolymers). Fuller Nanotub Car N. 2003;11(1):1–13. | ||
Hermanson GT. Bioconjugate Techniques. San Diego, CA: Academic Press; 1996:127–228. | ||
Li J, Lin H, Yang Z, Li J. A method for the catalytic reduction of graphene oxide at temperatures below 150°C. Carbon. 2011;49(9):3024–3030. | ||
Zhang M, Yin BC, Wang XF, Ye BC. Interaction of peptides with graphene oxide and its application for real-time monitoring of protease activity. Chem Commun. 2011;47(8):2399–2401. | ||
Wang XH, Wang CY, Qu KG, et al. Ultrasensitive and selective detection of a prognostic indicator in early-stage cancer using graphene oxide and carbon nanotubes. Adv Funct Mater. 2010;20(22):3967–3971. | ||
Manicourt DH, Azria M, Mindeholm L, Thonar EJM, Devogelaer JP. Oral salmon calcitonin reduces Lequesne’s algofunctional index scores and decreases urinary and serum levels of biomarkers of joint metabolism in knee osteoarthritis. Arthritis Rheum. 2006;54(10):3205–3211. | ||
Asatsuma M, Ito S, Watanabe M, et al. Increase in the ratio of matrix metalloproteinase-9 to tissue inhibitor of metalloproteinase-1 in saliva from patients with primary Sjögren’s syndrome. Clin Chim Acta. 2004;345(1):99–104. |
 © 2016 The Author(s). This work is published and licensed by Dove Medical Press Limited. The full terms of this license are available at https://www.dovepress.com/terms.php and incorporate the Creative Commons Attribution - Non Commercial (unported, v3.0) License.
By accessing the work you hereby accept the Terms. Non-commercial uses of the work are permitted without any further permission from Dove Medical Press Limited, provided the work is properly attributed. For permission for commercial use of this work, please see paragraphs 4.2 and 5 of our Terms.
© 2016 The Author(s). This work is published and licensed by Dove Medical Press Limited. The full terms of this license are available at https://www.dovepress.com/terms.php and incorporate the Creative Commons Attribution - Non Commercial (unported, v3.0) License.
By accessing the work you hereby accept the Terms. Non-commercial uses of the work are permitted without any further permission from Dove Medical Press Limited, provided the work is properly attributed. For permission for commercial use of this work, please see paragraphs 4.2 and 5 of our Terms.