")
Back to Journals » ClinicoEconomics and Outcomes Research » Volume 12
A Real-World Study Using Claims Data to Evaluate Possible Failure of Opioid Treatment Regimens Among Patients with Hip and/or Knee Osteoarthritis in the US
Authors Gandhi K, Wei W , Huang A, Wang L, Iyer R, Katz NP
Received 8 January 2020
Accepted for publication 10 April 2020
Published 8 June 2020 Volume 2020:12 Pages 285—297
DOI https://doi.org/10.2147/CEOR.S244329
Checked for plagiarism Yes
Review by Single anonymous peer review
Peer reviewer comments 3
Editor who approved publication: Dr Xing Lin Feng
Kavita Gandhi,1 Wenhui Wei,2 Ahong Huang,3 Li Wang,3 Ravi Iyer,1 Nathaniel P Katz4,5
1Teva Pharmaceutical Industries, Frazer, PA, USA; 2Regeneron Pharmaceuticals, Tarrytown, NY, USA; 3STATinMED Research, Dallas, TX, USA; 4Analgesic Solutions, Wayland, MA, USA; 5Tufts University School of Medicine, Boston, MA, USA
Correspondence: Nathaniel P Katz
Analgesic Solutions, 321 Commonwealth Road, Ste 204, Wayland, MA 01778, USA
Tel +1 781 444-9605
Fax +1 973 553-8888
Email [email protected]
Background: Although opioids may be used in the management of pain in patients with osteoarthritis (OA), there is a dearth of real-world data characterizing opioid regimen failure in these patients.
Objective: Using claims data, this study explored measures that may be potentially indicative of opioid treatment failure and the association of such potential failure with health care resource utilization (HRU) and costs.
Patients and Methods: Using a national employer-sponsored insurance claims database covering the years 2011– 2016, this retrospective longitudinal study identified adults with hip/knee osteoarthritis who filled ≥ 1 opioid prescription (index event) and had continuous health plan enrollment 6 months pre- and ≥ 12 months post-index. Index opioid regimen intensity was defined in the 3-month post-index period by frequency, average daily dose, and duration of action. Possible index opioid regimen failure was defined as an increase in opioid regimen intensity, addition of a non-opioid pain medication, joint surgery, or opioid-abuse-related events. One-year follow-up HRU and costs were compared between those with possible treatment failure and those without.
Results: Among 271,512 OA patients (61.5% knee; 11.1% hip; 27.4% both), 34.9% met the definition of possible index opioid regimen failure within a year: increased regimen intensity (16.1%), joint surgery (14.0%), addition of non-opioid pain medication (11.4%), and opioid-abuse-related events (1.9%). Rates of possible failure generally increased with higher index regimen intensity. Compared with those who did not fail, those who potentially failed their index treatment regimen had significantly higher HRU (P< 0.001), and all-cause ($36,699 vs $15,114) and osteoarthritis-related costs ($17,298 vs $1,967) (both P< 0.0001).
Conclusion: Among OA patients treated with opioids, approximately one-third may fail their index opioid regimen within a year and incur significantly higher HRU and costs than those without. Further research is needed to validate these findings with clinical outcomes.
Keywords: osteoarthritis, pain, opioids, treatment failure, health care resource use, costs
Introduction
Musculoskeletal disorders are the primary cause of disability worldwide, with osteoarthritis (OA) being the second largest contributor to this burden after back and neck pain.1 In the United States (US), mobility impairment resulting from OA and other rheumatic diseases remains the major cause of disability among adults.2 Osteoarthritis is the most common form of arthritis,3 and estimates suggest that OA affects 13% of the US adult population, approximately 31 million individuals, and that this prevalence is increasing; the OA prevalence more than doubled between 1999 and 2014.4 This increasing prevalence likely results from factors that include the aging of the population and lifestyle changes, such as higher rates of obesity.
The burden of OA is well recognized and substantial, with effects on patients, the health care system, and society in general.5 Consequently, appropriate and effective management of OA is not only important for the patient’s health and well-being, but also of concern from the perspective of all health care stakeholders.
Management of OA is symptomatically driven6 and pain is generally the predominant symptom, with its presence increasing the burden associated with OA.7 Pharmacologic management may include nonsteroidal anti-inflammatory drugs (NSAIDs) and opioids.8–12 Guidelines for the treatment of chronic non-cancer pain recommend individualized opioid treatment regimens, including a comprehensive evaluation of risks and benefits,13 although the complexity of making treatment decisions on whether to initiate or change an opioid regimen within the context of balancing benefits, risks, and dosing recommendations have also been highlighted.14,15
Individualized opioid management has been conditionally endorsed in OA treatment guidelines for use in patients with knee or hip OA with an inadequate response to other modalities and who are either unwilling to undergo or are not candidates for total joint arthroplasty.6 However, more recent OA guidelines argue against opioid use,16 based on concerns regarding potential abuse and clinical evidence suggesting they may represent a less than optimal therapy for some patients.17 Additionally, a claims-based analysis suggested that, among OA patients prescribed opioids, switching, augmentation, or discontinuation of opioid therapy was common, with the highest rates of medication modification observed among patients prescribed strong opioids.18
The efficacy of opioids has been evaluated in randomized controlled trials, but such trials are generally of short-term duration and have specific inclusion and exclusion criteria.17 Although opioids are used by patients with OA, there is a dearth of consolidated data characterizing failure of opioid regimens in these patients in the real-world clinical setting. Therefore, the primary objective of this study was to use a claims database to explore measures that may be potentially indicative of opioid regimen failure. As an exploratory analysis, the implications of such failure were also considered with regard to health care resource utilization (HRU) and associated costs. While claims analyses can provide real-world information on the use as well as the potential risks and benefits of treatments, the challenge of identifying failure of opioid treatment regimens is that pain severity data are not captured in claims databases. However, since these databases do include all treatments received by the patients, changes in treatment regimens may potentially be used as a proxy for failure.
Patients and Methods
Data Source
Data for this retrospective, longitudinal study were acquired from the IBM MarketScan® Commercial Claims and Encounters and Medicare Supplemental and Coordination of Care database for 2011–2016 (study period). This national employer-sponsored insurance claims database includes complete longitudinal records of inpatient services, outpatient services, long-term care, and prescription drug claims covered under a variety of fee-for-service and capitated health plans. Medical claims are linked to outpatient prescription drug claims and patient-level enrollment data through unique identifiers. The de-identified data are nationally representative and HIPAA (Health Insurance Portability and Accountability Act of 1996) compliant. Since the study did not involve the collection, use, or transmittal of individual identifiable data, Institutional Review Board approval was not required.
Population
Patients were eligible if they were diagnosed with OA, and filled at least one opioid prescription during the study period. An OA diagnosis was defined as having ≥2 claims with a hip and/or knee OA diagnosis that were ≥30 days apart, or ≥2 claims with diagnosis of OA at unspecific location that were ≥30 days apart plus ≥1 claim with diagnosis of pain in hip or knee. International classification of diseases codes used for identifying the study population is provided in Table S1. For inclusion, patients must also have filled an oral or transdermal opioid prescription (index event) within 30 days of an OA diagnosis. If a patient had multiple OA diagnosis claims, one was randomly chosen and the date of the first opioid prescription within this 60-day window was considered the index date. Age ≥18 years on the index date was required, as was 6 months pre- and ≥12 months post-index continuous health plan enrollment. Patients were excluded if they were pregnant during the study period, had an organ transplant, or had ever been diagnosed with cancer, rheumatoid arthritis, ankylosing spondylitis, human immunodeficiency virus, sickle cell anemia, gout, psoriatic arthritis, or lupus; resided in a skilled nursing home; or had an opioid prescription with daily opioid dosages >1000 morphine milligram equivalents (MME) at any time during the study period, which was considered to be erroneous data. Patients who had joint surgery within 6 months before the index date were also excluded.
Patients were stratified by the intensity of their index opioid treatment regimens, which was defined by frequency, average daily dose, and type of opioid use during the 3-month post-index period. Frequency was calculated as the total number of days of supply during the 3-month period divided by 12 weeks, and was defined as intermittent (≤4 days/week) or daily (>4 days/week) dosing. Average daily dose, based on MME calculated according to the US Centers for Disease Control and Prevention (CDC),19 was defined as low (<50 MME/day) or high (≥50 MME/day);13 opioid types were considered short-acting (SAO) or long-acting (LAO). These definitions resulted in six unique regimens of increasing opioid intensity: intermittent-low-dose SAO, intermittent-high-dose SAO, daily-low-dose SAO, daily-high-dose SAO, LAO only, and combination of LAO and SAO (LAO+SAO). In addition, patients were classified as “prevalent opioid users” if at least one opioid prescription was filled during the 6-month pre-index period and as “incident opioid users” if no opioid prescription was filled during the 6-month pre-index period.
Outcomes
Possible Failure of Index Opioid Treatment Regimen
The main outcome of this analysis was possible failure of the index opioid treatment regimen. Rates of, as well as time to, possible treatment failure were determined for the overall population and as stratified by the intensity level of the index opioid regimens.
For the purpose of this analysis, definitions potentially indicative of opioid regimen failure were explored based on outcomes that were considered to be both clinically meaningful and accessible from a claims database. These definitions were grouped into the following four categories based on clinician input: 1) increased opioid regimen intensity; 2) addition of a non-opioid medication for pain management; 3) joint surgery; and 4) opioid-abuse-related events. While joint surgery represented a single-item definition, the other categories included several related items (Table 1), any one of which indicated possible regimen failure. Failure due to increased opioid intensity could have resulted from either a switch from a lower to a higher opioid intensity group, or an increase in the average daily opioid dose to ≥90 MME/day among those whose index regimen was <90 MME/day.13 The category of addition of a non-opioid medication for managing pain consisted of meeting any of the following: a hyaluronic acid intra-articular injection; oral or intra-articular injection of corticosteroids within 30 days post-index; prescription of a serotonin-norepinephrine reuptake inhibitor (SNRI) or tricyclic antidepressant (TCA) within 30 days post-index; or oral nonsteroidal anti-inflammatory drug (NSAID) or cyclooxygenase (COX)-2 inhibitor prescription within 30 days post-index. Similarly, failure due to opioid-abuse-related events was defined by either the presence of any claim with opioid abuse or overdose diagnosis, an opioid-poisoning-related hospitalization or emergency room (ER) visit, a substance abuse center “place of service” code, use of naloxone during an ER visit (J-code only), or any use of naltrexone based on National Drug Code (NDC) or J-code. The codes used to identify opioid abuse-related events, as well as codes for other outcomes indicative of opioid regimen failure (including joint surgery and intra-articular injections of either hyaluronic acid or corticosteroids), are provided in Table S2.
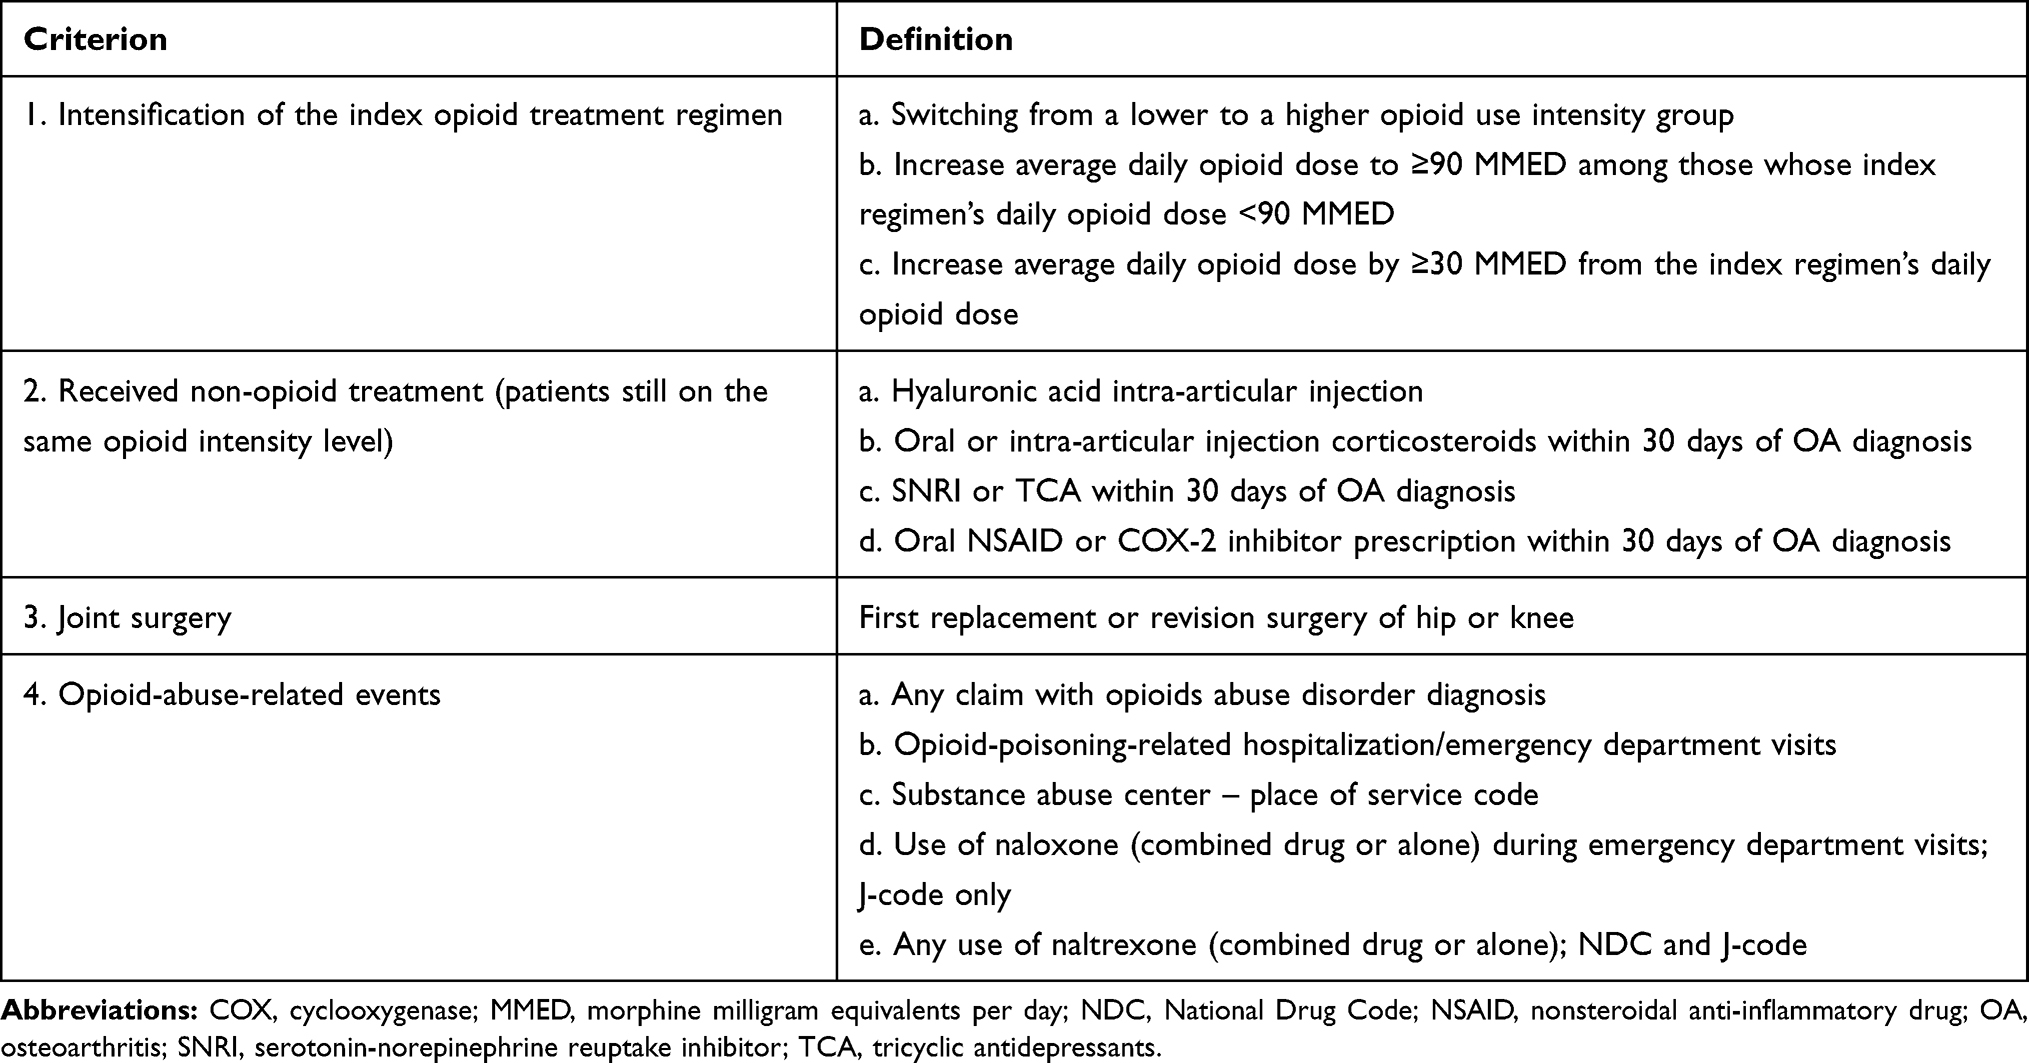 |
Table 1 Criteria and Definitions Potentially Indicative of Index Opioid Regimen Failure |
Patients were evaluated every 90 days for possible failure of index opioid treatment regimen for a minimum of 1 year from the index date.
One-Year Follow-Up Health Care Resource Use and Costs
Data on all-cause and OA-related HRU during the 1-year post-index follow-up period were obtained for the resource categories of hospitalizations, ER visits, outpatient office visits, and other outpatient visits. OA-related HRU was defined as any claim having an OA diagnosis code in the primary or secondary position.
All-cause and OA-related HRU-associated costs were calculated for the above HRU categories with the addition of pharmacy costs. Costs were determined from billing data, which reflected the total plan and patient paid cost. OA-related pharmacy costs were derived from all pain-related pharmacy claims. All costs were adjusted to 2016 US dollars using the medical care component of the Consumer Price Index.
Statistical Analysis
Differences in demographic and clinical variables were evaluated using t-tests and chi-square tests for continuous and categorical variables, respectively, with daily-low-dose SAO as the referent group. Treatment regimen failure rates were compared across opioid intensities using daily-low-dose SAO as the referent and adjusting for baseline differences. Health care resource use and associated costs were also compared between patients with and without opioid regimen treatment failure, and the standardized mean differences (SMD) were calculated as the absolute difference in sample means divided by the pooled standard deviation.20 Since OA-related outcomes were defined by OA diagnosis codes in the primary or secondary position, a sensitivity analysis was conducted to determine the robustness of OA-related costs by estimating these costs using only the primary position.
Kaplan–Meier (K–M) survival analysis was used to estimate the time to possible index regimen failure up to 5 years post-index for each opioid intensity regimen; differences among the survival curves were evaluated with the Log-rank test. Logistic regression was used to evaluate the likelihood of possible failure of index opioid treatment regimens within 1-year post-index, adjusting for confounding factors that included age, sex, region, health care plan type, location of OA, Charlson Comorbidity Index (CCI) score, hypertension, hyperlipidemia, depression, anxiety, insomnia/sleep disorder, arthritis and other arthropathies, chronic low back pain, rheumatism (excluding the back), fibromyalgia, migraine, obesity, alcohol dependence/abuse, and prevalent/incident opioid use; daily-low-dose SAO was the referent. Results are presented as odds ratios (OR) with their 95% confidence intervals (CI). The 1-year post-index health care resource utilization and associated costs were compared between those with treatment failure and those without, using t-tests for continuous variables and chi-square tests for categorical variables.
All analyses were conducted using SAS version 9.4 (SAS Institute, Cary, NC).
Results
Patient Population
A total of 271,512 OA patients were identified for inclusion in the analysis. Overall, the population was 62.7% female, the mean age was 59.8 years, and all geographic regions were represented. Of these patients, 61.5% had OA only in the knee, 11.1% had OA only in the hip, and 27.4% had OA in both knee and hip. Based on a claim of at least one opioid prescription during the 6-month pre-index period, 53.9% of patients were identified as prevalent opioid users overall, although there were differences among the treatment regimens; the intermittent regimens had low prevalent opioid use (36.7–42.9%) relative to the other regimens (76.0–94.3%) (Table 2).
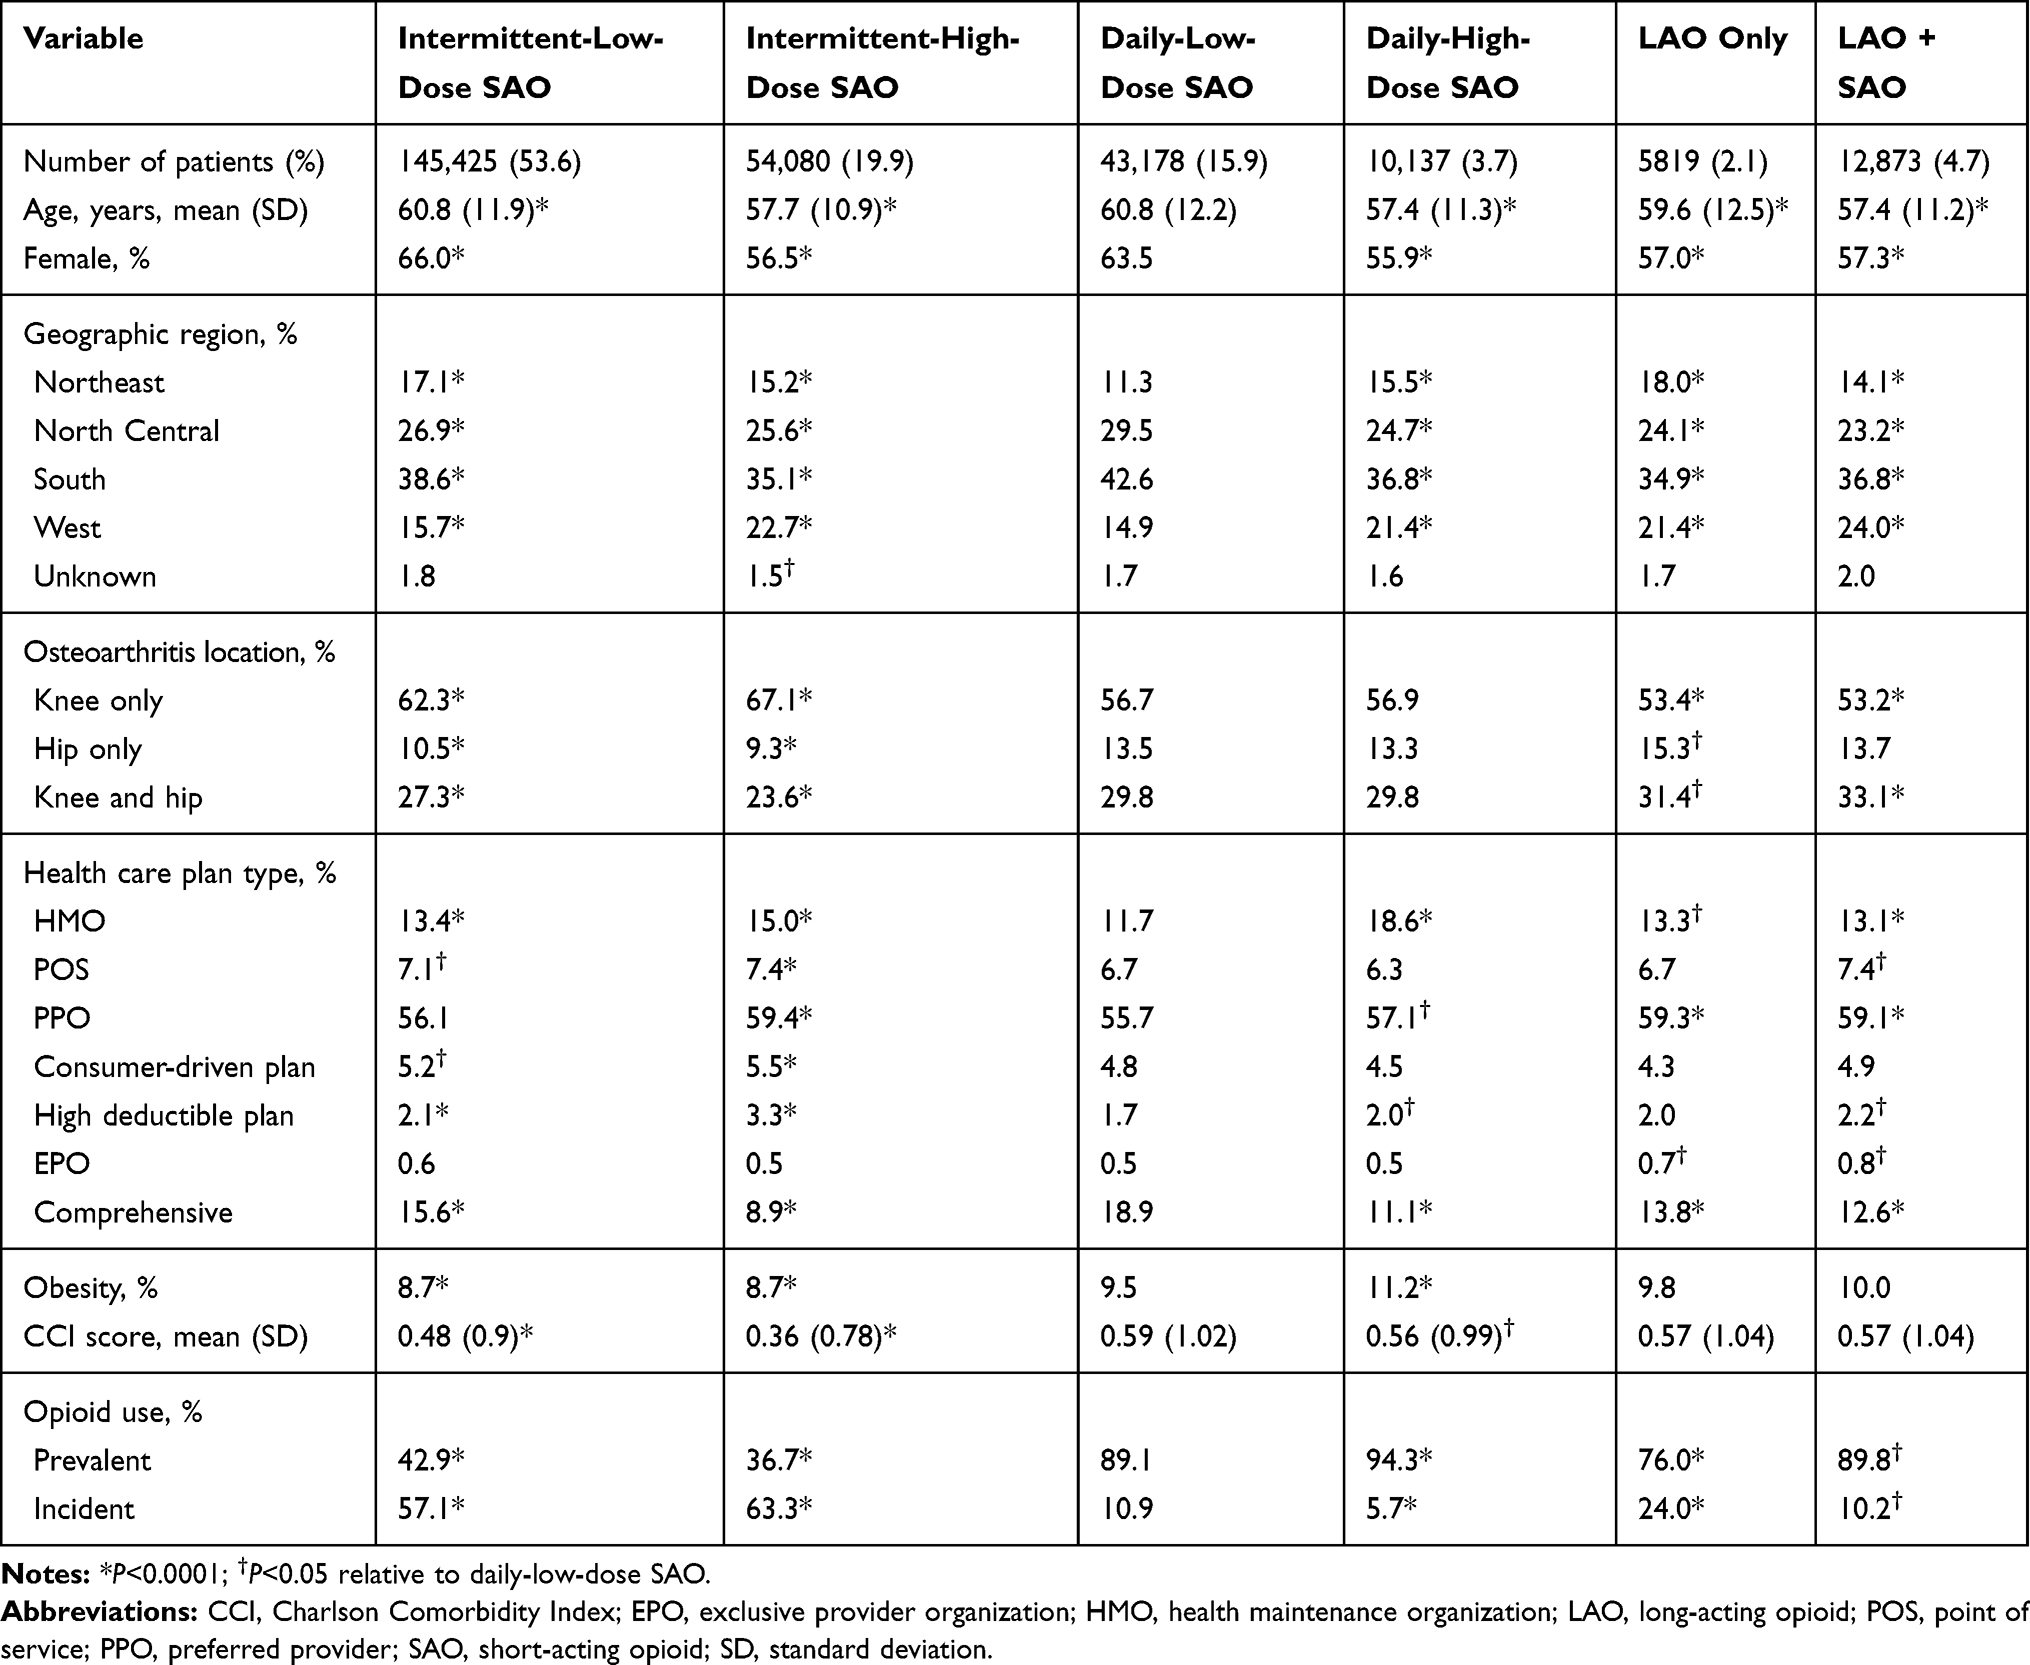 |
Table 2 Characteristics of the Patient Population by Opioid Intensity (N=271,512), with Comparison to Daily-Low-Dose SAO as the Referent. All Data, Except Osteoarthritis Location, Were Based on the Pre-Index 6-Month Period |
The most frequent index opioid regimen was intermittent-low-dose SAO (53.6%), followed by intermittent-high-dose SAO (19.9%) and daily-low-dose SAO (15.9%), with low proportions of patients having been prescribed daily-high-dose SAO (3.7%), LAO only (2.1%), and LAO+SAO (4.7%) (Table 2). Relative to daily-low-dose opioids, statistically significant differences were observed across the opioid intensity regimens for most demographic and clinical characteristics (Table 2).
Possible Failure of Index Opioid Treatment Regimen
Overall, 34.9% of patients failed their index opioid regimen by 1-year post-index (Figure 1). Increased regimen intensity and joint surgery were the main reasons for possible failure, 16.1% and 14.0% of all patients, respectively, and 11.4% failed because of addition of non-opioid medications (Figure 1); few patients failed for opioid-abuse-related events (1.9%). Statistically significant differences were observed for nearly all demographic and clinical characteristics at baseline between patients with treatment regimen failure and those without, although the magnitude of the differences was small (Table 3).
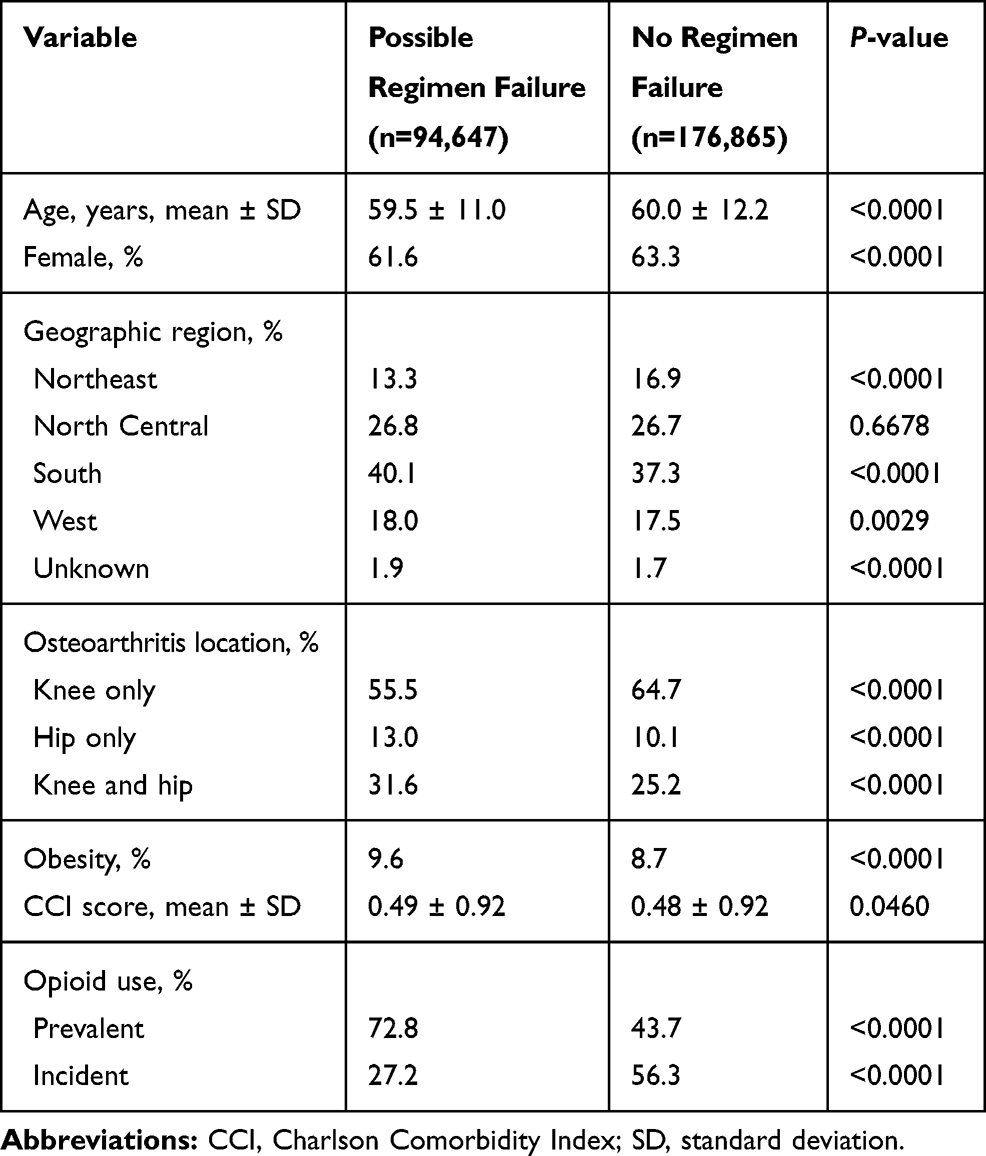 |
Table 3 Characteristics of the Patient Population Stratified by Possible Failure of Index Opioid Regimen (N=271,512) |
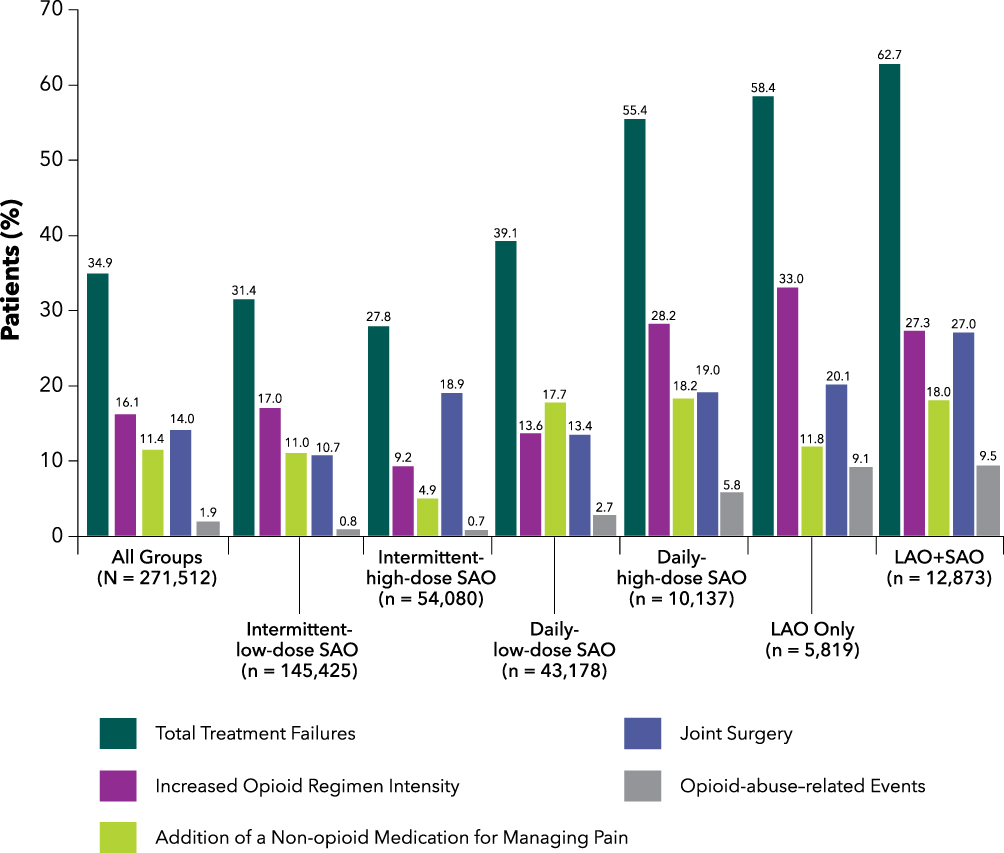 |
Figure 1 Reasons for possible failure among the index opioid intensity regimens during the follow-up year. The sum of individual reasons exceeds total possible failures, since some patients may have failed for multiple reasons. Abbreviations: LAO, long-acting opioid; SAO, short-acting opioid. |
Rates of failure generally increased with higher index regimen intensity (Figure 1): the highest rate of failure, 62.7%, was observed among LAO+SAO users and the lowest rate was observed among intermittent-high-dose SAO users (27.8%). Reasons for regimen failure varied among the opioid groups (Figure 1). While opioid intensification appeared to be the main driver of failure for intermittent-low-dose SAO, daily-high-dose SAO, and LAO-only users, receipt of an additional non-opioid analgesic was the primary reason in the daily-low-dose SAO group, and joint surgery was the main reason in the intermittent-high-dose SAO group. Rates of joint surgery and opioid intensification were similar in the LAO+SAO group. Opioid-abuse-related events as a reason for treatment regimen failure was highest in the LAO-only and LAO+SAO groups, 9.1% and 9.5%, respectively (Figure 1). Among the patients who failed therapy in each group, a substantial proportion failed for multiple reasons: 7.3% of intermittent-low-dose SAO, 5.3% of intermittent-high-dose SAO, 7.4% of daily-low-dose SAO, 13.9% of daily-high-dose SAO, 14.0% of LAO only, and 16.6% of LAO+SAO failures met more than one failure category.
Prevalent opioid users had rates of treatment failure (40.9–63.4%) that were consistently higher than incident opioid users (18.6–56.5%) across all opioid regimens. However, differences in regimen failure were observed among incident users, with failure rates for intermittent-low-dose SAO (19.9%), intermittent-high-dose SAO (18.6%), and daily-low-dose SAO (24.2%) that were substantially lower than the rates among daily-high-dose SAO (53.7%), LAO only (44.0%), and LAO+SAO) (56.5%).
The K–M survival curves (Figure 2) showed a statistically significant difference in time to possible failure across the index opioid intensity regimens (P<0.0001), with median time to failure of index opioid regimen observed to be shorter at higher opioid intensities and, in particular, ≤1 year for daily-high-dose SAO (360 days), LAO, and LAO+SAO (both 270 days). In contrast, median time to failure was 630 days for the daily-low-dose SAO and 900 days for the intermittent-low-dose SAO groups; median time to failure in the intermittent-high-dose SAO group was at the upper time limit of the K–M curve (approximately 5 years).
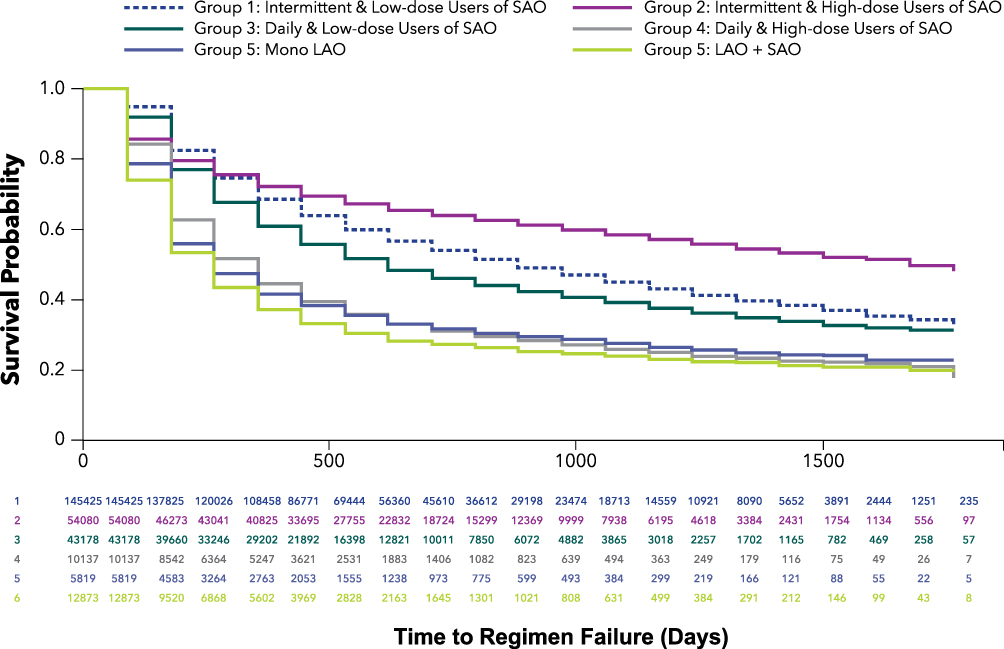 |
Figure 2 Kaplan–Meier survival curve of time to possible failure for the index opioid intensity regimens. Abbreviations: LAO, long-acting opioid; SAO, short-acting opioid. |
Logistic regression showed that the likelihood of treatment regimen failure at 1 year relative to the daily-low-dose SAO group was significantly higher among all other opioid regimens (P<0.001) (Figure 3). The lowest likelihood relative to the daily-low-dose SAO group was among intermittent users (OR 1.21, 95% CI 1.18–2.24, P<0.0001 for intermittent-low-dose SAO; and OR 1.05, 95% CI 1.02–1.08, P=0.0006 for intermittent-high-dose SAO). However, the daily-high-dose SAO group had an almost two-fold higher likelihood of failure at 1 year (OR 1.81, 95% CI 1.73–1.90), and the likelihood was approximately 2.5-fold higher for the LAO-only (OR 2.47, 95% CI 2.33–2.62) and LAO+SAO groups (OR 2.51, 95% CI 2.40–2.61) (all P<0.0001) (Figure 3). Prevalent opioid users overall also had a likelihood of opioid regimen failure that was significantly higher, by more than 3-fold, relative to incident users (OR 3.15, 95% CI 3.09–3.21; P<0.0001).
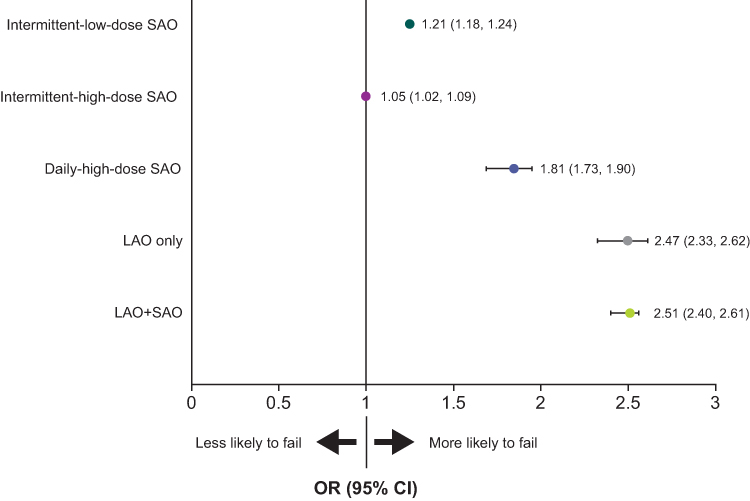 |
Figure 3 Odds ratios for the likelihood of index opioid regimen failure at 1 year relative to daily-low-dose SAO. Covariates included in the model were age, sex, region, health care plan type, location of OA, Charlson Comorbidity Index score, hypertension, hyperlipidemia, depression, anxiety, insomnia/sleep disorder, arthritis and other arthropathies, chronic low back pain, rheumatism (excluding the back), fibromyalgia, migraine, obesity, alcohol dependence/abuse, and prevalent/incident opioid use. Abbreviations: CI, confidence interval; LAO, long-acting opioid; OA, osteoarthritis; OR, odds ratio; SAO, short-acting opioid. |
Association of Possible Failure of Index Opioid Regimen with Health Care Resource Use and Costs
During the 12-month follow-up period, all-cause HRU in the overall population was higher with regard to both frequency of use and units used among those who failed their index opioid regimen relative to those who did not (Table 4). In particular, frequency of hospitalizations was substantially higher among those who failed their index opioid treatment regimen (47.1% vs 9.3%; SMD 92.7; P<0.0001), as was mean (SD) length of hospital stay (2.5 [5.7] vs 0.6 [4.1] days; SMD 39.0; P<0.0001). OA-related HRU was also higher among those who failed relative to those who did not (Table 4).
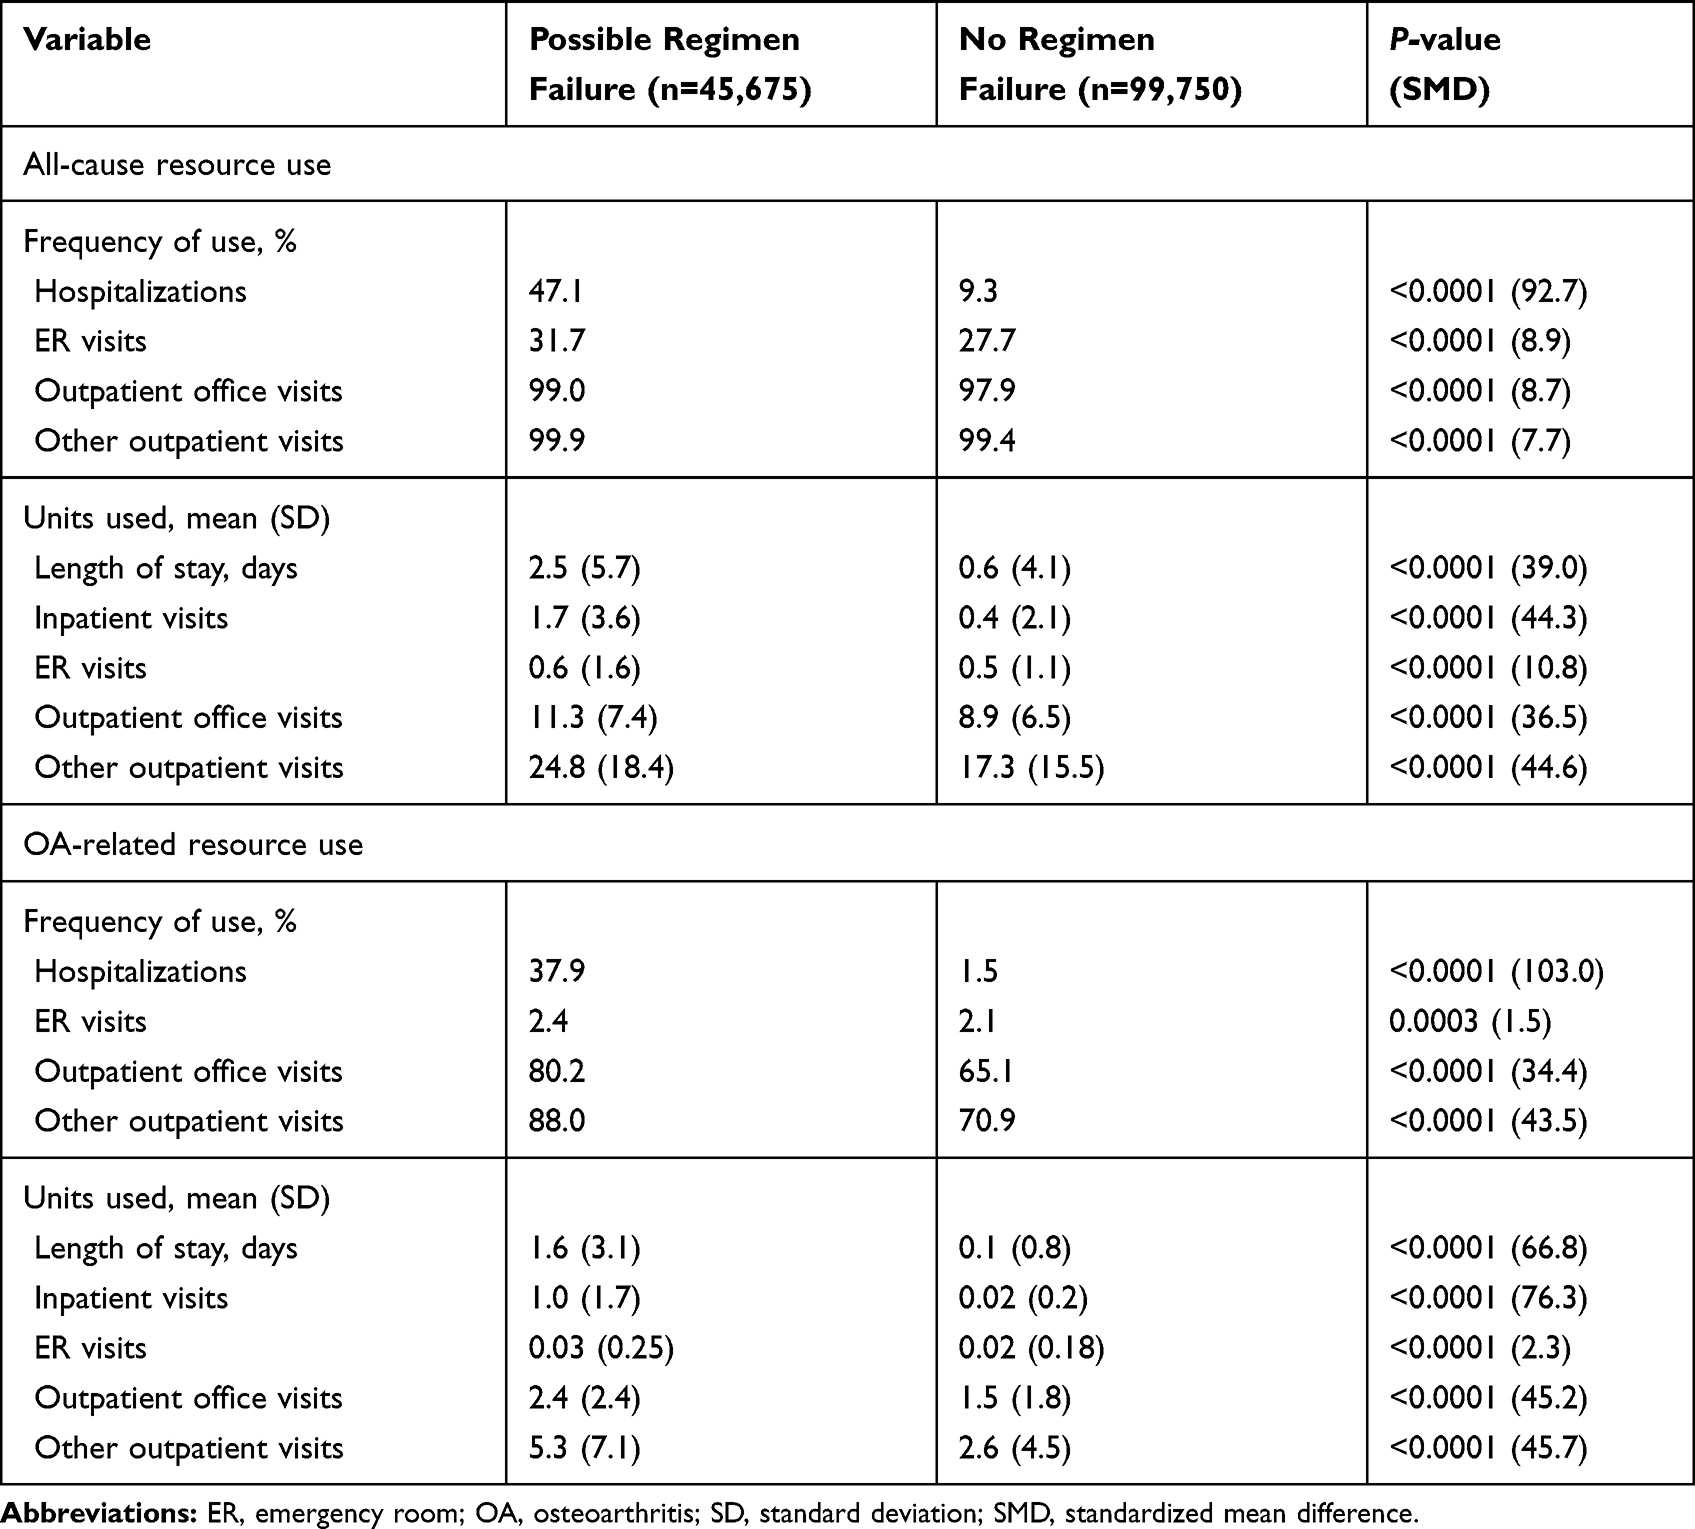 |
Table 4 All-Cause and Osteoarthritis-Related Health Care Resource Utilization Among Osteoarthritis Patients with or Without Possible Failure of Index Opioid Regimen in the Total Population During the 12-Month Follow-Up Period |
In the total population, each health care resource category of inpatient, ER, outpatient, and pharmacy use was associated with higher costs among OA patients who failed their index opioid regimen relative to those who did not (Figure 4). These higher costs across all health care resource categories resulted in mean (SD) total all-cause costs that were more than twice as high among those with index opioid regimen failure relative to those without ($36,699 [$43,059] vs $15,114 [$26,900]; SMD 60.1; P<0.0001), and OA-related costs that were almost 9-fold higher ($17,298 [$25,872] vs $1,967 [$5,357]; SMD 82.1; P<0.0001). While the primary driver of both all-cause and OA-related costs were hospitalizations among those with opioid regimen failure, outpatient visits appeared to be the cost driver in those without (Figure 4). OA-related costs estimated in the sensitivity analysis (ie, with an OA diagnostic code only in the primary position) were $15,591 ($24,848) among those with index opioid regimen failure compared with $1298 ($4652) without failure (SMD 80.0; P<0.0001), with hospitalizations and outpatient visits the cost drivers, respectively, consistent with the main analysis.
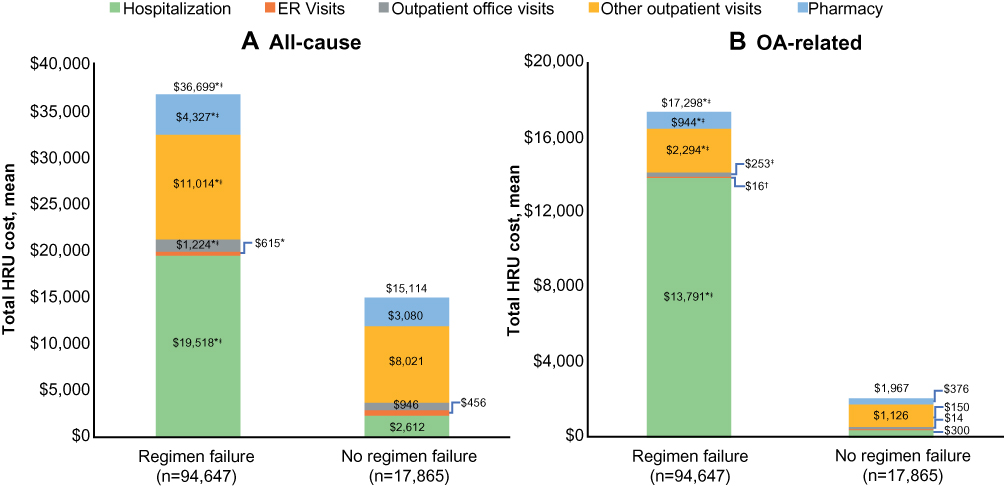 |
Figure 4 All-cause (A) and OA-related (B) health care resource category costs during the 12-month follow-up period in the total population by possible failure of index opioid treatment regimen treatment. *P<0.0001 vs no treatment failure. †P<0.05 vs no treatment failure. ‡Standardized mean difference >10 vs no regimen failure. Abbreviations: ER, emergency room; HRU, health care resource utilization; OA, osteoarthritis. |
Among those with opioid regimen failure, total all-cause costs and OA-related costs were driven by hospitalizations across opioid intensity regimens. In contrast, total all-cause costs among those without failure were driven by outpatient costs (Figure 4). Furthermore, for OA-related costs, the cost driver in this subgroup was outpatient visits in the lower opioid intensity regimens (intermittent- and daily-low-dose SAO groups) and pharmacy costs in the highest intensity group (LAO+SAO); OA-related outpatient costs and pharmacy costs were similar among those without treatment failure in the daily-high-dose and LAO-only groups.
Discussion
This real-world study suggests that approximately one-third of patients with OA pain who were initiated on opioids had outcomes indicative of possible failure of their index opioid regimen, and that HRU and associated costs were significantly higher among these patients relative to those who did not fail therapy. Notably, opioid regimens of higher intensity were generally associated with both higher rates of possible failure and shorter median times to failure, which for daily-high-dose SAO, LAO, and LAO+SAO was ≤1 year.
The primary reasons for possible failure varied among the opioid intensity regimens, although it should also be recognized that opioid “regimen failure” was evaluated rather than “treatment failure” because pain severity levels were not captured and definitions other than analgesic relief were included in the criteria used to define failure. Nevertheless, the primary reasons for opioid regimen failure were often related to the need for greater analgesic management, either through opioid intensification or the receipt of non-opioid treatments. Changes in pain management as a reason for possible treatment failure are consistent with a previous study that suggested switching or augmentation of medications was common among OA patients who were prescribed opioids.18 Opioid-abuse-related events as a reason for treatment failure was low overall (1.9%). This rate is lower than the 4.7% for iatrogenic opioid dependence or abuse among those prescribed opioids for pain that was recently reported in a systematic review.21 That review also suggested that long-term opioid analgesic exposure and the prescribing of stronger opioids were associated with a lower incidence of opioid dependence or abuse. Those findings could not be substantiated in the current analysis and, while it also has been previously suggested that there is a low risk for opioid dependence among patients with chronic pain who are treated with opioids,22 the higher opioid intensity regimens in the current study appeared to be associated with higher rates of possible failure because of these events, which was approximately 10% of the patients who received LAO+SAO as their index regimen.
The rate of joint surgery as a reason for possible treatment failure, which overall was 14.0%, was higher among those at the higher opioid intensity doses and up to 27% in the LAO+SAO group. While joint surgery was the primary reason of index opioid regimen failure for the intermittent-high-dose SAO group, this group was also characterized by the highest OA-related costs, which cannot be explained by the joint surgery alone. However, these observations do suggest that the intermittent-high-dose SAO group may have clinical characteristics that are different relative to patients prescribed other index opioid regimens. Further studies are needed to examine clinical characteristics of this subgroup that were not available in the database used for this analysis and the relevance of these findings.
Relative to daily-low-dose SAO, all other opioid regimens had a significantly higher likelihood of failure when controlling for other confounding factors including incident versus prevalent use. This higher likelihood of failure among the two intermittent regimens, in particular, may reflect the chronic nature of OA pain and suggests that for this type of pain, daily-low-dose opioids are more appropriate than intermittent use regardless of dose level, and may represent the best opioid regimen option overall, although there was still a substantial rate of regimen failure (39.1%) in this group.
All-cause HRU and associated costs were significantly higher among those with possible treatment failure relative to those without, with OA-related HRU and costs that paralleled the all-cause costs; the SMDs showed that these differences were substantial. OA costs as a proportion of all-cause costs were also consistently and substantially higher among those with possible treatment failure (31.2–52.2%) relative to those without treatment failure (11.4–20.0%). All-cause and OA-related costs appeared to be driven by hospitalizations among those with possible treatment failure: hospitalizations represent the resource category with the highest per unit cost, and both the proportions of patients hospitalized and the length of stay was higher among those with possible treatment failure relative to those without. In contrast, the primary driver of costs among those without treatment failure was outpatient visits. The OA-related costs were consistent regardless of whether the primary and secondary or only the primary diagnostic code position was considered. However, more robust statistical approaches are warranted to further evaluate these differences.
The high rate of index opioid regimen failure and the need for HRU have implications for both patients and the health care system. Taken together, these findings suggest that management of OA pain remains less than optimal in a substantial proportion of patients treated with high-intensity, high-dose opioids and that one of the consequences of regimen failure is an increase in the economic burden of OA.
Although a strength of this study is its external validity, as a result of the use of data representing “real-world” clinical settings, several limitations should be noted when interpreting these results and determining their implications. Among these limitations is the potential for misclassification of some patients. While the requirement of ≥2 claims likely improved the specificity of identifying patients for inclusion, it may also introduce selection bias, since those with only one claim may have different characteristics than those with ≥2 claims. Similarly, the analysis used a database from 2011 to 2016, and it is likely that opioid regimen patterns may have subsequently changed due to increasing scrutiny by stakeholders. However, as the definitions of treatment failure would remain relevant even in the presence of such changes, the results of this study are unlikely to be substantially affected. The inability to link pain medication prescribing with OA represents another limitation, as does the fact that a claim for a filled prescription does not necessarily indicate use and/or that the medication was used as prescribed. There was also a lack of statistical control for unobserved patient characteristics, such as pain severity or disease severity, which could account for some of the differences in outcomes. Additionally, there may be other forms of treatment regimen failure not captured here, such as switching to, or initiation of, non-pharmacologic therapies. Similarly, while the definitions of failure used in this analysis may be clinically relevant, it should also be considered that several of these definitions potentially reflect ongoing management strategies rather than treatment failure (eg, addition of non-opioid analgesics and opioid support among patients who may already have been scheduled for joint surgery), which may overestimate costs of treatment failure. However, in this regard, it should be noted that since pre-operative opioid use is associated with worse outcomes after joint replacement surgery,23,24 opioid use may not necessarily be an appropriate management strategy in patients expecting to undergo such surgery. While it may further be proposed that treatment failure based on an endpoint reflecting the patient’s functional status would be more appropriate, such outcomes are not adequately captured in claims databases. Finally, relationships should be considered associative rather than causal.
Conclusions
This study provides an initial approach for using a claim database to define and understand measures potentially indicative of opioid treatment regimen failure in patients with OA. Based on real-world data, the results suggest not only that higher index opioid intensity regimens may be associated with higher rates of possible treatment failure, but also that the time to such failure may be shorter as these regimens increased in intensity. Patients with daily-high-dose SAO, LAO, and LAO+SAO use were approximately twice as likely to fail their treatment regimen by 1 year compared with those with daily-low-dose SAO use. Such potential failures also appeared to significantly impact HRU and associated costs. Thus, while these results indicate that patients initiated on higher intensity opioid regimens generally have a higher likelihood of clinically undesirable outcomes, treatment regimen failure in general appears to be associated with an incremental economic burden to the US health care system. Future studies are needed to evaluate the relationships between baseline disease characteristics and selection of an opioid regimen and refine the definitions of treatment failure, which may further enhance appropriate prescribing to reduce the risk of unfavorable outcomes. Findings from this study also underscore the importance and need for additional options for managing OA pain.
Abbreviations
CI, confidence interval; ER, emergency room; HRU, health care resource utilization; LAO, long-acting opioid; MME, morphine milligram equivalents; NDC, National Drug Code; OA, osteoarthritis; OR, odds ratio; SAO, short-acting opioid; SD, standard deviation.
Acknowledgments
This research was funded by Regeneron Pharmaceuticals Inc. and Teva Pharmaceutical Industries Ltd. The authors acknowledge E. Jay Bienen, PhD, for medical writing support during development of this manuscript, and Michele Salernitano of Ashfield Healthcare Communications for editorial support.
Author Contributions
All authors contributed to study conception and design, data analysis and interpretation, and drafting or revising the article; gave final approval of the version of the article to be published; and agree to be accountable for all aspects of the work.
Disclosure
Kavita Gandhi is a former employee of Teva Pharmaceutical Industries Ltd., Wenhui Wei is an employee of Regeneron Pharmaceuticals with stock ownership; Ravi Iyer is an employee of Teva Pharmaceuticals with stock ownership; Ahong Huang and Li Wang are employees of STATinMED Research, which is a paid consultant to Teva Pharmaceutical Industries Ltd., and Regeneron Pharmaceuticals; Nathaniel P. Katz serves as a consultant to Teva Pharmaceuticals and Regeneron Pharmaceuticals. The authors report no other conflicts of interest in this work.
References
1. GBD 2017 disease and injury incidence and prevalence collaborators. Global, regional, and national incidence, prevalence, and years lived with disability for 354 diseases and injuries for 195 countries and territories, 1990–2017: a systematic analysis for the Global Burden of Disease Study 2017. Lancet. 2018;392(10159):1789–1858. doi:10.1016/S0140-6736(18)32279-7
2. Okoro CA, Hollis ND, Cyrus AC, Griffin-Blake S. Prevalence of disabilities and health care access by disability status and type among adults - United States, 2016. MMWR Morb Mortal Wkly Rep. 2018;67(32):882–887. doi:10.15585/mmwr.mm6732a3
3. Cisternas MG, Murphy L, Sacks JJ, Solomon DH, Pasta DJ, Helmick CG. Alternative methods for defining osteoarthritis and the impact on estimating prevalence in a US population-based survey. Arthritis Care Res. 2016;68(5):574–580. doi:10.1002/acr.22721
4. Park J, Mendy A, Vieira ER. Various types of arthritis in the United States: prevalence and age-related trends from 1999 to 2014. Am J Public Health. 2018;108(2):256–258. doi:10.2105/AJPH.2017.304179
5. Hunter DJ, Schofield D, Callander E. The individual and socioeconomic impact of osteoarthritis. Nat Rev Rheumatol. 2014;10(7):437–441. doi:10.1038/nrrheum.2014.44
6. Hochberg MC, Altman RD, April KT, et al. American College of Rheumatology 2012 recommendations for the use of nonpharmacologic and pharmacologic therapies in osteoarthritis of the hand, hip, and knee. Arthritis Care Res. 2012;64(4):465–474. doi:10.1002/acr.21596
7. daCosta DiBonaventura M, Gupta S, McDonald M, Sadosky A. Evaluating the health and economic impact of osteoarthritis pain in the workforce: results from the National Health and Wellness Survey. BMC Musculoskelet Disord. 2011;12:83. doi:10.1186/1471-2474-12-83
8. Gore M, Tai KS, Sadosky A, Leslie D, Stacey BR. Clinical comorbidities, treatment patterns, and direct medical costs of patients with osteoarthritis in usual care: a retrospective claims database analysis. J Med Econ. 2011;14(4):497–507. doi:10.3111/13696998.2011.594347
9. Gore M, Tai KS, Sadosky A, Leslie D, Stacey BR. Use and costs of prescription medications and alternative treatments in patients with osteoarthritis and chronic low back pain in community-based settings. Pain Pract. 2012;12(7):550–560. doi:10.1111/j.1533-2500.2012.00532.x
10. DeMik DE, Bedard NA, Dowdle SB, Burnett RA, McHugh MA, Callaghan JJ. Are we still prescribing opioids for osteoarthritis? J Arthroplasty. 2017;32(12):3578–3582 e3571. doi:10.1016/j.arth.2017.07.030
11. Berger A, Bozic K, Stacey B, Edelsberg J, Sadosky A, Oster G. Patterns of pharmacotherapy and health care utilization and costs prior to total hip or total knee replacement in patients with osteoarthritis. Arthritis Rheum. 2011;63(8):2268–2275. doi:10.1002/art.30417
12. Wright EA, Katz JN, Abrams S, Solomon DH, Losina E. Trends in prescription of opioids from 2003–2009 in persons with knee osteoarthritis. Arthritis Care Res. 2014;66(10):1489–1495. doi:10.1002/acr.22360
13. Dowell D, Haegerich TM, Chou R. CDC guideline for prescribing opioids for chronic pain–United States, 2016. JAMA. 2016;315(15):1624–1645. doi:10.1001/jama.2016.1464
14. Dowell D, Haegerich T, Chou R. No shortcuts to safer opioid prescribing. N Engl J Med. 2019;380(24):2285–2287. doi:10.1056/NEJMp1904190
15. Wood E, Simel DL, Klimas J. Pain management with opioids in 2019–2020. JAMA. 2019;322(19):1912. doi:10.1001/jama.2019.15802
16. Bannuru RR, Osani MC, Vaysbrot EE, et al. OARSI guidelines for the non-surgical management of knee, hip, and polyarticular osteoarthritis. Osteoarthritis Cartilage. 2019;27(11):1578–1589. doi:10.1016/j.joca.2019.06.011
17. da Costa BR, Nüesch E, Kasteler R, et al. Oral or transdermal opioids for osteoarthritis of the knee or hip. Cochrane Database Syst Rev. 2014;9:CD003115.
18. Gore M, Sadosky A, Leslie D, Tai KS, Seleznick M. Patterns of therapy switching, augmentation, and discontinuation after initiation of treatment with select medications in patients with osteoarthritis. Clin Ther. 2011;33(12):1914–1931. doi:10.1016/j.clinthera.2011.10.019
19. Centers for Disease Control and Prevention (CDC). Analyzing prescription data and morphine milligram equivalents (MME); 2018. Available from: https://www.cdc.gov/drugoverdose/resources/data.html.
20. Cohen J. Statistical Power Analysis for the Behavioral Sciences.
21. Higgins C, Smith BH, Matthews K. Incidence of iatrogenic opioid dependence or abuse in patients with pain who were exposed to opioid analgesic therapy: a systematic review and meta-analysis. Br J Anaesth. 2018;120(6):1335–1344. doi:10.1016/j.bja.2018.03.009
22. Minozzi S, Amato L, Davoli M. Development of dependence following treatment with opioid analgesics for pain relief: a systematic review. Addiction. 2013;108(4):688–698. doi:10.1111/j.1360-0443.2012.04005.x
23. Goplen CM, Verbeek W, Kang SH, et al. Preoperative opioid use is associated with worse patient outcomes after total joint arthroplasty: a systematic review and meta-analysis. BMC Musculoskelet Disord. 2019;20(1):234. doi:10.1186/s12891-019-2619-8
24. Jain N, Brock JL, Malik AT, Phillips FM, Khan SN. Prediction of complications, readmission, and revision surgery based on duration of preoperative opioid use: analysis of major joint replacement and lumbar fusion. J Bone Joint Surg Am. 2019;101(5):384–391. doi:10.2106/JBJS.18.00502
 © 2020 The Author(s). This work is published and licensed by Dove Medical Press Limited. The full terms of this license are available at https://www.dovepress.com/terms.php and incorporate the Creative Commons Attribution - Non Commercial (unported, v3.0) License.
By accessing the work you hereby accept the Terms. Non-commercial uses of the work are permitted without any further permission from Dove Medical Press Limited, provided the work is properly attributed. For permission for commercial use of this work, please see paragraphs 4.2 and 5 of our Terms.
© 2020 The Author(s). This work is published and licensed by Dove Medical Press Limited. The full terms of this license are available at https://www.dovepress.com/terms.php and incorporate the Creative Commons Attribution - Non Commercial (unported, v3.0) License.
By accessing the work you hereby accept the Terms. Non-commercial uses of the work are permitted without any further permission from Dove Medical Press Limited, provided the work is properly attributed. For permission for commercial use of this work, please see paragraphs 4.2 and 5 of our Terms.