")
Back to Journals » International Journal of General Medicine » Volume 15
A Pyroptosis-Related Gene Signature Associated with Prognosis and Tumor Immune Microenvironment in Gliomas
Authors Zhou Z, Xu J, Huang N, Tang J, Ma P, Cheng Y
Received 21 December 2021
Accepted for publication 16 March 2022
Published 6 May 2022 Volume 2022:15 Pages 4753—4769
DOI https://doi.org/10.2147/IJGM.S353762
Checked for plagiarism Yes
Review by Single anonymous peer review
Peer reviewer comments 3
Editor who approved publication: Dr Scott Fraser
Zunjie Zhou, Jing Xu, Ning Huang, Jun Tang, Ping Ma, Yuan Cheng
Department of Neurosurgery, the Second Affiliated Hospital of Chongqing Medical University, Chongqing, People’s Republic of China
Correspondence: Yuan Cheng, Department of Neurosurgery, the Second Affiliated Hospital of Chongqing Medical University, No. 74 Linjiang Road, Yuzhong District, Chongqing, People’s Republic of China, Tel +8613708329653, Email [email protected]
Background: Pyroptosis is a novel form of cell death that plays a significant role in cancer, while the prognostic values of pyroptosis-related genes in gliomas have not been revealed.
Methods: We analyzed the RNA-seq and clinical data of gliomas from the University of California Santa Cruz (UCSC) Xena database to determine differentially expressed pyroptosis-related genes. Based on these genes, a pyroptosis genes signature was constructed after univariate Cox analysis and Lasso Cox analyses. The sensitivity and specificity of pyroptosis genes signature were verified by the Chinese Glioma Genome Atlas (CGGA) dataset. Finally, we explored the association of risk signatures with tumor microenvironment and immune cell infiltration.
Results: Of 15 differentially expressed pyroptosis-related genes, three genes of BCL2 associated X (BAX), caspase 3 (CASP3), and caspase 4 (CASP4) were used to construct the risk signature. The effectiveness of risk signature for predicting survival at 1, 3, 5 years was performed by the receiver operating characteristic curve (ROC), and the area under curves (AUC) was 0.739, 0.817, and 0.800, respectively. Functional enrichment results showed signal transduction, cell adhesion, immune response, and inflammatory response were enriched. The immune analysis revealed that pyroptosis had a remarkable effect on the immune microenvironment.
Conclusion: In this study, we constructed a pyroptosis-related gene signature, which can serve as a potential biomarker for predicting the survival of glioma patients. Additionally, we suggested that pyroptosis may promote gliomas development by inducing chronic inflammation microenvironment.
Keywords: pyroptosis, prognosis, gliomas, signature, tumor microenvironment
Introduction
Gliomas are the most common malignant craniocerebral tumor with strong invasiveness. It has a dismal clinical prognosis with an overall five-year survival rate of less than 35%.1,2 Depending on the World Health Organization (WHO) classification scheme, gliomas can be divided into low-grade gliomas (LGG) and glioblastoma multiforme (GBM). Among them, glioblastoma has the worst prognosis with a median survival time of fewer than 1.5 years.3,4 Although several molecular characteristics have been applied to distinguish gliomas subtypes and guide the therapeutic strategy in clinical, including the isocitrate dehydrogenase (IDH) mutation, co-deletion of chromosome arms 1p and 19q (1p19q codeletion), and O-6-methylguanine-DNA methyltransferase (MGMT) methylation,5 glioma patients benefit from these biomarkers is limited. With the constant development of biological information and sequencing, a rising number of studies have demonstrated that glioma patients with the same tumor grade behave significantly differently in terms of survival time, therapeutic response, and molecular characteristics.6–9 Given the heterogeneity of glioma and the deficiency of tumor classification, the identification of important glioma biomarkers is critical for advancing glioma diagnosis and treatment.
Pyroptosis is a novel type of programmed cell death, otherwise known as cell inflammatory death, which is caused by gasdermin-mediated caspase activation and accompanied by the release of several inflammatory mediators.10,11 Initially, pyroptosis is regarded as an anti-infective way of inflammatory cell death against pathogens. However, a growing number of studies have shown that pyroptosis plays an important role in the development of tumors, and there is a close link between pyroptosis and ovarian cancer, gastric cancer, and lung cancer.12–14 Chen et al found that caspase 8 (CASP8) was upregulated in glioma tissues and promoted the progression of glioma cells.15 Zheng J et al constructed a five pyroptosis genes signature to predict glioma patient’s survival.16 Zhang Y et al suggested that caspase 3 (CASP3) and interleukin-18 (IL18) were highly expressed in gliomas and positively correlated with poor survival.17 Although, some studies revealed the relationship between pyroptosis and gliomas, the further association between gliomas and pyroptosis remains unclear.
Given the complex role of pyroptosis in tumors and the possible bad effect on gliomas, in this study, we aimed to determine the difference of pyroptosis genes between gliomas and normal cerebral tissues and constructed a risk signature to reveal its prognostic effect and predict the survival of glioma patients. Based on the result of functional enrichment analysis of differentially expressed genes between low and high-risk groups. Further, we explored the relationship between risk signature and tumor microenvironment.
Materials and Methods
Data Collection
RNA sequencing data (RNA-seq) of 695 glioma patients in the TCGA database and 1152 normal brain tissue samples in the GTEx project were downloaded from the UCSC Xena database (https://xenabrowser.net/datapages/). Additionally, DNA methylation data were downloaded from the UCSC database. We acquired RNA-seq data (mRNAseq_693, mRNAseq_325) and corresponding clinical and survival information from the CGGA database (http://www.cgga.org.cn/). Patients with missing survival data or overall survival (OS) <30 days were excluded, as were those who had been officially advised not to be included in the study. Eventually, a total of 589 primary glioma patients from the TCGA database were determined as a training set. Similarly, 624 patients with primary tumors from the CGGA dataset were included as a validation set. Information of clinic characteristics from two cohorts was listed in Table 1. Interestingly, we found that tumor tissues from the TCGA database were mainly sourced from the cerebral cortex, the corresponding parts of 207 normal brain tissues from the GTEx database were selected as the control samples for differential gene analysis. In addition, we acquired the supplementary clinical information missed in the TCGA database, including IDH mutation status, 1p19q codeletion status, and MGMT methylation status from a supplement table of an article.18 Although the expression data from both UCSC and CGGA datasets had been already normalized to the format of Fragments Per Kilobase of exon model per Million mapped fragments (FPKM), we converted all FPKM data into Transcripts Per Kilobase of exon model per Million mapped reads (TPM) data type to correct the impact of transcription sequencing depth and gene length and used “log2 (TPM + 1)” for the follow-up analysis to reduce the bias caused by excessively expressed values. Subsequently, we collected 57 genes associated with pyroptosis from the Gene Set Enrichment Analysis dataset (http://www.gsea-msigdb.org/,GSEA) and prior reviews.19–22 The research flow chart is shown in Figure 1A.
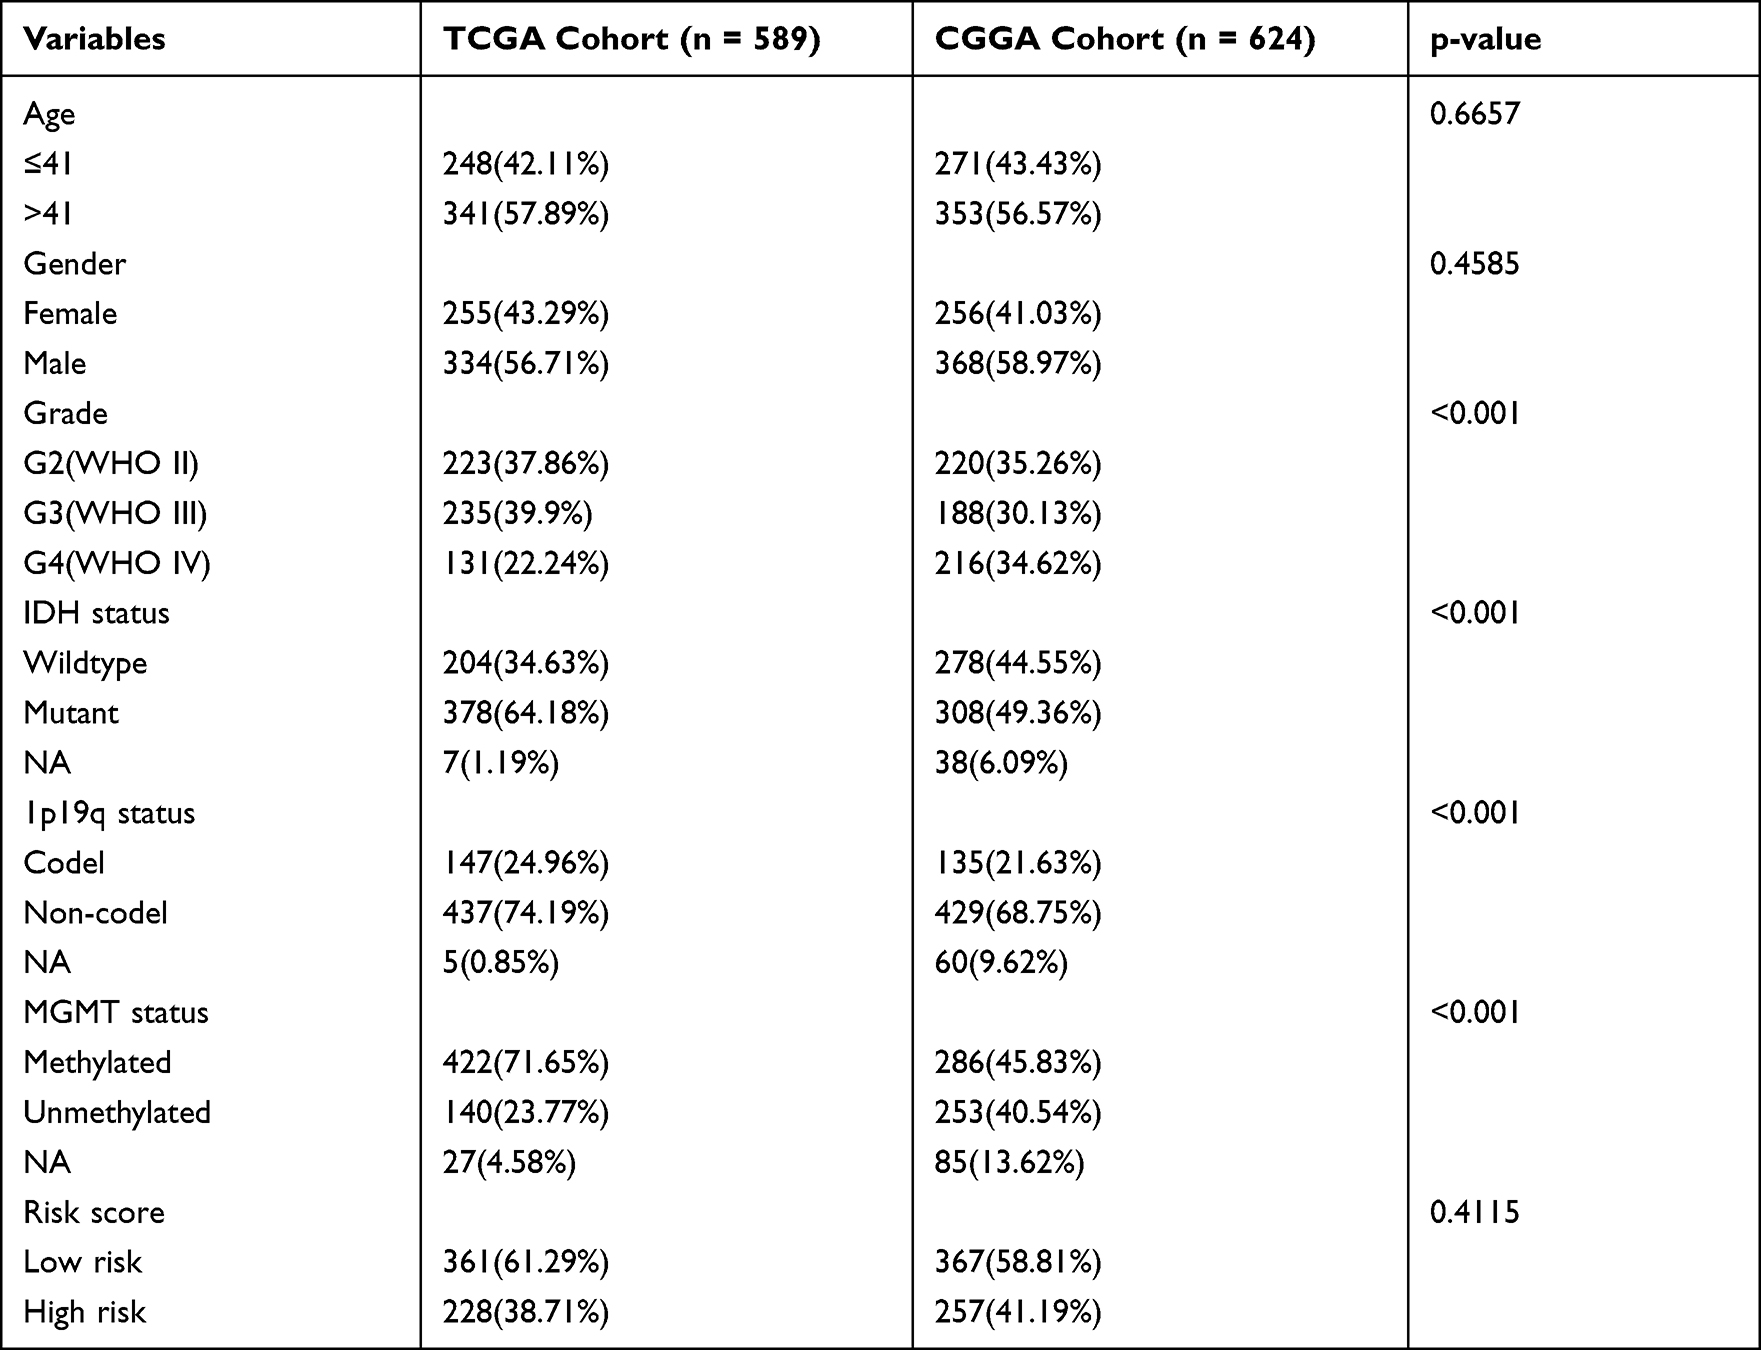 |
Table 1 Clinical Characteristics for Different Cohorts |
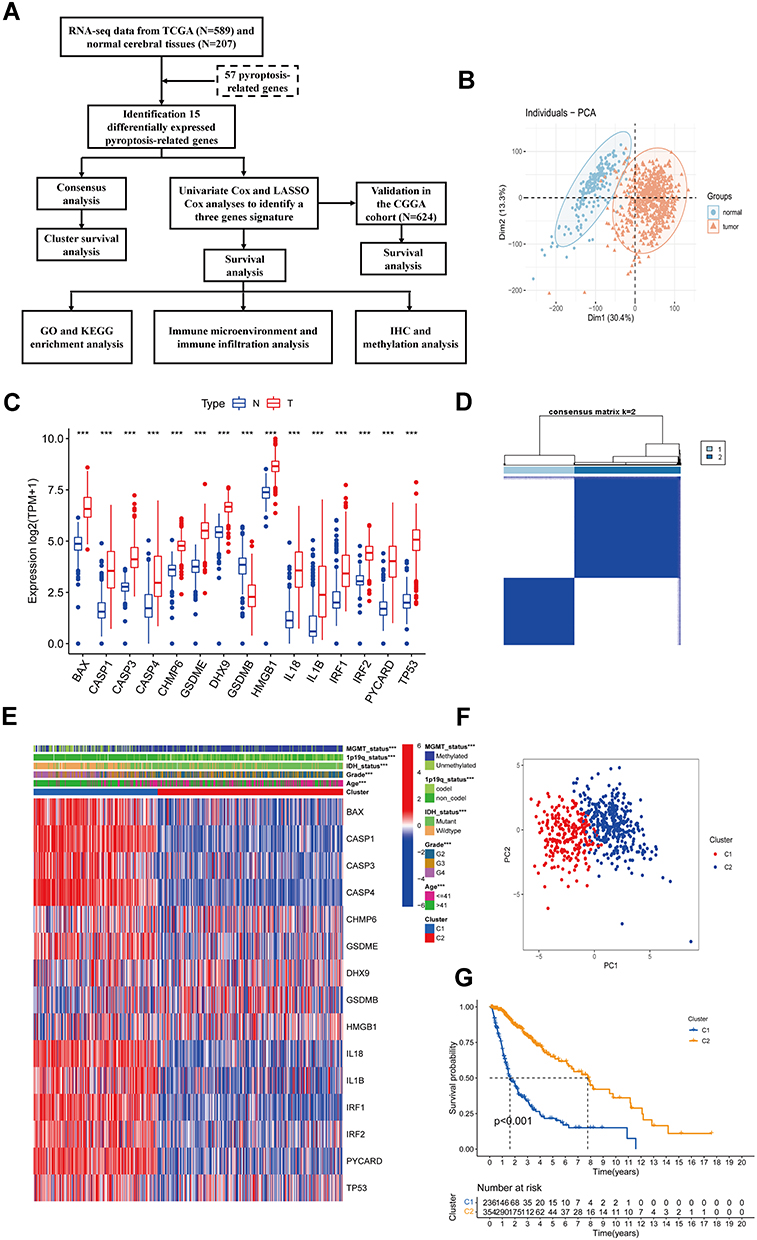 |
Figure 1 Identification of differentially expressed pyroptosis-related genes and association with molecular subtypes. (A) Experimental flow chart. (B) PCA plot of gliomas and normal cerebral cortex from UCSC database. (C) Barplot of expression of differentially expressed pyroptosis-related genes between gliomas and normal samples (“***” represented p-value < 0.001). (D) Heatmap of consensus clustering matrix of 589 glioma patients based on the 15 differentially expressed pyroptosis-related genes in the TCGA cohort (k = 2). (E) The heatmap shows the level of expression of 15 differentially expressed genes between two subgroups and the association between clinical traits. (F) PCA plot of consistent clustering results. (G) Kaplan–Meier survival curves of c1 and c2 subgroups. |
Identification of Differentially Expressed Pyroptosis-Related Genes
Before the analysis of differently expressed genes, we detected the difference between tumor tissue and normal brain tissue through the use of principal component analysis (PCA). Differentially expressed genes (DEGs) between gliomas and normal samples were analyzed using the Analysis of variance (ANOVA),23 with the log2-fold change (logFC) defined as the median gene expression of the tumor group minus the value of the normal group. The DEGs were determined based on the criterion of |logFC|> 1 and an adjusted p-value < 0.05. The p-value was adjusted by the false discovery rate (FDR).
Identification of Molecular Subtypes
Based on the expression levels of differentially expressed pyroptosis genes, 589 patients from the TCGA cohort were clustered through the function of unsupervised consensus clustering (kmax=9) using the R package “ConsensusClusterPlus”. And k=2 was determined as the best cluster. To assess the divergence between clustering C1 and C2, Kaplan-Meier survival curve (KM) analysis was utilized to explore the difference in survival time and a clinical heatmap was used to exhibit the relationship between clinical traits and clustering.
Construction and Evaluation of Prognostic Model Associated with Pyroptosis-Related Genes
For determining the critical pyroptosis genes, univariate Cox proportional hazards regression was initially analyzed with the R package “survival” to obtain statistically significant genes with a criterion of P<0.05. Next, the penalized Lasso Cox proportional hazard regression model, which was an algorithm to prevent over-fitting of the model was employed to further determine the key prognostic genes. An effective prognostic model was constructed based on the expression levels and coefficients of these key genes, and the risk score formula was as follows:24

In this formula, n represents the number of DEGs, βi indicates the coefficient of each key gene, and Expi represents the level of gene expression. The TCGA cohort was split into two subgroups according to an optimal cutoff value. For inspecting the accuracy and feasibility of the risk model, the KM analysis and the ROC curves were employed.25,26 And verified by the external validation dataset CGGA cohort.
Independent Prognostic Analysis
To evaluate whether risk signature could serve as a potential biomarker like various clinical characteristics, univariate and multivariate Cox regression analyses were successively performed. Eventually, all the clinical characters with strongly statistical value identified by univariate Cox regression analysis and the risk score were combined to create a nomogram for predicting the prognosis of glioma patients at 1, 3, and 5 years. ROC curves and calibration curves at 1, 3, and 5 years were used to evaluate the accuracy of the nomogram and the conformity of the prognosis status.
Functional Enrichment Analysis and Immune Correlation Assessment
To explore the functional annotation of DEGs between two risk groupings, it was screened with criteria of the absolute value of log2 fold change >1 and adjusted p-value <0.05. Gene Ontology (GO) and Kyoto Encyclopedia of Genes and Genomes (KEGG) analysis were performed by the online website Database for Annotation, Visualization and Integrated Discovery (DAVID) (https://david.ncifcrf.gov). We used the “Estimate” R package to analyze the tumor microenvironment (TME) of glioma patients based on the findings of functional analysis. The relative proportions of 22 immune cell subsets of glioma samples were computed by applying the CIBERSORTx algorithm on the online website (https://cibersortx.stanford.edu/). The immune cell infiltration ratios were compared in different risk groups. In addition, we used ‘ssGSEA’ algorithm to obtain the infiltration scores of 28 immune cells. Finally, we compared the expression level of Tumor-associated chemokines, immunosuppressive, cytokines, and immune checkpoints in the high and low-risk glioma population.
Immunohistochemistry (IHC)
A total of nine cases of tumor tissues from glioma patients were collected from the pathology department of the Second Hospital of Chongqing Medical University, which was approved by the Human Research Ethics Committee. There were three cases in each of the tumor grades 2, 3, and 4. All glioma tissues were formalin fixed, paraffin embedded, and sectioned into 4-µm serial sections. IHC assays were performed by the horseradish peroxidase (HRP) method. Tissue sections were stained with anti-BAX antibody (1:500 dilution, Servicebio, China) and anti-CASP3 antibody (1: 1000 dilution, Abcam, USA) and anti-CASP4 antibody (1:200 dilution, Proteintech, China) overnight at 4 °C and the secondary antibody was incubated for 1 h at room temperature. After visualizing using 3, 3′-diaminobenzidine (DAB) development, the slides were covered and observed by microscope. We utilized the “IHC Profiler” plugin to compute the percentage of various cell staining intensities.27 Referring to previous research, the cell staining intensity was classified as 4 grades, with 0 points for negative, 1 point for low positive, 2 points for median positive, and 3 points for strong positive.28 The final results were calculated as the score of the cell staining intensity and its percentage of cells.
Statistical Analysis
The analyses of differently expressed genes between two groups were performed using the analysis of variance. Wilcoxon test was used to determine the statistical significance in different groups. Spearman and Pearson ranks were adopted in the correlation analysis. The analysis of survival was tested using the Kaplan-Meier curves. All bioinformatic statistical analyses were completed in the R programming environment (Version 4.1.0) and the IHC statistical analysis was performed by the GraphPad Prism (Version 8.0.1) software.
Results
Identification of Differentially Expressed Pyroptosis Genes in Glioma and Association with Molecular Subtypes
Before differentially expressed genes analysis, the PCA was used to assess the distribution of glioma and normal cerebral cortex samples. The result showed a significant difference in tumor and normal groups (Figure 1B), which suggested the reasonability and accuracy of the data. Then, all the genes in the sample were filtered to exclude the low expression genes with mean TPM < 1, and 17,888 genes were retained. Analysis of variance (ANOVA), a collection of statistical models useful for DEGs analysis, was used to compare the differential expression of genes between two groups. According to the criterion for DEGs, a total of 5827 significant DEGs consisting of 4128 upregulated and 1699 downregulated genes were identified. Based on the GSEA database, prior reviews, and articles, we selected 57 pyroptosis-related genes (PRGs) for analysis, which was shown in Supplementary Table 1. Finally, 15 PRGs with significant differences were selected for further analysis. The expression information of 15 PRGs between gliomas and normal brain tissues was exhibited in a boxplot (Figure 1C). Significantly, the 14 DEGs were remarkably upregulated in gliomas, only gasdermin B (GSDMB) was enriched in normal tissues.
Based on the expression of the 15 differentially expressed PRGs, we performed a consensus clustering analysis with all 589 glioma patients in the TCGA cohort using the R package “ConsensusClusterPlus” to explore the relationship between pyroptosis and molecular subtypes in glioma. We found that when k = 2, the consensus matrix heat map maintained a clear and sharp boundary (Figure 1D), and with significant distribution differences was in PCA (Figure 1E), indicating that all glioma patients could be well divided into two subtypes with significant clustering effects. Interestingly, almost all clinical characteristics were significantly different in the C1 and C2 subtypes (P < 0.001, Figure 1F). Eventually, we conducted a KM survival curve analysis for the survival of the patients with C1 and C2, showing that C1 glioma patients exhibited a shorter survival time compared with the C2 subtype (P < 0.001, Figure 1G).
Construction and Verification of Prognostic Model
To assess the prognostic significance of differentially expressed pyroptosis genes in gliomas, the prognostic genes were screened by univariate Cox regression analysis using the “survival” R package (Figure 2A). With the criterion of P-value < 0.05, 12 prognostic genes were identified with a significant connection to OS and served as candidates for the least absolute shrinkage and selection operator (LASSO) Cox regression analysis, determined the best penalty parameters through 10 rounds of cross-validation (Figure 2B and C). Finally, we obtained three genes BAX, CASP3, and CASP4 for constructing the prognostic model. All three genes were associated with a negative prognosis (hazard ratio [HR] >1, Figure 2A). We compared the AUC of the risk scores, ages, and tumor grades in ROC curves to assess the specificity and sensitivity of the risk signature for predicting pathological features. Notably, the risk signature showed better-predicated efficiency in IDH status (AUC = 0.930), 1p19q status (AUC = 0.821), MGMT status (AUC = 0.791), and clustering (AUC = 0.954, Figure 2D).
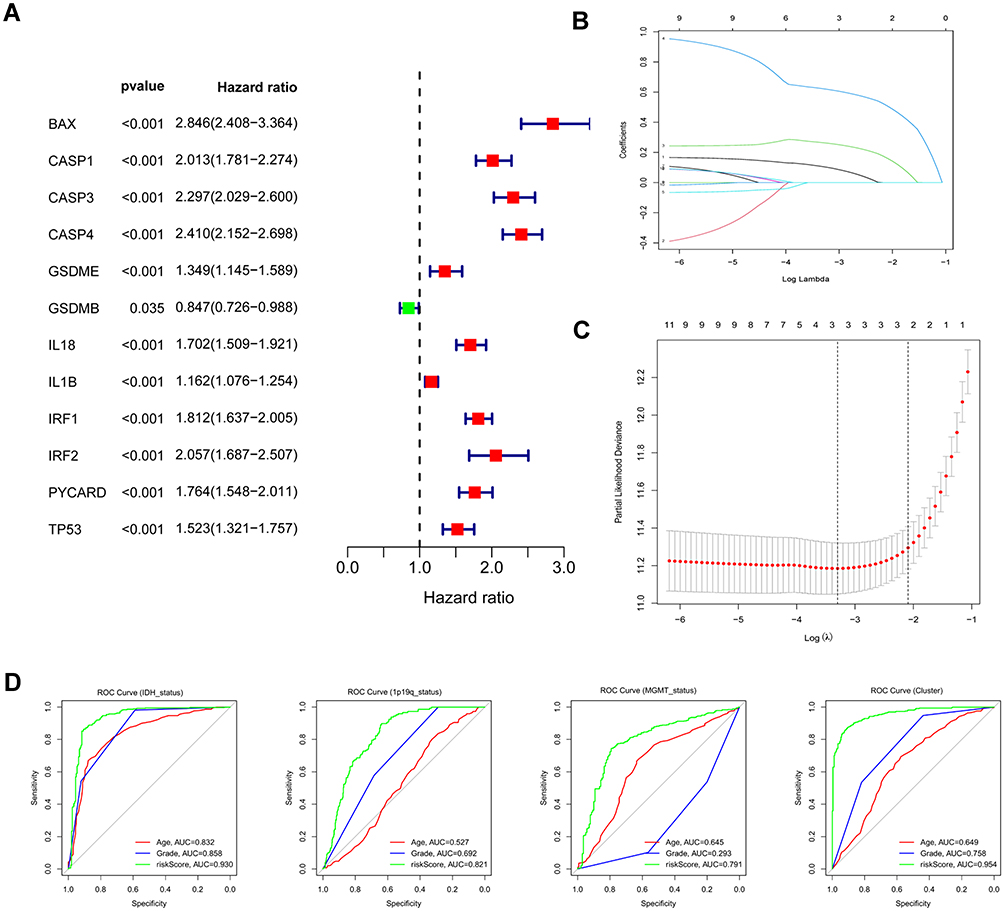 |
Figure 2 Identification of risk signature genes. (A) Univariate Cox regression analysis for all differentially expressed pyroptosis-related genes and obtained 13 prognostic genes with the criterion of p < 0.05. (B) Distribution of LASSO coefficients of 13 candidate genes. (C) 10-fold cross-validation for tuning the parameter selection in the LASSO regression model. (D) ROC curves of risk signature for predicting IDH status, 1p19q status, MGMT status, and clustering. |
Based on the regression coefficient and expression of each genes, the risk score was calculated as follows: risk score = (0.086 * BAX) + (0.252 * CASP3) + (0.607 * CASP4). To obtain the most accurate and efficient grouping, the optimal cutoff value was calculated using the R package “Survminer”.According to the optimal cutoff of risk score of 3.7408, the glioma patients from the TCGA cohort were divided into low- (risk score < 3.7408) and high-risk (risk score > 3.7408) subgroups. From the scatter plot and heatmap, we found that patients belonging to the high-risk subgroup had poorer survival and high expression of the three risk genes (Figure 3A and B). PCA was performed to inspect the grouping effect and the results showed patients were distributed into two groups clearly (Figure 3C). The Kaplan-Meier survival curve revealed that patients with high-risk scores had a bad prognosis compared to those with low-risk scores (P < 0.001, Figure 3D). Analyzed by ROC curves, the AUCs of risk score at 1 year, 3 years, and 5 years were 0.874, 0.888, and 0.829, respectively, showing risk signature had the sensitivity and specificity for predicting survival (Figure 3E). Finally, the risk signature demonstrated excellent predictive value for predicting patients’ five-year survival compared with common clinical features (Figure 3F). All these analyses were validated by the external dataset CGGA cohort and obtained good results (Figure 4A–F), showing that the risk signature could predict the survival of glioma patients accurately.
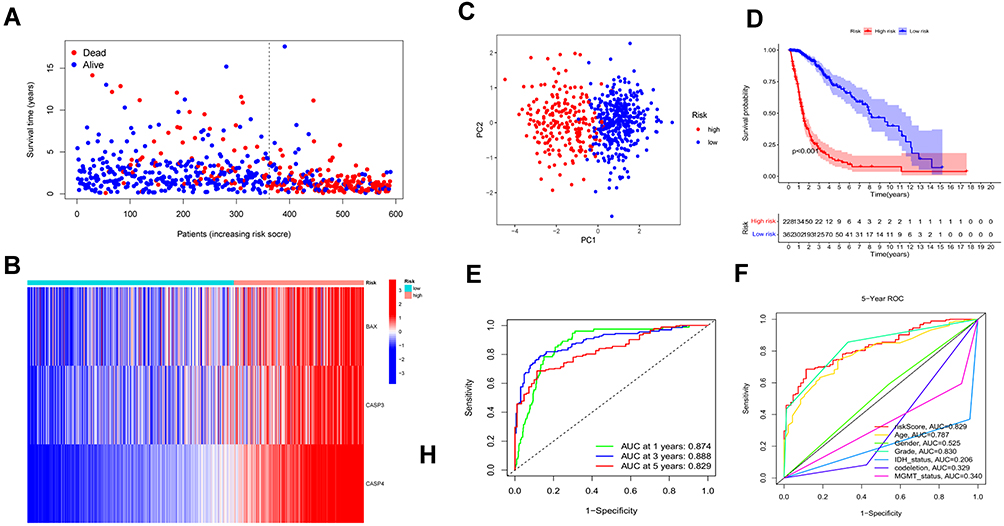 |
Figure 3 Construction and survival analysis of risk signature in the TCGA cohort. (A) Distribution of survival status of 589 patients from the TCGA cohort. (B) Heatmap of the expression of three risk genes in the TCGA cohort. (C) PCA plot showed the distribution of glioma patients based on the risk signatures. (D) Kaplan–Meier survival curves for comparison of survival between low and high-risk subgroups in the TCGA cohort. (E) The time-dependent ROC curve of 1-, 3-, and 5-year and their AUCs. (F) ROC curve of risk score and other indicators at 5 years in the TCGA cohort. |
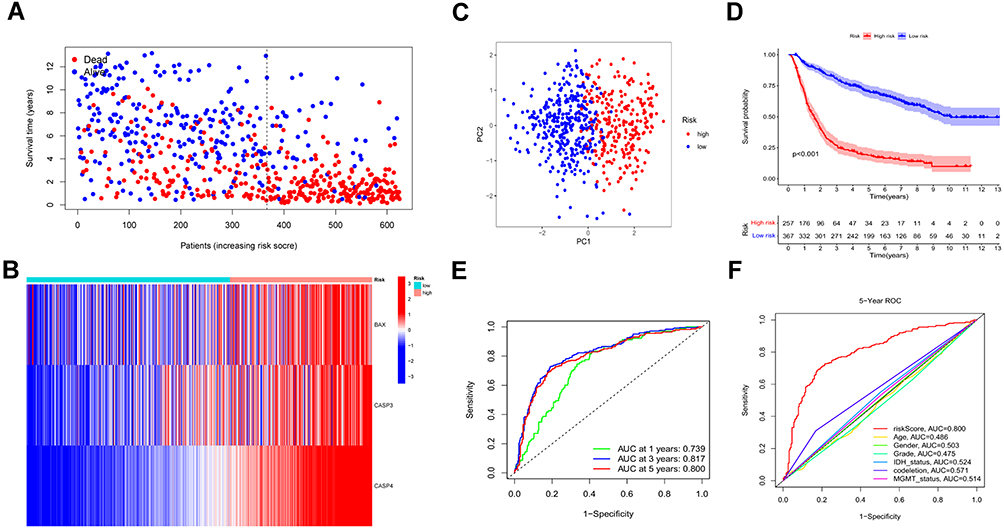 |
Figure 4 Validation of the prognostic model in the CGGA cohort. (A and B) Survival status and the expression of three risk genes of patients between low and high-risk groups. (C) PCA showed the distribution of primary gliomas in the CGGA cohort. (D) KM survival curve of overall survival in the testing set. (E) Time-dependent ROC curve and AUC values for estimating the efficiency of the risk model at 1-, 3-, 5-year. (F) ROC curve of risk score and other indicators at 5 years in the testing set. |
Independent Prognostic Analysis of the Risk Signature and Its Relationship with Clinical Characteristics
Univariable and multivariable Cox regression analyses were performed to determine whether the risk signature served as an independent prognostic factor. As shown in the forest plot (Figure 5A and C), risk score and all clinical characteristics except gender were statistically significant. Next, we further analyzed the factor determined by univariable Cox regression analysis (P < 0.05) by multivariable Cox regression analysis to remove other confounding factors. Eventually, the results revealed that the risk model could serve as an independent risk factor of gliomas in TCGA and CGGA cohort (HR = 1.470, 95% CI:1.143–1.891, HR = 1.370, 95% CI: 1.163–1.614, Figure 5B and D). Meanwhile, the association between risk score and clinical features was examined in the TCGA cohort. By comparing the significance of risk scores between different clinical characteristic parameters, we found that the risk score of patients with age >41, high grades of tumor were significantly higher than those of lower ones. While, patients in the groups of IDH mutant, 1p19q codeletion, MGMT methylation had a lower risk score (Figure 6A). However, there was no difference in the risk scores between males and females (data not shown). All results were consistent with univariate cox analysis and achieved the same results in the CGGA cohort (Figure 6B).
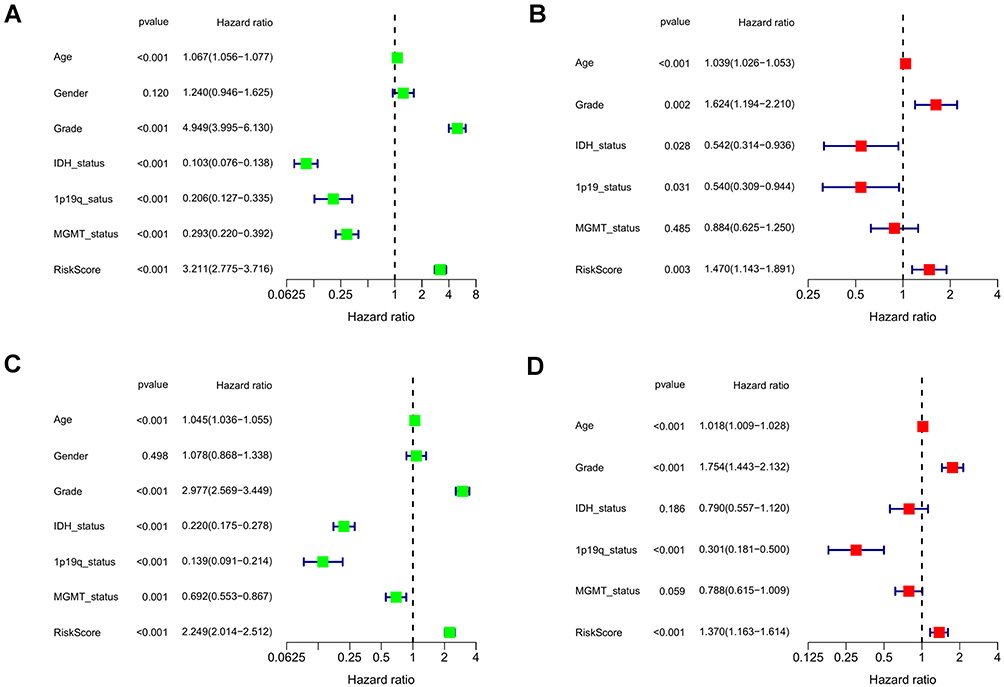 |
Figure 5 Univariate and multivariate independent prognostic analysis of risk score signature. (A and C) Univariable Cox regression analyses of the risk signature and clinical traits with p < 0.05 were considered statistically significant in the TCGA and CGGA cohorts. (B and D) Forest plot of multivariate Cox regression analysis of risk score and clinical characteristics in the training and testing sets. |
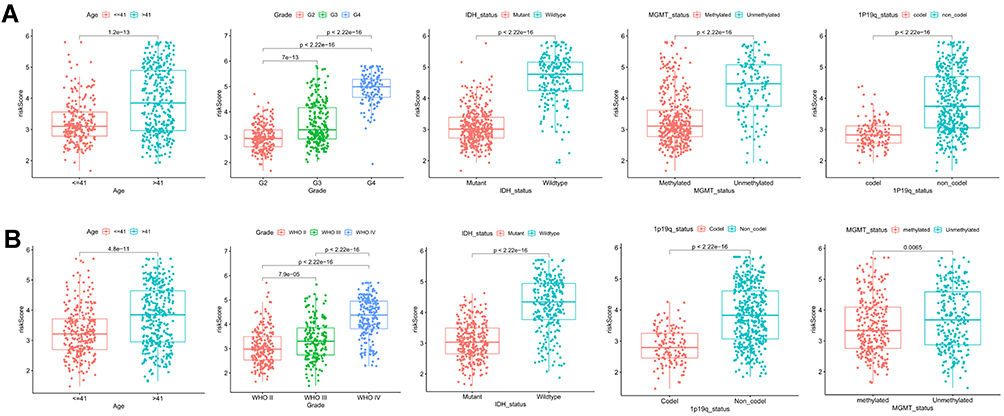 |
Figure 6 Association of risk score with various clinical traits. (A and B) Stratified analysis of risk score with various clinicopathological parameters in glioma patients in the TCGA and CGGA cohorts such as age, grade, IDH status, 1p19q codeletion status, and MGMT methylation status. |
Construction of the Nomogram for Prognostic Prediction of Glioma Patients
Based on the risk score and the clinical characteristic parameters screed by univariable Cox analysis, including age, grade, IDH mutation status, 1p19q codeletion, and MGMT methylation, the nomogram was constructed to individually predict the survival of glioma patients individually (Figure 7A). As shown by the plot (Figure 7B), the 1-, 3-, and 5-year calibration curves demonstrated that The nomogram-predicted OS was in good agreement with the observed OS in the TCGA cohort. And the CGGA cohort had a similar result to the TCGA cohort (Figure 7C). Additionally, ROC curves of nomogram at 1, 3, 5 years in the TCGA and CGGA cohorts indicated it could effectively forecast the prognosis of glioma patients (Figure 7D and E).
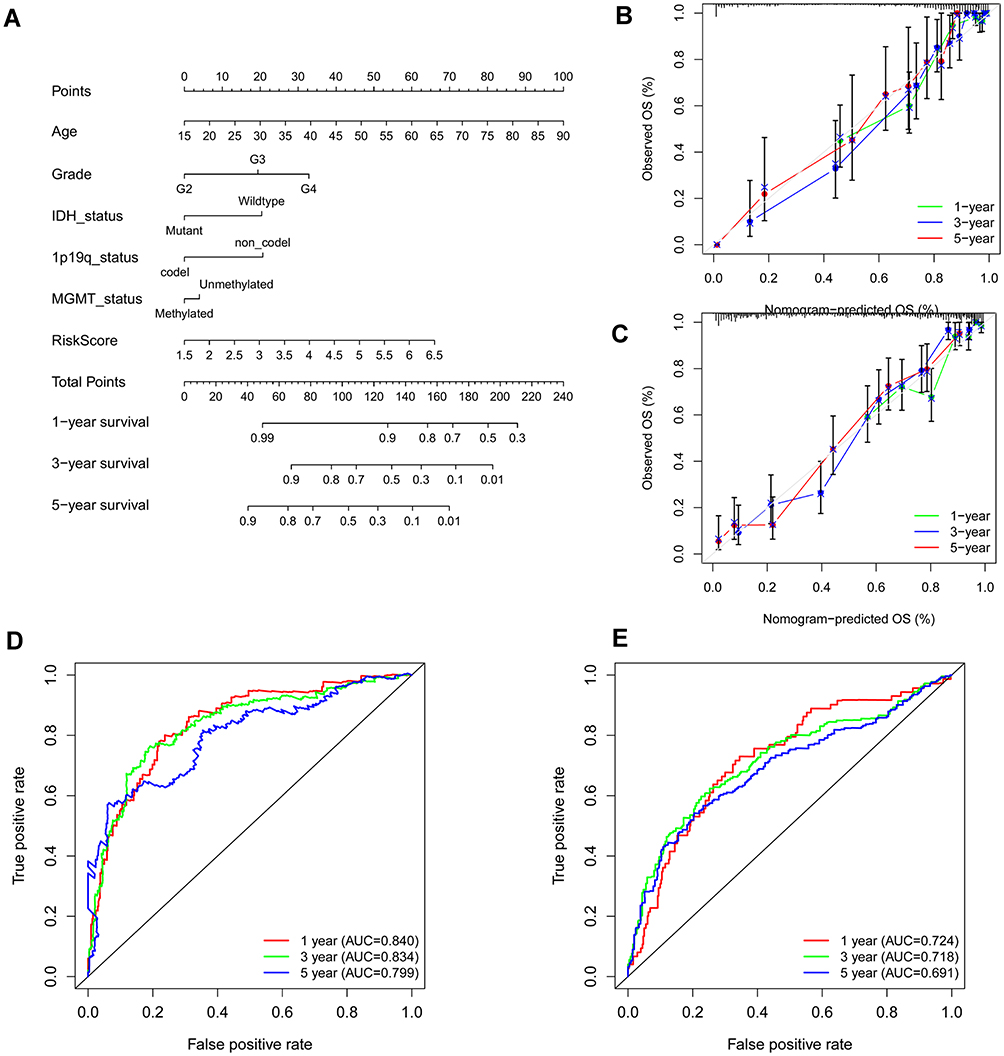 |
Figure 7 Construction of nomogram for predicting overall survival. (A) Nomogram constructed with the risk score and clinical characteristics to predict the probability of 1-, 3-, 5-year survival of patients in the train set. (B and C) Calibration curves of the nomograms for evaluation of the consistency between actual and predicted os times in 1, 3, 5 years. (D and E) ROC curves of nomogram at 1, 3, and 5 years in the training and testing set respectively. |
Functional Enrichment Analysis Based on the Risk Model
To further explore the differences of biological properties and pathways between low and high-risk subgroups, we obtained 2423 DEGs between high and low-risk groups with the criterion of FDR < 0.05 and |log2FC| ≥ 1 by ANOVA. In addition, we focused on the expression level of pyroptosis genes in the two risk groups, shown in Supplementary Figure 1, pyroptosis genes had high expression in populations with high-risk scores. Subsequently, GO and KEGG pathway analyses were performed using the DAVID database to identify the possible biological characteristics. FDR < 0.05 was regarded as the criterion for statistical significance. We visualized the top 20 terms of biological processes (BP) and top 10 terms of KEGG results by bubble plots (Figure 8). The results showed that differentially expressed genes between two risk groups were mainly enriched in the signal transduction, cell adhesion, immune response, inflammatory response, apoptotic process, response to drug, extracellular matrix organization, etc. On the other hand, focal adhesion, HTLV-I infection, phagosome, MAPK signaling pathway, cell adhesion molecules were enriched in KEGG pathways (Figure 8B). Additionally, the GO and KEGG enrichment analyses were detected in the testing cohort. As expected, the results of GO and KEGG analyses in the CGGA cohort were like those in the TCGA cohort (Supplementary Figure 2A, B).
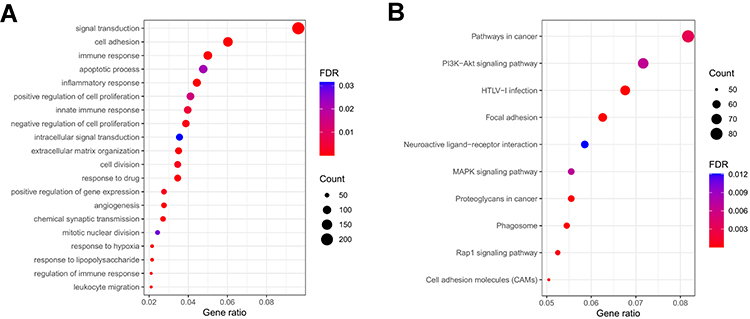 |
Figure 8 Functional analysis based on the DEGs between low and high-risk subgroups in the TCGA cohort. (A) Analysis of biological progress enrichment. (B) Analysis of KEGG enrichment. |
Correlation of Immune Activity with the Risk Gene Signature
According to the results of functional enrichment analysis, we evaluated the links between tumor microenvironment and risk signature in the TCGA cohort by the R package “ESTIMATE”. What stands out in the correlation scatter plots was that the immune score, stromal score, and estimate score were significantly positively correlated with the risk score (R = 0.71, 0.76, 0.75, respectively), while the tumor purity was negatively correlated (R = −0.73, Figure 9A). The TME scores were significantly different between the low and high-risk groups (Supplementary Figure 3). To further determine the degree of immune cell infiltration of the glioma population, the CIBERSORTx algorithm was applied to calculate the absolute proportions of 22 immune cell subsets of patients with gliomas. Consecutively, 588 patients in the TCGA cohort were screened based on the criterion of P-value < 0.05 via the CIBERSORTx algorithm. As shown by the boxplot and the heatmap (Figure 9B and Supplement Figure 2B), multiple immune cells were significantly different between the high and low-risk subgroups. Especially, Macrophages M2 had the highest proportion of infiltration among all immune cells. Memory CD4+T cells, CD8+ T cells, regulatory T cells, follicular helper T cells, monocytes, macrophages (M0, M1, M2), and neutrophils were highly enriched in the high-risk subgroup. Conversely, only B plasma cell was highly infiltrated in the low-risk group. Next, we explored the correlation between 22 immune cells and risk signature, which showed that the three genes BAX, CASP3, and CASP4 were positively associated with immunosuppressive cells such as M2 macrophages, follicular helper T cells, neutrophils, and Tregs. Additionally, we used “ssGSEA” algorithm to calculate the infiltration fraction of 28 immune cells, of which we focus on myeloid-derived suppressor cells (MDSC). MDSC had a higher infiltration in the high-risk group and was positively correlated with the risk score (Figure 9D and E). Finally, we determined the expression level of tumor-associated chemokines, immunosuppressive cytokines, and immune checkpoints in the glioma populations. The data indicated that the expression of these genes was upregulated in the high-risk group (Figure 9F).
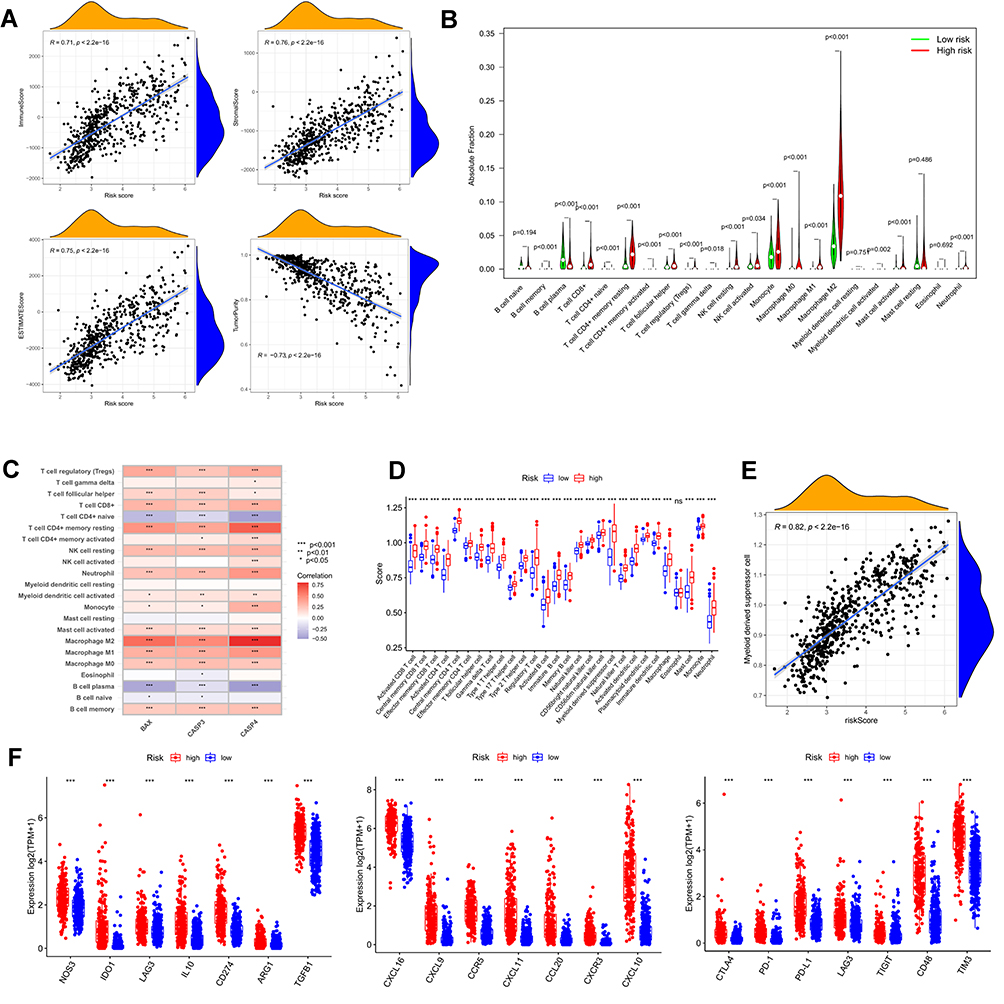 |
Figure 9 Tumor microenvironment and immune analysis of risk model. (A) Correlation scatters plot of risk score and tumor microenvironment score in the training set. (B) Boxplot showed the differences in absolute infiltration score of 22 immune cells calculated by CIBERSORT between the low and high-risk glioma populations. (C) Correlation of BAX, CASP3, CASP4, and 22 immune cells. (D) Difference of 28 immune cells between two risk subgroups calculated by ssGSEA. (E) Correlation of MDSC with the risk score. (F) Difference of tumor-associated chemokine, immunosuppressive cytokine, and immune checkpoint genes in high and low-risk groups. (“***” represented the p-value < 0.001). |
Expression of Risk Genes in Different Grades of Gliomas and Difference of Methylation Levels Between Groups
To further examine the accuracy of the risk signature, we compared the expression levels of the three genes in grade 2-4 of glioma. As shown by the boxplots, the expression level of BAX, CASP3, CASP4 was statistically different in the glioma populations with different tumor grades and was higher in higher grade glioma (Figure 10A). The results of the immunochemistry assay indicated that the protein expression of BAX, CASP3 and CASP4 were significantly different in the gliomas of grade 2-4, which is consistent with the date bioinformatics analysis (Figure 10B–D). Next, we quantified protein expression levels by the Image J plugin “IHC Profiler” and compared them in different tumor grades. These genes had higher protein expression levels in gliomas with grades 3 and 4, which suggested that the risk signature could serve as a potential biomarker for gliomas (Figure 10E). In addition, we compared the protein expression levels of the three risk genes between normal and glioblastoma tissue by the UALCAN database. The results showed that BAX, CASP3, and CASP4 were significantly upregulated in glioblastoma (Supplementary Figure 4A-C). Finally, we compared the DNA methylation levels of these genes in the low and high-risk subgroups, which demonstrated that BAX and CASP4 had higher methylation levels in the low-risk group. However, there was no significant difference in methylation levels of CASP3 between the low and high-risk subgroups (Supplementary Figure 4D).
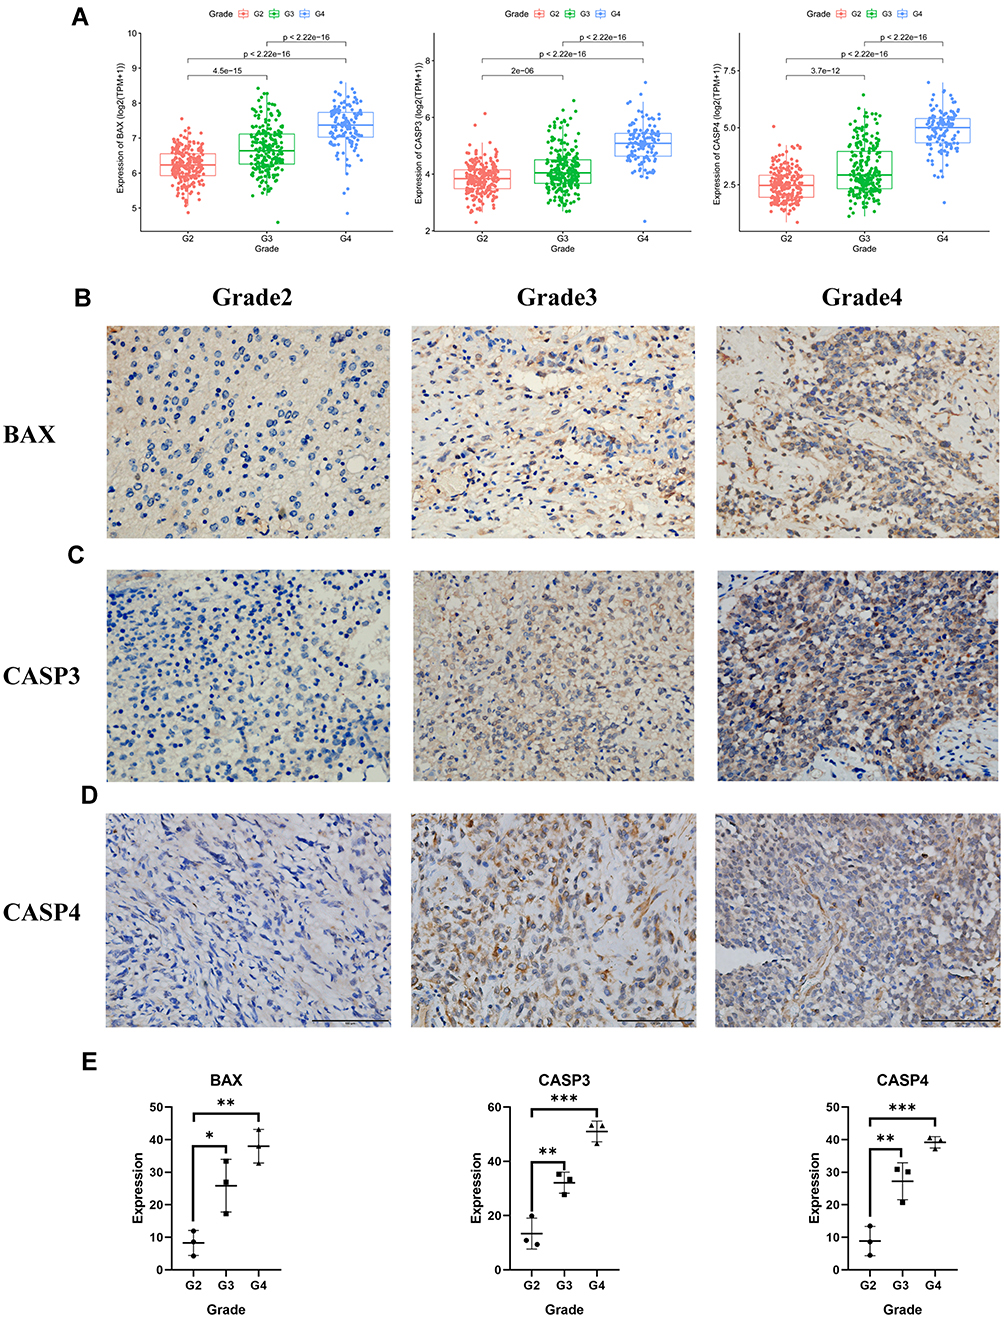 |
Figure 10 The expression of BAX and CASP3 and CASP4 in different grades of gliomas. (A) The expression of the three pyroptosis genes in glioma patients with different grades in the TCGA cohort. (B)–(D) The protein expression level of BAX and CASP3 and CASP4 in the glioma tissues with grades 2, 3, 4 by immunohistochemistry assay (E), *** represented p < 0.001, ** represented p <0.01 and * represented p <0.05). |
Discussion
Pyroptosis had been a research hotspot in recent years. Studies have demonstrated that pyroptosis was linked to the occurrence and progression of various tumors,29 suggesting that it could be a potential target for tumor therapy.30,31 The latest research showed that pyroptosis had the dual role of promoting and inhibiting tumor formation.20 However, the specific mechanism and prognostic values of pyroptosis to gliomas remained unclear. In this study, we combined low-grade gliomas and glioblastoma as a whole to evaluate the association between pyroptosis and gliomas. Of 15 differentially expressed pyroptosis genes between gliomas and the normal cerebral cortex, gasdermin E (GSDME), one of the gasdermin protein family, was the critical gene in pyroptosis and highly expressed in gliomas, suggesting that GSDME may be the key to pyroptosis in gliomas. It was in line with previous findings.32–34 Interestingly, the expression of GSDMB was commonly increased in other tumors to promote the occurrence of pyroptosis.35,36 While it was decreased in this research, which was possibly caused for different tumor properties. Finally, the risk signatures were constructed with the genes of BAX, CASP3, CASP4 determined through the univariate Cox and lasso regression analyses. Among of them, BAX, as a key pro-apoptotic factor, was able to effectively activate CASP3, initiate the CASP cascade, and promote apoptosis.37 CASP3 was a recognized marker of apoptosis. However, studies had found that activation of CASP3 through cleavage GSDME using chemotherapy drugs effectively activated pyroptosis.38,39 And these caspases and granzyme originated from apoptosis progression participated cancer cells pyroptosis (CCP). CASP4, like caspase-1 and caspase-11/5, could induce pyroptosis by cutting the GSDMD protein.40–42 CASP4 had also been shown to be closely related to cancers renal clear cell carcinoma.43,44 At the same time, Li, X.Y et al found that there was a close relationship between CASP4 and glioblastoma.45 Concluding the results of survival analysis, independent prognosis analysis, and nomogram, we found that the risk signature had the accurate effectiveness for predicting survival of patients.
By comparing the enrichment genes between high and low-risk populations and found that pyroptosis genes (BAX, CASP1, CASP3, CASP4, CASP8, GSDMD, GZMA, GSDME, IL-6, IL18, and IL1B) were significantly enriched in high-risk patients, showing that GSDMD was same as GSDME and took part in the progression of pyroptosis in gliomas. From this, we inferred that the biological process of pyroptosis was more activated in the high-risk populations. IL-18, a pro-inflammatory factor, was able to attract more inflammatory cells infiltrated and played an anti-tumor effect. Studies had shown that inflammasome-mediated IL-18 could significantly inhibit colon tumors’ growth.46 While other studies had discovered a different phenomenon that tumors worsened with occasional or prolonged exposure in IL-18.47,48 Unlike IL-18, IL-1B mainly promoted tumor progression by accumulating and activating tumor-infiltrating myeloid cells and promoting angiogenesis and tumor proliferation.49–53 These pyroptotic genes were significantly enriched in the high-risk group and associated with poor prognosis, a possible explanation being related to the long-term effects of IL-18 and IL-1B and other inflammatory factors.
Based on the functional enrichment analysis results, we completed immune analysis and found that the patients with high-risk scores had a more complex immune microenvironment and more immunosuppressive cells infiltration. The risk signature was positively correlated with M2 macrophages, neutrophils, regulatory T cells, and MDSC, indicating pyroptosis affected the composition of the tumor microenvironment to adjust gliomas’ growth. In addition, the glioma populations with high risk had high enrichment of multiple tumor-associated chemokines and immunosuppressive cytokines. Increasing evidence indicated that multiple tumor-associated chemokines,54,55 immunosuppressive cytokines played critical roles in the development of tumors56,57 and it was an important part of the immunosuppressive microenvironment. These chemokines and cytokines could promote tumor development by regulating the cytotoxic properties of T cells and impairing the activity of NK cells and dendritic cells and inducing immunosuppressive cells infiltration.56 With a deeper understanding of the association between inflammation and tumor development, multiple immunosuppressive cytokines and cells could induce the expression of immune checkpoint genes to create an opportunity for glioma cells to escape the anti-tumor activity.58–60 Additionally, some studies found that the expression level of immune checkpoints can sever as a reference to predict effects on immune checkpoints inhibitor (ICI) therapy. Our studies found that patients with high-risk scores had higher expression of immune checkpoint genes such as PD-L1, PD-1, CTLA-4, and TIM-3, indicating that these patients had more chance to benefit from ICI therapy. By synthetically considered, pyroptosis seemed to play an adverse role in the anti-gliomas activity, we think that it was caused by the possible reason that pyroptosis in gliomas released inflammatory cytokines, and attracted infiltration of inflammatory and immunosuppressive cells to construct a chronic immunosuppressive microenvironment. Finally, the protein expression of BAX, CASP3, and CASP4 in different tumor grades confirmed the accuracy of our risk model.
In summary, although our research had built a risk signature related to pyroptosis that was effectively capable to forecast the prognosis of patients and reveal the possible role to the development in glioma, the study has some shortcomings and limitations, no further mechanism research was performed. Subsequent basic experiments are necessitated to deeply explore the mechanisms of pyroptosis in gliomas development, as well as clinical perspective studies for increasing the stability and predictive ability of the risk signature.
Conclusion
In conclusion, we identified that pyroptosis-related genes were highly enriched in higher grade gliomas than lower grade one and normal brain tissues and may have a negative association with the prognosis of glioma patients. We used three genes BAX, CASP3, and CASP4 to construct a risk signature and verified by the CGGA dataset. In addition, the risk signature was validated that it was related to the tumor microenvironment and immune cell infiltration, and we believe that chronic inflammation resulting from pyroptosis creates an immunosuppressive microenvironment that promoted gliomas’ development. The risk signature had the potential to serve as a biomarker for promoting the development of diagnosis and therapy of gliomas and as a reference to further analyze the relationship between immune microenvironment and pyroptosis in gliomas.
Data Sharing Statement
The datasets presented in this study can be found in the online repositories. The names of the repositories and accession numbers can be found in the article and Supplementary Materials.
Ethics Statement
The studies involving human participants were reviewed and approved by the Ethics Committee of the Second Affiliated Hospital of Chongqing Medical University. The participants provided their written informed consent to participate in this study.
Acknowledgments
We acknowledged TCGA and CGGA databases for providing their platform and contributors for uploading their meaningful datasets.
Funding
This study was funded by grants from the National Natural Science Foundation of China (No.81771961) and the Chongqing Natural Science Foundation of China (cstc2021jcyj-msxmX0036).
Disclosure
The authors declare no conflicts of interest.
References
1. Lapointe S, Perry A, Butowski NA. Primary brain tumours in adults. Lancet. 2018;392(10145):432–446. doi:10.1016/s0140-6736(18)30990-5
2. Laug D, Glasgow SM, Deneen B. A glial blueprint for gliomagenesis. Nat Rev Neurosci. 2018;19(7):393–403. doi:10.1038/s41583-018-0014-3
3. Stupp R, Mason WP, van den Bent MJ, et al. Radiotherapy plus concomitant and adjuvant temozolomide for glioblastoma. N Engl J Med. 2005;352(10):987–996. doi:10.1056/NEJMoa043330
4. Stupp R, Hegi ME, Mason WP, et al. Effects of radiotherapy with concomitant and adjuvant temozolomide versus radiotherapy alone on survival in glioblastoma in a randomised Phase III study: 5-year analysis of the EORTC-NCIC trial. Lancet Oncol. 2009;10(5):459–466. doi:10.1016/s1470-2045(09
5. Ludwig K, Kornblum HI. Molecular markers in glioma. J Neurooncol. 2017;134(3):505–512. doi:10.1007/s11060-017-2379-y
6. Brat DJ, Verhaak RG, Aldape KD, et al. Comprehensive, Integrative Genomic Analysis of Diffuse Lower-Grade Gliomas. N Engl J Med. 2015;372(26):2481–2498. doi:10.1056/NEJMoa1402121
7. van den Bent MJ. Interobserver variation of the histopathological diagnosis in clinical trials on glioma: a clinician’s perspective. Acta Neuropathol. 2010;120(3):297–304. doi:10.1007/s00401-010-0725-7
8. Gusyatiner O, Hegi ME. Glioma epigenetics: from subclassification to novel treatment options. Semin Cancer Biol. 2018;51:50–58. doi:10.1016/j.semcancer.2017.11.010
9. Suzuki H, Aoki K, Chiba K, et al. Mutational landscape and clonal architecture in grade II and III gliomas. Nat Genet. 2015;47(5):458–468. doi:10.1038/ng.3273
10. Shi J, Gao W, Shao F. Pyroptosis: gasdermin-Mediated Programmed Necrotic Cell Death. Trends Biochem Sci. 2017;42(4):245–254. doi:10.1016/j.tibs.2016.10.004
11. Kovacs SB, Miao EA. Gasdermins: effectors of Pyroptosis. Trends Cell Biol. 2017;27(9):673–684. doi:10.1016/j.tcb.2017.05.005
12. Ye Y, Dai Q, Qi H. A novel defined pyroptosis-related gene signature for predicting the prognosis of ovarian cancer. Cell Death Discov. 2021;7(1):71. doi:10.1038/s41420-021-00451-x
13. Shao W, Yang Z, Fu Y, et al. The Pyroptosis-Related Signature Predicts Prognosis and Indicates Immune Microenvironment Infiltration in Gastric Cancer. Front Cell Dev Biol. 2021;9:676485. doi:10.3389/fcell.2021.676485
14. Lin W, Chen Y, Wu B, Chen Y, Li Z. Identification of the pyroptosis‑related prognostic gene signature and the associated regulation axis in lung adenocarcinoma. Cell Death Discov. 2021;7(1):161. doi:10.1038/s41420-021-00557-2
15. Chen P, Li Y, Li N, Shen L, Li Z. Comprehensive Analysis of Pyroptosis-Associated in Molecular Classification, Immunity and Prognostic of Glioma. Front Genet. 2021;12:781538. doi:10.3389/fgene.2021.781538
16. Zheng J, Zhou Z, Qiu Y, et al. A Pyroptosis-Related Gene Prognostic Index Correlated with Survival and Immune Microenvironment in Glioma. J Inflamm Res. 2022;15:17–32. doi:10.2147/jir.S341774
17. Zhang Y, Xi F, Yu Q, et al. Identification of a novel pyroptosis-related gene signature correlated with the prognosis of diffuse glioma patients. Ann Transl Med. 2021;9(24):1766. doi:10.21037/atm-21-6011
18. Ceccarelli M, Barthel FP, Malta TM, et al. Molecular Profiling Reveals Biologically Discrete Subsets and Pathways of Progression in Diffuse Glioma. Cell. 2016;164(3):550–563. doi:10.1016/j.cell.2015.12.028
19. Karki R, Kanneganti TD. Diverging inflammasome signals in tumorigenesis and potential targeting. Nat Rev Cancer. 2019;19(4):197–214. doi:10.1038/s41568-019-0123-y
20. Xia X, Wang X, Cheng Z, et al. The role of pyroptosis in cancer: pro-cancer or pro-”host”? Cell Death Dis. 2019;10(9):650. doi:10.1038/s41419-019-1883-8
21. Wang B, Yin Q. AIM2 inflammasome activation and regulation: a structural perspective. J Struct Biol. 2017;200(3):279–282. doi:10.1016/j.jsb.2017.08.001
22. Man SM, Kanneganti TD. Regulation of inflammasome activation. Immunol Rev. 2015;265(1):6–21. doi:10.1111/imr.12296
23. Xia WX, Yu Q, Li GH, et al. Identification of four hub genes associated with adrenocortical carcinoma progression by WGCNA. PeerJ. 2019;7:e6555. doi:10.7717/peerj.6555
24. Li Q, Yang W, Lu M, Zhang R. Identification of a 6-Gene Signature Associated with Resistance to Tyrosine Kinase Inhibitors: prognosis for Clear Cell Renal Cell Carcinoma. Med Sci Monit. 2020;26:e927078. doi:10.12659/msm.927078
25. Tng SS, Le NQK, Yeh HY, Chua MCH. Improved Prediction Model of Protein Lysine Crotonylation Sites Using Bidirectional Recurrent Neural Networks. J Proteome Res. 2022;21(1):265–273. doi:10.1021/acs.jproteome.1c00848
26. Do DT, Le NQK. Using extreme gradient boosting to identify origin of replication in Saccharomyces cerevisiae via hybrid features. Genomics. 2020;112(3):2445–2451. doi:10.1016/j.ygeno.2020.01.017
27. Varghese F, Bukhari AB, Malhotra R, De A, Profiler: IHC. an open source plugin for the quantitative evaluation and automated scoring of immunohistochemistry images of human tissue samples. PLoS One. 2014;9(5):e96801. doi:10.1371/journal.pone.0096801
28. Guo Z, Zhang X, Zhu H, et al. TELO2 induced progression of colorectal cancer by binding with RICTOR through mTORC2. Oncol Rep. 2021;45(2):523–534. doi:10.3892/or.2020.7890
29. Kantono M, Guo B. Inflammasomes and Cancer: the Dynamic Role of the Inflammasome in Tumor Development. Front Immunol. 2017;8:1132. doi:10.3389/fimmu.2017.01132
30. Zhang Z, Zhang Y, Xia S, et al. Gasdermin E suppresses tumour growth by activating anti-tumour immunity. Nature. 2020;579(7799):415–420. doi:10.1038/s41586-020-2071-9
31. Wang Q, Wang Y, Ding J, et al. A bioorthogonal system reveals antitumour immune function of pyroptosis. Nature. 2020;579(7799):421–426. doi:10.1038/s41586-020-2079-1
32. Zhang Z, Zhao S, Yang H, et al. Prognostic and Immunological Role of Gasdermin E in Pan-Cancer Analysis. Front Oncol. 2021;11:706266. doi:10.3389/fonc.2021.706266
33. Chen S, Ma J, Yang L, et al. Anti-glioblastoma Activity of Kaempferol via Programmed Cell Death Induction: involvement of Autophagy and Pyroptosis. Front Bioeng Biotechnol. 2020;8:614419. doi:10.3389/fbioe.2020.614419
34. Kong Y, Feng Z, Chen A, et al. The Natural Flavonoid Galangin Elicits Apoptosis, Pyroptosis, and Autophagy in Glioblastoma. Front Oncol. 2019;9:942. doi:10.3389/fonc.2019.00942
35. Li L, Li Y, Bai Y. Role of GSDMB in Pyroptosis and Cancer. Cancer Manag Res. 2020;12:3033–3043. doi:10.2147/cmar.S246948
36. Zhou Z, He H, Wang K, et al. Granzyme A from cytotoxic lymphocytes cleaves GSDMB to trigger pyroptosis in target cells. Science. 2020;368:6494. doi:10.1126/science.aaz7548
37. Gu Q, Jiao S, Duan K, Wang YX, Petralia RS, The LZ. BAD-BAX-Caspase-3 Cascade Modulates Synaptic Vesicle Pools via Autophagy. J Neurosci. 2021;41(6):1174–1190. doi:10.1523/jneurosci.0969-20.2020
38. Hu L, Chen M, Chen X, et al. Chemotherapy-induced pyroptosis is mediated by BAK/BAX-caspase-3-GSDME pathway and inhibited by 2-bromopalmitate. Cell Death Dis. 2020;11(4):281. doi:10.1038/s41419-020-2476-2
39. Wang Y, Gao W, Shi X, et al. Chemotherapy drugs induce pyroptosis through caspase-3 cleavage of a gasdermin. Nature. 2017;547(7661):99–103. doi:10.1038/nature22393
40. Wang K, Sun Q, Zhong X, et al. Structural Mechanism for GSDMD Targeting by Autoprocessed Caspases in Pyroptosis. Cell. 2020;180(5):941–955.e20. doi:10.1016/j.cell.2020.02.002
41. Shi J, Zhao Y, Wang K, et al. Cleavage of GSDMD by inflammatory caspases determines pyroptotic cell death. Nature. 2015;526(7575):660–665. doi:10.1038/nature15514
42. Kayagaki N, Stowe IB, Lee BL, et al. Caspase-11 cleaves gasdermin D for non-canonical inflammasome signalling. Nature. 2015;526(7575):666–671. doi:10.1038/nature15541
43. Meng L, Tian Z, Long X, et al. Caspase 4 Overexpression as a Prognostic Marker in Clear Cell Renal Cell Carcinoma: a Study Based on the Cancer Genome Atlas Data Mining. Front Genet. 2020;11:600248. doi:10.3389/fgene.2020.600248
44. Meng L, Tian Z, Long X, et al. Prognostic autophagy model based on CASP4 and BIRC5 expression in patients with renal cancer: independent datasets-based study. Am J Transl Res. 2020;12(11):7475–7489.
45. Li XY, Zhang LY, Li XY, Yang XT, Su LX, Pyroptosis-Related Gene A. Signature for Predicting Survival in Glioblastoma. Front Oncol. 2021;11:697198. doi:10.3389/fonc.2021.697198
46. Dupaul-Chicoine J, Arabzadeh A, Dagenais M, et al. The Nlrp3 Inflammasome Suppresses Colorectal Cancer Metastatic Growth in the Liver by Promoting Natural Killer Cell Tumoricidal Activity. Immunity. 2015;43(4):751–763. doi:10.1016/j.immuni.2015.08.013
47. Tsuchiya K. Switching from Apoptosis to Pyroptosis: gasdermin-Elicited Inflammation and Antitumor Immunity. Int J Mol Sci. 2021;22(1):86. doi:10.3390/ijms22010426
48. Hou J, Hsu JM, Hung MC. Molecular mechanisms and functions of pyroptosis in inflammation and antitumor immunity. Mol Cell. 2021;1:135. doi:10.1016/j.molcel.2021.09.003
49. Tu S, Bhagat G, Cui G, et al. Overexpression of interleukin-1beta induces gastric inflammation and cancer and mobilizes myeloid-derived suppressor cells in mice. Cancer Cell. 2008;14(5):408–419. doi:10.1016/j.ccr.2008.10.011
50. Kolb R, Phan L, Borcherding N, et al. Obesity-associated NLRC4 inflammasome activation drives breast cancer progression. Nat Commun. 2016;7:13007. doi:10.1038/ncomms13007
51. Tulotta C, Ottewell P. The role of IL-1B in breast cancer bone metastasis. Endocr Relat Cancer. 2018;25(7):R421–r434. doi:10.1530/erc-17-0309
52. Taniguchi K, Karin M. IL-6 and related cytokines as the critical lynchpins between inflammation and cancer. Semin Immunol. 2014;26(1):54–74. doi:10.1016/j.smim.2014.01.001
53. Weber R, Groth C, Lasser S, et al. IL-6 as a major regulator of MDSC activity and possible target for cancer immunotherapy. Cell Immunol. 2021;359:104254. doi:10.1016/j.cellimm.2020.104254
54. Novak M, Koprivnikar Krajnc M, Hrastar B, et al. CCR5-Mediated Signaling Is Involved in Invasion of Glioblastoma Cells in Its Microenvironment. Int J Mol Sci. 2020;21(12):647. doi:10.3390/ijms21124199
55. Tokunaga R, Zhang W, Naseem M, et al. CXCL9, CXCL10, CXCL11/CXCR3 axis for immune activation - A target for novel cancer therapy. Cancer Treat Rev. 2018;63:40–47. doi:10.1016/j.ctrv.2017.11.007
56. Haque S, Morris JC. Transforming growth factor-β: a therapeutic target for cancer. Hum Vaccin Immunother. 2017;13(8):1741–1750. doi:10.1080/21645515.2017.1327107
57. Widodo SS, Dinevska M, Furst LM, Stylli SS, Mantamadiotis T. IL-10 in glioma. Br J Cancer. 2021. doi:10.1038/s41416-021-01515-6
58. Lu F, Zhao Y, Pang Y, et al. NLRP3 inflammasome upregulates PD-L1 expression and contributes to immune suppression in lymphoma. Cancer Lett. 2021;497:178–189. doi:10.1016/j.canlet.2020.10.024
59. Zhu Z, Zhang H, Chen B, et al. PD-L1-Mediated Immunosuppression in Glioblastoma Is Associated With the Infiltration and M2-Polarization of Tumor-Associated Macrophages. Front Immunol. 2020;11:588552. doi:10.3389/fimmu.2020.588552
60. Chen S, Crabill GA, Pritchard TS, et al. Mechanisms regulating PD-L1 expression on tumor and immune cells. J Immunother Cancer. 2019;7(1):305. doi:10.1186/s40425-019-0770-2
 © 2022 The Author(s). This work is published and licensed by Dove Medical Press Limited. The full terms of this license are available at https://www.dovepress.com/terms.php and incorporate the Creative Commons Attribution - Non Commercial (unported, v3.0) License.
By accessing the work you hereby accept the Terms. Non-commercial uses of the work are permitted without any further permission from Dove Medical Press Limited, provided the work is properly attributed. For permission for commercial use of this work, please see paragraphs 4.2 and 5 of our Terms.
© 2022 The Author(s). This work is published and licensed by Dove Medical Press Limited. The full terms of this license are available at https://www.dovepress.com/terms.php and incorporate the Creative Commons Attribution - Non Commercial (unported, v3.0) License.
By accessing the work you hereby accept the Terms. Non-commercial uses of the work are permitted without any further permission from Dove Medical Press Limited, provided the work is properly attributed. For permission for commercial use of this work, please see paragraphs 4.2 and 5 of our Terms.