")
Back to Journals » International Journal of Chronic Obstructive Pulmonary Disease » Volume 16
A Proteomics-Based Analysis of Blood Biomarkers for the Diagnosis of COPD Acute Exacerbation
Authors Kim SH, Ahn HS , Park JS, Yeom J, Yu J, Kim K, Oh YM
Received 24 February 2021
Accepted for publication 19 April 2021
Published 1 June 2021 Volume 2021:16 Pages 1497—1508
DOI https://doi.org/10.2147/COPD.S308305
Checked for plagiarism Yes
Review by Single anonymous peer review
Peer reviewer comments 3
Editor who approved publication: Dr Richard Russell
Soo Han Kim,1,* Hee-Sung Ahn,2,* Jin-Soo Park,2 Jeonghun Yeom,3 Jiyoung Yu,2 Kyunggon Kim,2– 6 Yeon-Mok Oh7
1Department of Internal Medicine, Biomedical Research Institute, Pusan National University Hospital, Busan, 49241, Korea; 2Asan Institute for Life Science, Asan Medical Center, Seoul, Korea; 3Convergence Medicine Research Center, Asan Institute for Life Sciences, Asan Medical Center, Seoul, Korea; 4Department of Biomedical Sciences, University of Ulsan College of Medicine, Seoul, Korea; 5Clinical Proteomics Core Laboratory, Convergence Medicine Research Center, Asan Medical Center, Seoul, Korea; 6Bio-Medical Institute of Technology, Asan Medical Center, Seoul, Korea; 7Department of Pulmonary and Critical Care Medicine, University of Ulsan College of Medicine, Asan Medical Center, Seoul, Korea
*These authors contributed equally to this work
Correspondence: Kyunggon Kim
Department of Biomedical Sciences, University of Ulsan College of Medicine, 88 Olympic-ro 43-gil, Songpa-gu, Seoul, 05505, Republic of Korea
Tel +82-2-3010-4633
Email [email protected]
Yeon-Mok Oh
Department of Pulmonary and Critical Care Medicine, University of Ulsan College of Medicine, Asan Medical Center, 88 Olympic-ro 43-gil, Songpa-gu, Seoul, 05505, Republic of Korea
Tel +82-2-3010-3136
Email [email protected]
Purpose: The identification of blood biomarkers to diagnose acute exacerbation of chronic obstructive pulmonary disease (AECOPD) will have clinical utility. Here, we used a proteomics-based approach to identify biomarkers capable of identifying AECOPD.
Patients and Methods: This prospective, single-center pilot study enrolled 12 patients who came to Asan Medical Center (South Korea) via the outpatient clinic or emergency department with symptoms of AECOPD and were follow-up in the outpatient clinic during convalescence between 2015 and 2017. Paired blood samples collected from each patient during the treatment naïve AECOPD and convalescence stages were analyzed. A sequential window acquisition of all theoretical fragmentation spectra-mass spectrometry (SWATH-MS)-based proteome analysis was performed and a subset of the data were verified by ELISA.
Results: The SWATH-MS analysis identified 226 plasma proteins across all samples examined. The median coefficient of variation for triplicate technical replicates of each sample was 1.13 ± 1.38%, indicating high precision of the technique. Fold-change and paired t-test analyses revealed that 14 proteins were present at higher levels in the AECOPD samples than in the convalescence samples. A gene ontology analysis revealed that these proteins are involved in the acute-phase response. A total of 15 proteins were present at higher levels during the recovery (convalescence) stage than during the acute exacerbation phase, and gene ontology analysis revealed that these proteins are related to lipid metabolism and transport. Verification of the SWATH-MS data was performed using ELISAs for three proteins that were up-regulated in AECOPD, namely, LBP, ORM2, and SERPINA3. Among them, SERPINA3 (p = 0.005) was up-regulated significantly in AECOPD compared with the convalescence state.
Conclusion: Potential plasma biomarkers of AECOPD were discovered using the SWATH-MS proteomics method, and functional molecular associations were investigated. SERPINA3 could be a promising diagnostic biomarker for the early identification and tracking of AECOPD.
Keywords: COPD, plasma, biomarker, ELISA, SWATH, mass spectrometry
Introduction
Chronic obstructive pulmonary disease (COPD) is characterized by irreversible airflow restrictions, which occur as a result of chronic airway inflammation and parenchymal destruction.1 With an estimated prevalence of 11.7% in the adult population,2 COPD is a heterogenous and complex disease that has a high mortality rate and represents a significant burden to the healthcare system. Indeed, it has been estimated that COPD will be the third leading cause of deaths worldwide by 2030.3 Furthermore, COPD is a risk factor for lung cancer, which is the leading cause of cancer-related death worldwide with a 5-year survival rate of 15%.4–6 It is also known to aggravate the prognosis of lung cancer due to higher morbidity and mortality.4
Acute exacerbation of COPD (AECOPD) is characterized by an acute aggravation of respiratory symptoms, leading to the need for further treatment.7 Key symptoms of AECOPD include increased dyspnea, frequent coughing and wheezing, and increased sputum volume and purulence.8 AECOPD can be triggered by a number of factors, including bacterial or viral infection, environmental pollutants, cold weather, and interruption of regular treatment, and can have a high economic and social burden.9,10 For example, AECOPD is associated with temporary or permanent loss of lung function and a rapid decline in exercise capacity and quality of life, leading to hospitalization or sometimes death.11 Although diagnostic monitoring of AECOPD is one of the primary goals of COPD management, there is still no clear and objective diagnostic tool. Currently, the diagnosis of AECOPD relies solely on the clinical presentation of the patient, which is hampered by the complexity and heterogeneity of the disease.
Several studies have evaluated the characteristics of AECOPD. The traditional approach has been to use the clinical phenotype to classify individuals into groups based on similar clinical symptoms, prognosis, and response to treatment. For example, the Spanish COPD Guidelines (GesPOC) define the various clinical phenotypes as follows: non-exacerbator phenotype with either chronic bronchitis or emphysema; asthma-COPD overlap syndrome; frequent exacerbator phenotype with emphysema; and frequent exacerbator phenotype with chronic bronchitis.12 However, this method of classifying COPD is limited by the overlap of phenotypes and the possibility that different biological mechanisms may exist within the same phenotype group.
Moreover, molecular diagnostic analyses using multi-omics approaches have also been used to characterize and diagnose COPD.13 Multi-omics is a tool for analyzing complex datasets, including genomic, transcriptomic, proteomic, and metabolomic data.14 In particular, some studies have attempted to identify blood biomarkers of COPD and AECOPD.15,16 One study reported that the serum level of IGFBP7 is up-regulated in AECOPD.17 In recent years, sequential windowed acquisition of all theoretical fragment ion spectra-mass spectrometry (SWATH-MS),18 a type of data-independent acquisition (DIA), has been used to discover clinical biomarkers.19–21 With this next generation proteomics method that considers both the selected reaction monitoring (SRM) and data-dependent acquisition (DDA) methods, it is possible to obtain stable quantitative information with high reproducibility for as many proteins as possible.22 Here, we used SWATH-MS to discover novel biomarkers that are increased in AECOPD and reduced in the recovery phase.
Patients and Methods
Study Population and Design
This prospective, single-center pilot study enrolled 12 patients who came to Asan Medical Center (South Korea) via the outpatient clinic or emergency department with symptoms of AECOPD, and then underwent follow-up treatment in the outpatient clinic between 2015 and 2017. Blood samples were collected from each patient during the treatment naïve AECOPD and stable COPD (convalescence) stages. All patients visited the Asan Medical Center within 14 days after the onset of AECOPD symptoms. A follow-up visit with sampling was performed at least 6 weeks after discharge. This study was approved by the Institutional Review Board (IRB) of Asan Medical Center (IRB number: 2019–0581) and was based on a previous study cohort of AECOPD patients (IRB number: 2015–0088). All patients provided written informed consent. This study was conducted in accordance with the principles of the Declaration of Helsinki.
The diagnosis of COPD was based on the Global Initiative for Chronic Obstructive Lung Disease (GOLD) criteria (a compatible history [example: age ≥40 years, history of smoking] and spirometry findings [a post bronchodilator forced expiratory volume in one second (FEV1)/forced vital capacity (FVC) ratio of ≤70%]).1 AECOPD was also defined using the GOLD criteria.23,24 We defined convalescence of COPD as having no symptoms correlated with exacerbation and no requirement for additional treatment above maintenance therapy, other than bronchodilator administration, with minimum two weeks after discharge.
The study inclusion criteria were as follows: 1) COPD diagnosis by the GOLD criteria; 2) patient required a visit to the outpatient clinic or emergency department for treatment within 2 weeks after the onset of AECOPD symptoms; and 3) paired blood samples were available from the treatment naïve AECOPD and stable COPD states. The exclusion criteria were as follows: 1) age <40 years; 2) signs of pneumonia on chest X-ray; 3) presence of other pulmonary comorbidities (for example, bronchiectasis, tuberculosis destroyed lung, active pulmonary tuberculosis, lung cancer, interstitial lung disease, pulmonary arterial hypertension, or sarcoidosis); 4) pregnant or breastfeeding; and 5) presence of other comorbidities that could cause death or disability (such as cancer, heart failure, coronary artery disease, cerebrovascular disease, chronic kidney disease, diabetes with major complications, or uncontrolled hypertension).
Clinical Variables
The following baseline parameters were reviewed retrospectively: full medical history (age, sex, body mass index, medical history, medication [including inhalers and steroids], smoking history, and exacerbation history), laboratory blood test results, sputum test results, electrocardiogram results, oxygen saturation (SpO2), blood gas analysis, chest radiograph, chest computed tomography, pulmonary function test (PFT), and quality of life questionnaire (for example, COPD Assessment Test). In addition, the treatment history, recovery period of AECOPD, and date of death or last follow-up after enrollment were also reviewed.
Plasma Sample Collection
Blood samples (12 mL) were collected during the AECOPD and convalescence states in tubes containing ethylenediaminetetraacetic acid. Plasma was prepared by centrifugation for 15 min at 2500 × g and 4°C, and then frozen in aliquots at −80°C.
Protein Digestion and Sample Preparation
Paired plasma samples collected from patients in the AECOPD and convalescent COPD states were used for the proteomic analysis. First, a 40 μL aliquot of plasma was diluted 4-fold and injected into a MARS14 column (100 × 4.6 mm; Agilent Technology, Palo Alto, CA, USA) on a binary HPLC system (20A Prominence, Shimadzu, Tokyo, Japan). The unbound fraction was lyophilized with a cold trap (CentriVap Cold Traps, Labconco, Kansas City, MO, USA). Next, protein digestion was conducted using suspension-trapping sample preparation.25 The lyophilized protein was resuspended in 400 μL of 5% SDS in 50 mM TEAB (pH 7.55), and disulfides were reduced by adding dithiothreitol to a final concentration of 20 mM and incubating for 10 min at 95°C. Cysteines were alkylated by the addition of iodoacetamide to a final concentration of 40 mM, and the samples were then cooled to room temperature and incubated in the dark for 30 min. Subsequently, the samples were diluted 10-fold in 12% phosphoric acid. Each sample was then loaded onto a S-Trap mini column (CO2-mini-80; ProtiFi, Farmingdale, NY, USA) along with 10 μg of Lys-C/trypsin mixture, and the column was incubated for 1 h at 47°C. The eluted peptide mixture was lyophilized with a cold trap and stored at −80°C until use.
Mass Spectrometry Analysis
Prior to liquid chromatography-tandem mass spectrometry (LC-MS/MS) analyses, dried peptide samples were reconstituted in 0.1% formic acid and the total peptide concentrations were measured using a UV/Vis spectrophotometer (NanoDrop One, Thermo Fisher Scientific, Waltham, MA, USA) at a wavelength of 280 nm, with the sample type option set to “1 Abs = 1 mg/mL”. Subsequently, for calibration of the retention time, the iRT-standard provided by the iRT-Kit (Biognosys AG, Schlieren, Switzerland) was added to the sample at a 1/10 dilution, according to the manufacturer’s instructions.26 Each 40 μg sample was dissolved in a total volume of 40 μL. The injected samples (4 μL) were analyzed using a SCIEX TripleTOF 5600+ mass spectrometer system. For LC separation, the ekspertTM nanoLC 425 system (Eksigent, Dublin, CA, USA) was used with an Eksigent micro trap cartridge (ChromXP C18CL, 5 μm, 120 Å) as the trap column, and an Eksigent column (C18-CL, 0.3×150 mm, particle size 3 μm, pore size 120 Å) as the analytical column. The column temperature was maintained at 40°C. The samples were loaded onto the trap column using 100% eluent A (0.1% formic acid) at a flow rate of 10 μL/min. After 10 min, the peptide mixtures were separated for 57 min using eluent A and eluent B (0.1% formic acid in 100% acetonitrile). Eluent B was supplied at a flow rate of 5 μL/min and was increased from 3% to 25% over 38 min, 25% to 32% over 5 min, and 32% to 80% over 2 min, kept at 80% for 3 min, and then reduced to 3% over 1 min and kept at 3% for a further 8 min. For each sample, all mass spectrometry runs were operated in SWATH mode using 100 variable windows, as per the SCIEX technical notes. The SWATH parameters were as follows: lower m/z limit, 400; upper m/z limit, 1250; window overlap (Da), 1.0; CES, 5 for the smaller windows, 8 for the larger windows, and 10 for the largest windows. MS2 spectra were collected in the 100–1500 m/z range for 2.5 ms in the high sensitivity mode and the total cycle time was 2.8 s. Other MS parameters were set as follows: ion source gas 1 (GS1), 15; ion source gas 2 (GS2), 20; curtain gas (CUR), 30; temperature (TEM), 250°C; ion spray voltage floating (ISVF), 5500. Triplicate LC-MS/MS runs were analyzed, giving a total of 72 files (12 patients, two plasma samples, three replicates of each).
SWATH Data Analysis
The DIA files for individual samples were processed using Spectronaut Professional + x64 (13.12.200217.43655) and compared with a pan-human protein mass spectrometry library.27 Default analysis settings were used, with the following minor changes: the false discovery rate (FDR) of protein identification was set to 5% and a maximum of six precursors was used for quantification. For peptide/protein quantification, the peak area of fragment ions was used and the mean peptide quantity was measured. The results of protein quantification were further processed and analyzed using R (ver. 3.6.0). All data were log2 transformed and the differences between protein levels in groups were compared using paired t-tests with Benjamini’s-Hochberg’s correction of the p-value (q-value). The resulting q-value of 0.05 was set as a cut-off.
Validation with ELISA
ELISA analyses were performed to validate the potential biomarkers identified via SWATH-MS. The following ELISA kits were used: alpha 1 antichymotrypsin (Product ID ab157706; Abcam, Cambridge, UK), lipopolysaccharide-binding protein (Product ID: DY870-05; R&D Systems, Minneapolis, MN, USA), and alpha-1-acid glycoprotein 2 (Product ID: MBS763511; MyBioSource, San Diego, CA, USA). Briefly, 96-well microplates were coated with monoclonal antibodies by incubating each well at 4°C overnight with 50 μL of antibody in phosphate buffer (pH 7.4). After removal of the coating buffer, the coated plate was blocked with PBS containing 1% BSA (100 μL/well) for 1 h at room temperature. The plates were then washed three times with 200 μL of 0.05% Tween-20 in PBS. Subsequently, the samples and standard were dispensed into the coated wells (100 μL/well, in duplicate) and the plates were incubated for 1 h at room temperature, after which they were washed three times with 0.05% Tween-20 in PBS. For detection, a biotinylated or horseradish peroxidase-conjugated antibody was dispensed into each well and the plates were incubated for 1.5 h (biotinylated) or 30 min (horseradish peroxidase) at room temperature. The plates were then washed a further three times with 0.05% Tween-20 in PBS. TMB substrate solution was dispensed into each to develop the color reaction and the reaction was stopped by the addition of stop solution (0.18 M sulfuric acid). The absorbance was then measured at 405 nm using a microplate reader (BioRad).
Statistical Analysis
The demographic factors are presented as the median and interquartile range (IQR). For the proteomic data, principal component analyses and volcano plots were performed using R (version 3.6.0; R Foundation for Statistical Computing). Differentially expressed proteins were identified using paired t-tests to compare the normalized protein abundances in the AECOPD and convalescence groups. The p-value was corrected using the Benjamini-Hochberg method. For the ELISA results, paired t-tests were used to compare the mean values in the AECOPD and convalescence groups.
Functional Annotation
Proteins that were differentially expressed between the AECOPD and convalescence groups were annotated by the rapid integration of term annotation and network resources (RITAN) R package.28 Only the “GO” functional annotation database was selected. Only terms with an FDR <0.0001 were selected.
Results
Baseline Characteristics of the Study Population
After excluding 19 patients, a total of 12 male patients diagnosed with COPD were enrolled in the study (Figure 1). Paired blood samples collected in the exacerbation and convalescence stages were available for all patients. The clinical factors of all patients during the exacerbation stage, including age, BMI, smoking status, and pulmonary function test, are described in Table 1. The median age of the study population was 68.5 years (IQR = 7.25 years) and the median BMI was 23.95 kg/m2 (IQR = 4.53 kg/m2). In terms of the spirometry results, the median FEV1 was 48% (IQR = 21.75%), the median FVC was 81.5% (IQR = 22.25%), and the median FEV1/FVC ratio was 0.405 (IQR = 0.1225).
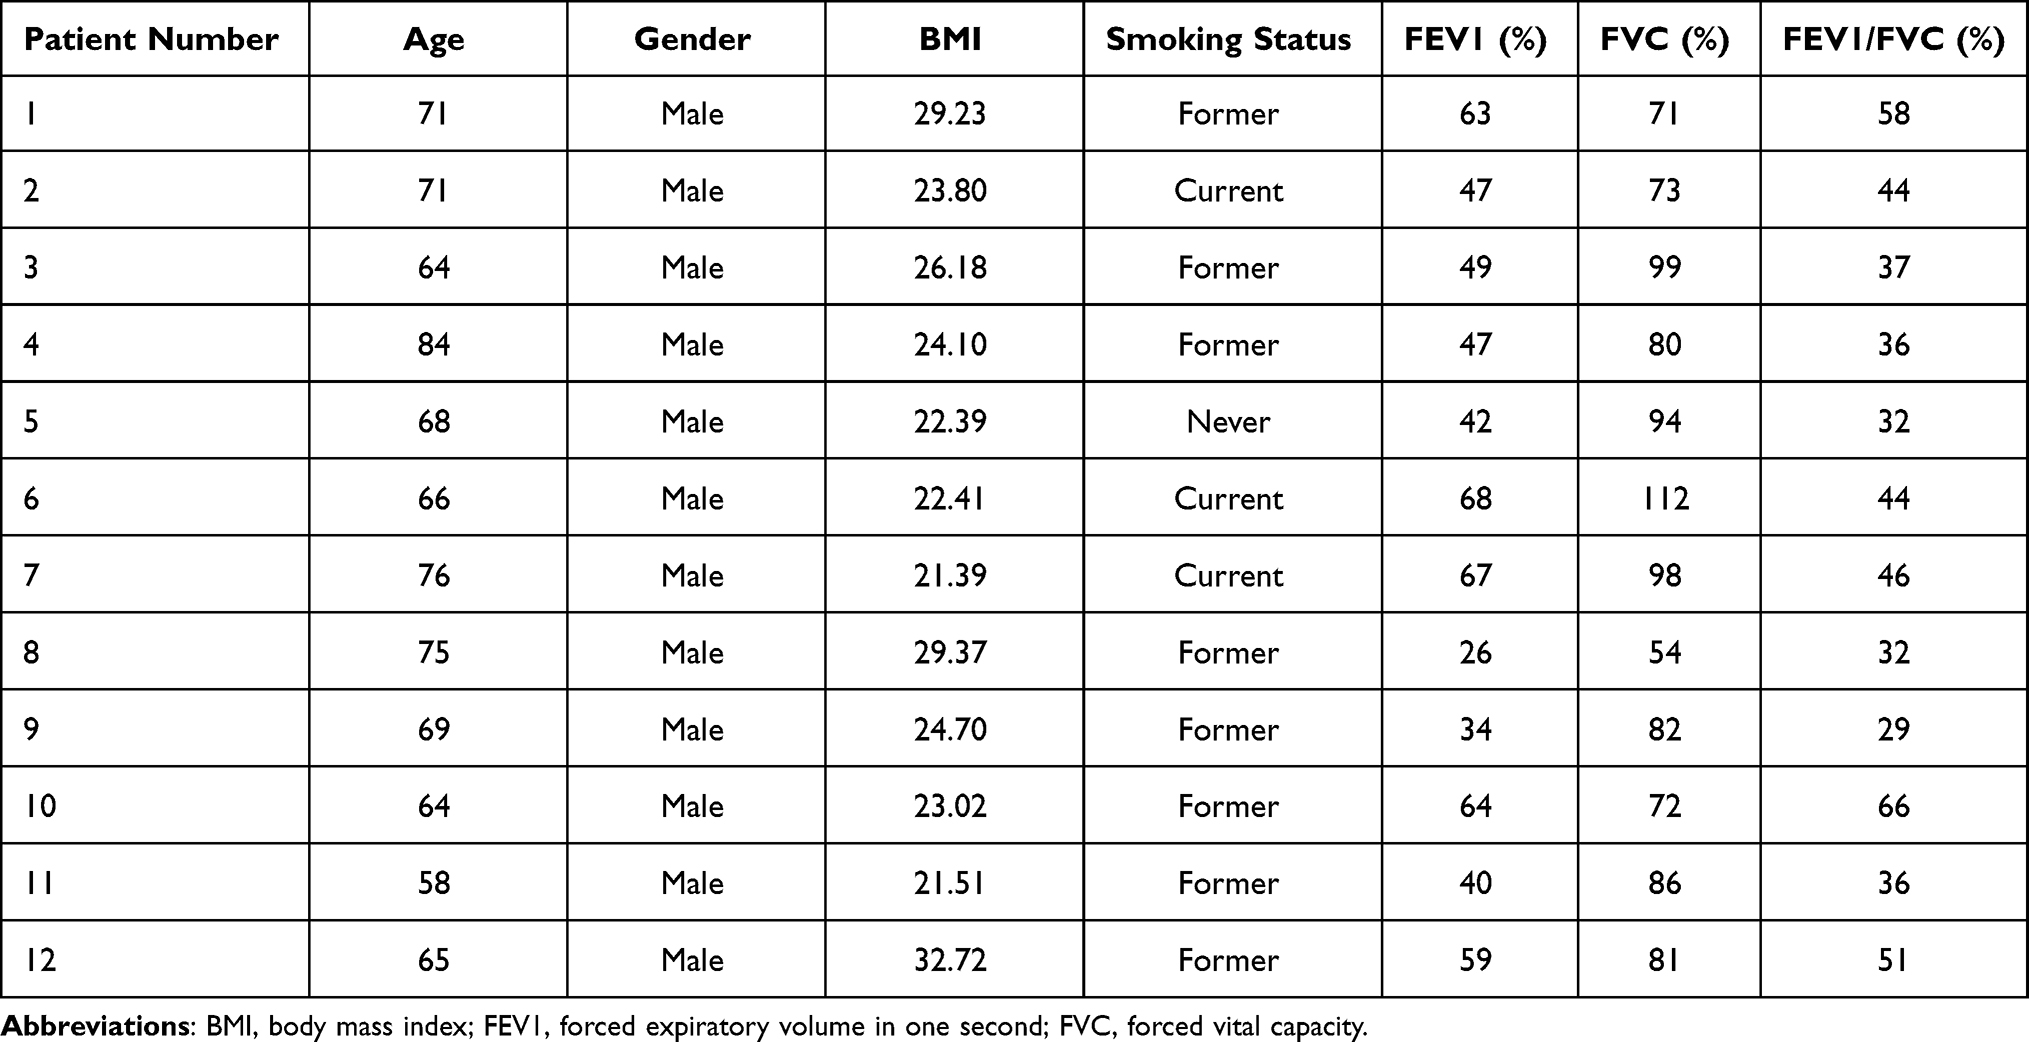 |
Table 1 Clinical Characteristics of the 12 COPD Patients in the State of Exacerbation |
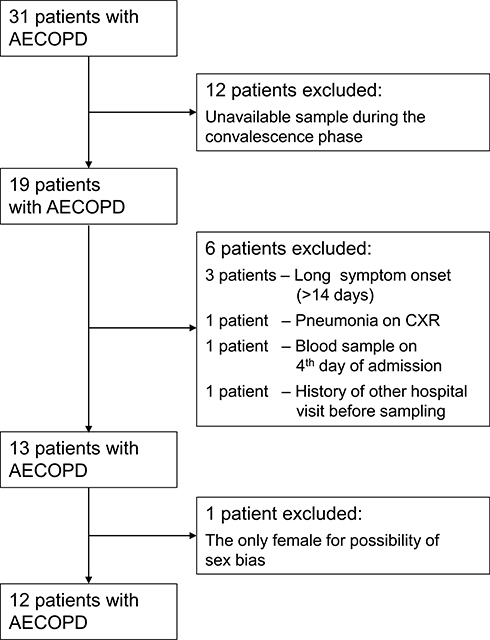 |
Figure 1 Flow chart of the study. |
Plasma Proteome Analysis Using SWATH-MS
SWATH-MS was used to compare the proteomic profiles of plasma samples collected during the exacerbation and convalescence stages. LC-MS/MS runs were performed in triplicate. Data from 72 samples (12 patients, two plasma samples, three replicates of each) were analyzed against the public pan-human protein mass spectrometry library. Overall, 226 plasma proteins were quantified (Figure 2A).27 To determine the quantitative reproducibility of the SWATH-MS data, we computed the coefficient of variation (CV) for each set of three technical replicates. The median CV% for each sample was 1.13 ± 1.38% (standard deviation). Among the proteins quantified in all three replicates, 99.42% had a CV <20%, meaning that they met the clinical criteria according to the Clinical Proteomic Tumor Analysis Consortium (CPTAC) guideline (Figure 2B).29 Next, a principal component analysis was performed for each sample (Figure 3) to reveal differences between samples according to individual COPD status. In the most extreme cases, such as in the case of patient #1, the plasma protein profiles in the AECOPD and convalescence states were very similar, whereas in the case of patient #5, they were very different.
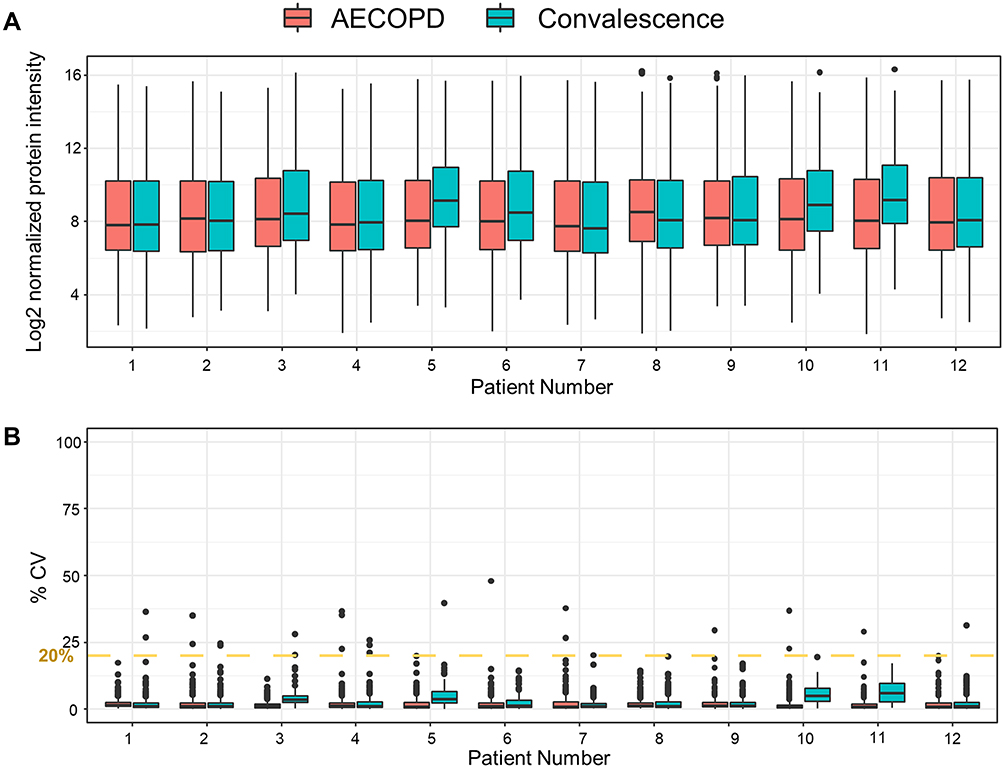 |
Figure 2 Proteomic analysis of the plasma samples using SWATH-MS. (A) Boxplots of normalized plasma protein abundances in the 12 pairs of COPD patient samples. (B) Reproducibility of the SWATH-MS measurements. The graph shows the CVs of the peak areas detected in triplicate analyses of each sample. |
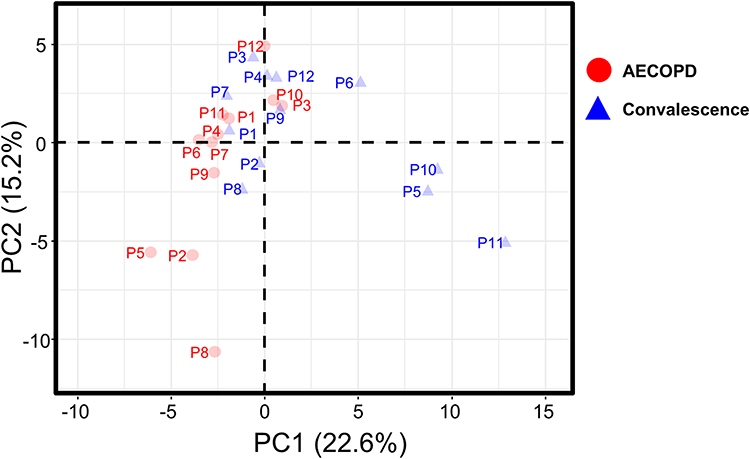 |
Figure 3 Principal component analysis of protein abundances in plasma samples collected from the 12 patients in the AECOPD or convalescence state. |
Functional Annotation of Proteins Expressed at Different Levels in the COPD Acute Exacerbation and Convalescence States
Significant differences between the abundances of proteins in the AECOPD and convalescence samples were determined using paired t-tests. Subsequently, the FDR-corrected p-value (q-value) was calculated. A volcano plot representing log2-fold-changes (convalescence/AECOPD) against minus log10 q-values identified 14 proteins that were up-regulated and 15 proteins that were down-regulated in AECOPD samples compared with convalescence samples (|fold-change| > 1.3; q-value < 0.05; Figure 4A and Table 2). Subsequently, we performed a gene ontology (GO) analysis (FDR < 0.0001) to examine the biological relevance of these changes (Figure 4B). Proteins related to the “Acute-phase response” were up-regulated in AECOPD, whereas those related to “Lipoprotein metabolic process”, “Lipid transport”, and “Very low density lipoprotein particle” were up-regulated during convalescence. Both conditions were associated with the terms “Extracellular space”, “Extracellular region”, “Blood microparticle”, and “Extracellular exosome”.
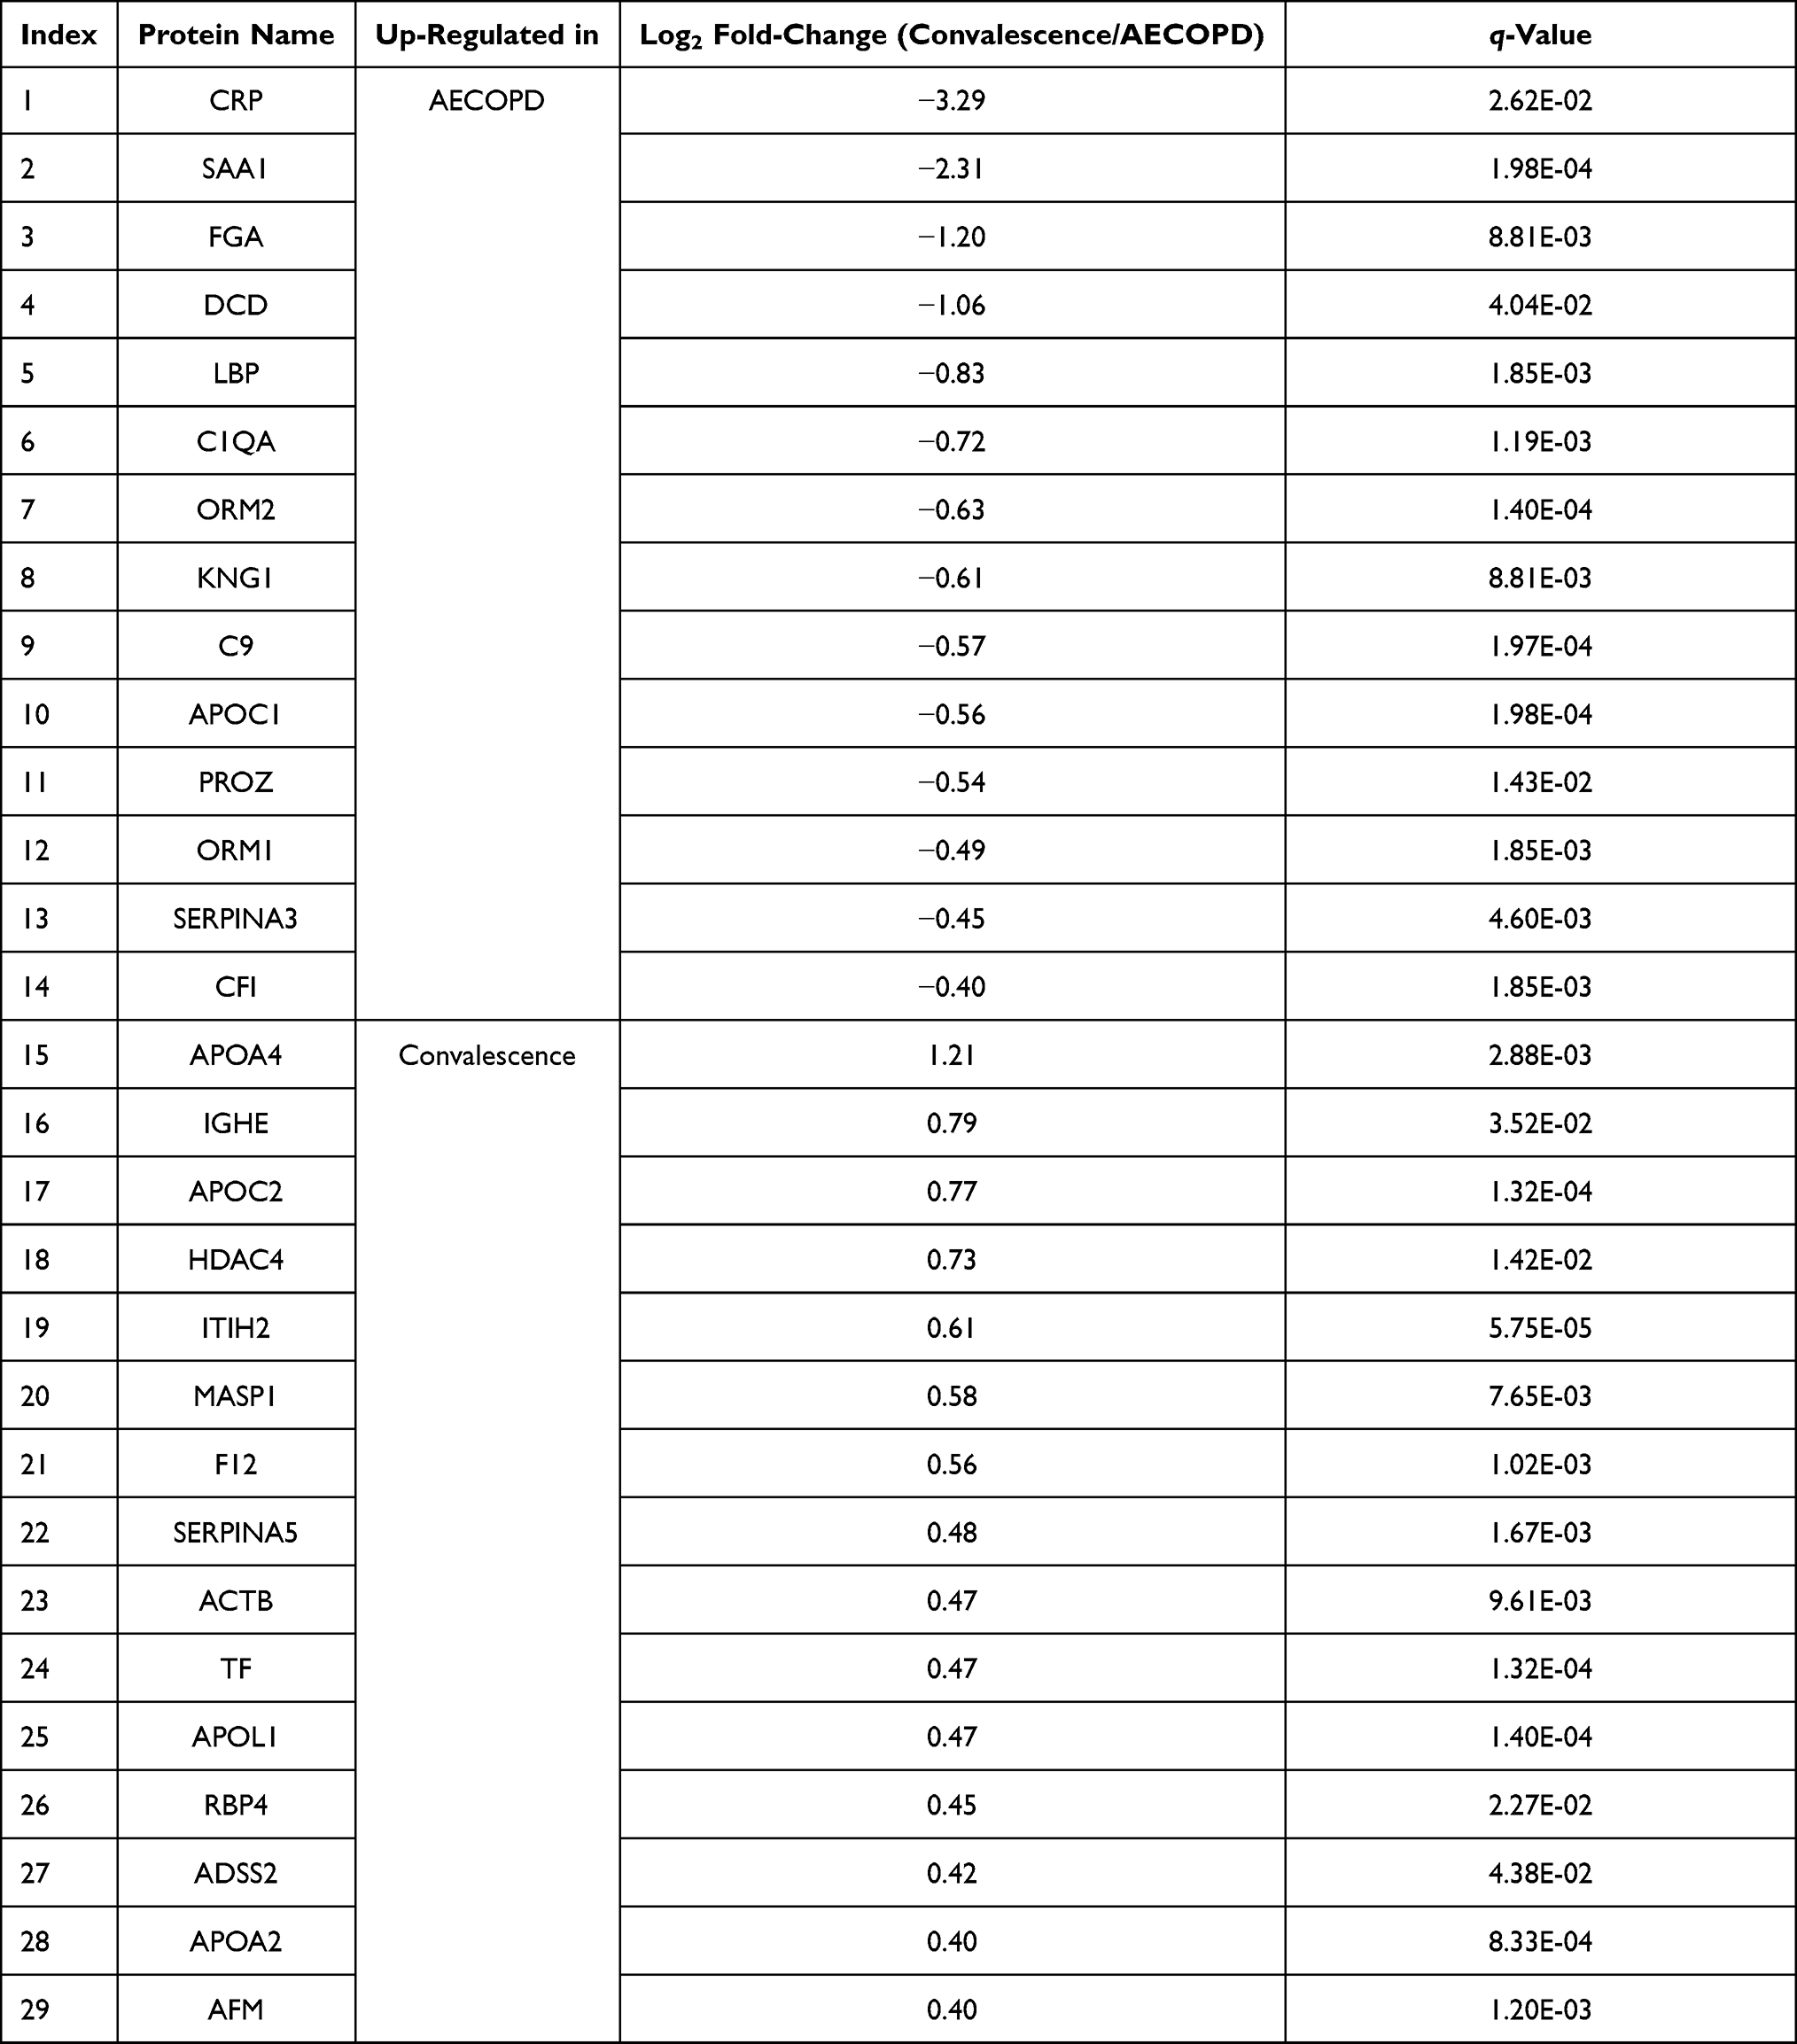 |
Table 2 The 29 Proteins That Were Differentially Expressed Between AECOPD and Convalescence Samples |
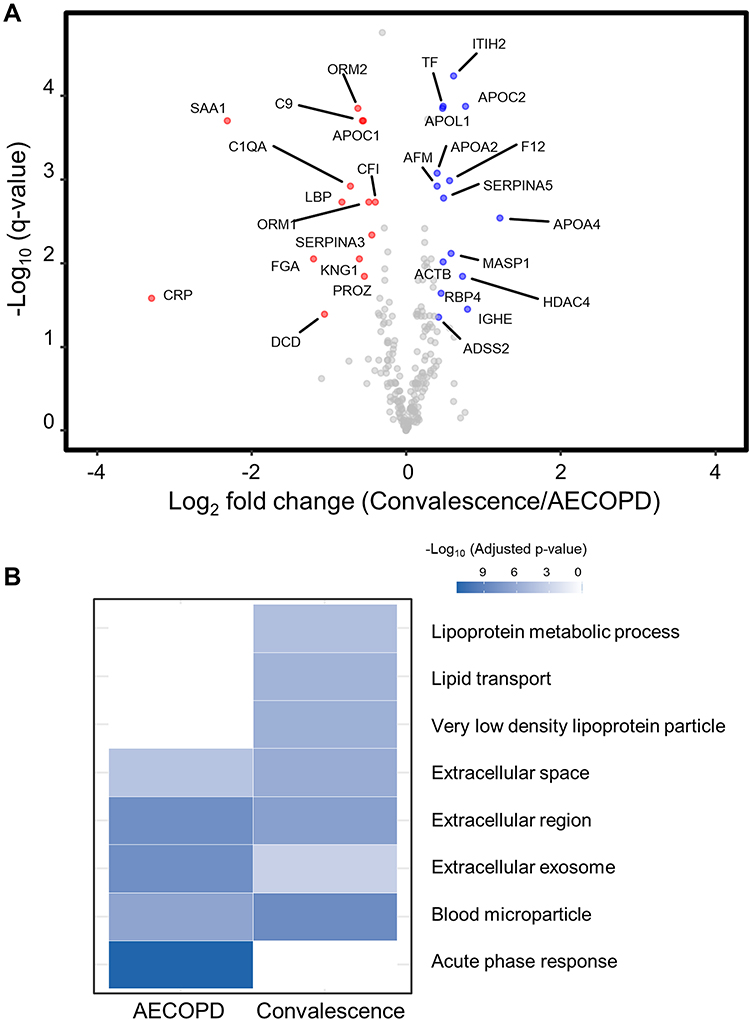 |
Figure 4 Volcano plot and functional annotation of proteomic data from paired COPD plasma samples (N = 12). (A) A volcano plot showing the log2 fold-change in the abundance of each protein between the AECOPD and convalescence samples on the x-axis, and the FDR-corrected p-value (q-value) on the y-axis. Red circles show the 14 plasma proteins that were present at significantly higher levels in AECOPD samples than in convalescence samples. Blue circles show the 15 plasma proteins that were present at significantly higher levels in convalescence samples than in AECOPD samples. Gray circles represent plasma proteins that were not differentially expressed between the two groups. (B) A gene ontology (GO) analysis of the proteins that were differentially expressed between the two COPD states (FDR < 0.0001). The GO terms represent the link between a protein and a particular biological process, molecular function, or cellular component. |
Selection of Biomarkers of AECOPD for ELISA Validation
We preferentially selected 14 proteins that were up-regulated in AECOPD because they can be detected easily in the clinical setting. Among them, the following three proteins were selected for ELISA validation based on their absolute fold-changes in abundance between the AECOPD and convalescence samples, the schematic trend of their before-after concentration plot, and the fact that they are acute-phase response-related proteins: lipopolysaccharide-binding protein (LBP), alpha-1-acid glycoprotein 2 (ORM2), and alpha-1-antichymotrypsin (SERPINA3). The differences in the expression levels of these proteins between the AECOPD and convalescence samples identified via SWATH-MS were validated using ELISAs (Figure 5A–C). For all three proteins, there was a trend of higher expression in AECOPD and lower expression in the recovery (convalescence) phase. SERPINA3 (p = 0.005) was up-regulated significantly in the AECOPD samples compared with the convalescence samples. By contrast, the observed differences in the levels of ORM2 and LBP were not statistically significant (p = 0.07 and p = 0.14, respectively).
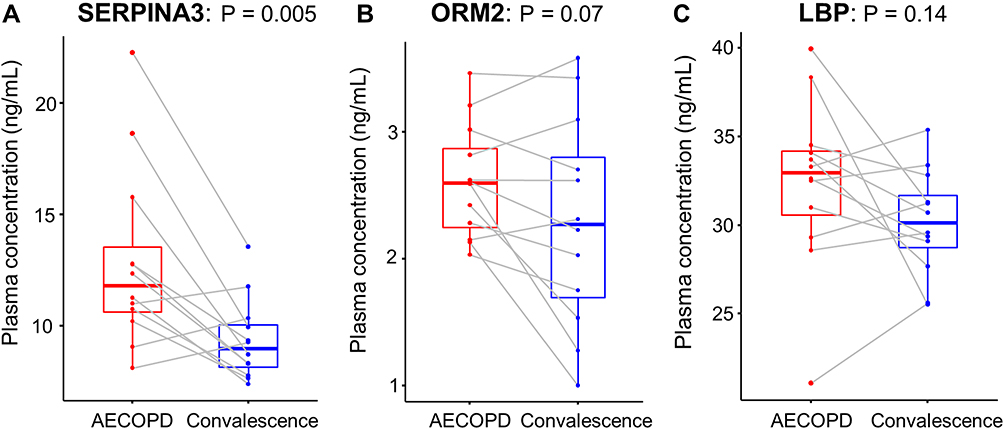 |
Figure 5 Boxplots of the plasma concentrations of SERPINA3 (A), ORM2 (B), and LBP (C) determined using ELISAs. |
Discussion
To our knowledge, our current study is the first to identify biomarkers of AECOPD using the SWATH-MS method. Unlike other proteomics methods such as data dependent acquisition (DDA) and isobaric labeling-based relative quantification, SWATH-MS enables the identification of proteins with low abundance and has good reproducibility and data consistency.19–22 A previous study using multiple reaction monitoring (MRM) mass spectrometry identified 55 proteins in a panel of samples from COPD patients in the acute exacerbation or convalescent state, of which seven proteins were differentially expressed between the two states.15 By contrast, our study enabled the identification of 226 proteins in the plasma samples, of which 29 were differentially expressed between states. In addition, four of seven proteins, namely, APOA4, C9, CRP, and LBP, overlapped and the quantitative patterns were consistent with each other.
Our analyses confirmed that proteins related to acute-phase systemic inflammation and immune responses, which are key players in the pathogenesis of COPD and AECOPD, were expressed at higher levels during the AECOPD stage than during the convalescence stage.30 The complement system is involved in both innate and adaptive immunity; the complement proteins C1QA and C9 are involved in the classical pathway that leads to formation of the membrane attack complex. In addition, complement factor I (CFI) regulates the complement system by degrading the activated complement proteins C3b and C4b. The observed up-regulation of C1QA, C9, and CFI in the AECOPD samples may be a consequence of the hyper-inflammatory status of the patient. In addition, the observed increase in the level of CRP protein in the AECOPD samples might play a role in the up-regulation of these complement proteins since it is a weak enhancer of the complement system.31 In line with our current findings, previous studies have shown that CRP is up-regulated during AECOPD and down-regulated during recovery.17,32
Proteins related to lipid transport and metabolism were down-regulated in the AECOPD stage. This was also observed in a previous study on lipid profiles during clinical sepsis, which is associated with acute systemic inflammation.33 In patients with severe sepsis, most lipoproteins (total cholesterol, triglycerides, VLDL, LDL, and HDL cholesterol) and lipid transport proteins (lecithin: cholesterol acyltransferase and plasma cholesteryl ester transfer protein) were present at low levels because of reverse cholesterol transport inhibition,34,35 combined with high levels of inflammatory markers such as CRP. This mechanism has been reported to normalize HDL levels with increased production of pre-beta HDL.33 Overall, these findings suggest an increased disruption of pulmonary lipid homeostasis in AECOPD.36 Furthermore, up-regulation of lipid profiles during convalescence state might have important clinical implications, since these profiles are closely related to metabolic syndrome which is common in COPD patients37 and increases the risk of COPD exacerbation and lung impairment.38 Thus, lipid profiles in stable COPD patients should also be carefully monitored and treated accordingly.
We used ELISAs to validate the increased expression levels of LBP, ORM2, and SERPINA3 identified via SWATH-MS in the AECOPD samples. Along with CRP, LBP is well known as a systemic anti-inflammatory mediator,39–41 and ORM2 has been identified as an acute-phase protein in the inflammatory response.42 SERPINA3 antiproteases prevent proteolytic activity to inhibit parenchymal inflammation of the lung by environmental factors such as smoking.43 A rare SERPINA3 polymorphism is associated with the development of COPD.44 Serum SERPINA3 levels are negatively correlated with the FEV1, an indicator of lung function,43 and are related to poor COPD prognosis, including an exacerbation of systemic inflammatory conditions and increased 10-year mortality.45 Notably, a protease-antiprotease imbalance in COPD patients is associated with the presence of airway injury and decreased lung function.43 Along with these previous findings, our current results suggest that the SERPINA3 protein may be a potential biomarker reflecting exacerbation of COPD with pulmonary inflammation. Thus, SERPINA3 may aid the early identification of AECOPD and could be used to evaluate treatment response.46 However, studies on the mechanism and role of SERPINA3 in AECOPD are still limited, and further studies are warranted to support our study findings.
This prospective proteomic study used paired plasma samples, which might increase the statistical power of the study by correcting for within-individual variations in protein levels. However, the study has some limitations. Because it was a short-term single-center study, it has a relatively small sample size, which diminishes the likelihood of generalization. In addition, the use of plasma biomarkers to diagnose and track AECOPD is hampered by the fact that their abundance levels may display a variety of trends depending on the specific drug being taken or bacterial, viral, or other causes of COPD exacerbation. To assess their applicability to a larger population, the results presented here need further validation using multi-center cohorts with large numbers of patients. Lastly, due to limited resources, we enrolled only COPD patients in AECOPD or convalescent stage. Further studies including healthy volunteers are warranted to validate our study findings.
Conclusion
In summary, our study attempted to identify candidate plasma biomarkers of AECOPD using the SWATH-MS method. We identified 29 proteins that were differentially expressed between COPD patients in the acute exacerbation and recovery stages. Among them, the up-regulation of three proteins (LBP, SERPINA3, and ORM2) in the AECOPD stage was verified by ELISA, although only SERPINA3 showed statistical significance.
Acknowledgments
This research was supported by Global Research Development Center Program through the National Research Foundation of Korea (NRF) funded by the Ministry of Science and ICT (MSIT) (NRF-2015K1A4A3046807) and a grant from the National Research Foundation (NRF) funded by the Korean government (MSIT) (NRF-2019M3E5D3073369).
Disclosure
The authors report no conflicts of interest in this work.
References
1. Vogelmeier CF, Criner GJ, Martinez FJ, et al. Global strategy for the diagnosis, management, and prevention of chronic obstructive lung disease 2017 report: GOLD executive summary. Eur Respir J. 2017;49(3):1700214. doi:10.1183/13993003.00214-2017
2. Adeloye D, Chua S, Lee C, et al. Global and regional estimates of COPD prevalence: systematic review and meta-analysis. J Glob Health. 2015;5(2):020415. doi:10.7189/jogh.05.020415
3. Decramer M, Janssens W, Miravitlles M. Chronic obstructive pulmonary disease. Lancet. 2012;379(9823):1341–1351. doi:10.1016/S0140-6736(11)60968-9
4. Mouronte-Roibás C, Leiro-Fernández V, Fernández-Villar A, Botana-Rial M, Ramos-Hernández C, Ruano-Ravina A. COPD, emphysema and the onset of lung cancer. A systematic review. Cancer Lett. 2016;382(2):240–244. doi:10.1016/j.canlet.2016.09.002
5. Mohsenzadegan M, Peng RW, Roudi R. Dendritic cell/cytokine-induced killer cell-based immunotherapy in lung cancer: what we know and future landscape. J Cell Physiol. 2020;235(1):74–86. doi:10.1002/jcp.28977
6. Zhu J, Li R, Tiselius E, et al. Immunotherapy (excluding checkpoint inhibitors) for stage I to III non-small cell lung cancer treated with surgery or radiotherapy with curative intent. Cochrane Database Syst Rev. 2017;12(12):Cd011300. doi:10.1002/14651858.CD011300.pub2
7. Wedzicha JA, Seemungal TA. COPD exacerbations: defining their cause and prevention. Lancet. 2007;370(9589):786–796. doi:10.1016/S0140-6736(07)61382-8
8. Anthonisen NR, Manfreda J, Warren CP, Hershfield ES, Harding GK, Nelson NA. Antibiotic therapy in exacerbations of chronic obstructive pulmonary disease. Ann Intern Med. 1987;106(2):196–204. doi:10.7326/0003-4819-106-2-196
9. Murtagh E, Heaney L, Gingles J, et al. Prevalence of obstructive lung disease in a general population sample: the NICECOPD study. Eur J Epidemiol. 2005;20(5):443–453. doi:10.1007/s10654-005-1248-8
10. Rabe KF, Hurd S, Anzueto A, et al. Global strategy for the diagnosis, management, and prevention of chronic obstructive pulmonary disease: GOLD executive summary. Am J Respir Crit Care Med. 2007;176(6):532–555. doi:10.1164/rccm.200703-456SO
11. Kim V, Aaron SD. What is a COPD exacerbation? Current definitions, pitfalls, challenges and opportunities for improvement. Eur Respir J. 2018;52(5):1801261. doi:10.1183/13993003.01261-2018
12. Trigueros Carrero JA. How should we define and classify exacerbations in chronic obstructive pulmonary disease? Expert Rev Respir Med. 2013;7(2 Suppl):33–41. doi:10.1586/ers.13.16
13. Regan EA, Hersh CP, Castaldi PJ, et al. Omics and the search for blood biomarkers in chronic obstructive pulmonary disease: insights from COPDGene. Am J Respir Cell Mol Biol. 2019;61(2):143–149. doi:10.1165/rcmb.2018-0245PS
14. Sidhaye VK, Nishida K, Martinez FJ. Precision medicine in COPD: where are we and where do we need to go? Eur Respir Rev. 2018;27(149):180022. doi:10.1183/16000617.0022-2018
15. Leung JM, Chen V, Hollander Z, et al. COPD exacerbation biomarkers validated using multiple reaction monitoring mass spectrometry. PLoS One. 2016;11(8):e0161129. doi:10.1371/journal.pone.0161129
16. Devanarayan V, Scholand MB, Hoidal J, et al. Identification of distinct plasma biomarker signatures in patients with rapid and slow declining forms of COPD. COPD. 2010;7(1):51–58. doi:10.3109/15412550903499530
17. Ruan W, Wu M, Shi L, et al. Serum levels of IGFBP7 are elevated during acute exacerbation in COPD patients. Int J Chron Obstruct Pulmon Dis. 2017;12:1775–1780. doi:10.2147/COPD.S132652
18. Ludwig C, Gillet L, Rosenberger G, Amon S, Collins BC, Aebersold R. Data-independent acquisition-based SWATH-MS for quantitative proteomics: a tutorial. Mol Syst Biol. 2018;14(8):e8126. doi:10.15252/msb.20178126
19. Narasimhan M, Kannan S, Chawade A, Bhattacharjee A, Govekar R. Clinical biomarker discovery by SWATH-MS based label-free quantitative proteomics: impact of criteria for identification of differentiators and data normalization method. J Transl Med. 2019;17(1):184. doi:10.1186/s12967-019-1937-9
20. Lin Q, Tan HT, Chung MCM. Next generation proteomics for clinical biomarker detection using SWATH-MS. Methods Mol Biol. 2019;1977:3–15.
21. Anjo SI, Santa C, Manadas B. SWATH-MS as a tool for biomarker discovery: from basic research to clinical applications. Proteomics. 2017;17(3–4):1600278. doi:10.1002/pmic.201600278
22. Jylha A, Nattinen J, Aapola U, et al. Comparison of iTRAQ and SWATH in a clinical study with multiple time points. Clin Proteomics. 2018;15:24. doi:10.1186/s12014-018-9201-5
23. Celli BR, Barnes PJ. Exacerbations of chronic obstructive pulmonary disease. Eur Respir J. 2007;29(6):1224–1238. doi:10.1183/09031936.00109906
24. Rodriguez-Roisin R. Toward a consensus definition for COPD exacerbations. Chest. 2000;117(5 Suppl 2):398s–401s. doi:10.1378/chest.117.5_suppl_2.398S
25. HaileMariam M, Eguez RV, Singh H, et al. S-trap, an ultrafast sample-preparation approach for shotgun proteomics. J Proteome Res. 2018;17(9):2917–2924. doi:10.1021/acs.jproteome.8b00505
26. Escher C, Reiter L, MacLean B, et al. Using iRT, a normalized retention time for more targeted measurement of peptides. Proteomics. 2012;12(8):1111–1121. doi:10.1002/pmic.201100463
27. Zhu T, Zhu Y, Xuan Y, et al. DPHL: a DIA pan-human protein mass spectrometry library for robust biomarker discovery. Genomics Proteomics Bioinformatics. 2020;18(2):104–119. doi:10.1016/j.gpb.2019.11.008
28. Zimmermann MT, Kabat B, Grill DE, Kennedy RB, Poland GA. RITAN: rapid integration of term annotation and network resources. PeerJ. 2019;7:e6994. doi:10.7717/peerj.6994
29. Hoofnagle AN, Whiteaker JR, Carr SA, et al. Recommendations for the generation, quantification, storage, and handling of peptides used for mass spectrometry-based assays. Clin Chem. 2016;62(1):48–69. doi:10.1373/clinchem.2015.250563
30. Chen H, Wang D, Bai C, Wang X. Proteomics-based biomarkers in chronic obstructive pulmonary disease. J Proteome Res. 2010;9(6):2798–2808. doi:10.1021/pr100063r
31. Haddad A, Wilson AM. Biochemistry, Complement. StatPearls. Treasure Island (FL): StatPearls Publishing Copyright © 2020, StatPearls Publishing LLC.; 2020.
32. Perera WR, Hurst JR, Wilkinson TM, et al. Inflammatory changes, recovery and recurrence at COPD exacerbation. Eur Respir J. 2007;29(3):527–534. doi:10.1183/09031936.00092506
33. Levels JHM, Pajkrt D, Schultz M, et al. Alterations in lipoprotein homeostasis during human experimental endotoxemia and clinical sepsis. Biochimica et Biophysica Acta. 2007;1771(12):1429–1438. doi:10.1016/j.bbalip.2007.10.001
34. Pruzanski W, Stefanski E, de Beer FC, de Beer MC, Ravandi A, Kuksis A. Comparative analysis of lipid composition of normal and acute-phase high density lipoproteins. J Lipid Res. 2000;41(7):1035–1047. doi:10.1016/S0022-2275(20)32007-1
35. Khovidhunkit W, Memon RA, Feingold KR, Grunfeld C. Infection and inflammation-induced proatherogenic changes of lipoproteins. J Infect Dis. 2000;181(Suppl 3):S462–472. doi:10.1086/315611
36. Chen H, Li Z, Dong L, Wu Y, Shen H, Chen Z. Lipid metabolism in chronic obstructive pulmonary disease. Int J Chron Obstruct Pulmon Dis. 2019;14:1009–1018. doi:10.2147/COPD.S196210
37. Chan SMH, Selemidis S, Bozinovski S, Vlahos R. Pathobiological mechanisms underlying metabolic syndrome (MetS) in chronic obstructive pulmonary disease (COPD): clinical significance and therapeutic strategies. Pharmacol Ther. 2019;198:160–188.
38. Baffi CW, Wood L, Winnica D, et al. Metabolic syndrome and the lung. Chest. 2016;149(6):1525–1534. doi:10.1016/j.chest.2015.12.034
39. Regueiro V, Campos MA, Morey P, et al. Lipopolysaccharide-binding protein and CD14 are increased in the bronchoalveolar lavage fluid of smokers. Eur Respir J. 2009;33(2):273–281. doi:10.1183/09031936.00087708
40. Groenewegen KH, Postma DS, Hop WC, Wielders PL, Schlösser NJ, Wouters EF. Increased systemic inflammation is a risk factor for COPD exacerbations. Chest. 2008;133(2):350–357. doi:10.1378/chest.07-1342
41. Dentener MA, Creutzberg EC, Schols AM, et al. Systemic anti-inflammatory mediators in COPD: increase in soluble interleukin 1 receptor II during treatment of exacerbations. Thorax. 2001;56(9):721–726. doi:10.1136/thorax.56.9.721
42. Zhu HZ, Zhou WJ, Wan YF, Ge K, Lu J, Jia CK. Downregulation of orosomucoid 2 acts as a prognostic factor associated with cancer-promoting pathways in liver cancer. World J Gastroenterol. 2020;26(8):804–817. doi:10.3748/wjg.v26.i8.804
43. Uysal P, Uzun H. Relationship between circulating Serpina3g, matrix metalloproteinase-9, and tissue inhibitor of metalloproteinase-1 and −2 with chronic obstructive pulmonary disease severity. Biomolecules. 2019;9(2):62. doi:10.3390/biom9020062
44. Hazari YM, Bashir A, Habib M, et al. Alpha-1-antitrypsin deficiency: genetic variations, clinical manifestations and therapeutic interventions. Mutat Res. 2017;773:14–25. doi:10.1016/j.mrrev.2017.03.001
45. Takei N, Suzuki M, Makita H, et al. Serum alpha-1 antitrypsin levels and the clinical course of chronic obstructive pulmonary disease. Int J Chron Obstruct Pulmon Dis. 2019;14:2885–2893. doi:10.2147/COPD.S225365
46. Prins HJ, Duijkers R, van der Valk P, et al. CRP-guided antibiotic treatment in acute exacerbations of COPD in hospital admissions. Eur Respir J. 2019;53(5):1802014. doi:10.1183/13993003.02014-2018
 © 2021 The Author(s). This work is published and licensed by Dove Medical Press Limited. The full terms of this license are available at https://www.dovepress.com/terms.php and incorporate the Creative Commons Attribution - Non Commercial (unported, v3.0) License.
By accessing the work you hereby accept the Terms. Non-commercial uses of the work are permitted without any further permission from Dove Medical Press Limited, provided the work is properly attributed. For permission for commercial use of this work, please see paragraphs 4.2 and 5 of our Terms.
© 2021 The Author(s). This work is published and licensed by Dove Medical Press Limited. The full terms of this license are available at https://www.dovepress.com/terms.php and incorporate the Creative Commons Attribution - Non Commercial (unported, v3.0) License.
By accessing the work you hereby accept the Terms. Non-commercial uses of the work are permitted without any further permission from Dove Medical Press Limited, provided the work is properly attributed. For permission for commercial use of this work, please see paragraphs 4.2 and 5 of our Terms.