")
Back to Journals » Clinical Ophthalmology » Volume 13
A Proposed Method to Quantify Vitreous Hemorrhage by Ultrasound
Authors Salcedo-Villanueva G , Trujillo-Alvarez M , Becerra-Revollo C , Ibarra-Elizalde E, Mayorquín-Ruiz M , Velez-Montoya R , García-Aguirre G , Gonzalez-Salinas R , Morales-Cantón V, Quiroz-Mercado H, Moragrega-Adame E
Received 4 September 2019
Accepted for publication 21 November 2019
Published 2 December 2019 Volume 2019:13 Pages 2377—2384
DOI https://doi.org/10.2147/OPTH.S229857
Checked for plagiarism Yes
Review by Single anonymous peer review
Peer reviewer comments 3
Editor who approved publication: Dr Scott Fraser
Guillermo Salcedo-Villanueva,1 Manuel Trujillo-Alvarez,1 Catalina Becerra-Revollo,2 Estefanía Ibarra-Elizalde,2 Mariana Mayorquín-Ruiz,2 Raul Velez-Montoya,1 Gerardo García-Aguirre,1 Roberto Gonzalez-Salinas,3 Virgilio Morales-Cantón,1 Hugo Quiroz-Mercado,1 Eduardo Moragrega-Adame2
1Retina Department, Asociación Para Evitar La Ceguera En México, Mexico City, Mexico; 2Ocular Ultrasound Department, Asociación Para Evitar La Ceguera En México, Mexico City, Mexico; 3Research Department, Asociación Para Evitar La Ceguera En México, Mexico City, Mexico
Correspondence: Guillermo Salcedo-Villanueva
Retina Department, Asociación Para Evitar La Ceguera En México, Vicente García Torres #46. Col. San Lucas, Coyoacán, Mexico City 04030, Mexico
Email [email protected]
Purpose: To propose a method for quantification of vitreous hemorrhages (VH) termed minimum image gain (MIG). Therefore, to obtain MIG measurements in patients with VH and to compare them to normal controls; to compare results between graders; and to obtain and compare MIG from two different ultrasound systems.
Methods: Retrospective and cross-sectional, observational, and comparative study performed in two parts: Part 1) Retrospective comparison of MIG in VH vs controls by two experienced graders, with intra/inter-observer variability: MIG technique is described. MIG is performed retrospectively in two groups, VH patients and normal controls. Groups are compared with independent samples t-test. Intra- and interobserver variability between graders was obtained. Part 2) Cross-sectional analysis of variability from nonexperienced graders and with different ultrasound systems: MIG is performed in cross-sectional measurements of VH patients, by two unexperienced graders, and with two ultrasound systems. Interobserver variability and Bland–Altman plot with levels of agreement (LoA) were obtained.
Results: Part 1: 50 patients with VH resulted in mean MIG: 52.8 dB; 34 controls resulted in mean MIG: 77.97 dB. Independent samples t-test resulted in a statistical significant difference. Intra- and inter-observer variability resulted in an almost perfect agreement between experienced graders. Part 2: 63 patients with VH, mean MIG: 56.19 dB. Inter-observer variability resulted in a very high agreement between unexperienced observers. LoA resulted in a statistical difference between the two ultrasound systems.
Conclusion: MIG may provide an objective and reproducible way to quantify vitreous hemorrhage density and potentially any vitreous humor opacity. Agreement is high even with unexperienced graders. However, the two ultrasound systems analyzed may not be interchangeable.
Keywords: diagnostic imaging, retina, ultrasonography, vitreous hemorrhage, vitreous humor
Introduction
Vitreous hemorrhage (VH) is an important ophthalmic condition that may cause an abrupt decrease in visual acuity (VA) and it often occurs as a complication of an underlying disease.1,2 VH has an annual incidence of 7 to 15.4 cases per 100,000 persons, depending on the population studied.3,4 Some of the main causes of VH may be proliferative diabetic retinopathy (PDR), retinal vein occlusions (RVOs), ocular trauma, posterior vitreous detachment with or without a retinal tear, etc.5–9 During the acute hemorrhagic event, blood passes through holes or apertures in the posterior hyaloid into the vitreous cortex, needing from weeks to months to clear from this location.1,10
Currently, there is no objective grading scale for VH. However, Nussenblatt´s standardization for vitreous opacities could be used as a system to clinically grade the opacities.11,12 In this scale, the clinical view through indirect ophthalmoscopy of the fundus is compared to a set of standard photographs with different degrees of vitreous haze. This scale is a straightforward way to categorize a VH, allowing the physician in day-to-day clinical practice to remember roughly the structures that need to be visible, in order to grade the hemorrhage without looking constantly at the reference images.
Although Nussenblatt’s grading scale has become the standard for more than 30 years, several problems with this system could be considered. First, it may have moderate interobserver agreement, as reported by Hornbeak et al;13 second, as categorical variables (and not numerical-continuous), patients that fall in-between categories could yield to the subjective interpretation of each individual examiner and, therefore, may result in low agreement between observers; third, the scale does not allow an adequate measurement of sporadic or interventional improvement, regardless of the vitreous opacity. Therefore, a more objective and reproducible grading method could prove useful.
Since its introduction into the ophthalmology field in 1956,14 ocular ultrasound has become an invaluable tool that helps determine diagnoses and treatment decisions. All ultrasound systems allow adjustments in the amplification of the echo signals, in other words, the strength of the ultrasound beam. Changing the amplitude will modify the gain or sensitivity setting of the system. Gain is measured in a logarithmic scale in decibels (dB), which represent relative units of ultrasound intensity from the returning echo. Higher gain levels allow greater ability to display weaker echoes, such as vitreous opacities, whereas lower gain levels allow only stronger echoes, for example the sclera, to be displayed.15,16 Therefore, gain levels could prove useful as a measuring scale to determine the lowest signal intensity obtained from a specific structure (in the present case, the vitreous humor and VH).
The purpose of this experimental study is to propose a grading method that measures ultrasonic gain to quantify the density of vitreous opacities, using a model of patients with VH. The grading method is termed minimum image gain (MIG). We aim to determine if MIG can be used as an objective and reproducible measuring scale for vitreous humor density. Therefore, our objectives were to obtain and compare MIG measurements in patients with VH and normal controls; to compare results between graders in order to determine intra- and interobserver agreement and, thus, reproducibility of this technique; and to obtain MIG with two different ultrasound systems in order to validate if one system can be interchangeable with the other. Thus, the aim was to provide sufficient information to propose MIG measurements for future studies as an objective and quantitative tool for any vitreous humor opacity.
Methods
This was a retrospective and cross-sectional, observational, and comparative study performed in two parts: 1) Retrospective comparison of MIG in VH vs controls by two experienced ultrasound graders, with intra/interobserver variability; 2) cross-sectional analysis of variability from non-experienced graders and different ultrasound systems. The study was performed under the tenets of the Declaration of Helsinki, and Institutional Review Board (IRB) approval was obtained prior to recruiting and analyzing data. Informed consent was signed before any routine ultrasound examination was performed.
Part 1, retrospective comparison of MIG in VH vs controls by two experienced ultrasound graders, and intra/interobserver variability.
Our hypothesis was that MIG indirectly measures the density of the vitreous humor. Therefore, when analyzing a patient with VH, the vitreous would be expected to have a higher density (because of the blood) and, thus, would result in a lower MIG when compared with a normal vitreous. Therefore, we set to obtain two independent groups for comparison: Group 1, VH (experimental group); and Group 2, normal vitreous (control group). For group 1, data were obtained from 50 eyes of 50 patients with VH that had previously undergone an ocular ultrasound scan with one specific system, the Aviso S (Quantel Medical, Cournon d’Auvergne Cedex, France). Patient’s medical records with a diagnosis of VH, regardless of the cause (PDR, RVO, trauma, etc), were randomly selected from the Ultrasound Department of the Asociación Para Evitar la Ceguera en México (Association to Prevent Blindness in Mexico [APEC]). During their routine clinical care, all patients with VH had been examined with ocular ultrasound to rule out other associated diagnoses (ie, rhegmatogenous or tractional retinal detachment). From the images obtained from these patients, MIG measurements (described below) were performed by two experienced ocular ultrasound ophthalmologists with more than 7 years of experience (CBR, MMR). The images that were measured for MIG were the same for each grader. MIG results were blinded from each individual grader when performing the measurements (the dB display on the screen was blocked from view), and graders were masked to each other’s results. Only an unmasked researcher (GSV) viewed, recorded, and analyzed the results.
For group 2 (control), data were randomly selected from patients with a diagnosis of cataract, with no ocular comorbidity, who were sent to the Ultrasound Department for intraocular lens (IOL) calculation and routine echographic screening using the same ultrasound system (Aviso S). MIG measurements were performed with the same specifications as described above.
Normality of distribution was tested for each individual group. Independent samples t-test was performed to test if there was a statistical difference between means from each group. To determine the reproducibility and objectivity of MIG measurements, intraobserver and interobserver variability was evaluated by using the intraclass correlation coefficient (ICC) and Cronbach’s alpha. For every image analyzed, 3 measurements of MIG were obtained per grader to determine intraobserver variability. To determine interobserver variability, MIG results were compared between graders.
Part 2, cross-sectional analysis of variability from nonexperienced graders and different ultrasound systems.
Data were obtained from 63 consecutive patients with VH (from different etiologies) who were scanned by two nonexperienced graders with two systems: the Aviso S and the Cinescan S (Quantel Medical, Cournon d’Auvergne Cedex, France). Ultrasound scans were performed by two fellows-in-training at the Ultrasound Department. Considering that the observations performed on Part 1 (that provided proof of concept for MIG) were performed by two experienced graders (ultrasound experts), and that the analysis of the ultrasound was performed on still images rather than patients in a live setting, it was decided to obtain MIG measurements in a cross-sectional model to imitate a real-life scenario and validate the technique. Patients with a diagnosis of VH who were scheduled for a routine ocular ultrasound were also imaged using the MIG technique (described in the section "Minimum Image Gain") by the two examiners and with the two ultrasound systems. Again, MIG results were blinded from each individual grader when performing the measurements, and graders were masked to each other’s results. ICC and Cronbach’s alpha were again obtained to measure interobserver variability. To test if one ultrasound system can be exchangeable with another, a Bland–Altman plot with a t-test and levels of agreement (LoA) were obtained.
Ocular Ultrasound Examinations
All ultrasound examinations were performed with this examination technique, as per protocol of the Ultrasound Department: With the patient at dorsal decubitus position, a 10 MHz, B-scan ultrasound probe (with a depth of exploration of 20 to 60 mm, focus of 21 to 25 mm, axial resolution of 150 µm, and lateral resolution of 300 µm) was used to evaluate the temporal quadrant of the globe. A longitudinal image was obtained where the optic nerve head, macula, peripheral retina, and external rectus muscle could be visualized. Therefore, the 9 o’clock meridian was analyzed for right eyes and 3 o’clock for left eyes (Figure 1A).
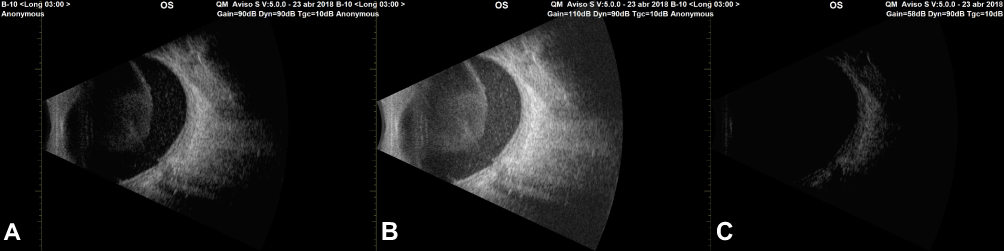 |
Figure 1 (A) Longitudinal, 3 o’clock scan of a left eye with vitreous hemorrhage (VH). Gain is set at initial standard of 90 dB. (B) Same scan with maximum gain at 110 dB. The visualization of vitreous details improves with more gain. (C) Minimum image gain (MIG) obtained at 58 dB, where there is a completely “echo-silent” vitreous cavity. |
Minimum Image Gain (MIG)
To obtain MIG measurements, the following method is proposed: The longitudinal image previously described is observed without any additional zoom, with the highest amount of gain in decibels, ie, 110 dB (Figure 1B). The scan’s gain is then lowered until the observer visualizes a completely “echo-silent” vitreous cavity (ie, no vitreous humor, hemorrhage, nor any opacity is observed inside the vitreous cavity), even if some details of the rest of the scan are lost (ie, visualization of the retina and choroid will also decrease partially) (Figure 1C). The point where there is no observable vitreous/VH is termed MIG, and the decibels are registered.
Statistical Analysis
All data were recorded into spreadsheets using Numbers for Mac (Version 3.6.2. Apple Inc, Cupertino, CA. USA). Statistical analysis was performed using SPSS (IBM SPSS Statistics, Ver. 22. IBM, Armonk, NY, USA). Demographic data are reported using descriptive statistics (mean, median, standard deviation). Normality of distribution was tested with the Shapiro–Wilk test. For comparison of groups, the independent samples t-test was performed. For intra- and interobserver variability, both for experienced and for nonexperienced graders, ICC and Cronbach’s alpha were performed. To determine the interchangeability of systems, a Bland–Altman Plot with t-test was done. Statistical significance was set to be <0.05.
Results
Part 1. Retrospective comparison of MIG in VH vs controls by two experienced ultrasound graders, with intra/interobserver variability.
Baseline Characteristics
Patients were divided into two groups: Group 1, VHs; Group 2, controls. A total of 50 eyes of 50 patients were included in Group 1. Thirty-three were women and 17 men. The mean age was 57 years, standard deviation (σ) 15 years (range: 8–83 years). A total of 34 eyes of 34 patients were included in Group 2. Eighteen were women and 16 were men, with a mean age of 63.42, σ: 11.71 (range: 45–84 years). All patients had a diagnosis of cataract, without other ocular diseases, particularly affecting the vitreous humor.
Minimum Image Gain (MIG)
For the 50 cases that comprised Group 1, the overall MIG obtained from the average of the two graders was 52.8 dB, σ: 9.81 (range 36–83 dB; 95% confidence interval [CI]: 50.00–55.59). Distribution of the sample was normal (Shapiro–Wilk test: P= 0.200). The 34 cases that comprised the control group resulted in a mean MIG of 77.97 dB, σ: 7.34 (range: 63–89 dB; 95% CI: 75.39–80.54). Distribution was normal (Shapiro–Wilk test: P= 0.121).
Independent Samples t-Test of Group 1, VH vs Group 2, Control
Equality of variances was corroborated with Levene’s test (P= 0.227). Independent samples t-test resulted in a t-value of −12.698 and a mean difference between groups of −25.17 dB, P< 0.001, demonstrating a statistically significant difference between groups (Table 1).
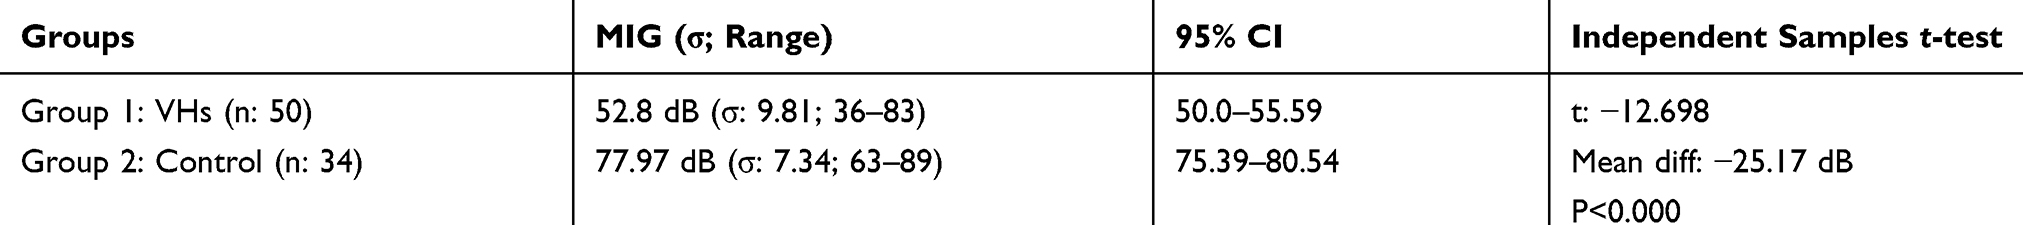 |
Table 1 Independent Samples t-Test for Group 1: VHs Vs Group 2: Controls |
Intra- and Interobserver Variability of MIG
For the 50 cases in Group 1, Grader 1 obtained a mean MIG of 53.46 db, σ: 9.63 (range: 36–85 db); Grader 2 obtained a mean MIG of 52.01 db, σ: 10.18 (range: 35–82 db). Intraobserver variability for Grader 1 resulted in Cronbach’s alpha: 0.995, ICC for single measures: 0.984, and ICC for average measures: 0.995, considered a very high individual consistency of measurements.17 For Grader 2, intraobserver variability resulted in Cronbach’s alpha: 0.998, ICC for single measures: 0.994, and ICC for average measures: 0.998, again a very high individual consistency of measurements. Interobserver variability between the two graders resulted in Cronbach’s alpha: 0.966, ICC for single measures: 0.935, and ICC for average measures: 0.966, considered to be an almost perfect agreement between graders.
Part 2. Cross-sectional analysis of variability from nonexperienced graders and different ultrasound systems.
A total of 63 patients with VH were imaged by the two examiners and with two ultrasound systems. For the Aviso S, the mean MIG resulted in 56.19 dB, σ 10.90 (range: 37–85 dB; 95% CI: 53.44–58.93). Interobserver variability from measurements performed in the Aviso S resulted in Cronbach’s alpha: 0.881; ICC for single measures: 0.779, ICC for average measures 0.876, considered as a strong agreement between observers. For the Cinescan S, the mean MIG resulted in 53.63 dB, σ 11.87 (range: 30–81; 95% CI: 50.64–56.62). Interobserver variability from measurements performed in the Cinescan S resulted in Cronbach’s alpha: 0.915; ICC for single measures: 0.844; ICC for average measures: 0.916, considered a very high agreement between observers.
A Bland–Altman plot was performed to determine if both systems are interchangeable. A mean difference of 2.548 dB was found for MIG measurements between both systems, with a t-test of P< 0.001, confirming that both groups differ statistically from each other. LoA resulted in −8.01–13.11. Therefore, MIG can be performed with the two systems, but they are not interchangeable with each other.
Finally, we formed a full sample of the 113 patients with VH who were analyzed only with the Aviso S (from parts 1 and 2 combined). The mean MIG for the full sample of VHs resulted in 54.69 dB, σ: 10.52 (range: 36–85 dB; 95% CI: 52.72–56.65). Patients were segmented into their different etiologies: PDR (89 cases) mean MIG: 55 dB, σ: 11 (range: 36–85); trauma (6 cases), mean MIG: 53 dB, σ: 13 (range: 38–65); hemorrhagic posterior vitreous detachment (HPVD) (6 cases) mean MIG: 59 dB, σ: 9 (range: 46–70); RVOs (5 cases) mean MIG: 54 dB, σ: 9 (range: 47–69); suprachoroidal hemorrhage (SCH) (4 cases) mean MIG: 45 dB, σ: 6 (range: 37–50); retinal microaneurysm (RMA) (2 cases) mean MIG: 50 dB, σ: 17 (range: 38–63); postoperative hemorrhage (1 case) 58 dB (Table 2).
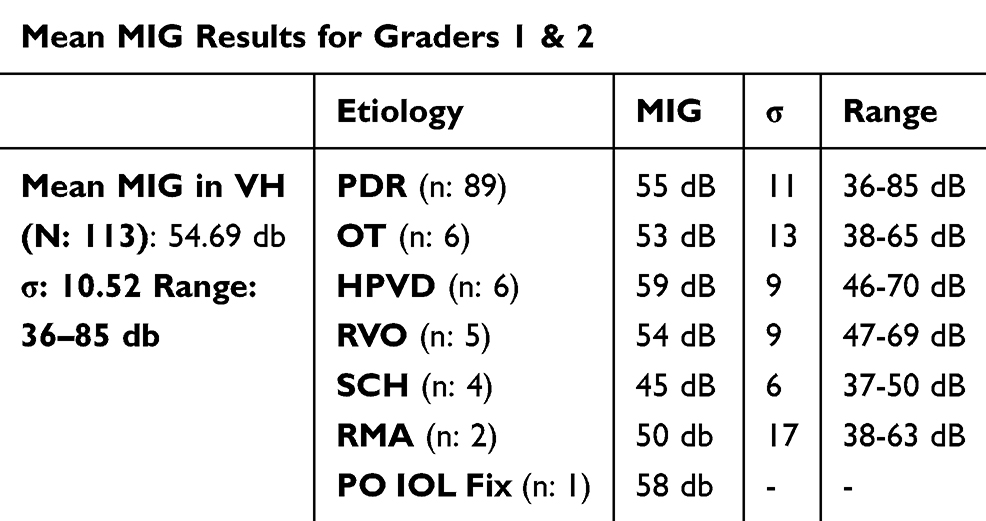 |
Table 2 Overall MIG Results, Segmented by Etiology of Vitreous Hemorrhage |
Discussion
We have presented herein the data of this experimental study, where MIG measurements demonstrated different results with different densities inside the vitreous cavity. We have also demonstrated that this measuring technique can be reproducible among experienced and nonexperienced graders and, although it was not interchangeable between two ultrasound systems, it can be achieved with either one of them. This measuring technique may allow the clinician to determine different densities of a VH (or potentially any vitreous humor opacity, such as infectious or inflammatory), which in turn could influence treatment decisions.
VH is a common disease in any ophthalmology practice.18 Normally, the VH by itself is not sight-threatening. However, the underlying disease causing the hemorrhage could leave permanent visual damage. Ultrasound scans of the posterior segment are regularly done to rule out those other complications.19 Therefore, when performing an echography, one could simply obtain vitreous MIG measurements also to know objectively how dense the VH is. We aimed to propose a simple and objective way to achieve this objective. Obtaining MIG measurements on VH can help to determine what hemorrhages have more density and therefore will need a surgery sooner than later.
The density of a specific tissue scanned by an ultrasound could be determined by knowing the acoustic impedance and the speed of sound in that tissue, which would imply having different software adaptations in the echography system. A more simple solution could be to modify the amplitude of the echo signals. Most (if not all) ocular ultrasound systems have the possibility to alter the gain or sensitivity to visualize a structure. With a lower gain, the amplitude of the ultrasound wave will not be strong enough and will attenuate as it goes through the tissue (in this case, the vitreous cavity). Higher sensitivity decreases attenuation, allowing the visualization of minute details. Decreasing the gain until no vitreous humor (or VH) is visualized (minimum gain) would mean that the specific density of the tissue (vitreous and hemorrhage) would be sufficient enough to attenuate the signal at that specific dB.15,16 VHs were demonstrated to have lower MIG measurements (52.8 dB) when compared with controls (77.97 dB). Because of the hemorrhage, the density of the vitreous is higher, and therefore, MIG is lower.
Since there are many diseases that can cause VH, and the origin of the hemorrhage could be arterial, venous, capillary, or a combination, it was expected that MIG results would have a considerable range. From the 113 cases analyzed, the mean MIG resulted in 54.69 db (σ: 10.52; range: 36–85 dB). Based on our hypothesis, it could be considered that a more dense hemorrhage would have an MIG below the mean. When segmented by etiologies, most VHs had a mean MIG very close to the overall sample mean. The only cases where more dense VHs were observed were for SCH (mean: 45 dB; σ: 6; range: 37–50), a disease that constitutes severe complications that result in dense bleedings. PDR (the most common etiology analyzed) resulted in a mixed range of results. As it could be expected, the origin of a VH in PDR could depend on the severity of the disease and the associated complications. Based on our results, it could be interesting to see if different etiologies result in different degrees of densities, for example, HPVD should have less dense hemorrhages than a ruptured RMAs. However, since the subgroups of cases analyzed (besides PDR cases) were made up of 6 patients or less, a larger sample is needed to further detect differences among groups.
To validate MIG measurements obtained with this technique, it was considered that Cronbach’s alpha and ICC were proper ways to analyze the information, in order to get the internal consistency reliability analysis and intra/interobserver agreement, respectively. Both in the retrospective setting, with experienced graders, as in the real-life scenario with unexperienced graders, the reproducibility of this technique seems to be very high. As a pilot study, it was important to determine first the agreement between experienced ocular ultrasound specialists, in order to validate proof of concept. Once achieved, we tested our technique in a live setting, and again, MIG seems to be objective and reproducible, with a high agreement between observers. When analyzing different systems, MIG measurements can be performed. However, LoA is clinically incompatible for the two systems to be interchangeable. Furthermore, the t-test performed indicates that the results, although similar, differ when obtained by the Aviso S and the Cinescan S.
The measurements proposed in this study could have subjective variability, based mainly on the grader’s location of the ultrasound probe and the grader’s interpretation of an “echo-silent” vitreous cavity. To decrease the subjectivity and variability, we suggest a standard method, where the probe is positioned in the appropriate location, and the ultrasound specialist/technician visualizes the optic nerve, the macula, and the horizontal rectus muscle. It was agreed among the ultrasound specialists involved in this research (CBR, MMR, EMA) that the most important scan to analyze and measure would be the longitudinal meridian in the 9 o’clock position for the right eye, and 3 o’clock position for the left eye, where the optic nerve and macula can be observed entirely. The importance of this scan is obvious since any structural abnormality found affecting the macula or the optic nerve could affect the visual prognosis of each patient. We proved that, even if the position of the probe varied slightly from one scan to the next, and between graders, the agreement is still high and the method is reproducible. The second issue, determining the point of an “echo-silent” cavity could also affect the validity of the results. However, the graders found it to be relatively simple to achieve without much doubt, and the results demonstrated that there was high agreement within each observer and between observers. Therefore, this method seems to be reproducible.
Interestingly, not many studies have addressed the objective of measuring VH density (or any vitreous opacities). Like Nussenblatt’s scale,11 Kocabora et al20 identified echographic signs that predict the prognosis of diabetic VH. In their study, the eyes analyzed were scanned transversely and longitudinally in each quadrant, with a density evaluation with maximum gain at T+9. Echographic signs were classified according to blood density, blood location, and presence of vitreoretinal traction. The investigators found that patients who had a nonclearing VH had a high-to-moderate density of blood, partial posterior vitreous detachment with one or more traction sites, and blood located in the vitreous gel. Their measurement of density was based on a subjective categorical scale that classified blood density into two groups. The low-density group had “less abundant and less reflective opacities,” while the high-density group had “moderate to high density, with more abundant and more reflective opacities.” In another study, a post-hoc analysis of the Vitrase for Vitreous Hemorrhage Study Groups,21 Bhavsar et al22 reported the use of another categorical grading scale, similar to Nussenblatt’s, to predict the response of ovine hyaluronidase on VH, termed the Total Hemorrhage Point Score. The authors discuss and acknowledge the subjective nature of the scoring methodology, but validate its use with a previous report.21 However, these two investigations and grading scales have the same problems addressed initially, both of them are subjective, may present low agreement, and small changes upon improvement or worsening of the VH could be difficult to detect.
As mentioned before, an alternate way to determine vitreous density would be to measure acoustic impedance. This could be done by measuring frequency backscatter data to analyze the acoustic properties of an individual tissue. Previous studies have reported using quantitative systems such as this.23 Mamou et al24 developed an ultrasound-based quantification of vitreous floaters, where the raw ultrasound data were processed for quantification in a different setting from the clinic. The investigators found that their measurements reflected a range of vitreous echo-densities and correlated positively with degradation in contrast sensitivity and patient dissatisfaction. However, results from the posterior vitreous were not reproducible. Also, their technique implied using a customized ultrasound system and analyzing the results in a different, more specialized research setting. As shown by our study, we wish to propose this technique as a simplified, practical, and readily available method to measure any vitreous opacity objectively, potentially with any ultrasound system.
In conclusion, in this experimental study, we proposed a method termed MIG, to quantify vitreous humor density, in this case shown in patients with VH and controls. We demonstrated that different densities inside the vitreous will have different MIG measurements. MIG was proven to be reproducible among different examiners, even unexperienced graders. It can be achieved with two different ultrasound systems independently, but the systems studied herein were not interchangeable with each other.
Ethical Approval and Informed Consent
The study and all procedures performed were in accordance with the ethical standards and approved by the IRB (CONBIOETICA-09-CEI-006-20170306). Information from this study was retrospective and cross-sectional. All patients had informed consent signed for regular ultrasound examinations and to participate in this study. The study was approved by the ethics committee and research department prior to data collection.
Funding
No funding was received for this research by any of the authors or institutions.
Disclosure
Dr Gerardo García-Aguirre reports personal fees, nonfinancial support from Alcon, personal fees, nonfinancial support from Allergan, personal fees, nonfinancial support from Bayer, personal fees from Liomont, personal fees from Roche Genentech, outside the submitted work. The authors report no other conflicts of interest with this work.
References
1. Jongebloed WL, Worst JF. The cisternal anatomy of the vitreous body. Doc Ophtalmol. 1987;67(1–2):183–196. doi:10.1007/BF00142712
2. Spraul CW, Grossniklaus HE. Vitreous hemorrhage. Surv Ophtalmol. 1997;42(1):3–39. doi:10.1016/S0039-6257(97)84041-6
3. Vitale S, Cotch MF, Sperduto RD. Prevalence of visual impairment in the United States. JAMA. 2006;295:2158–2163. doi:10.1001/jama.295.18.2158
4. Wang CY, Cheang WM, Hwang DK, Lin CH. Vitreous haemorrhage: a population-based study of the incidence and risk factors in Taiwan. Int J Ophthalmol. 2017;10(3):461–466. doi:10.18240/ijo.2017.03.21
5. Lindgren G, Sjödell L, Lindblom B. A prospective study of dense spontaneous vitreous hemorrhage. Am J Ophthalmol. 1995;119(4):458–465. doi:10.1016/S0002-9394(14)71232-2
6. Lean JS, Gregor Z. The acute vitreous haemorrhage. Br J Ophthalmol. 1980;64:469–471. doi:10.1136/bjo.64.7.469
7. Kim DY, Joe SG, Baek S, et al. Acute-onset vitreous hemorrhage of unknown origin before vitrectomy: causes and prognosis. J Ophthalmol. 2015;2015:429251.
8. Winslow RL, Taylor BC. Spontaneous vitreous hemorrhage: etiology and management. South Med J. 1980;73(11):1450–1452. doi:10.1097/00007611-198011000-00009
9. Dana MR, Werner MS, Viana MA, Shapiro MJ. Spontaneous and traumatic vitreous hemorrhage. Ophthalmology. 1993;100(9):1377–1383. doi:10.1016/S0161-6420(93)31472-7
10. Lincoff H, Kreissig I, Wolkstein M. Acute vitreous haemorrhage: a clinical report. Br J Ophthalmol. 1976;60(6):454–458. doi:10.1136/bjo.60.6.454
11. Nussenblatt RB, Palestine AG, Chan CC, Roberge F. Standarization of vitreal inflammatory activity in intermediate and posterior uveitis. Ophthalmology. 1985;92:467–471. doi:10.1016/S0161-6420(85)34001-0
12. Standarization of Uveitis (SUN) Working Group. Standardization of uveitis nomenclature for reporting clinical data results of the first international workshop. Am J Ophthalmol. 2005;140:509–516. doi:10.1016/j.ajo.2005.03.057
13. Hornbeak DM, Payal A, Pistilli M, et al. Interobserver agreement in clinical grading of vitreous haze using alternative grading scales. Ophthalmology. 2014;121(8):1643–1648. doi:10.1016/j.ophtha.2014.02.018
14. Mundt GH
15. Byrne SF, Green RL. Physics and instrumentation. In: Byrne SF, Green RL, editors. Ultrasound of the Eye and Orbit. New Delhi, India: Jaypee Brothers Medical Publishers; 2010:7–8.
16. Moragrega-Adame E, Velasco-Barona CF. Ultrasonido en tumores oculares y orbitarios. Mexico city: Atlas de imágenes ecográficas, clínicas y anatomopatológicas. Asociación Para Evitar la Ceguera en México; 2015.
17. McGraw KO, Wong SP. Forming inferences about some intraclass correlation coefficients. Psychol Methods. 1996;1:30–46. doi:10.1037/1082-989X.1.1.30
18. Meza R, Barrientos-Gutierrez T, Rojas-Martínez R, et al. Burden of type 2 diabetes in Mexico: past, current and future prevalence and incidence rates. Prev Med. 2015;81:445–450. doi:10.1016/j.ypmed.2015.10.015
19. Rabinowitz R, Yagev R, Shoham A, Lifshitz T. Comparison between clinical and ultrasound findings in patients with vitreous hemorrhage. Eye (Lond). 2004;18(3):253–256. doi:10.1038/sj.eye.6700632
20. Kocabora MS, Gulkilik G, Yilmazli C, Taskapili M, Kocabora A. The predictive value of echography in diabetic vitreous hemorrhage. Int Ophthalmol. 2005;26:215–219. doi:10.1007/s10792-007-9043-z
21. Kupperman BD, Thomas EL, de Smet MD, et al. Pooled efficacy results from two multinational randomized controlled clinical trials of a single intravitreous injection of highly purified ovine hyaluronidase (Vitrase) for the management of vitreous hemorrhage. Am J Ophthalmol. 2005;140:573–584. doi:10.1016/j.ajo.2005.04.018
22. Bhavsar AR, Grillone LR, McNamara TR, et al. Predicting response of vitreous hemorrhage after intravitreous injection of highly purified ovine hyaluronidase (Vitrase) in patients with diabetes. Invest Ophthalmol Vis Sci. 2008;49(10):4219–4225. doi:10.1167/iovs.07-1602
23. Insana MF, Wagner RF, Brown DG. Describing small-scale structrure in random media using pulse-echo ultrasound. J Acoustic Soc Am. 1990;87:179–192. doi:10.1121/1.399283
24. Mamou J, Wa CA, Yee KMP, et al. Ultrasound-based quantification of vitreous floaters correlates with contrast sensitivity and quality of life. Invest Ophthalmol Vis Sci. 2015;56:1611–1617. doi:10.1167/iovs.14-15414
 © 2019 The Author(s). This work is published and licensed by Dove Medical Press Limited. The full terms of this license are available at https://www.dovepress.com/terms.php and incorporate the Creative Commons Attribution - Non Commercial (unported, v3.0) License.
By accessing the work you hereby accept the Terms. Non-commercial uses of the work are permitted without any further permission from Dove Medical Press Limited, provided the work is properly attributed. For permission for commercial use of this work, please see paragraphs 4.2 and 5 of our Terms.
© 2019 The Author(s). This work is published and licensed by Dove Medical Press Limited. The full terms of this license are available at https://www.dovepress.com/terms.php and incorporate the Creative Commons Attribution - Non Commercial (unported, v3.0) License.
By accessing the work you hereby accept the Terms. Non-commercial uses of the work are permitted without any further permission from Dove Medical Press Limited, provided the work is properly attributed. For permission for commercial use of this work, please see paragraphs 4.2 and 5 of our Terms.