")
Back to Journals » Cancer Management and Research » Volume 12
A Predictive Scoring System Based on Inflammatory and Tumor Markers for Gastric Cancer Patients Undergoing Curative Resection
Authors Feng LW, Li J, Liang LF, Guo QQ , Li J, Wu J, Zhang PH, Qin YR
Received 18 February 2020
Accepted for publication 6 May 2020
Published 26 May 2020 Volume 2020:12 Pages 3937—3948
DOI https://doi.org/10.2147/CMAR.S250408
Checked for plagiarism Yes
Review by Single anonymous peer review
Peer reviewer comments 2
Editor who approved publication: Dr Xueqiong Zhu
Li-Wen Feng,1 Jing Li,1 Li-Feng Liang,2 Qian-Qian Guo,1 Jiang Li,3 Jian Wu,3 Pei-Hua Zhang,3 Yan-Ru Qin1
1Department of Oncology, Zhengzhou University First Affiliated Hospital, Zhengzhou, Henan, People’s Republic of China; 2Department of Internal Medicine, Zhengzhou University First Affiliated Hospital, Zhengzhou, Henan, People’s Republic of China; 3Preventive Medicine, College of Public Health, Zhengzhou University, Zhengzhou, Henan, People’s Republic of China
Correspondence: Yan-Ru Qin
Department of Oncology, Zhengzhou University First Affiliated Hospital, No. 1 Jianshe East Road, Erqi District, Zhengzhou 450052, Henan Province, People’s Republic of China
Email [email protected]
Purpose: Inflammation is closely associated with prognosis in gastric cancer (GC). We aimed to assess the predictive value of existing inflammatory and tumor markers in GC, to establish a systemic score based on valuable predictors for early risk stratification of patients, and to create a nomogram for individual risk prediction.
Patients and Methods: We retrospectively analyzed 401 GC patients who underwent curative gastrectomy from 2007 to 2016.
Results: Through univariate and multivariate survival analysis, age (> 60 years), depth of invasion (pT3– 4), lymph node invasion (pN1– 3), histologic classification (poor), adjuvant chemotherapy (no), albumin fibrinogen ratio (AFR) (< 13.33), and carbohydrate antigen 19-9 (CA19-9) (> 27 U/mL) independently indicated inferior disease-free survival (DFS). In addition, depth of invasion, lymph node invasion, histologic classification, adjuvant chemotherapy, AFR, and CA19-9 were incorporated in the prediction of cancer-specific survival (CSS). A combined AFR and CA19-9 prognostic score (CACPS) was established. Lower AFR (< 13.33) and higher CA19-9 (> 27 U/mL) were allocated 1 point each in the CACPS (range, 0– 2). CACPS can be used as an independent predictor for DFS and CSS in multivariate analysis (for DFS: CACPS 1: HR=2.039, 95% CI: 1.357– 3.065, P=0.001; CACPS 2: HR=2.419, 95% CI: 1.397– 4.186, P=0.002; for CSS: CACPS 1: HR=2.035, 95% CI: 1.292– 3.205, P=0.002; CACPS 2: HR=2.255, 95% CI: 1.252– 4.059, P=0.007), with a higher CACPS indicating poor survival according to Kaplan–Meier curves (both P< 0.001). Moreover, a nomogram for DFS and CSS was generated using the significant characteristics in the multivariate analysis, which exhibited high accuracy (for DFS: C-index=0.743, 95% CI: 0.698– 0.788; for CSS: C-index=0.766, 95% CI: 0.718– 0.814) versus tumor–node–metastasis staging (for DFS: C-index=0.692, 95% CI: 0.650– 0.734; for CSS: C-index=0.720, 95% CI: 0.675– 0.764).
Conclusion: Preoperative CACPS exhibited high accuracy in predicting prognosis for GC patients who underwent curative resection.
Keywords: albumin fibrinogen ratio, carbohydrate antigen 19-9, prognosis
Introduction
Although its morbidity and mortality have been declining in recent decades, gastric cancer (GC) remains the third leading cause of cancer-related death worldwide.1,2 There are large differences in incidence among various global regions. Nearly 60% of GC occurs in Eastern Asia, including China, with 30 cases per 100,000 population per year.3 Although surgical treatment remains important, technological advancements over recent years mean that nanobiology, photothermal techniques, and other modalities have received increasing attention.4–6 However, survival rates for GC remain poor, even with radical surgery and adjuvant chemotherapy.7,8 This is compounded by the high incidence of GC in less developed regions where, even after radical treatment, patients often refuse regular examinations due to economic reasons. This impedes the timely detection of potential recurrence or metastasis, delaying the initiation of retreatment. It is therefore urgent to explore economic and effective biomarkers to predict the postoperative survival of GC patients. Such tools may help to identify high-risk patients early, and encourage more regular or more frequent reviews.
Systemic inflammation has been proven to play a critical role in malignancies, including GC, by promoting initiation and metastasis.9–12 Tumors produce inflammatory cytokines and specific chemokines, recruit and activate various circulating leukocytes, and are infiltrated by leukocytes.11,12 Additionally, the leukocytes and activation platelets secrete several interleukins (IL), fibrinogen (Fib), and growth factors; they also promote an inflammatory response, and facilitate tumor progression by immune response subversion, stimulation of angiogenesis, induction of vascular permeability and extravasation, DNA damage, and inhibition of DNA repair.9,13,14 Therefore, biomarkers in the peripheral blood that reflect inflammation status are considered as potential predictors of tumor prognosis.
It has recently been recognized that several indicators in the peripheral blood are independently associated with adverse prognosis in different types of cancers, including GC. Such indicators include the neutrophil lymphocyte ratio (NLR), derived neutrophil lymphocyte ratio (dNLR), platelet lymphocyte ratio (PLR), lymphocyte monocyte ratio (LMR), Fib, albumin (Alb), and albumin fibrinogen ratio (AFR).10,15–19 Furthermore, some classic tumor markers, including carbohydrate antigen 19-9 (CA19-9), CA 72-4, and carcinoembryonic antigen (CEA), are routinely used in the diagnosis and monitoring of GC.20,21 The above indicators are included in routine preoperative laboratory items in China, and patients do not have to pay for additional tests. Therefore, we selected these indicators for evaluation as potential predictive factors.
The present study aimed to explore independent prognostic factors based on clinicopathological features, as well as inflammatory indicators and tumor markers, and establish a scoring system to predict postoperative survival and progression in GC patients.
Methods
Patients and Data Collection
We retrospectively analyzed the clinicopathological data for GC patients who underwent curative gastrectomy at the First Affiliated Hospital of Zhengzhou University (Henan, China) from October 2007 to May 2016. A diagnosis of GC was confirmed by histopathology and staged according to the Union for International Cancer Control/American Joint Committee on Cancer tumor–node–metastasis (TNM-UICC/AJCC) classification (8th edition). Baseline clinicopathological data and therapeutic regiment were extracted from the medical record, which had been completed by physicians. According to the guidelines of the Japanese Research Society for Gastric Cancer (JRSGC), all patients underwent D1+ or D2 lymphadenectomy.22 D1+ lymphadenectomy was often indicated for cT1N0 stage patients, while patients with locally advanced stages underwent D2 lymph node dissection. After surgery, 5-fluorouracil-based adjuvant chemotherapy was usually recommended by multidisciplinary discussion, although patient preference was also considered in the choice of postoperative treatment.
Enrolled patients met the following inclusion conditions: 1) histologically confirmed stage I–III gastric adenocarcinoma and no preoperative anticancer treatments; 2) R0 resection; 3) complete clinicopathological (all biomarkers to be assessed measured 1 week before surgery); 4) no other malignancies; 5) no other cause of death except GC; 6) no parenteral nutrition, acute inflammation, or significant organ injury within 1 week before surgery. In this study, 419 cases were enrolled according to the above inclusion conditions. Ultimately, 401 cases were analyzed, while 18 cases were lost in the follow-up.
Widely accepted thresholds were used to group the continuous variables: Fib (400 mg/dL), Alb (35 g/L), CEA (5 ng/mL), CA19-9 (27 U/mL), and CA72-4 (5 U/mL). The optimal cut-off values for NLR, dNLR, PLR, LMR, AFR, and examined lymph nodes were determined by receiver operating curve (ROC) analysis because of the current lack of defined thresholds.
Follow-Up
Medical records, register, and telephone investigation are means of follow-up. The follow-up first included a review of the patient’s medical records, which were previously completed by the clinician. This was supplemented in the final follow-up assessment with telephone investigations of patients or family members. In our institute, patients were followed up every 3 months during the first 2 years, every 6 months for up to 5 years, and then annually thereafter. Routine follow-up assessment included physical examination, laboratory testing, electronic gastroscope as clinically indicated, and dynamic computed tomography (CT) scan of the chest/abdomen/pelvis. The median follow-up period was 40 months, ranging from 3 to 106 months. Disease-free survival (DFS) was defined as the time from curative surgery to recurrence, death or final follow-up. Cancer-specific survival (CSS) was calculated from the date of surgery to cancer-related death or final follow-up.
Statistical Methods
We used SPSS 25.0 (IBM Corp, USA) and R 3.5.0 (R core team, Austria) software to process the data. P≤0.05 was considered to be statistically significant. An ROC curve was used to obtain the optimal cut-off value for predicting CSS by calculating the maximal Youden index. For continuous variables, the Kolmogorov–Smirnov test was conducted first. If an approximate normal distribution was displayed, the data were described using the mean and standard deviation. Otherwise, median values with interquartile range were used.
Variables were grouped according to clinical reasoning, with grouping decisions having been made before modeling. All variables with statistical significance in the univariate analysis were considered in a multivariate Cox proportional hazard model in order to identify the independent factors. The DFS and CSS were calculated with the Kaplan–Meier analysis, and the Log rank test was selected to compare differences. The chi-square test was used to compare differences in categorical variables between groups.
For nomogram construction, the rms package and survival package in R software were used. We used the Cox regression model for the multivariable survival analysis, and Cox regression coefficients to generate nomograms. Discrimination and calibration were evaluated by calibration curves and Harrell’s concordance index (C-index). In the calibration curves, the nomogram-predicted probabilities were compared with actual survival observed by Kaplan–Meier analysis after grouping into quartiles, using 1000 bootstrap re-samples to quantify any overfitting. The C-index was calculated using the coxph function in the survival package; the higher the C-index, the more precise the prognosis prediction.
Ethical Standards
Procedures performed in this study have been reviewed and approved by the Ethics Committee of Zhengzhou University, which is guided by the international and national ethical requirements for biomedical research. The study is a retrospective analysis and includes patient history. Therefore, the informed consent statements from patients cannot be obtained. In accordance with the Declaration of Helsinki, the patient data were anonymized and stored with strict confidentiality.
Results
Clinicopathological Characteristics
The detailed clinicopathological characteristics of the 401 patients are shown in Table 1. According to the 8th edition of the AJCC staging system, the majority of tumors were classified as pT3–4 (n=281, 70.1%), lymph node invasion was common (n=230, 57.4%), and most tumors were stage III (n=199, 49.6%). At the time of surgery, the partial gastrectomy and total gastrectomy rates were 51.8% (n=267) and 48.2% (n=248), respectively. Moreover, a subset of patients did not receive adjuvant chemotherapy (n=103, 25.7%), while the majority of patients (n=298, 74.3%) underwent adjuvant chemotherapy following resection. During the follow-up period, 149 (37.2%) patients died, and 252 (62.8%) were alive at last follow-up. The 1-, 2-, and 3-year CSS rates were 84.8% (n=340), 72.1% (n=289), and 66.1% (n=265), respectively. The estimated 5-year CSS rate was 32.0% (n=70). The 1-, 2-, and 3-year DFS rates were 78.8% (n=316), 68.1% (n=273), and 61.6% (n=247), respectively. The estimated 5-year DFS rate was 27.5% (n=66).
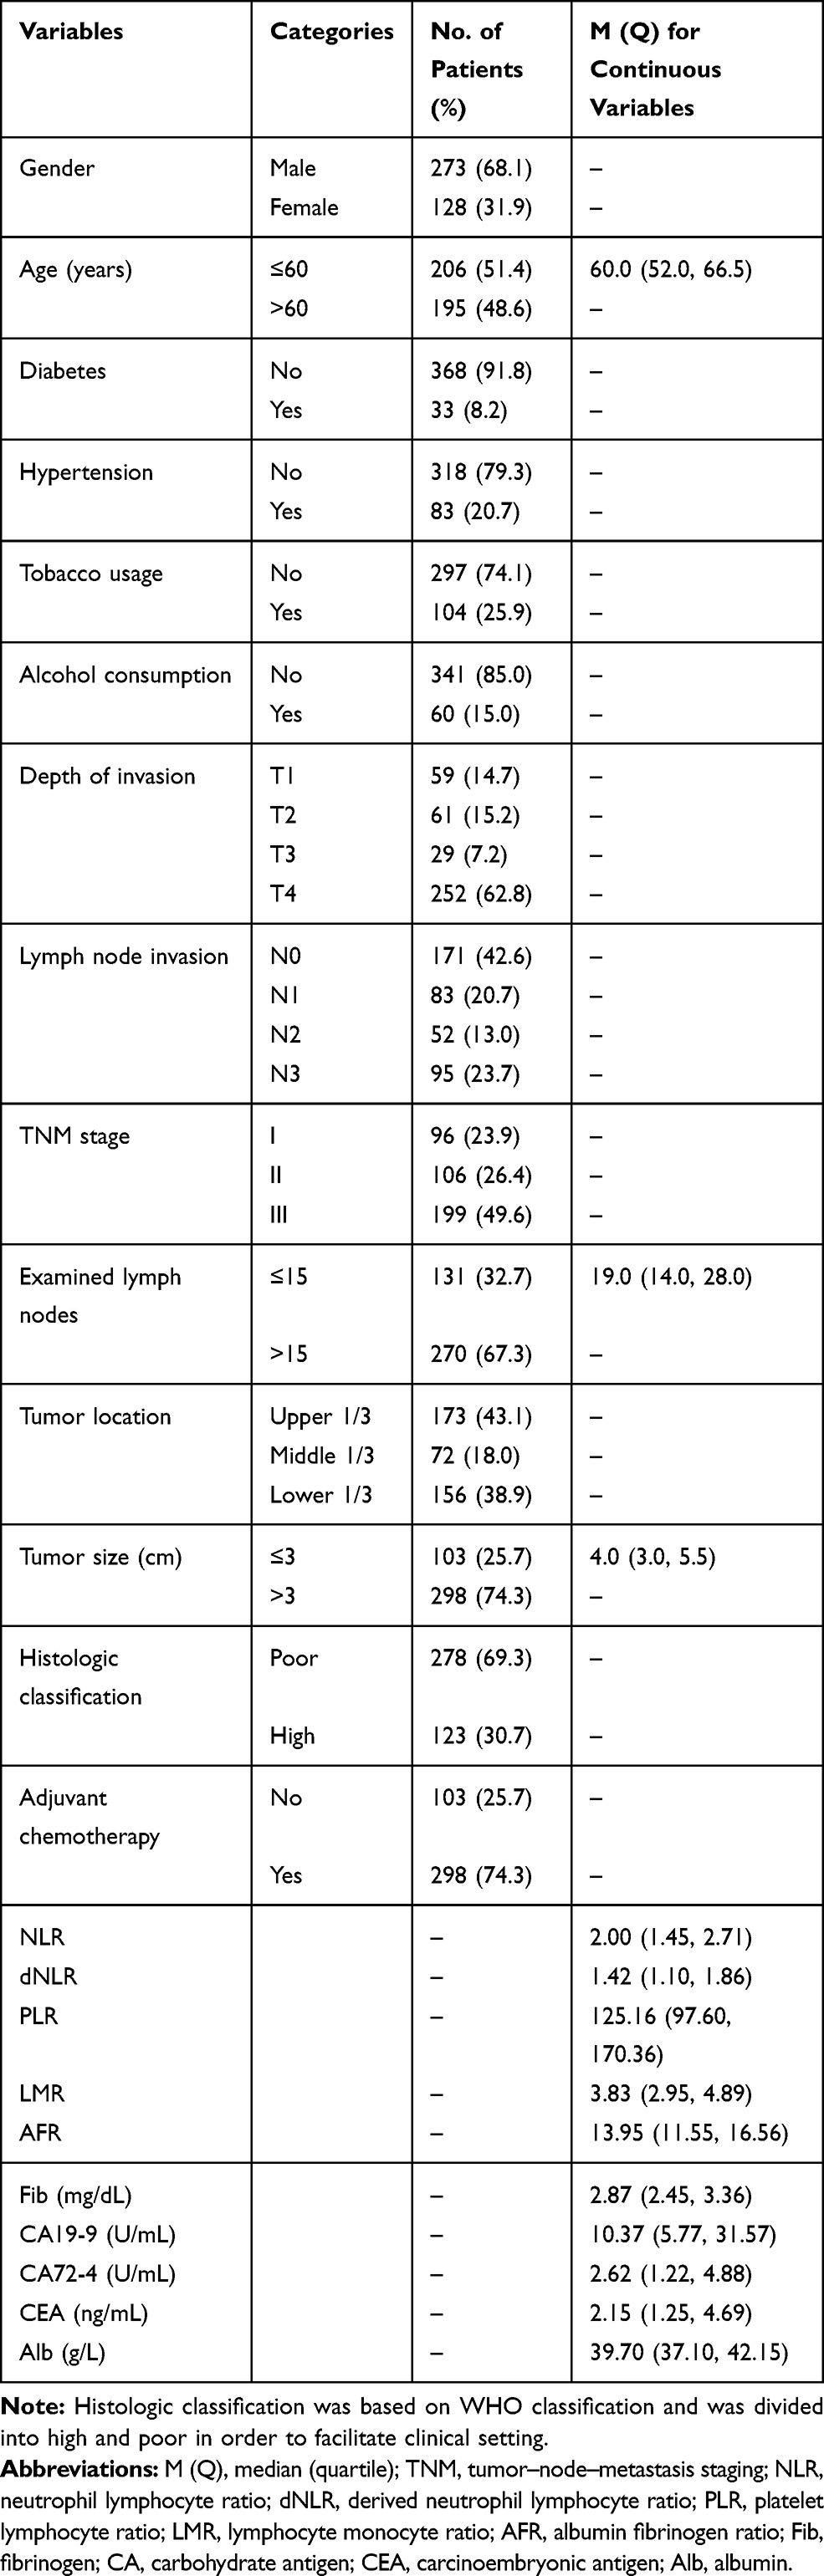 |
Table 1 The Clinicopathological Characteristics for 401 Gastric Cancer Patients |
Determination of Thresholds and Independent Predictors
The ROC curves for 3-year CSS were used to determine the optimal cut-off values of NLR, dNLR, PLR, LMR, AFR, and examined lymph nodes, which were defined as 1.90, 2.10, 150.80, 2.69, 13.33, and 15.5, respectively. In the univariate analysis, age, depth of invasion, lymph node invasion, tumor location, tumor size, histologic classification, adjuvant chemotherapy, NLR, dNLR, PLR, LMR, AFR, Fib, CA19-9, CA72-4, CEA, and Alb were considered to be associated with DFS, whereas gender, diabetes, hypertension, tobacco usage, alcohol consumption, and examined lymph nodes were not (Table 2). Similar results were obtained for CSS, but examined lymph nodes were considered relevant, tumor location was not (Table 3).
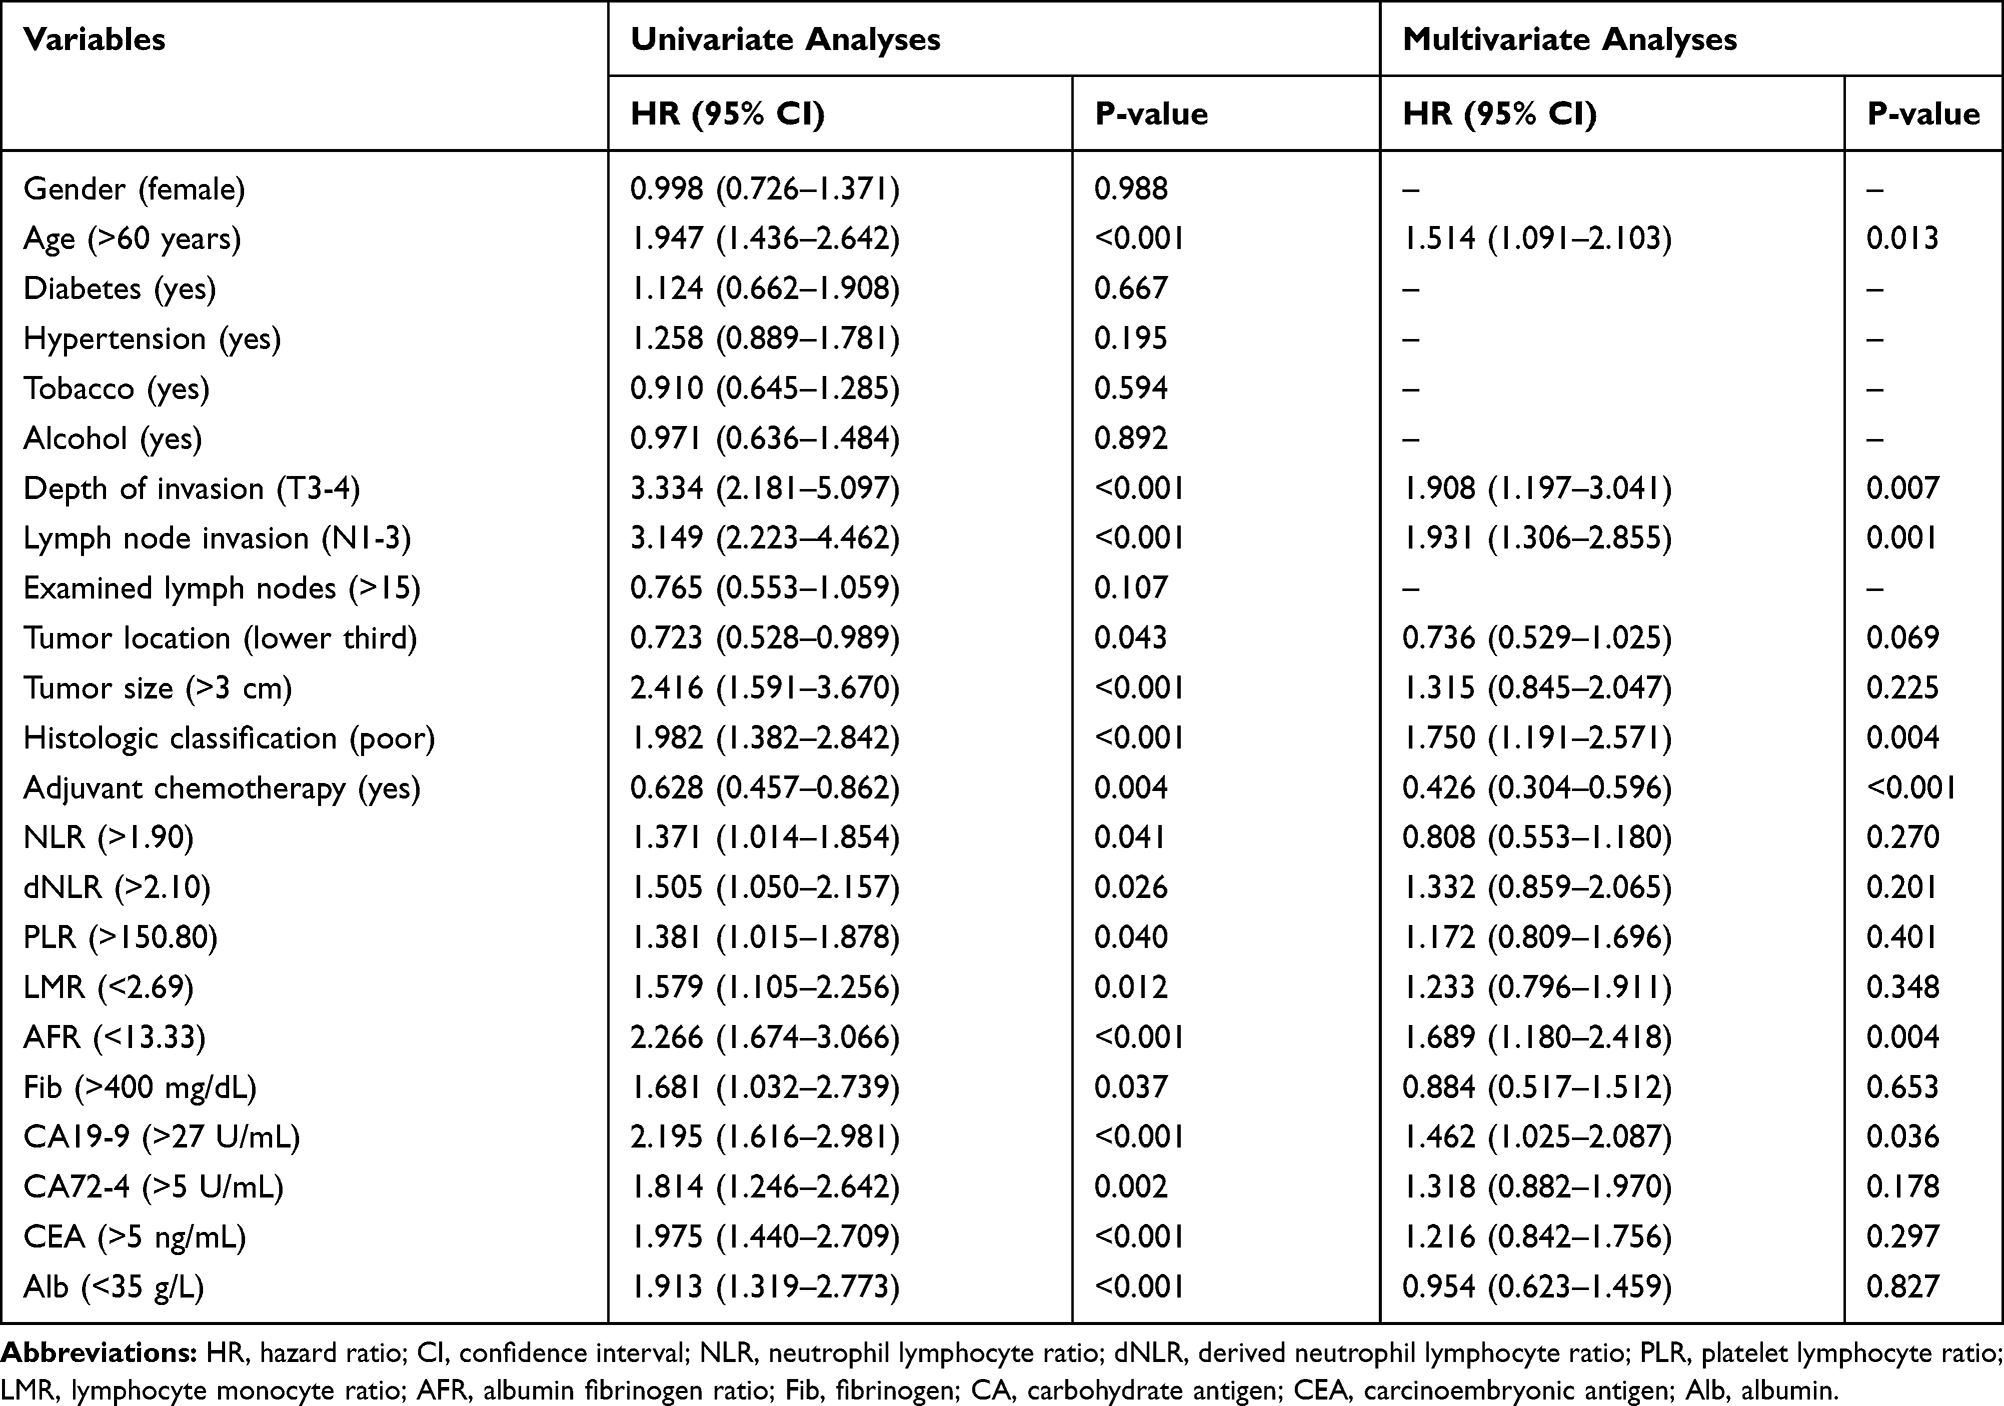 |
Table 2 Univariate and Multivariate Cox Analyses of Prognostic Factors for Disease-Free Survival |
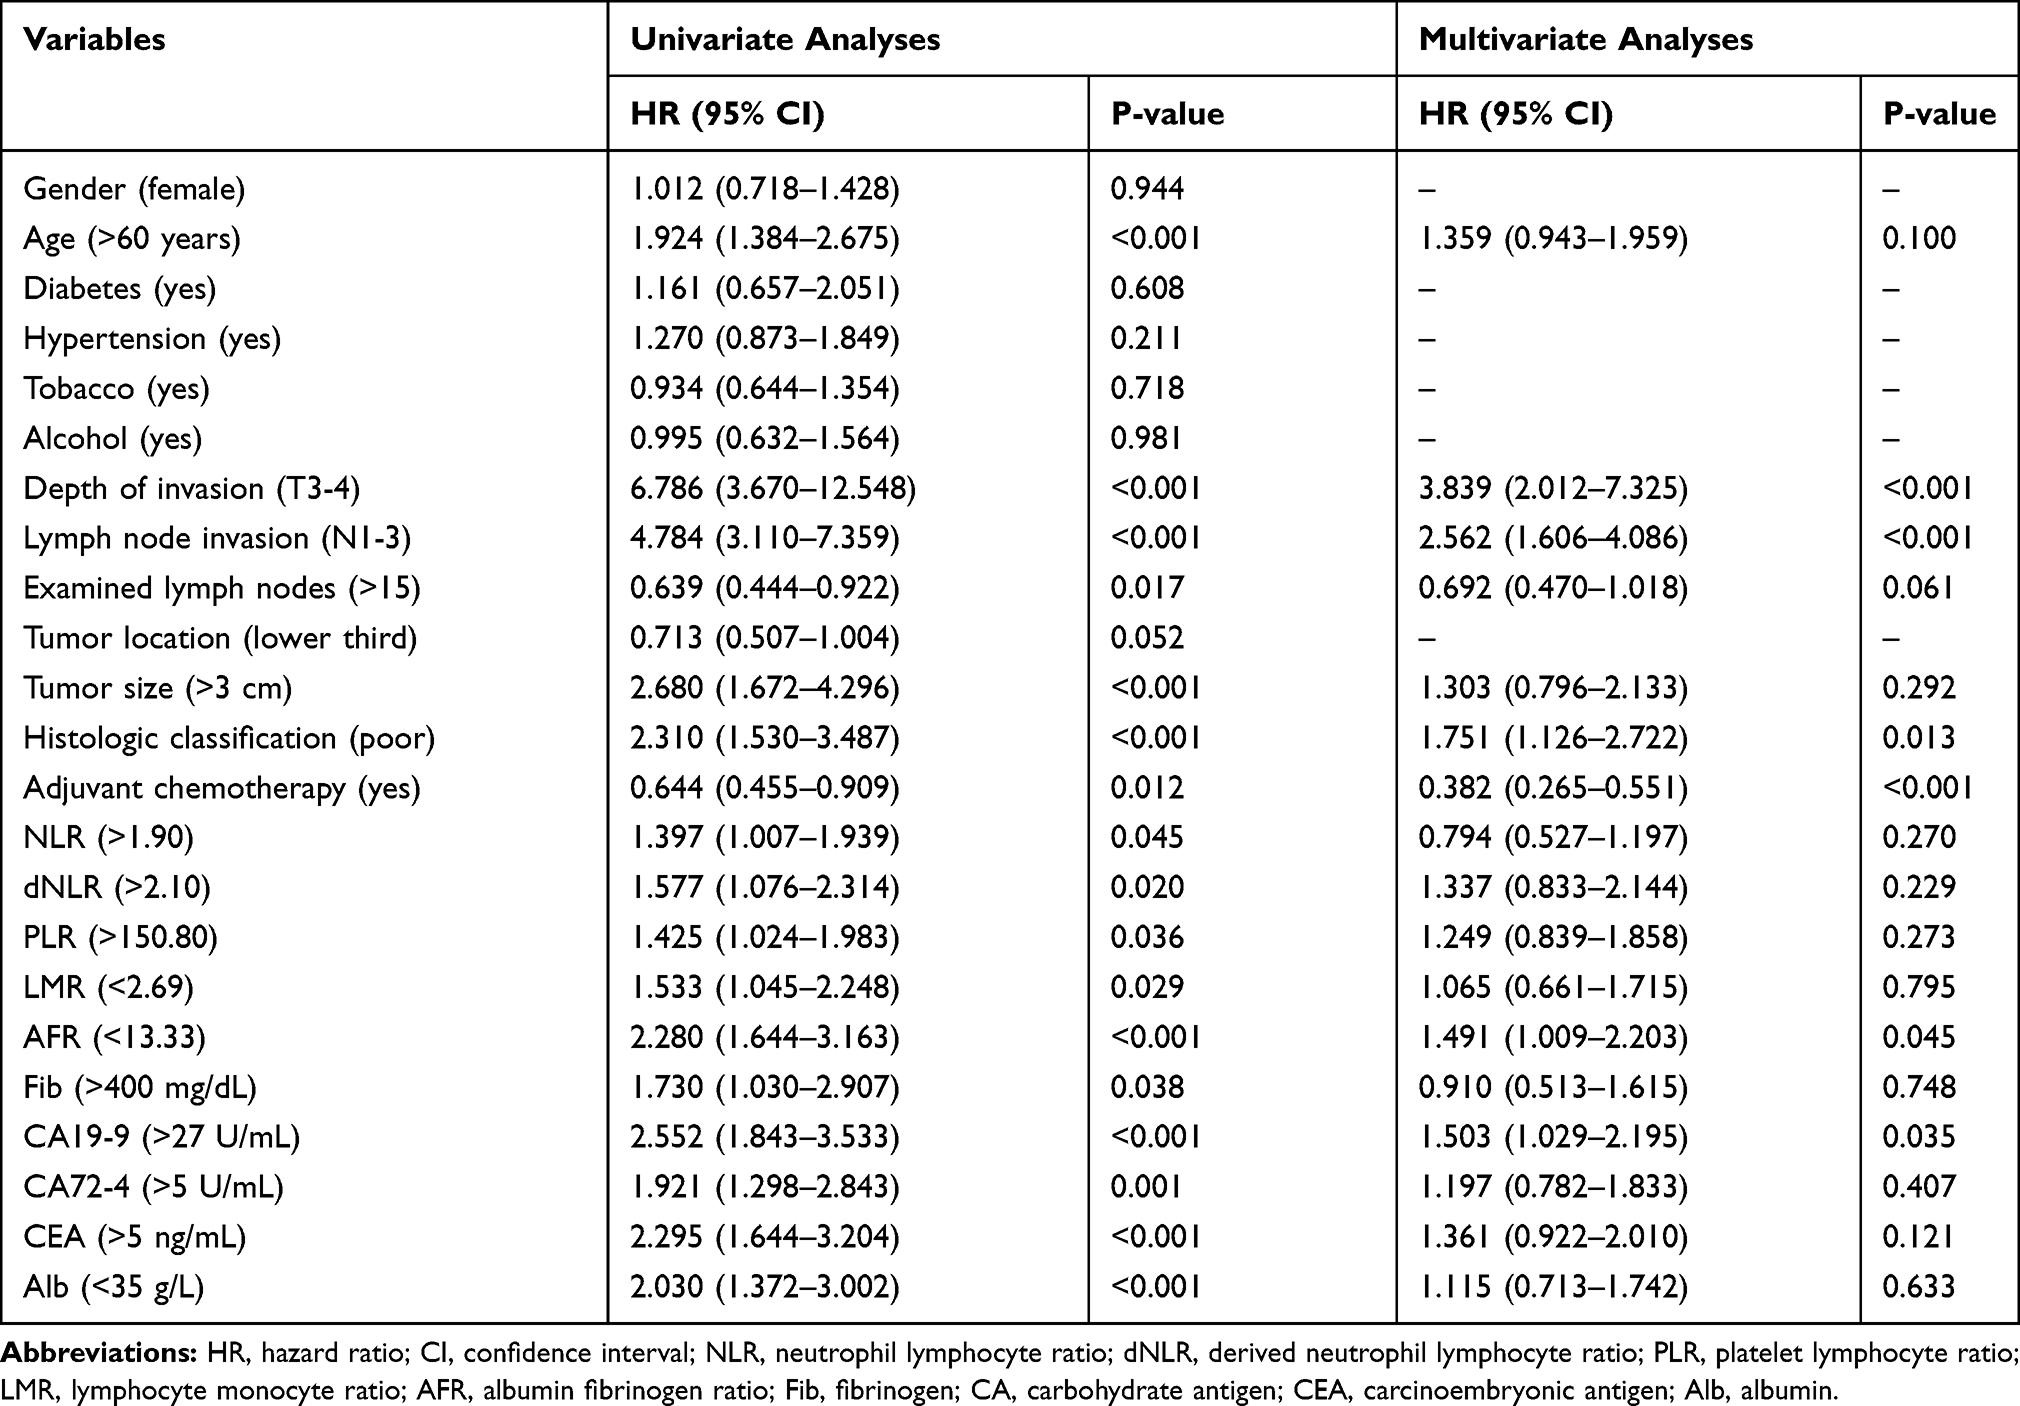 |
Table 3 Univariate and Multivariate Cox Analyses of Prognostic Factors for Cancer-Specific Survival |
After excluding non-significant variables, the remaining variables were used in the multivariate analysis. The age, depth of invasion, lymph node invasion, histologic classification, adjuvant chemotherapy, AFR, and CA19-9 were verified as independent predictors for DFS, of which adjuvant chemotherapy was associated with increased DFS. In contrast, age >60 years, pT3-4, pN1-3, poor histologic classification, lower AFR, and higher CA19-9 were associated with poor DFS (Table 2). Moreover, pT3–4, pN1–3, poor histologic classification and lower AFR were associated with poor CSS, while adjuvant chemotherapy indicated improve CSS (Table 3). The hazard ratios (HRs) for the variables are shown in Tables 2 and 3.
Establishment of the Prognostic Score
Based on the results of the multivariate analysis above, we used the significant inflammatory indicators and tumor markers (AFR and CA19-9) to establish a prognostic score which we termed ‘CACPS’ (combined AFR and CA19-9 prognostic score). Lower AFR (<13.33) and higher CA19-9 (>27 U/mL) were allocated 1 point each in the CACPS (ranging from 0 to 2). In total, 172 (42.9%) patients had CACPS 0, 177 (44.1%) had CACPS 1, and 52 (13.0%) patients with CACPS 2. The 3-year DFS rates in patients with CACPS 0, 1, and 2 were 78.5% (n=135), 52.3% (n=92), and 35.3% (n=18), respectively (P<0.001). The 3-year CSS rates in patients with CACPS 0, 1, and 2 were 83.7% (n=144), 57.1% (n=101), and 38.5% (n=20), respectively (P<0.001). The estimated 5-year DFS were 48.1% (n=39), 18.1% (n=21), and 9.8% (n=4) for CACPS 0, 1, and 2, respectively. In addition, the estimated 5-year CSS were 56.2% (n=41), 23.4% (n=25), and 10.3% (n=4), respectively. A higher CACPS score indicated significantly poorer survival in the Kaplan–Meier curve (P<0.001) (Figure 1A and B). After substituting CACPS for AFR and CA19-9 in the multivariate analysis, the results indicated that the CACPS was associated with DFS (CACPS 1: HR=2.039, 95% CI: 1.357–3.065, P=0.001; CACPS 2: HR=2.419, 95% CI: 1.397–4.186, P=0.002), and CSS (CACPS 1: HR=2.035, 95% CI: 1.292–3.205, P=0.002; CACPS 2: HR=2.255, 95% CI: 1.252–4.059, P=0.007).
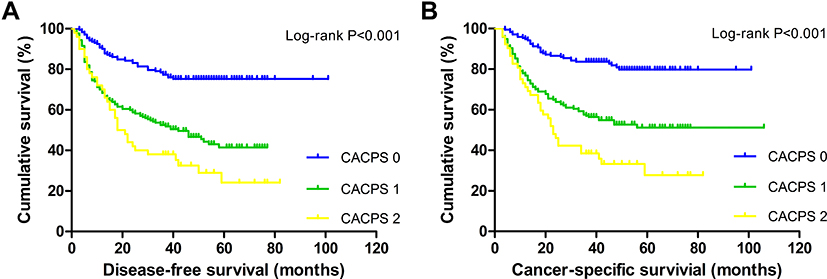 |
Figure 1 Kaplan–Meier survival curves for (A) disease-free survival and (B) cancer-specific survival according to CACPS. Abbreviation: CACPS, combined AFR and CA19-9 prognostic score. |
The relationship between the CACPS and clinicopathological characteristics is given in Table 4. There were significant differences in age, depth of invasion, lymph node invasion, TNM stage, tumor size, NLR, dNLR, PLR, LMR, Fib, CA72-4, CEA, and Alb among the three groups. In order to assess the ability of the CACPS to discriminate, the area under the curve (AUC) was compared using ROC curves. As expected, the AUC for the CACPS (0.693, P<0.001) was higher than that for other inflammatory indicators and tumor markers (NLR=0.532, dNLR=0.537, PLR=0.548, LMR=0.546, AFR=0.622, Fib=0.529, CA19-9=0.626, CA72-4=0.565, CEA=0.617, and Alb=0.541), which indicated enhanced predictive efficacy.
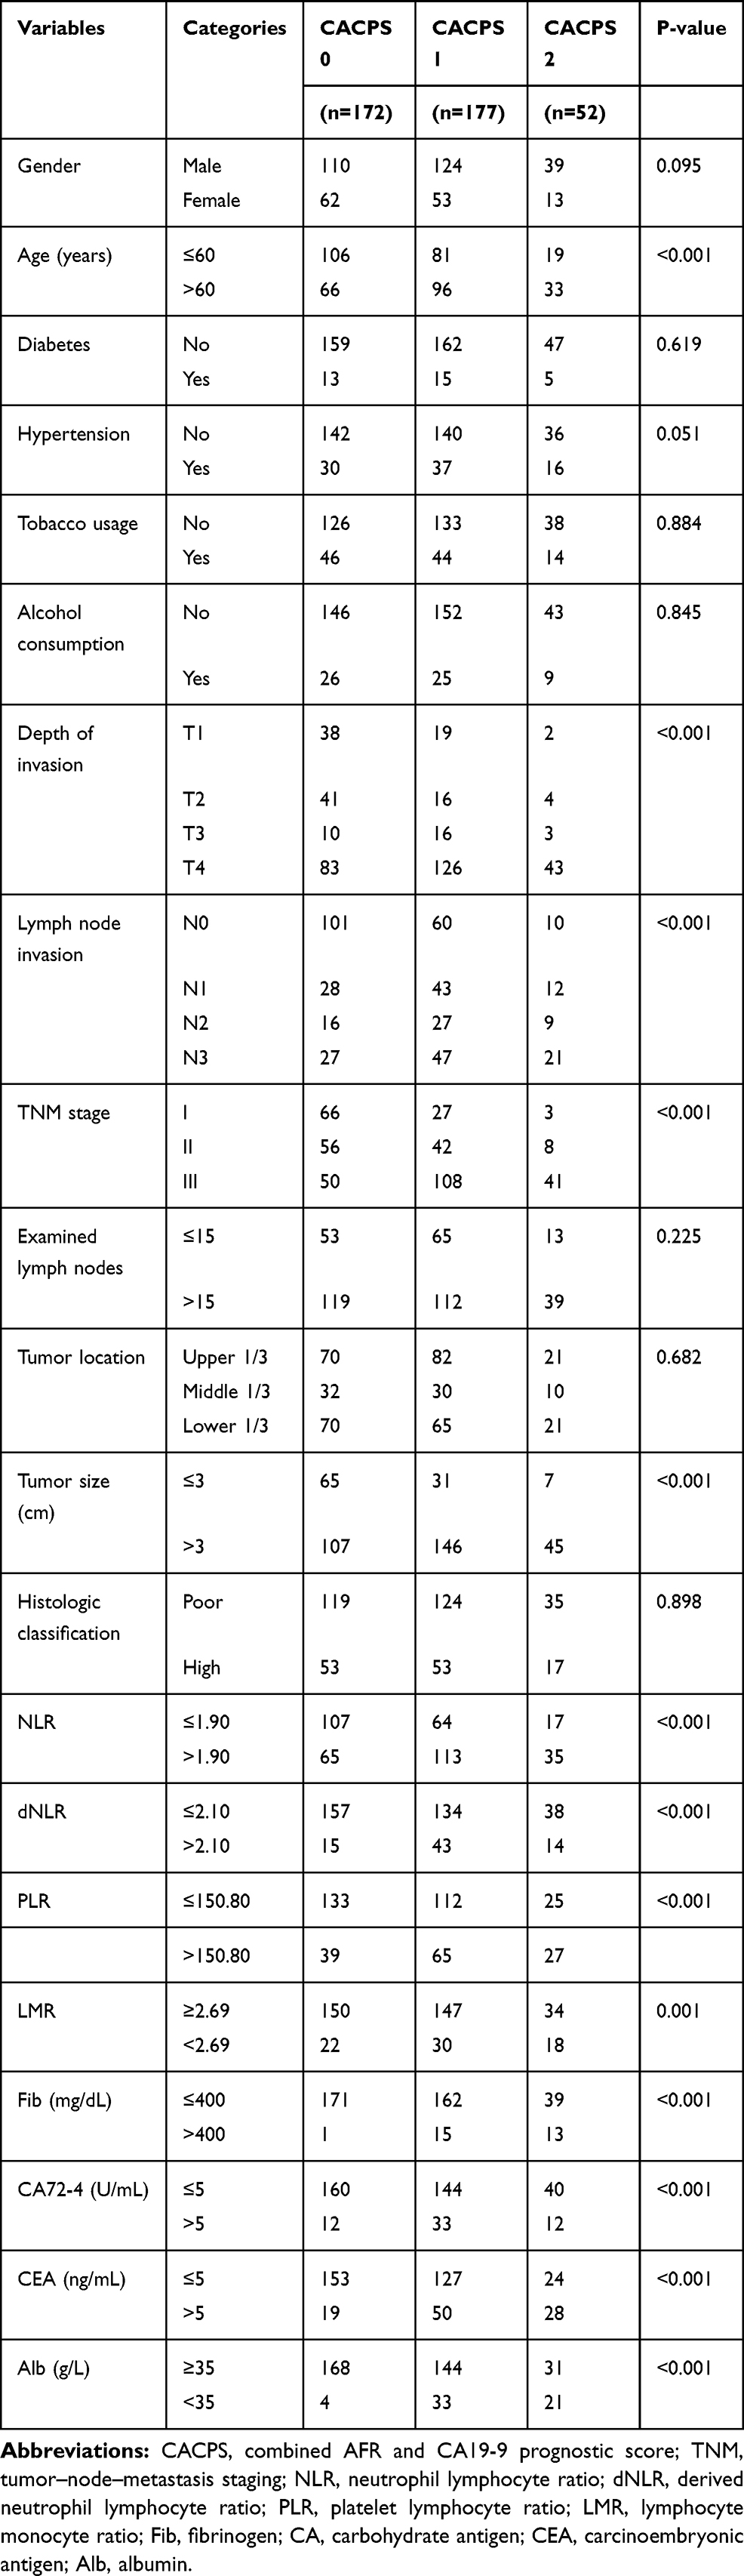 |
Table 4 The Relationship Between CACPS and Clinicopathological Characteristics in 401 Gastric Cancer Patients |
Moreover, after being stratified by AJCC classification, the predictive value of the CACPS remained significant, irrespective of whether it was for stage I–II (Figure 2A and C) or stage III (Figure 2B and D) (both P<0.05). Because there were fewer deaths of stage I patients, we combined stage I with stage II when DFS and CSS rates were calculated.
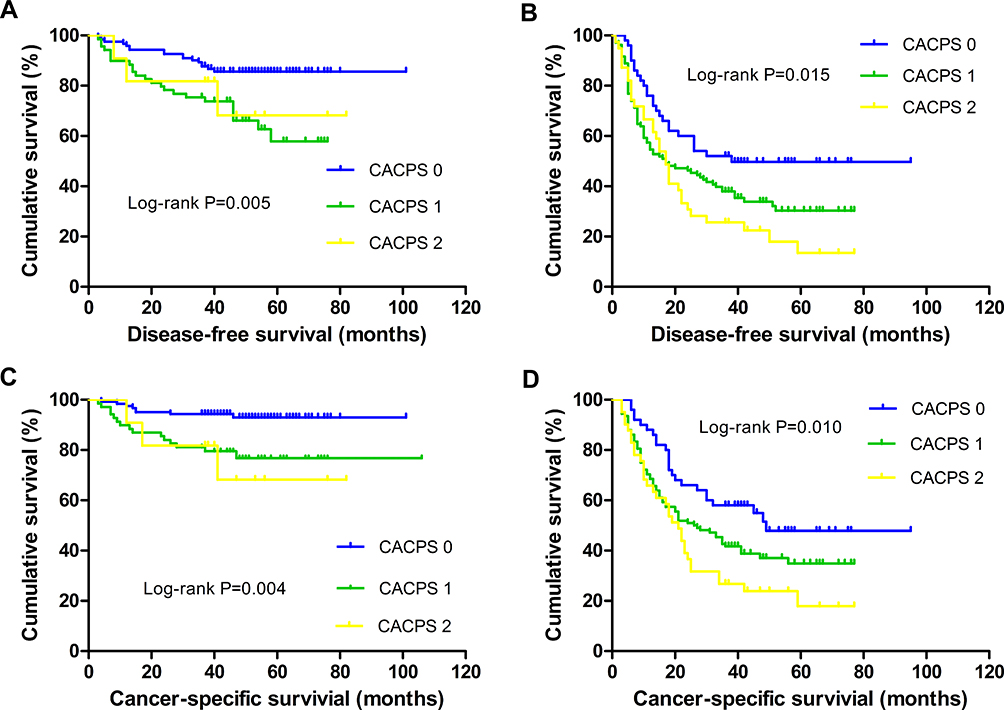 |
Figure 2 Disease-free survival based on CACPS with (A) stage I–II and (B) stage III GC; cancer-specific survival based on CACPS with (C) stage I–II and (D) stage III GC. Abbreviation: CACPS, combined AFR and CA19-9 prognostic score. |
Nomogram
In order to make individualized predictions, we tried to generate a prognostic nomogram with the significant characteristics used for the multivariate analysis involved with the CACPS, which could predict DFS (Figure 3A) and CSS (Figure 3B). The C-indices of our nomogram were 0.743 (95% CI: 0.698–0.788) and 0.766 (95% CI: 0.718–0.814) for DFS and CSS, respectively, which were higher than those for TNM staging (DFS: 0.692, 95% CI 0.650–0.734; CSS: 0.720, 95% CI 0.675–0.764) or CACPS (DFS: 0.642, 95% CI 0.601–0.682; CSS: 0.658, 95% CI 0.615–0.702). To further assess the prognostic accuracy of the nomogram, we also plotted calibration curves (Figure 4A–D), in which the drawn line is close to the diagonal, suggesting that the nomogram was accurate in its prediction.
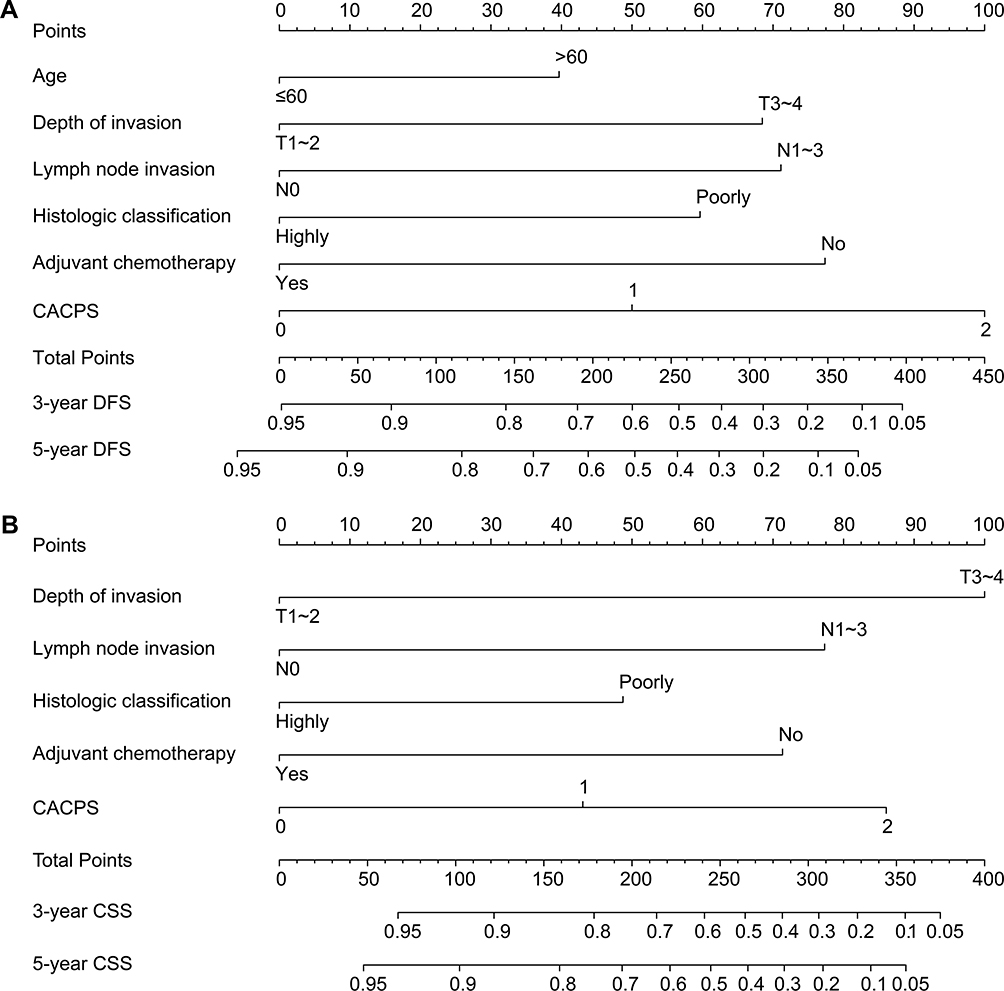 |
Figure 3 (A) Nomogram predicting 3-year and 5-year disease-free survival of gastric cancer patients who underwent gastrectomy; (B) Nomogram predicting 3-year and 5-year cancer-specific survival of gastric cancer patients who underwent gastrectomy. Note: The points for each factor were listed in the nomogram, and the total points for each patient indicated a specific probability of 3-year and 5-year DFS or CSS. Abbreviation: CACPS, combined AFR and CA19-9 prognostic score. |
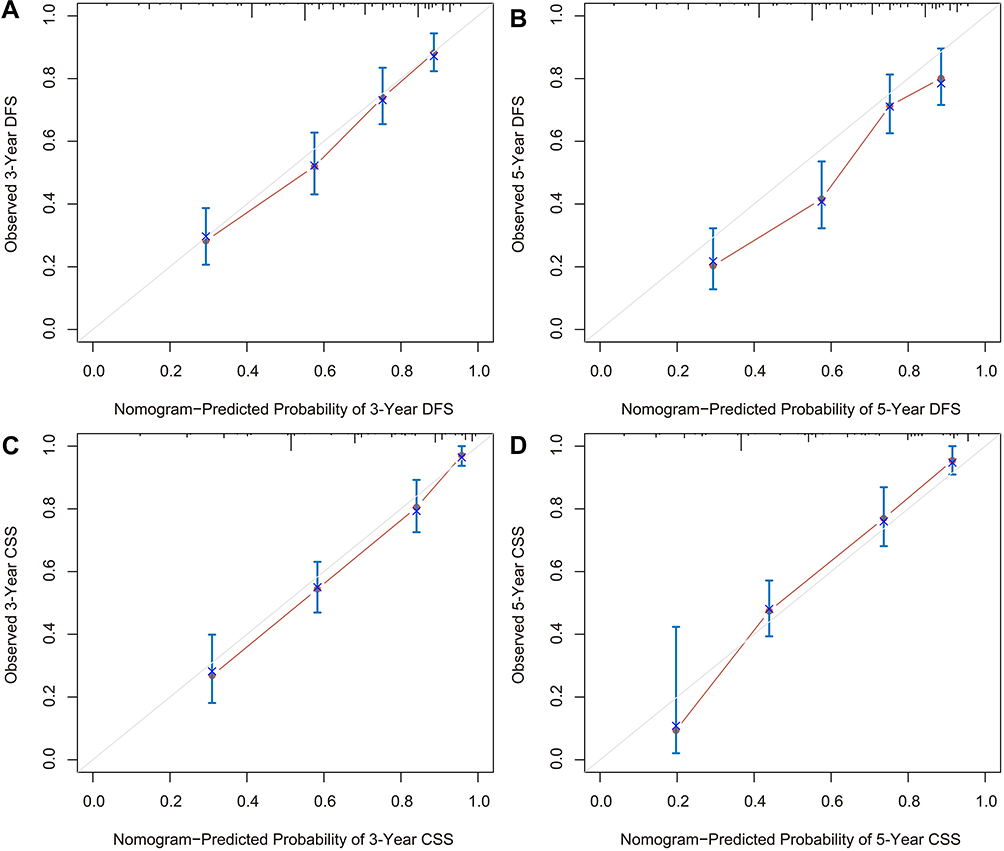 |
Figure 4 Calibration curves of the nomogram for (A) 3-year disease-free survival, (B) 5-year disease-free survival, (C) 3-year cancer-specific survival, and (D) 5-year cancer-specific survival. Note: The nomogram-predicted probability of survival is plotted on the x-axis, the actual survival calculated by the Kaplan–Meier method is plotted on the y-axis. |
Discussion
The survival rates for GC remain poor, even under the surgical center multidisciplinary team approach. GC is considered to be a complex disease due to the interaction of environmental and genetic factors.23,24 It is well known that inflammation is an important environmental factor in the development of GC, and related studies are gaining increasing attention.9–12 Cross-talk between GC cells and inflammation response forms a cancer microenvironment that promotes tumor progression,9,13,14 while, a reduced GC risk is observed in people who receive continuous low-dose anti-inflammatory drugs such as aspirin.25 Therefore, circulating inflammatory cells and proteins that indicate systemic inflammation are candidate biomarkers for predicting prognosis and survival in GC.
In this study, we evaluated the prognostic role of peripheral blood biomarkers, including inflammatory indicators, in GC patients who underwent R0 resection. Although previous studies have shown that indicators such as NLR, dNLR, PLR, LMR, and AFR are associated with inflammation, their ability to predict survival remains controversial.10,15–17 Most published studies assessed very few, or even just one, of the indicators. In this study, all the above indicators were included in a multivariate Cox model, and the results showed that only AFR independently predicted DFS (P=0.004) and CSS (P=0.045), while other indicators (NLR, dNLR, PLR, LMR) did not (P=0.270, 0.201, 0.401, 0.348 for DFS; P=0.270, 0.229, 0.273, 0.795 for CSS). This shows that AFR is more predictive than the other indicators assessed in this study. Based on these results, we established a prognostic score, which we called CACPS. The Kaplan–Meier analysis confirmed significant differences in DFS and CSS among patients grouped according to the CACPS. The group with a CACPS of 2 had the worst survival, with a median DFS of 18 months and a median CSS of 23 months (less than 2 years). The CACPS, as a combined indicator, allowed greatest discrimination in prognosis because of its higher AUC compared with individual indicators such as AFR, CA19-9, Alb, and Fib. Furthermore, the CACPS covers more high-risk populations, and expediently refines the hazard classification. In addition, CACPS was significantly related to some characteristics of poor prognosis, such as advanced age, higher TNM stage, and larger tumor size. Clearly, an increase in CACPS is related to more aggressive tumor features. As a high CACPS indicates poor survival, clinicians should try to assess these patients carefully, especially CACPS 2 patients, and encourage routine or more frequent postoperative examination.
Our current findings are consistent with previous reports. A meta-analysis of 38 studies suggested that elevated CA19-9 indicates a poor prognosis in GC.26 Yamamoto et al and Suzuki et al found that preoperative hyperfibrinogenemia predicted early recurrence and poor survival in GC.27,28 Furthermore, accumulating studies have confirmed the relationship between hypoalbuminemia, systemic inflammation, and poor outcome among several malignancies, including GC.29–31 Due to the influence of systemic inflammation, the circulating levels of vascular endothelial growth factor (VEGF) and fibroblast growth factor-2 (FGF-2) are increased in tumor patients, promoting the synthesis of fibrinogen.9,32 Fibrinogen facilitates the adhesion of tumor cells after intravasation, and forms large aggregates around cancer cells to protect them from elimination by natural killer cells, thus avoiding immunological surveillance and leading to metastatic potential.33,34 Moreover, tumor necrosis factor α (TNF-α) and IL-6 are increased in GC patients. These two inflammatory cytokines are adverse markers for GC and can inhibit the synthesis of albumin, resulting in hypoalbuminemia.35 These may be the possible reasons why Alb, Fib, and their ratio of AFR reflect prognosis in GC. In theory, direct determination of serum VEGF, FGF-2, TNF-α, and IL-6 is the best method to evaluate tumor-related inflammation. However, due to the high cost and technical requirements, it has not been routinely applied to clinical practice.
We describe a nomogram by incorporating the CACPS into clinicopathologic characteristics. The nomogram is notable for having used a contemporary, relatively recent (2007–2016) cohort of patients. A prognostic nomogram is useful for clinical application because it quantifies individual risk and allows clinicians to communicate prognosis with patients or family members. Our nomogram demonstrates better discrimination, with a C-index of 0.743 for DFS and 0.766 for CSS, compared with TNM staging alone (DFS and CSS C-index of 0.692 and 0.720, respectively). More importantly, adjuvant chemotherapy has been included in our nomogram, making it more practical in clinical practice. Although it is recommended that fluoropyrimidine-based adjuvant chemotherapy should be routinely performed after R0 resection for GC (especially for pN+ or pT2–4 patients),7,36 in reality, many patients refuse postoperative periodic treatment for various reasons. Previous research has typically selected patients receiving standard adjuvant chemotherapy, which may not be applicable to patients who did not receive adjuvant chemotherapy.
There are some limitations in the current study. First, it was a retrospective analysis, and all data originated from a single center. However, the current retrospective analysis has provided useful preliminary results, which may be built on in subsequent prospective clinical trials. Second, some predictors that were recognized as potentially significant were not included in this study, such as extranodal extension, perineural invasion and Helicobacter pylori infection, because they were not routine examination items at this center. These factors remain to be verified, and this task is one of the goals of our next study.
Conclusions
The CACPS is a highly accurate independent prognostic factor for GC after R0 resection. The nomogram based on the CACPS and clinicopathological characteristics can be used to predict DFS and CSS in an economic and convenient way.
Acknowledgments
We offer our thanks to the oncology department for their help with this manuscript. Thanks are also due to the editors and reviewers for their valuable comments, as well as The Charlesworth Group for its linguistic assistance during the preparation of this manuscript.
Disclosure
All authors declared no conflicts of interest of this work.
References
1. Bray F, Ferlay J, Soerjomataram I, Siegel RL, Torre LA, Jemal A. Global cancer statistics 2018: GLOBOCAN estimates of incidence and mortality worldwide for 36 cancers in 185 countries. CA Cancer J Clin. 2018;68(6):394–424. doi:10.3322/caac.21492
2. Torre LA, Bray F, Siegel RL, Ferlay J, Lortet-Tieulent J, Jemal A. Global cancer statistics, 2012. CA Cancer J Clin. 2015;65(2):87–108. doi:10.3322/caac.21262
3. Balakrishnan M, George R, Sharma A, Graham DY. Changing trends in stomach cancer throughout the world. Curr Gastroenterol Rep. 2017;19(8):36. doi:10.1007/s11894-017-0575-8
4. Yang Z, Wang J, Liu S, et al. Defeating relapsed and refractory malignancies through a nano-enabled mitochondria-mediated respiratory inhibition and damage pathway. Biomaterials. 2020;229:119580. doi:10.1016/j.biomaterials.2019.119580
5. Yang Z, Wang J, Ai S, Sun J, Mai X, Guan W. Self-generating oxygen enhanced mitochondrion-targeted photodynamic therapy for tumor treatment with hypoxia scavenging. Theranostics. 2019;9(23):6809–6823. doi:10.7150/thno.36988
6. Yang Z, Wang J, Liu S, et al. Tumor-targeting W18O49 nanoparticles for dual-modality imaging and guided heat-shock-response-inhibited photothermal therapy in gastric cancer. Part Part Syst Charact. 2019;36(7):1900124. doi:10.1002/ppsc.201900124
7. Noh SH, Park SR, Yang HK, et al. Adjuvant capecitabine plus oxaliplatin for gastric cancer after D2 gastrectomy (CLASSIC): 5-year follow-up of an open-label, randomised phase 3 trial. Lancet Oncol. 2014;15(12):1389–1396. doi:10.1016/S1470-2045(14)70473-5
8. Fields RC, Strong VE, Gonen M, et al. Recurrence and survival after pathologic complete response to preoperative therapy followed by surgery for gastric or gastrooesophageal adenocarcinoma. Br J Cancer. 2011;104(12):1840–1847. doi:10.1038/bjc.2011.175
9. Balkwill F, Mantovani A. Inflammation and cancer: back to Virchow? Lancet. 2001;357(9255):539–545. doi:10.1016/S0140-6736(00)04046-0
10. Shinko D, Diakos CI, Clarke SJ, Charles KA. Cancer-related systemic inflammation: the challenges and therapeutic opportunities for personalized medicine. Clin Pharmacol Ther. 2017;102(4):599–610. doi:10.1002/cpt.789
11. Mantovani A, Allavena P, Sica A, Balkwill F. Cancer-related inflammation. Nature. 2008;454(7203):436–444. doi:10.1038/nature07205
12. Grivennikov SI, Greten FR, Karin M. Immunity, inflammation, and cancer. Cell. 2010;140(6):883–899. doi:10.1016/j.cell.2010.01.025
13. Nakamura K, Smyth MJ. Targeting cancer-related inflammation in the era of immunotherapy. Immunol Cell Biol. 2017;95(4):325–332. doi:10.1038/icb.2016.126
14. Kundu JK, Surh YJ. Emerging avenues linking inflammation and cancer. Free Radic Biol Med. 2012;52(9):2013–2037. doi:10.1016/j.freeradbiomed.2012.02.035
15. Jagadesham VP, Lagarde SM, Immanuel A, Griffin SM. Systemic inflammatory markers and outcome in patients with locally advanced adenocarcinoma of the oesophagus and gastro-oesophageal junction. Br J Surg. 2017;104(4):401–407. doi:10.1002/bjs.10425
16. Liu X, Wu Z, Lin E, et al. Systemic prognostic score and nomogram based on inflammatory, nutritional and tumor markers predict cancer-specific survival in stage II–III gastric cancer patients with adjuvant chemotherapy. Clin Nutr. 2019;38(4):1853–1860. doi:10.1016/j.clnu.2018.07.015
17. Qu JL, Qu XJ, Li Z, et al. Prognostic model based on systemic inflammatory response and clinicopathological factors to predict outcome of patients with node-negative gastric cancer. PLoS One. 2015;10(6):e0128540. doi:10.1371/journal.pone.0128540
18. Li SQ, Jiang YH, Lin J, et al. Albumin-to-fibrinogen ratio as a promising biomarker to predict clinical outcome of non-small cell lung cancer individuals. Cancer Med. 2018;7(4):1221–1231. doi:10.1002/cam4.1428
19. Gao QF, Qiu JC, Huang XH, et al. The predictive and prognostic role of a novel ADS score in esophageal squamous cell carcinoma patients undergoing esophagectomy. Cancer Cell Int. 2018;18:153. doi:10.1186/s12935-018-0648-2
20. Shimada H, Noie T, Ohashi M, Oba K, Takahashi Y. Clinical significance of serum tumor markers for gastric cancer: a systematic review of literature by the Task Force of the Japanese Gastric Cancer Association. Gastric Cancer. 2014;17(1):26–33. doi:10.1007/s10120-013-0259-5
21. Yu J, Zheng W. An alternative method for screening gastric cancer based on serum levels of CEA, CA19-9, and CA72-4. J Gastrointest Cancer. 2018;49(1):57–62. doi:10.1007/s12029-016-9912-7
22. Japanese Gastric Cancer A. Japanese gastric cancer treatment guidelines 2014 (ver. 4). Gastric Cancer. 2017;20(1):1–19. doi:10.1007/s10120-016-0622-4
23. Graham DY. Helicobacter pylori update: gastric cancer, reliable therapy, and possible benefits. Gastroenterology. 2015;148(4):719–731 e713. doi:10.1053/j.gastro.2015.01.040
24. Fang X, Wei J, He X, et al. Landscape of dietary factors associated with risk of gastric cancer: a systematic review and dose-response meta-analysis of prospective cohort studies. Eur J Cancer. 2015;51(18):2820–2832. doi:10.1016/j.ejca.2015.09.010
25. Kim MH, Chang J, Kim WJ, Banerjee S, Park SM. Cumulative dose threshold for the chemopreventive effect of aspirin against gastric cancer. Am J Gastroenterol. 2018;113(6):845–854. doi:10.14309/00000434-201806000-00015
26. Song YX, Huang XZ, Gao P, et al. Clinicopathologic and prognostic value of serum carbohydrate antigen 19-9 in gastric cancer: a meta-analysis. Dis Markers. 2015;2015:549843. doi:10.1155/2015/549843
27. Yamamoto M, Kurokawa Y, Miyazaki Y, et al. Usefulness of preoperative plasma fibrinogen versus other prognostic markers for predicting gastric cancer recurrence. World J Surg. 2016;40(8):1904–1909. doi:10.1007/s00268-016-3474-5
28. Suzuki T, Shimada H, Nanami T, et al. Hyperfibrinogenemia is associated with inflammatory mediators and poor prognosis in patients with gastric cancer. Surg Today. 2016;46(12):1394–1401. doi:10.1007/s00595-016-1339-z
29. Gupta D, Lis CG. Pretreatment serum albumin as a predictor of cancer survival: a systematic review of the epidemiological literature. Nutr J. 2010;9:69. doi:10.1186/1475-2891-9-69
30. Ceciliani F, Giordano A, Spagnolo V. The systemic reaction during inflammation: the acute-phase proteins. Protein Pept Lett. 2002;9(3):211–223. doi:10.2174/0929866023408779
31. Al-Shaiba R, McMillan DC, Angerson WJ, Leen E, McArdle CS, Horgan P. The relationship between hypoalbuminaemia, tumour volume and the systemic inflammatory response in patients with colorectal liver metastases. Br J Cancer. 2004;91(2):205–207. doi:10.1038/sj.bjc.6601886
32. Dvorak HF. Tumors: wounds that do not heal-redux. Cancer Immunol Res. 2015;3(1):1–11. doi:10.1158/2326-6066.CIR-14-0209
33. Palumbo JS, Kombrinck KW, Drew AF, et al. Fibrinogen is an important determinant of the metastatic potential of circulating tumor cells. Blood. 2000;96(10):3302–3309. doi:10.1182/blood.V96.10.3302
34. Palumbo JS, Talmage KE, Massari JV, et al. Platelets and fibrin(ogen) increase metastatic potential by impeding natural killer cell-mediated elimination of tumor cells. Blood. 2005;105(1):178–185. doi:10.1182/blood-2004-06-2272
35. Tanaka T, Narazaki M, Kishimoto T. IL-6 in inflammation, immunity, and disease. Cold Spring Harb Perspect Biol. 2014;6(10):a016295. doi:10.1101/cshperspect.a016295
36. Cai Z, Yin Y, Yin Y, et al. Comparative effectiveness of adjuvant treatments for resected gastric cancer: a network meta-analysis. Gastric Cancer. 2018;21(6):1031–1040. doi:10.1007/s10120-018-0831-0
 © 2020 The Author(s). This work is published and licensed by Dove Medical Press Limited. The full terms of this license are available at https://www.dovepress.com/terms.php and incorporate the Creative Commons Attribution - Non Commercial (unported, v3.0) License.
By accessing the work you hereby accept the Terms. Non-commercial uses of the work are permitted without any further permission from Dove Medical Press Limited, provided the work is properly attributed. For permission for commercial use of this work, please see paragraphs 4.2 and 5 of our Terms.
© 2020 The Author(s). This work is published and licensed by Dove Medical Press Limited. The full terms of this license are available at https://www.dovepress.com/terms.php and incorporate the Creative Commons Attribution - Non Commercial (unported, v3.0) License.
By accessing the work you hereby accept the Terms. Non-commercial uses of the work are permitted without any further permission from Dove Medical Press Limited, provided the work is properly attributed. For permission for commercial use of this work, please see paragraphs 4.2 and 5 of our Terms.