")
Back to Journals » Diabetes, Metabolic Syndrome and Obesity » Volume 14
A Predictive Model of Metabolic Syndrome by Medical Examination: Evidence from an 8-Year Chinese Cohort
Authors Guo H, Jiang W, Zhao B, Xiong Y , Lu Z
Received 6 April 2021
Accepted for publication 8 July 2021
Published 8 November 2021 Volume 2021:14 Pages 4459—4467
DOI https://doi.org/10.2147/DMSO.S314550
Checked for plagiarism Yes
Review by Single anonymous peer review
Peer reviewer comments 2
Editor who approved publication: Prof. Dr. Juei-Tang Cheng
Huanyu Guo,1,* Wenwei Jiang,2,* Bo Zhao,1 Yanhua Xiong,3 Zhenya Lu1
1Department of FSTC Clinic of The First Affiliated Hospital, College of Medicine, Zhejiang University, Hangzhou, 310009, People’s Republic of China; 2Department of Internal Medicine of Traditional Chinese Medicine, Huzhou Central Hospital, Huzhou, 310003, People’s Republic of China; 3Department of Internal Medicine of Traditional Chinese Medicine, Zhejiang Hospital, Hangzhou, 310007, People’s Republic of China
*These authors contributed equally to this work
Correspondence: Zhenya Lu
Department of FSTC Clinic of The First Affiliated Hospital, College of Medicine, Zhejiang University, Hangzhou, 310009, People’s Republic of China
Tel +86 13575458480
Email [email protected]
Purpose: To develop a predictive model for the risk of metabolic syndrome (MetS).
Patients and Methods: Totally, 1556 residents without MetS were finally included in 2006 and they were observed for 8 years to check who developed MetS. Univariate and multivariate logistic regression analyses was adopted to explore the risk factors of MetS and develop the predictive model that used the medical examination information of MetS risk after 8 years. The receiver operating characteristic (ROC) curve was drawn to assess the predictive capacity of the model.
Results: The risk of MetS in overweight, prehypertension, hypertension subjects were 4.610 [95% confidence interval (CI): 2.415 to 8.800], 2.759 (95% CI: 1.519 to 5.011) and 3.589 (95% CI: 1.672 to 7.706) times higher than that in controls, respectively. The risk of MetS in people with high-density lipoprotein (HDL) < 1.10 mmol/L was 3.716-fold in comparison with HDL ≥ 1.55 mmol/L [odds risk (OR) = 3.716, 95% CI: 1.483 to 9.313]. Individuals with fatty liver had a higher risk of MetS (OR = 2.577, 95% CI: 1.472 to 4.512). The AUC of the predictive model was 0.831 (95% CI: 0.798 to 0.865), with the sensitivity of 0.898 (95% CI: 0.831 to 0.941) and the specificity of 0.676 (95% CI: 0.651 to 0.700).
Conclusion: The model performed well predictive power for the risk of MetS, which may provide a reference for clinicians to identify high-risk groups early.
Keywords: metabolic syndrome, predictive model, 8-year, Chinese cohort
Introduction
Metabolic syndrome (MetS) is a series of metabolic disorders, mainly consisting of obesity [body mass index (BMI) ≥25.0 kg/m2], dyslipidemia (TG ≥1.7mmol/L), hypertension (BP ≥140/90 mmHg), and dysglycemia [type 2 diabetes mellitus (T2DM)].1 It manifests as insulin resistance (IR) and chronic low-grade inflammation.2,3 IR has been identified as the central feature of the MetS, which is associated with increased risk of cardiovascular diseases (CVDs).4 Over the past several decades, the prevalence of MetS is relatively high5,6 ranged 30–50% in most Asian countries,7 with major public consequences.
MetS is related to the risk of future cardiovascular diseases (CVDs) and T2DM both in children and adults.8,9 As one of the leading global health burdens, the risk of CVD morbidity and mortality was reported to increase by 71% and 68% in males, 89%, and 73% in females with the presence of MetS in a meta-analysis study towards the general Japanese population.10 Besides, patients with MetS were also reported with a higher risk of postoperative complications and 30-day readmission.11 Thus, it is worthy of using the annual medical examination indicators to predict MetS risk in the future so that early intervention could be implemented to control and avoid MetS and its secondary diseases.
Single anthropometric indices, such as waist circumference and conicity index, have been used in previous cross-sectional studies to predict the possibility of MetS incidence.12 This retrospective cohort study was mainly designed to construct a predictive system for MetS risk, using basic medical examination data. This study may also provide a basic reference with spontaneous change for further relative intervention study.
Materials and Methods
Data Collection
Data of 2054 participants were collected in a hospital in Hangzhou, Zhejiang province, China. According to the medical examination in 2006, 498 patients were excluded at the baseline, including 115 patients with systolic blood pressure (SBP) below 90 mmHg or diastolic BP (DBP) below 60 mmHg, 180 patients with blood glucose below 2.8mmol/L, 77 patients with a body mass index (BMI) of <18.5 kg/m2 and 126 with diagnosed MetS. Ultimately, 1556 residents without MetS were finally included in 2006 and they were observed for 8 years to check who developed MetS. The research including any relevant details was approved by the Institutional Review Board (IRB) of the First Affiliated Hospital of Zhejiang University School of Medicine [Ref. No. 2020_IIT (405)] and performed in accordance with the Declaration of Helsinki, and the informed consent was obtained from all participants.
Medical Examination Information
Basic information in the medical examination report included gender, age, BMI, and BP. The blood examination indicators included fasting plasma glucose (FPG), high-density lipoprotein cholesterol (HDL-C), low-density lipoprotein cholesterol (LDL-C), triglycerides (TGs), total cholesterol (TC), very LDL-C (VLDL-C), hemoglobin (Hb), platelets (PLT), white blood cell (WBC), albumin (ALB), globulin (GLB), neutrophil (NEUT), serum uric acid (UA), and fatty liver disease.
According to the standard developed by Chinese diabetes society in 2004,13 MetS could be diagnosed if the patient have three or more following symptoms: 1) overweight or obese: BMI ≥25.0 kg/m2; 2) FPG ≥ 6.1 mmol/L and 2-hour postprandial blood glucose (2hPG) ≥7.8 mmol/L, or 2hPG ≥7.8 mmol/L; or drug treatment for diabetes mellitus (DM); 3) BP: SBP ≥140 mmHg and DBP ≥ 90 mmHg, or DBP ≥ 90 mmHg; or drug treatment for hypertension; (d) fasting serum TG ≥1.7mmol/L and fasting HDL-C <0.9 mmol/L; or fasting HDL-C <0.9 mmol/L and <1.0 mmol/L in male and female patients, respectively.
Abdominal ultrasonographic examinations were performed by experienced radiologists using a Toshiba Nemio 20 sonography machine (Toshiba, Tokyo, Japan) with a 3.5-MHz probe. Fatty liver was diagnosed according to the criteria described by the Chinese Liver Disease Association.14
The BP was categorized into 1) normal group: SBP ≤120 mmHg and DBP ≤80 mmHg; 2) prehypertension group: 120 mmHg < SBP < 140 mmHg or 80 mmHg < DBP < 90 mmHg; (c) hypertension: SBP ≥140 mmHg or DBP≥ 90 mmHg.
The FPG was categorized into three levels: 1) normal FPG: FPG ≤ 6.1 mmol/L; 2) impaired FPG: 6.1 mmol/L < FPG < 6.9 mmol/L; and 3) suspected T2DM: FPG ≥ 6.9 mmol/L.
Data Analysis
The statistical tests were performed using SAS v.9.4 (SAS Institute, Cary, NC, USA). According to the examination data of 2014, the participants were divided into MetS and non-MetS groups. Univariate and multivariate logistic regression analyses were used to explore the risk factors of MetS and develop the predictive model, which used the medical examination information for MetS risk after 8 years. The relative risk (RR) and odds risk (OR) were calculated, represented by 95% confidence interval (95% CI). The receiver operating characteristic (ROC) curves were adopted to estimate the predictive capacity of the model. Areas under the ROC curve (AUCs) were calculated. A significant P < 0.05 was considered for all the analyses.
Results
Baseline Information
The flowchart of data filtering was shown in Figure 1. Ultimately, 1556 residents were finally included in the present research, including 1040 (66.84%) males and 516 (33.16%) females, with an average age of 49.36 ± 12.07 years. Among these individuals, 980 (65.60%) suffered from fatty liver, 611 (39.27%) were overweight. There were 641 (41.20%) patients with prehypertension, 171 (10.99%) patients with hypertension. Sixteen (1.04%) people had prediabetes, and 19 (1.24%) had diabetes. The detailed information for all the included samples is presented in Table 1.
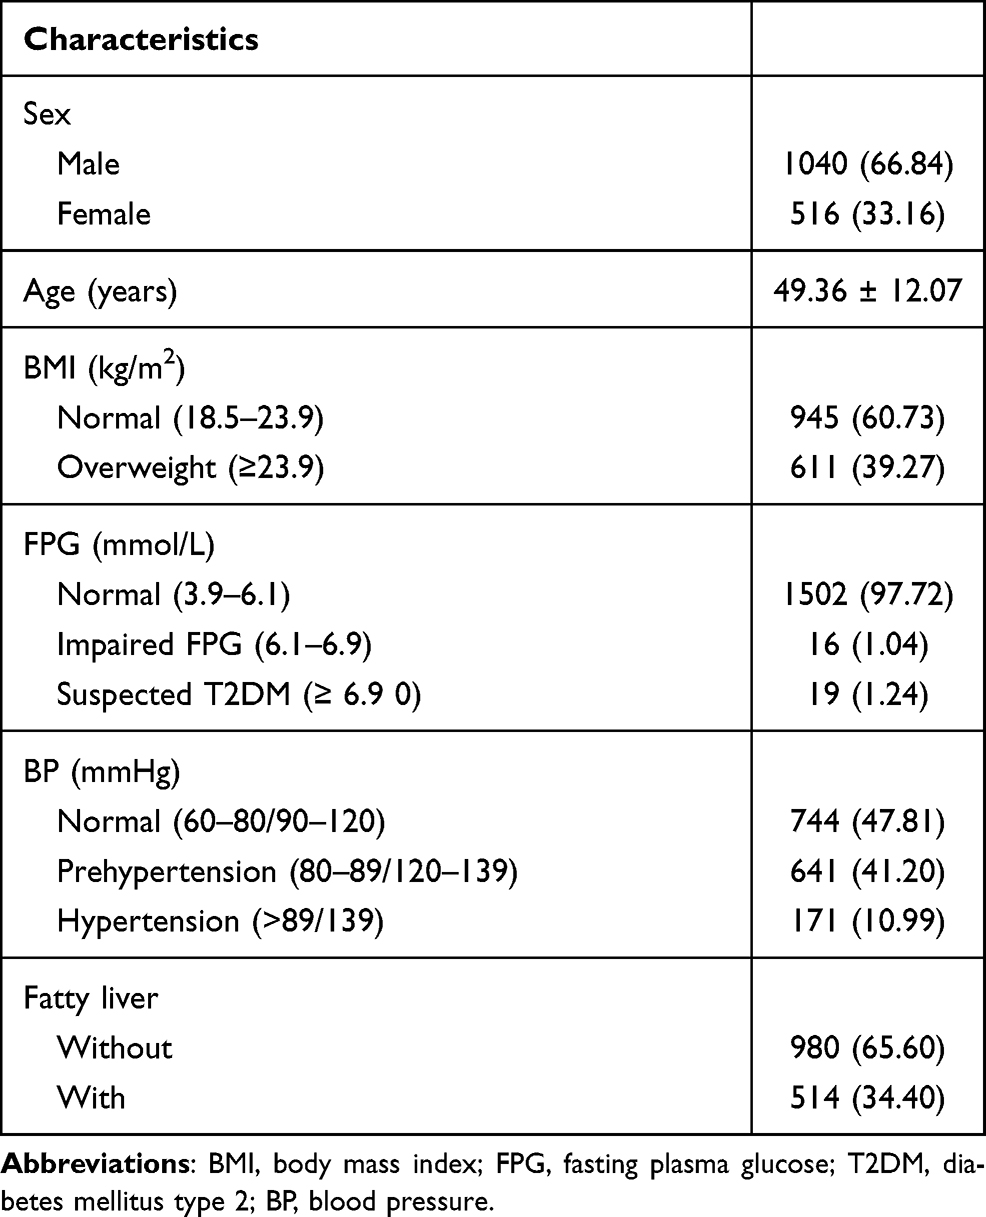 |
Table 1 Baseline Information of the Participants [n (%) or x ± s)] |
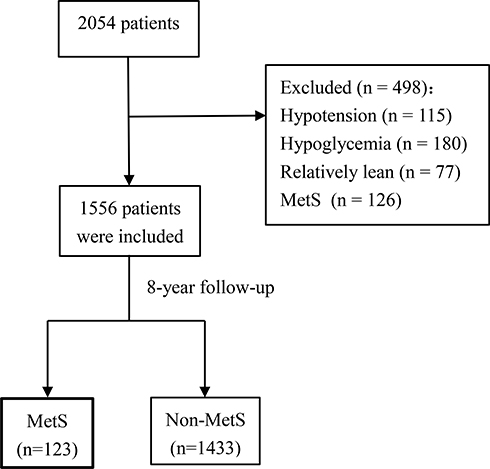 |
Figure 1 Flowchart of data screening. |
Univariate Analysis Results
The results of the univariate analysis on general data are shown in Table 2. After an 8-year follow-up, 123 people developed MetS, and 1433 did not. The risk of MetS in people aged ≥50 years, overweight, and fatty liver patients were 1.511 (95% CI: 1.067 to 2.141, P < 0.05), 9.644 (95% CI: 5.838 to 15.929, P < 0.05), 5.59 (95% CI: 3.748 to 8.347, P < 0.05) times higher than that in controls, respectively. Compared to participants with normal BP, the risk of MetS in those with prehypertension increased by 2.482 times (RR = 3.482, 95% CI: 2.242 to 5.407, P < 0.05), and hypertension increased by 3.003 times (RR = 4.003, 95% CI: 2.330 to 6.878, P < 0.05). Patients with FPG > 6.9 mmol/L were more likely to suffer from MetS than those with FPG between 3.9 and 6.1 mmol/L (RR = 2.774, 95% CI: 1.141 to 6.744, P < 0.05).
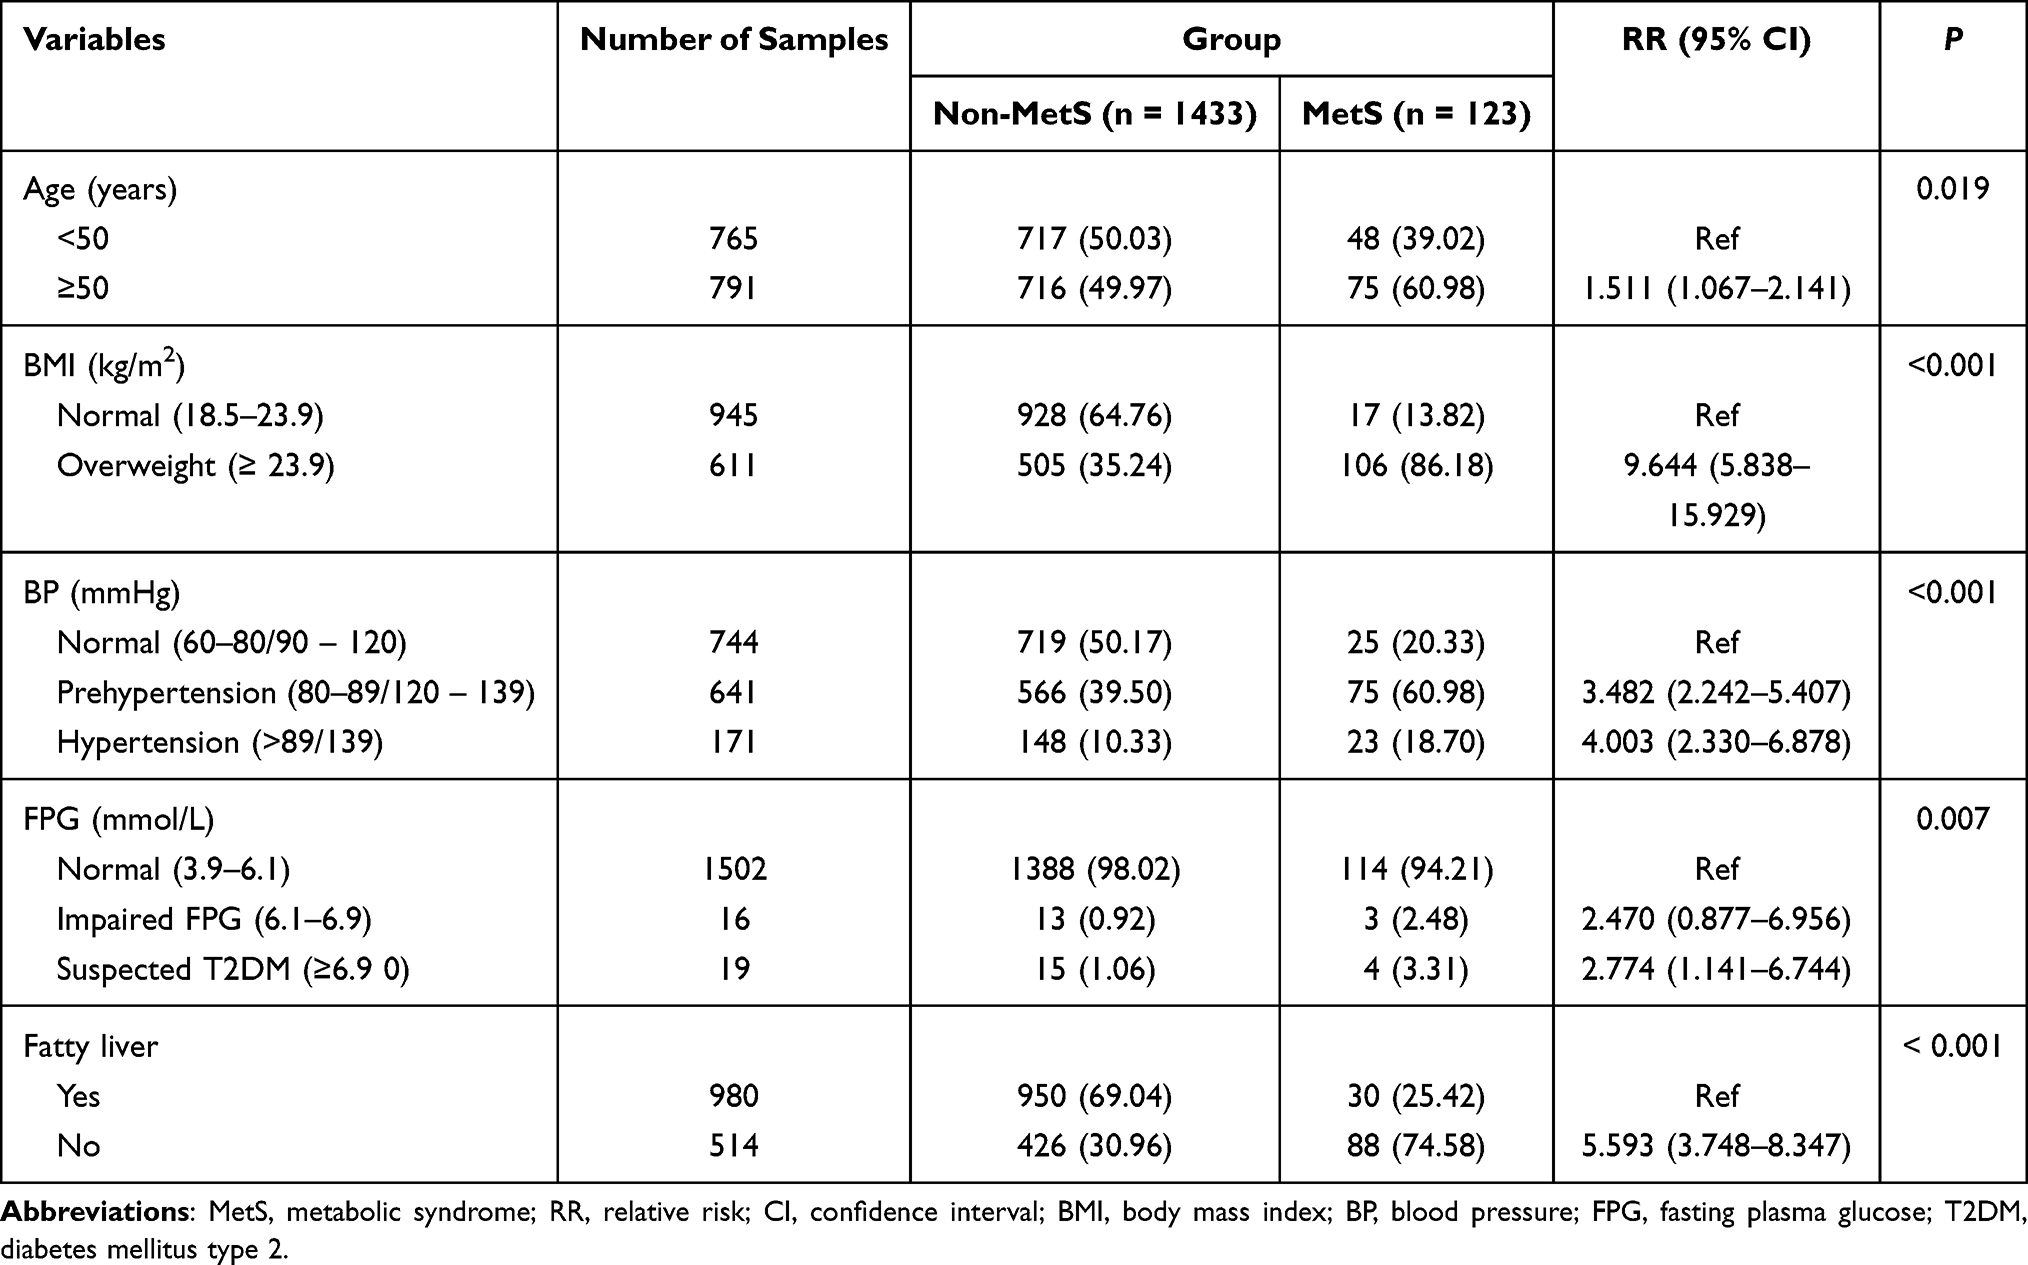 |
Table 2 Comparison of General Data Between the Two Groups [n (%)] |
The results of the univariate analysis on laboratory examination indexes are shown in Table 3. The risk of MetS in people with TG levels between 0.89 and 1.32 mmol/L and between 1.32 and 2.03 mmol/L, ≥2.03 mmol/L were 6.546 (95% CI: 1.961 to 21.847, P < 0.05), 11.574 (95% CI: 3.595 to 37.265, P < 0.05) and 20.948 (95% CI: 6.639 to 66.098, P < 0.05) times in comparison with TGs <0.89 mmol/L, respectively. The risk of MetS in people with HDL-C levels <1.10 mmol/L, between 1.10 and 1.30 mmol/L, and between 1.30 and 1.53 mmol/L were 7.955 (95% CI: 3.856 to 16.413, P < 0.05), 4.370 (95% CI: 2.049 to 9.320, P < 0.05) and 2.807 (95% CI: 1.258 to 6.259, P < 0.05) folds in comparison with ≥1.53 mmol/L, respectively. The MetS risk was relatively higher among those with VLDL-C levels between 0.91 and 1.49 mmol/L (RR = 4.021, 95% CI: 1.973 to 8.195, P < 0.05) and ≥1.49 mmol/L (RR = 4.880, 95% CI: 2.424 to 9.823, P < 0.05) in comparison to those with <0.56 mmol/L. Individuals with TC level ≥4.66 mmol/L exhibited higher MetS risks in comparison to those with <4.66 mmol/L (RR = 1.711, 95% CI: 1.202 to 2.436, P < 0.05). Participants with Hb levels between 147 and 156 g/L (RR = 2.636, 95% CI: 1.431 to 4.858, P < 0.05) and ≥156 g/L (RR = 3.235, 95% CI: 1.770 to 5.911, P < 0. 05) tended to have a higher risk of MetS than those with <134 g/L. Higher risk of MetS in those with WBC between 5.90 and 6.80 × 10⁹/L (RR = 1.820, 95% CI: 1.041 to 3.184, P < 0.05) and ≥6.80 × 10⁹/L (RR = 2.203, 95% CI: 1.282 to 3.787, P < 0.05) compared with those <5.10 × 10⁹/L were observed. Individuals with NEUC ≥ 4.00 × 10⁹/L were more likely to suffer from MetS than those <2.70 × 10⁹/L (RR = 2.050, 95% CI: 1.228 to 3.425, P < 0.05).
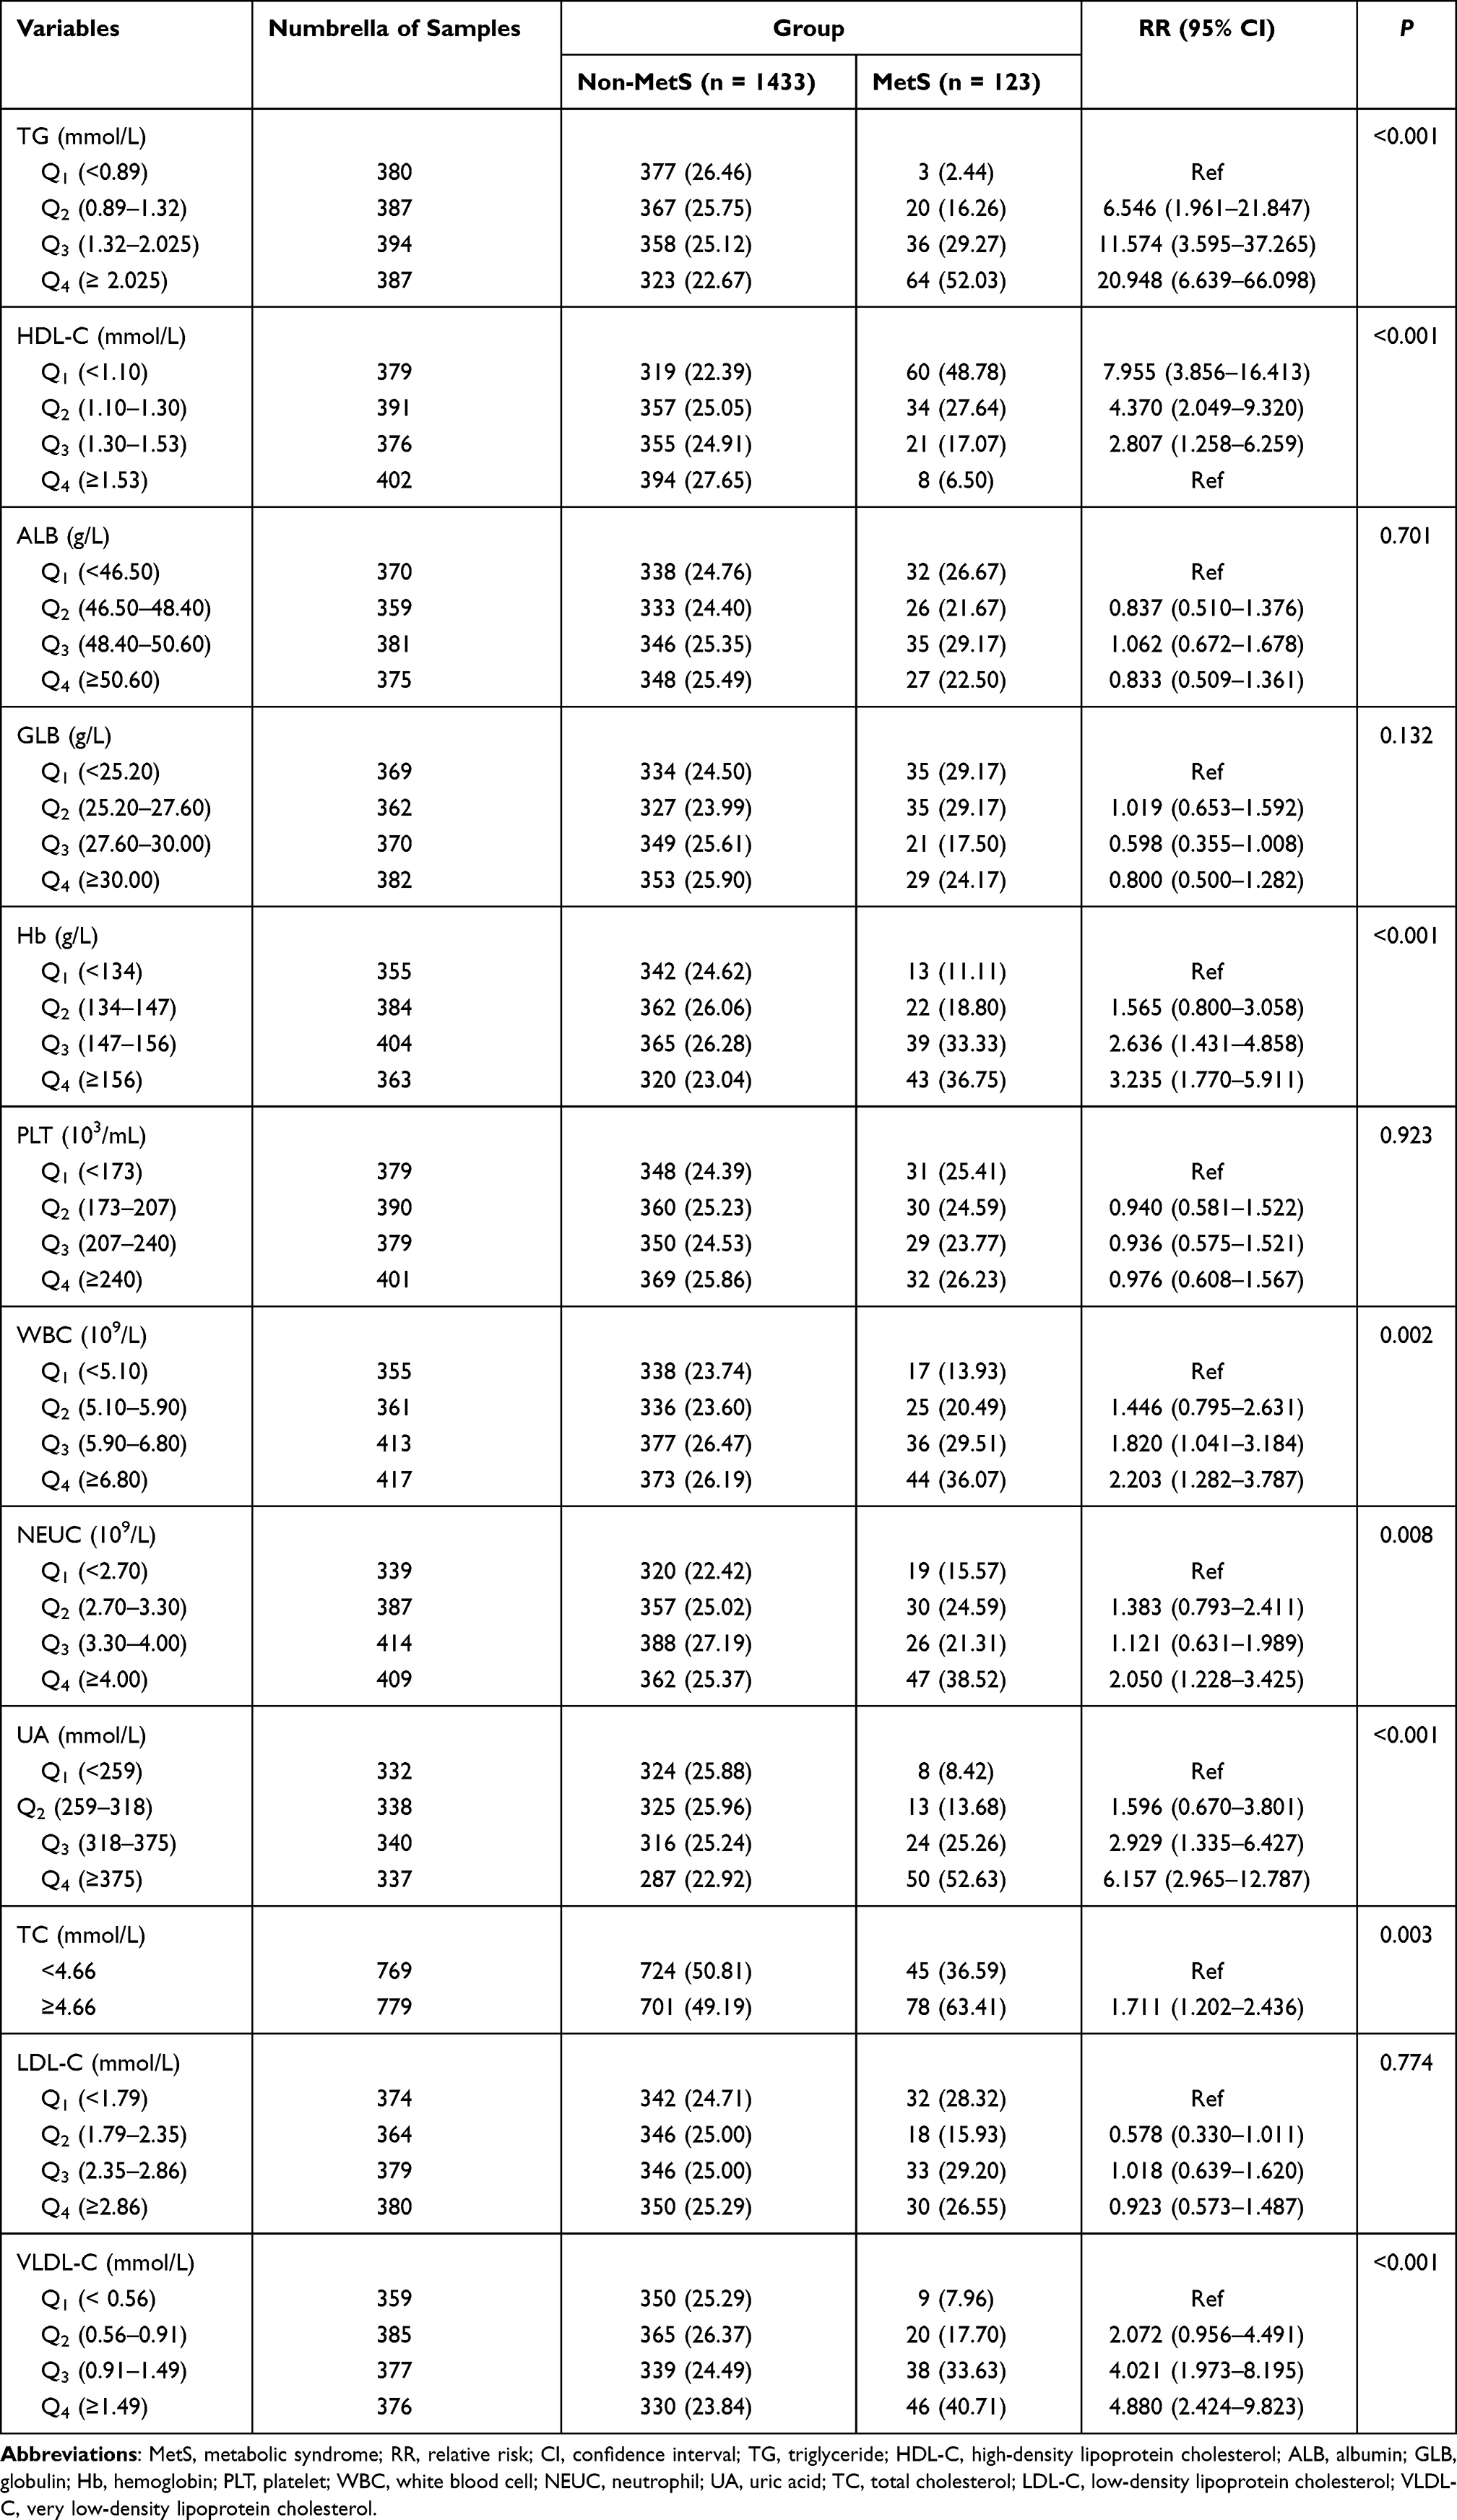 |
Table 3 Comparison of Laboratory Examination Indicators Between the Two Groups [n (%)] |
Multivariate Analysis for the Risk of MetS
The results of the multivariate analysis are shown in Table 4. Factors with differences in univariate analysis were further analyzed using stepwise multivariate logistic regression, including age, BMI, BP, FPG, TG, HDL-C, Hb, WBC, NEUT, UA, TC, VLDL-C, and fatty liver. The results showed that BMI, prehypertension, hypertension, HDL-C, and fatty liver were the independent predictors of the occurrence of MetS. The risk of MetS in overweight, prehypertension, hypertension subjects were 4.610 (95% CI: 2.415 to 8.800, P < 0.05), 2.759 (95% CI: 1.519 to 5.011, P < 0.05), and 3.589 (95% CI: 1.672 to 7.706, P < 0.05) times higher than that in controls, respectively. The risk of MetS in people with HDL-C <1.10 mmol/L was 3.716-fold in comparison with HDL-C ≥1.55 mmol/L (OR = 3.716, 95% CI: 1.483 to 9.313, P < 0.05). Individuals with fatty liver exert higher MetS risks (OR = 2.577, 95% CI: 1.472 to 4.512, P < 0.05). A Logistic regression model was established: Y = 1.528 × BMI (overweight) +1.015 × BP (prehypertension) + 1.278 × BP (hypertension) + 1.313 × HDL-C (<1.10 mmol/L) + 0.947 × fatty liver −5.570.
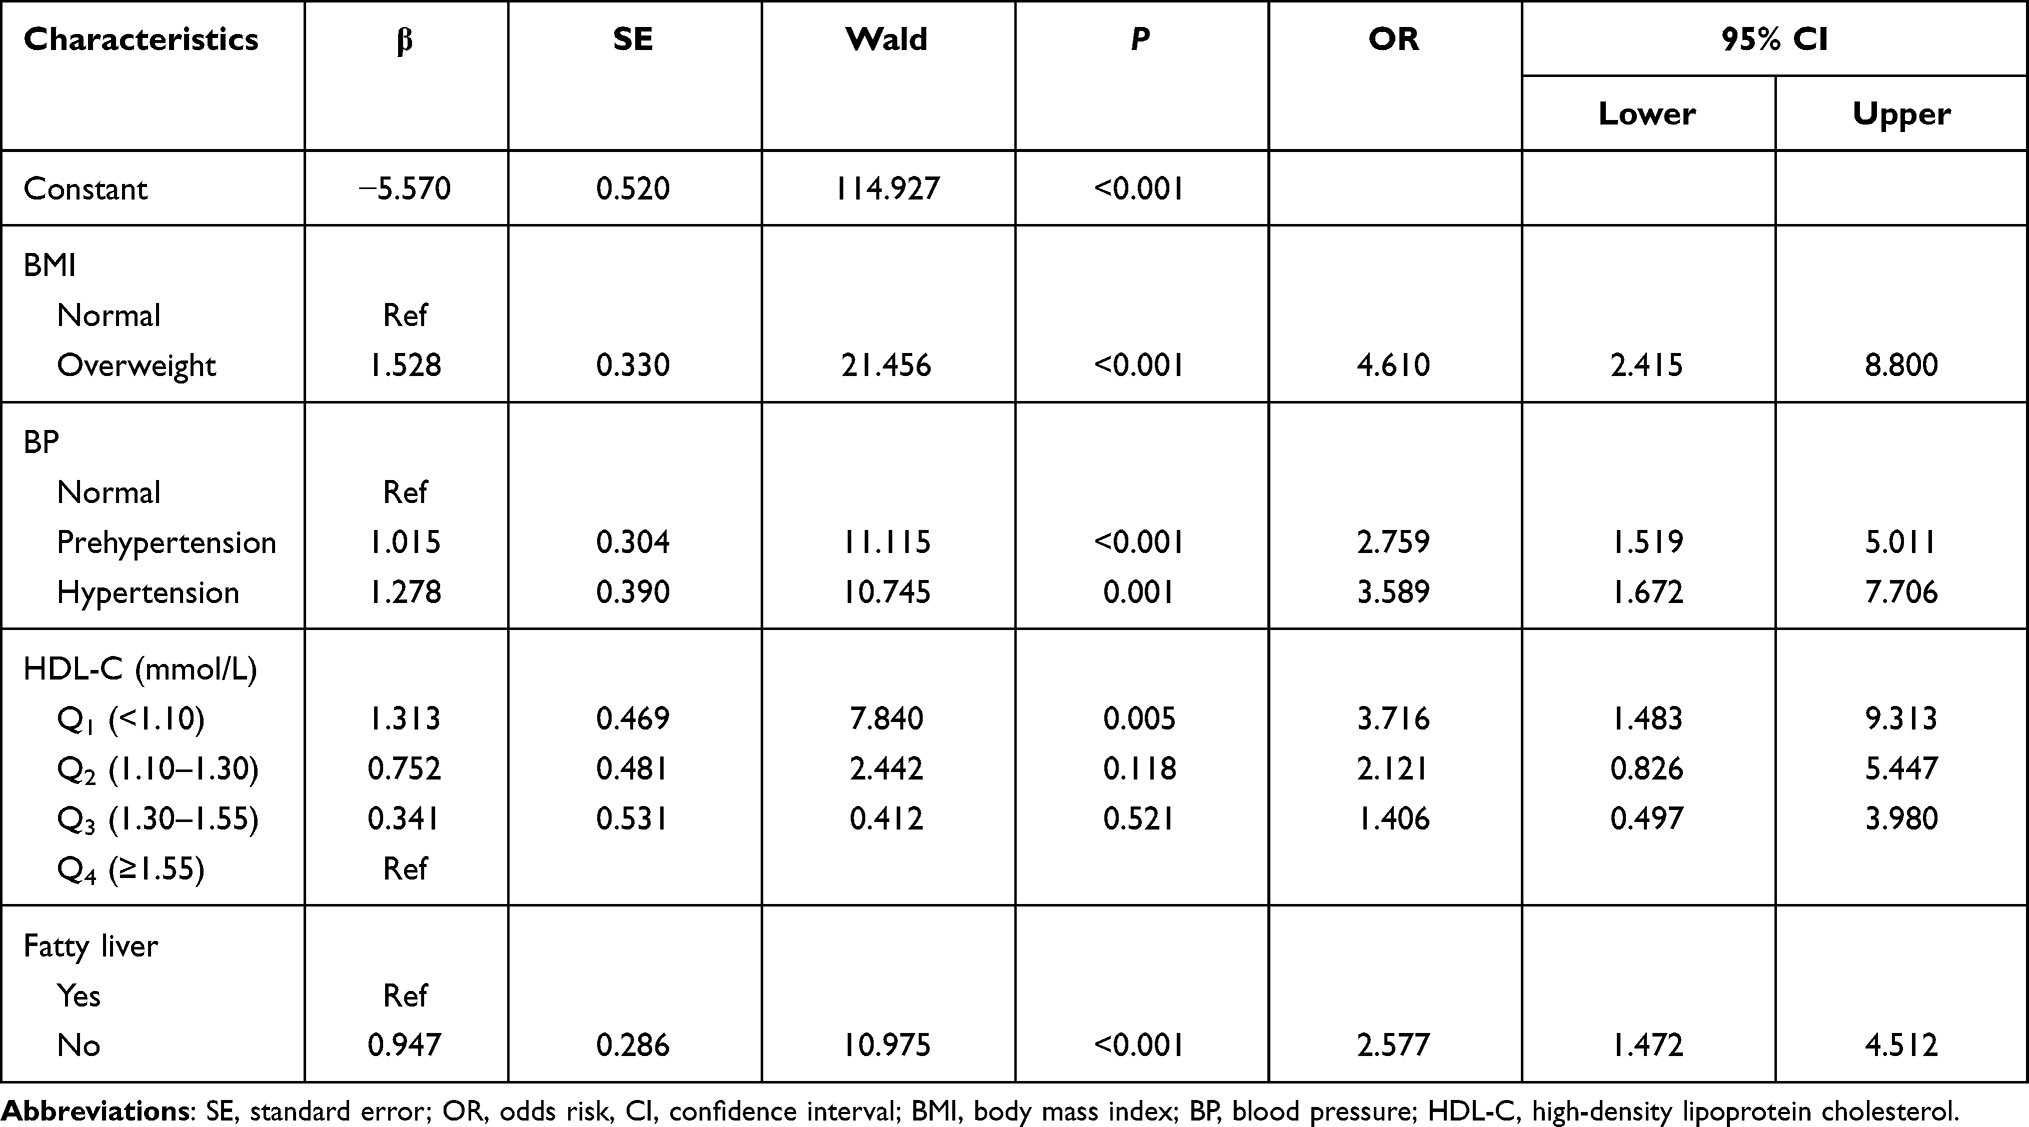 |
Table 4 Multivariate Analysis for the Risk of MetS |
The Predictive Performance of the Individualized Prediction Model
The ROC curves are shown in Figure 2. The AUC of the predictive model was 0.831 (95% CI: 0.798 to 0.865), superior to either BMI (ROC = 0.818, 95% CI: 0.786 to 0.850) or HDL-C (ROC = 0.701, 95% CI: 0.654 to 0.748) alone in predicting MetS. As shown in Table 5, the sensitivity of this model was 0.898 (95% CI: 0.831 to 0.941) with a specificity of 0.676 (95% CI: 0.651 to 0.700).
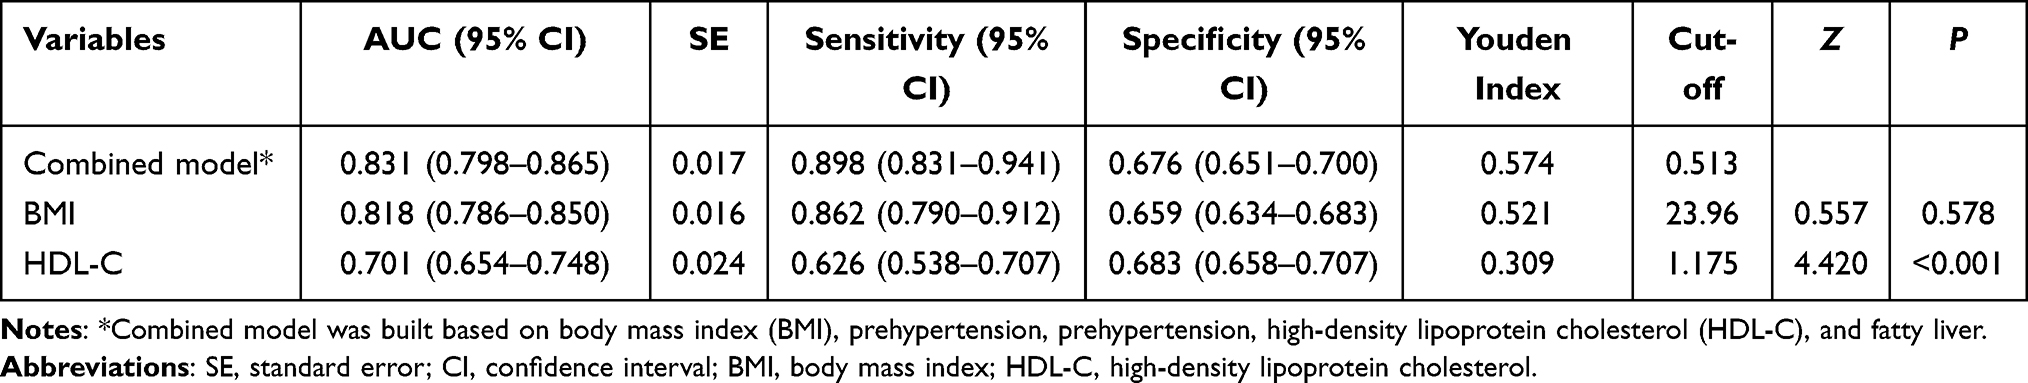 |
Table 5 The Performance of the Prediction Model |
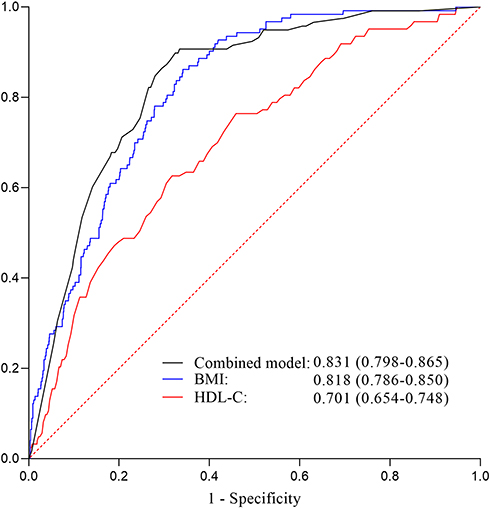 |
Figure 2 The ROC curve of the prediction model. |
Discussion
We developed a novel prediction tool for the risk of MetS using five readily available variables based on an 8-year Chinese cohort. The selected predictive factors included BMI, prehypertension, prehypertension, HDL, and fatty liver. Based on this, a model for calculating the risk of MetS was established: Y = 1.528 × BMI (overweight) +1.015 × BP (prehypertension) + 1.278 × BP (hypertension) + 1.313 × HDL-C (<1.10 mmol/L) + 0.947 × fatty liver - 5.570. The AUC of this multi-factor model was 0.831, with a sensitivity of 0.898 and a specificity of 0.676, which indicated that the risk of MetS would be well predicted.
This study indicated that overweight might be a predictor affecting the risk of MetS. The occurrence of MetS has been proved to be related to excessive visceral adiposity.15 Moreover, visceral adiposity, associated with BMI, has been evaluated as a cardiometabolic risk factor and might be adopted as a treatment target for cardiometabolic disease.16 Additionally, it has been reported that one-third of American adolescents were overweight or obese, which increased the MetS risk.17 The relationship and overweight and MetS could be attributed to the following explanations: 1) obesity could cause insulin resistance by inducing inflammation in various tissues, resulting in a higher risk of MetS;18 2) the destruction caused by obesity will break the integrity of lymphoid tissues with interfering with the distribution of leukocyte subsets and phenotypes,19 which may lead to an increased risk of MetS.20
The present study demonstrated that prehypertension and hypertension might indicate a high risk of MetS because elevated BP is a part of the definition of MetS. A study indicated that with increasing BP, the prevalence of MetS increased, which is consistent with our results.21 It has been demonstrated that poor BP control in hypertension was an independent risk factor for MetS.22 Compared with hypertension patients with better BP management, those with poor control were more likely to develop MetS.23 Although the exact mechanism of MetS caused by abnormal BP was unclear, increased sympathetic activity was believed to be related to the higher risk of MetS following prehypertension or hypertension.24
Low-HDL (<1.10 mmol/L) was observed to be related to the rising risk of MetS in the present research. Low HDL-C level, regarded as a part of atherogenic dyslipidemia, was associated with insulin resistance, visceral obesity, and worsened inflammation, and those findings were associated with MetS.25–27 Currently, the causal relationship between fatty liver and MetS is in conclusion. Fatty liver has been reported as the hepatic manifestation of MetS.28 However, other studies found that fatty liver might be a strong determinant for the high risk of MetS, which suggested that it might have potential clinical significance for diagnosing, preventing, and treating the MetS.29,30 In another meta-analysis, fatty liver has been proved to be strongly associated with the MetS risk based on a 5-year cohort.31 Our results are consisted with the latter that fatty liver could increase the risk of MetS. This is likely due to the following: 1) the existence of fatty liver could impair liver function that is responsible for regulating glucose metabolism32 and 2) advanced glycation end products accumulating in the fatty liver are released into the circulation, activating their receptor in the liver, which results in low-grade inflammation.33
The MetS will increase the risk of suffering T2DM and cardiovascular diseases by 5 and 2 times, respectively, in the following 5 to 10 years,34 demonstrating that accurate MetS prediction model might protect people from these diseases with individualized risk prediction and interventions. In this study, a convincing multi-factor prediction model was established, which may help clinicians identify people at high risk of MetS earlier. Several single indicators have been proposed to predict or diagnose diseases, such as HDL-C or BMI. However, in actual clinical work, the strength of clinical evidence may not be sufficient for clinicians to predict or diagnose diseases with only one predictive indicator. Moreover, early interventions such as lifestyle adjustment, weight loss, and fatty liver control could reduce the risk of MetS.35 Of note, given the association between increased risk of MetS with elevated BP, medications to control BP should consider their antihypertensive effects and their effects on blood glucose and lipid metabolism. Herein, the accurate and personalized quantitative model proposed by this study will help physicians predict the risk of MetS and identify the population that needs close follow-up.
Several limitations cannot be ignored in this research. First, the data we collected was limited to participants only from Hangzhou, which did not represent all Chinese. People without medical examination were omitted. Secondly, factors such as eating habits and others that may affect the development of MetS were not informed. Thirdly, as the 2004 Chinese Diabetes Society criteria were adopted to diagnose MetS, the arrival of further high-quality experimental studies with larger sample sizes has to be awaited to verify whether the results under different criteria are consistent with ours. Fourth, the specificity of the model presented is lower (0.676). However, the sensitivity of the model is relatively high (0.898), with the AUC of 0.831, which indicates that the model could effectively identify patients with higher risk of MetS for individualized intervention timely. Early intervention is essential for the management of chronic diseases. Furthermore, for patients with false positives, whether it is to control obesity, hypertension, or fatty liver, it is beneficial to the health of them. Further studies with rigorous design should be carried out to explore the results.
Conclusion
The model performed well predictive power for the risk of MetS based on an 8-year Chinese cohort, which may provide a reference for clinicians to identify high-risk groups early. The selected predictors were used to construct the MetS prediction model, including BMI, prehypertension, prehypertension, HDL, and fatty liver. The AUC of the multi-factor model was 0.831, with a sensitivity of 0.898 and a specificity of 0.676, which indicated that the risk of MetS would be well predicted by this model. However, further researches are required to verify whether individual interventions based on this new model will prevent the risk of MetS.
Acknowledgments
Huanyu Guo and Wenwei Jiang are co-first authors for this study.
Disclosure
The authors report no conflicts of interest in this work.
References
1. Program CDS-ms. Suggestions for metabolic syndrome by Chinese Diabetes Society. Chin J Diabetes. 2004;12:156–161.
2. Reaven GM. Role of insulin resistance in human disease. Diabetes. 1988;37(12):1595–1607. doi:10.2337/diab.37.12.1595
3. Wang X, Bao W, Liu J, et al. Inflammatory markers and risk of type 2 diabetes: a systematic review and meta-analysis. Diabetes Care. 2013;36(1):166–175. doi:10.2337/dc12-0702
4. Rabin KR, Kamari Y, Avni I, et al. Adiponectin: linking the metabolic syndrome to its cardiovascular consequences. Expert Rev Cardiovasc Ther. 2005;3(3):465–471. doi:10.1586/14779072.3.3.465
5. Deedwania PC, Gupta R, Sharma KK, et al. High prevalence of metabolic syndrome among urban subjects in India: a multisite study. Diabetes Metab Syndr. 2014;8(3):156–161. doi:10.1016/j.dsx.2014.04.033
6. Hajat C, Shather Z. Prevalence of metabolic syndrome and prediction of diabetes using IDF versus ATPIII criteria in a Middle East population. Diabetes Res Clin Pract. 2012;98(3):481–486. doi:10.1016/j.diabres.2012.09.037
7. Yeh WT, Weng LC. Epidemiology of metabolic syndrome in Asia. Asia Pac J Clin Nutr. 2008;17:37–42.
8. Eckel RH, Grundy SM, Zimmet PZ. The metabolic syndrome. Lancet. 2005;365(9468):1415–1428. doi:10.1016/S0140-6736(05)66378-7
9. Jepsen S, Suvan J, Deschner J. The association of periodontal diseases with metabolic syndrome and obesity. Periodontol 2000. 2020;83(1):125–153. doi:10.1111/prd.12326
10. Watanabe J, Kotani K. Metabolic syndrome for cardiovascular disease morbidity and mortality among general Japanese people: a mini review. Vasc Health Risk Manag. 2020;16:149–155. doi:10.2147/VHRM.S245829
11. Cui G, Yue C, Wei R, et al. Patients with metabolic syndrome have a greater rate of complications after arthroplasty: a systematic review and meta-analysis. Bone Joint Res. 2020;9(3):120–129. doi:10.1302/2046-3758.93.BJR-2019-0138.R1
12. Cristine Silva K, Santana Paiva N, Rocha de Faria F, et al. Predictive ability of seven anthropometric indices for cardiovascular risk markers and metabolic syndrome in adolescents. J Adolesc Health. 2020;66(4):491–498. doi:10.1016/j.jadohealth.2019.10.021
13. Chinese Diabetes Society- metabolic syndrome program. Suggestions for metabolic syndrome by Chinese Diabetes Society. Chin J Diabetes. 2004;12:156–161.
14. De Zeng M, Fan JG, Lu LG, et al. Guidelines for the diagnosis and treatment of nonalcoholic fatty liver diseases. J Dig Dis. 2008;9(2):108–112. doi:10.1111/j.1751-2980.2008.00331.x
15. Szymańska E, Bouwman J, Strassburg K, et al. Gender-dependent associations of metabolite profiles and body fat distribution in a healthy population with central obesity: towards metabolomics diagnostics. OMICS. 2012;16(12):652–667. doi:10.1089/omi.2012.0062
16. Shah RV, Murthy VL, Abbasi SA, et al. Visceral adiposity and the risk of metabolic syndrome across body mass index: the MESA Study. JACC Cardiovasc Imaging. 2014;7(12):1221–1235. doi:10.1016/j.jcmg.2014.07.017
17. Jastreboff AM, Sinha R, Arora J, et al. Altered brain response to drinking glucose and fructose in obese adolescents. Diabetes. 2016;65(7):1929–1939. doi:10.2337/db15-1216
18. Saltiel AR, Olefsky JM. Inflammatory mechanisms linking obesity and metabolic disease. J Clin Invest. 2017;127(1):1–4. doi:10.1172/JCI92035
19. Kanneganti T-D, Dixit VD. Immunological complications of obesity. Nat Immunol. 2012;13(8):707–712. doi:10.1038/ni.2343
20. Andersen CJ, Murphy KE, Fernandez ML. Impact of obesity and metabolic syndrome on immunity. Adv Nutr. 2016;7(1):66–75. doi:10.3945/an.115.010207
21. Pannier B, Thomas F, Bean K, et al. The metabolic syndrome: similar deleterious impact on all-cause mortality in hypertensive and normotensive subjects. J Hypertens. 2008;26(6):1223–1228. doi:10.1097/HJH.0b013e3282fd9936
22. Arcucci O, de Simone G, Izzo R, et al. Association of suboptimal blood pressure control with body size and metabolic abnormalities. J Hypertens. 2007;25(11):2296–2300. doi:10.1097/HJH.0b013e3282e9a9e4
23. Kjeldsen SE, Naditch-Brule L, Perlini S, et al. Increased prevalence of metabolic syndrome in uncontrolled hypertension across Europe: the global cardiometabolic risk profile in patients with hypertension disease survey. J Hypertens. 2008;26(10):2064–2070. doi:10.1097/HJH.0b013e32830c45c3
24. Linz D, Hohl M, Elliott AD, et al. Modulation of renal sympathetic innervation: recent insights beyond blood pressure control. Clin Auton Res. 2018;28(4):375–384. doi:10.1007/s10286-018-0508-0
25. Kaur J. A comprehensive review on metabolic syndrome. Cardiol Res Pract. 2014;2014:1–21. doi:10.1155/2014/943162
26. Lakka H-M, Laaksonen DE, Lakka TA, et al. The metabolic syndrome and total and cardiovascular disease mortality in middle-aged men. JAMA. 2002;288(21):2709–2716. doi:10.1001/jama.288.21.2709
27. Isomaa B, Almgren P, Tuomi T, et al. Cardiovascular morbidity and mortality associated with the metabolic syndrome. Diabetes Care. 2001;24(4):683–689. doi:10.2337/diacare.24.4.683
28. Byrne CD, Targher G. NAFLD: a multisystem disease. J Hepatol. 2015;62(1):S47–S64. doi:10.1016/j.jhep.2014.12.012
29. Yang S, Kwak S, Lee JH, et al. Nonalcoholic fatty liver disease is an early predictor of metabolic diseases in a metabolically healthy population. PLoS One. 2019;14(11):e0224626. doi:10.1371/journal.pone.0224626
30. Lonardo A, Ballestri S, Marchesini G, et al. Nonalcoholic fatty liver disease: a precursor of the metabolic syndrome. Dig Liver Dis. 2015;47(3):181–190. doi:10.1016/j.dld.2014.09.020
31. Ballestri S, Zona S, Targher G, et al. Nonalcoholic fatty liver disease is associated with an almost twofold increased risk of incident type 2 diabetes and metabolic syndrome. Evidence from a systematic review and meta‐analysis. J Gastroenterol Hepatol. 2016;31(5):936–944. doi:10.1111/jgh.13264
32. Choi S-I, Lee H-A, Han J-S. Gynura procumbens extract improves insulin sensitivity and suppresses hepatic gluconeogenesis in C57BL/KsJ-db/db mice. Nutr Res Pract. 2016;10(5):507–515. doi:10.4162/nrp.2016.10.5.507
33. Bijnen M, van Greevenbroek MM, van Der Kallen CJ, et al. Hepatic fat content and liver enzymes are associated with circulating free and protein-bound advanced glycation end products, which are associated with low-grade inflammation: the CODAM study. J Diabetes Res. 2019;2019:1–10. doi:10.1155/2019/6289831
34. Alberti K, Eckel RH, Grundy SM, et al. Harmonizing the metabolic syndrome: a joint interim statement of the international diabetes federation task force on epidemiology and prevention; national heart, lung, and blood institute; American heart association; world heart federation; international atherosclerosis society; and international association for the study of obesity. Circulation. 2009;120:1640–1645.
35. Cornier M-A, Dabelea D, Hernandez TL, et al. The metabolic syndrome. Endocr Rev. 2008;29:777–822.
 © 2021 The Author(s). This work is published and licensed by Dove Medical Press Limited. The full terms of this license are available at https://www.dovepress.com/terms.php and incorporate the Creative Commons Attribution - Non Commercial (unported, v3.0) License.
By accessing the work you hereby accept the Terms. Non-commercial uses of the work are permitted without any further permission from Dove Medical Press Limited, provided the work is properly attributed. For permission for commercial use of this work, please see paragraphs 4.2 and 5 of our Terms.
© 2021 The Author(s). This work is published and licensed by Dove Medical Press Limited. The full terms of this license are available at https://www.dovepress.com/terms.php and incorporate the Creative Commons Attribution - Non Commercial (unported, v3.0) License.
By accessing the work you hereby accept the Terms. Non-commercial uses of the work are permitted without any further permission from Dove Medical Press Limited, provided the work is properly attributed. For permission for commercial use of this work, please see paragraphs 4.2 and 5 of our Terms.