")
Back to Journals » Journal of Inflammation Research » Volume 15
A Prediction Model Based on Blood Biomarker for Mortality Risk in Patients with Acute Venous Thromboembolism
Authors Jiang J , Xue J, Liu Y
Received 29 June 2022
Accepted for publication 10 August 2022
Published 18 August 2022 Volume 2022:15 Pages 4725—4735
DOI https://doi.org/10.2147/JIR.S379360
Checked for plagiarism Yes
Review by Single anonymous peer review
Peer reviewer comments 2
Editor who approved publication: Dr Adam D Bachstetter
Jianjun Jiang,1,* Junshuai Xue,2,* Yang Liu1
1Department of General Surgery, Vascular Surgery, Qilu Hospital of Shandong University, Jinan, Shandong, 250012, People’s Republic of China; 2Department of General Surgery, Qilu Hospital of Shandong University, Jinan, Shandong, 250012, People’s Republic of China
*These authors contributed equally to this work
Correspondence: Yang Liu, Tel +86 18560088317, Email E-mail:[email protected]
Background: Most studies to date have focused on predicting the risk of venous thromboembolism (VTE), but prediction models about mortality risk in VTE are rarely reported. We sought to develop and validate a multivariable model to predict the all-cause mortality risk in patients with acute VTE in emergency settings.
Methods: A total of 700 patients were included from Qilu Hospital of Shandong University and were randomly assigned into training set (n=490) and validation set (n=210) in an 7:3 ratio. Multivariate logistics regression analysis was performed to identify independent variables and develop a prediction model, which was validated internally using bootstrap method. The discrimination, calibration and clinical utility were evaluated by receiver operating characteristic curve (ROC) analysis, Hosmer-Lemeshow (HL) test, Kaplan-meier (KM) analysis and decision curve analysis (DCA).
Results: There were 52 patients (10.6%) dying and 437 (89.4%) surviving in training set. Age (odds ratio [OR]: 4.158, 95% confidence interval [CI]: 2.426– 7.127), pulmonary embolism (OR: 1.779, 95% CI: 1.124– 2.814), platelet count (OR: 0.507, 95% CI: 0.310– 0.830), D-dimer (OR: 1.826, 95% CI: 1.133– 2.942) and platelet/lymphocyte ratio (OR: 2.166, 95% CI: 1.259– 3.727) were independent risk variables associated with all-cause mortality. The model had good predictive capability with an AUC of 0.746 (95% CI: 0.668,0.825), a sensitivity of 0.769 (95% CI: 0.607,0.889), a specificity of 0.672 (95% CI: 0.634,0.707). The validation model had an AUC of 0.739 (95% CI: 0.685,0.793), a sensitivity of 0.690 (95% CI: 0.580,0.787), a specificity of 0.693 (95% CI: 0.655,0.729). The model is well calibrated and the HL test showed a good fit (χ2=5.291, p=0.726, Nagelkerke R2=0.137). KM analysis and DCA showed a good clinical utility of the nomogram.
Conclusion: This study identified independent variables affecting all-cause mortality in patients with acute VTE, and developed a prediction model and provided a nomogram with good prediction capability and clinical utility.
Keywords: venous thromboembolism, prediction model, mortality, risk variable, platelet/lymphocyte ratio
Introduction
Venous thromboembolism (VTE), which includes lower extremity deep vein thrombosis (DVT) and pulmonary embolism (PE), is the third-leading cause of accidental in-hospital death.1,2 VTE can also cause post-thrombotic syndrome (PTS), which can lead to varicose veins in the lower limbs, limb edema and chronic skin ulcers.3,4 A number of risk variables associated with the onset of VTE have been identified;1,5 nevertheless, it is impossible to evaluate the prognosis of VTE based on these risk variables alone. The application of physical examination, hematological tests and imaging examination is still recommended. Furthermore, the assessment of death and PTS risk when managing patients with acute/subacute VTE in the emergency setting is a real and critical issue in clinical practice. Most studies to date have focused on predicting the risk of VTE in specific populations.6–14 However, studies of risk variables associated with all-cause mortality and PTS in VTE patients are relatively uncommon,11,15–18 and multivariable clinical prediction models in emergency setting are also rarely reported.
The D-dimer is one of the most commonly used blood markers for the diagnosis of VTE, and has high sensitivity and low specificity.19 There is growing evidence that the immune/inflammatory response plays an important role in the development of vascular disease.20–23 Representative indicators include the neutrophil/lymphocyte ratio (NLR) and the platelet/lymphocyte ratio (PLR), which have been shown to predict the onset of VTE and to be strongly associated with mortality.24–28 The systemic immune/inflammation index (SII) has been found to be associated with survival in patients with cancer.29,30 However, two recent studies have identified SII as an independent risk variable for predicting acute PE and acute VTE.31,32 We sought to investigate the association between these indicators and prognosis and PTS, and included them in the predictive model to improve their clinical utility.
In this study, we retrospectively analyzed clinical data of VTE patients with an interval time from onset to admission to our hospital of less than 30 days in the last 10 years. All-cause mortality events during the follow-up period were recorded, and PTS was evaluated using the Villalta score. The independent risk variables were identified, and a multivariable prediction model was derived and validated internally using the bootstrap method. A nomogram was also produced to provide a potential guide for clinical practice. The discrimination, calibration and clinical utility were evaluated in training set and validation set.
Patients and Methods
Study Population
This was a single-center retrospective study, and all medical records were obtained from the electronic medical record system of Qilu Hospital of Shandong University. Patients enrolled in the study were those admitted to our hospital between January 1, 2011, and December 31, 2020. The study was conducted in accordance with the Declaration of Helsinki (as revised in 2013) and was approved by the Ethics Committee of Qilu Hospital of Shandong University. The need for written informed consent was waived because this was a retrospective study based on previous medical record data and did not involve human specimens. The personal identifiers of all patients were removed. All the data were anonymized and maintained with confidentiality. The inclusion criteria were as follows: (1) definite diagnosis of lower extremity DVT on ultrasound and PE on pulmonary computed tomography angiogram; (2) interval time from onset to admission less than 30 days; (3) first onset of VTE; and (4) laboratory testing of blood samples within 24 hours of admission. Exclusion criteria were: (1) interval time from onset to admission exceeding 30 days; (2) patients with recurrent VTE; (3) in-hospital onset of VTE; and (4) patients with malignancy.
We collected the clinical data of all enrolled patients, including age, sex, smoking history, alcohol history, surgery history within 3 months, interval time from onset to admission, days of in-hospital stay, follow-up duration, blood test results, thrombus location, and comorbidities of hypertension, diabetes, coronary artery disease, neurological disease, fracture, immune rheumatic disease, and lower limb vascular disease. Blood biomarkers were obtained within 24 hours of admission, including white blood cell count, neutrophil count, lymphocyte count, platelet count, D-dimer, NLR, PLR, and SII. NLR was defined as neutrophil count (109/L)/lymphocyte count (109/L). PLR was defined as platelet count (109/L)/lymphocyte count (109/L). SII was defined as platelet count (109/L) × neutrophil count (109/L)/lymphocyte count (109/L).
The follow-up period ended on 31 December 2021, and we obtained follow-up results by telephone or via outpatient interviews. All-cause mortality was recorded by telephone follow-up. If the patient was alive, an outpatient interview was assigned to evaluate the PTS. PTS scores for deceased patients were filled by the random forest method. PTS was evaluated by using the Villalta score, where a score of 0–4 is defined as no PTS, ≥5 as PTS, 5–9 as mild PTS, 10–14 as moderate PTS, and ≥15 or combined with ulceration as severe PTS.33 The calculation of the Villalta score was carried out by two vascular surgeons. If there was disagreement, a third vascular surgeon made the final judgement.
Statistical Analysis
Statistical analysis was performed using R version 4.0.3. Continuous variables were expressed as medians (25th, 75th percentiles) and analyzed using an independent Student’s t-test or Mann–Whitney test, as appropriate. Categorical variables were expressed as number of cases and percentages (%), which were analyzed with the χ2 test or Fisher’s exact test. Blood biomarkers, such as white blood cell count, neutrophil count, lymphocyte count, platelet count, D-dimer, NLR, PLR and SII, were transformed into dichotomous variables for further analysis, based on the median value.
Univariate logistics regression analysis was performed to identify variables associated with mortality, and variables with a p-value<0.1 were analyzed by multivariate analysis. A stepwise method was used to identify independent risk variables, with the intensity of association indicated by odds ratio (OR). The 95% confidence interval (CI) was also listed. The final prediction model retained risk variables with p<0.05. During the development of model, internal validation and optimization was conducted using a bootstrap method (1000 times). A weighted score from 0 to 100 was assigned to each variable included in the final model based on the regression coefficients from the multivariate analysis. A nomogram was then produced to provide guidance for clinical practice.
ROC analysis was used to assess the discrimination of the prediction model in training set and validation set, deriving area under the curve (AUC), sensitivity, specificity. Actual and predicted incidence rates were compared using calibration plots, and calibration of the model was reflected by a fit of the calibration curve to the diagonal slope. The logistic model was also evaluated by Hosmer-Lemeshow test (HL test) to identify the match between the expected mortality events based on the model and the observed mortality events.
The total point of the nomogram for probability of mortality for each patient was calculated. Kaplan-meier analysis (Log rank test) of the survival probability based on the median value of total points was conducted. The clinical value of the model was assessed by decision curve analysis (DCA) with the threshold probability as the horizontal coordinate and the net benefit (NB) as the vertical coordinate. The blue horizontal line indicates that all patients are dead and the NB is zero, while the green diagonal line indicates that all patients survive and the inverse slope of the NB is negative; the red solid line represents the prediction model.
This study was conducted and reported in line with the Transparent Reporting of a multivariate prediction model for Individual Prediction or Diagnosis (TRIPOD) guidelines.34 And a TRIPOD checklist was also provided.
Results
There were 700 VTE patients between January 1, 2010 and December 31, 2020 enrolled in the study based on inclusion and exclusion criteria, with 313 males and 387 females at a median age of 60 years (49, 68). A total of 364 patients (52.00%) were diagnosed with DVT, while 336 (48.00%) with DVT and PE. For all 700 patients, anticoagulation was continued for at least 3 months, with 314 patients (44.85%) on rivaroxaban and 386 patients (55.15%) on warfarin. Rivaroxaban was administered at a dose of 15 mg bid for 3 weeks, followed by 20 mg qd for at least 3 months. Warfarin was administered dynamically according to the prothrombin time-international normalized ratio (PT-INR), which was required to be maintained between 2.0 to 3.0. All patients were advised to use compression stockings for at least 6 months. The mean follow-up period was 53 months (32, 81), with 84 patients (12%) dying and 616 (88%) surviving. The shortest follow-up period was 12 months and the longest follow-up period was 124 months. According to Villalta score, 416 patients (59.5%) scored 0, while 246 (35.1%) scored 1–4, 24 (3.4%) had mild PTS (scoring 5–9), 6 (0.9%) had moderate PTS (scoring 10–14) and 8 (1.1%) had severe PTS (>15). Detailed clinical baseline characteristics are presented in Table 1.
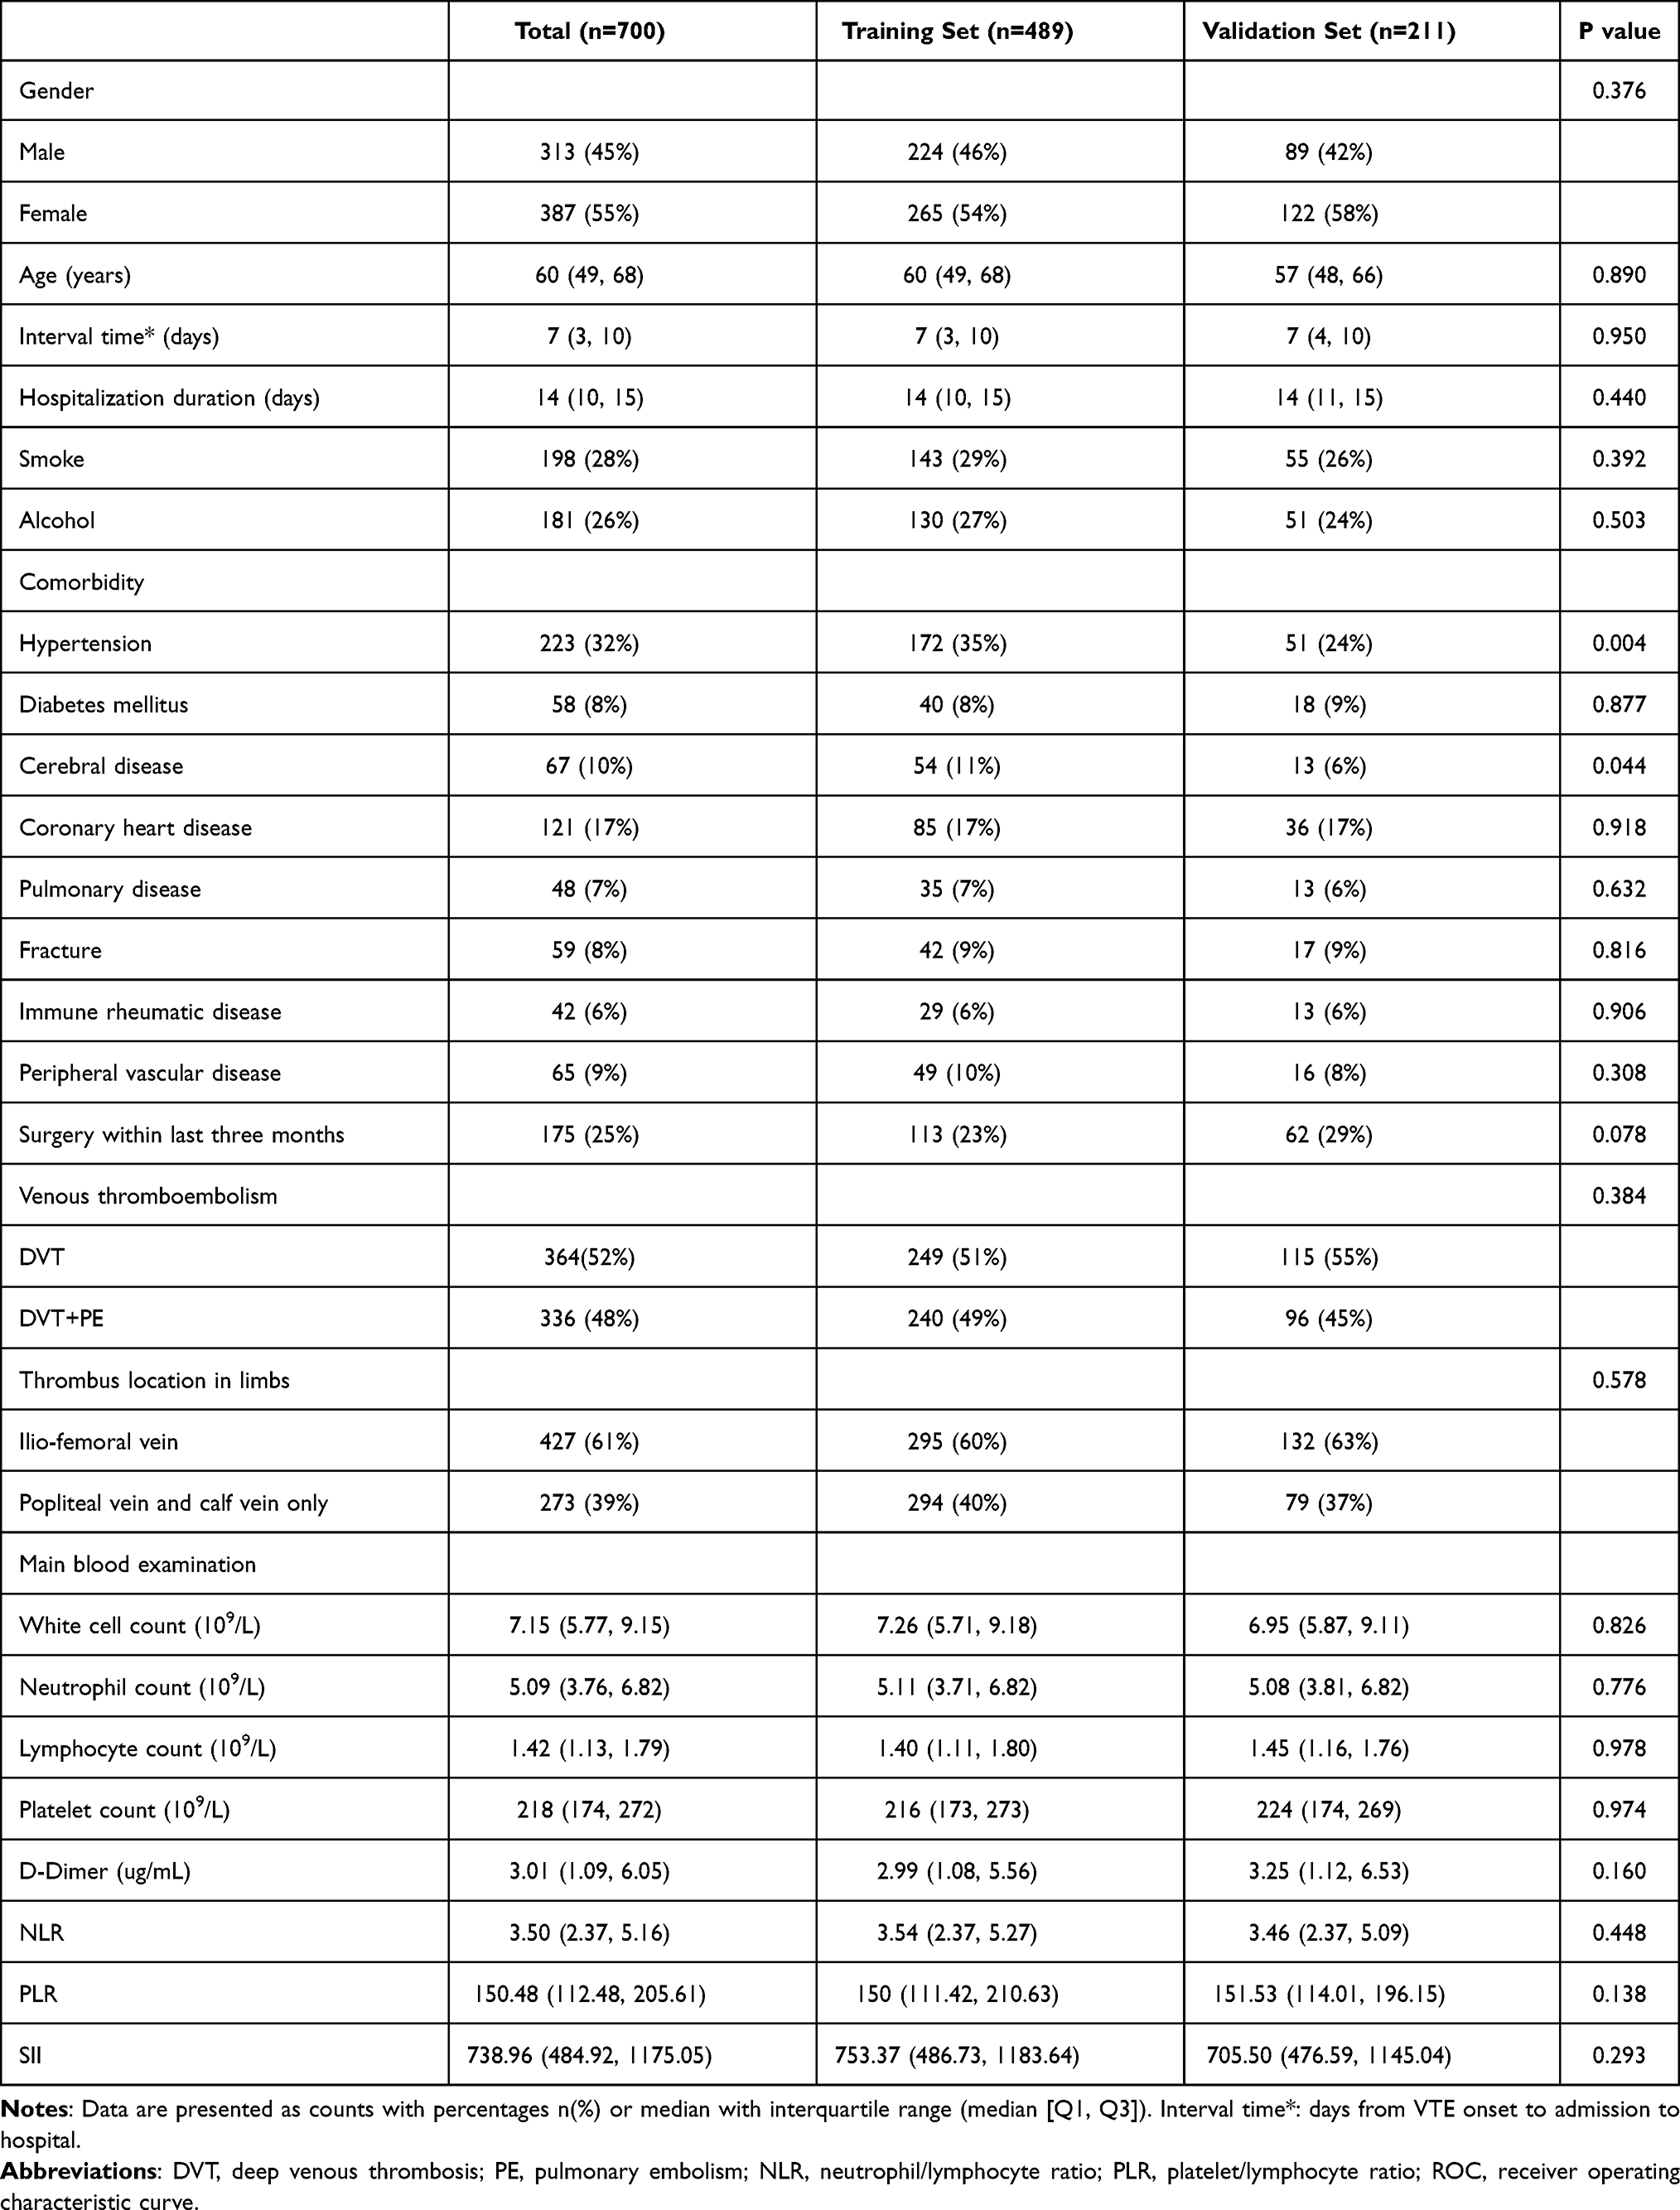 |
Table 1 Clinical Baseline Characteristics in Training Set and Validation Set |
All patients were randomly assigned into training set (n=490) and validation set (n=210) in an 7:3 ratio. There were 52 patients (10.6%) dying and 437 (89.4%) surviving in training set, and detailed clinical baseline characteristics are presented in Table 2. Age, PE, platelet count, D-dimer and PLR were identified as independent risk variables associated with all-cause mortality, shown on a forest plot (Figure 1A). These variables were used to develop a multivariable prediction model and a nomogram was produced. (Figure 1B) ROC analysis showed that the model had good predictive capability with an AUC of 0.746 (95% CI:0.668,0.825), a sensitivity of 0.769 (95% CI:0.607,0.889), a specificity of 0.672 (95% CI:0.634,0.707). (Figure 2A) The model in validation set had an AUC of 0.739 (95% CI:0.685,0.793), a sensitivity of 0.690 (95% CI:0.580,0.787), a specificity of 0.693 (95% CI:0.655,0.729). (Figure 2B) The calibration plots showed that the predicted and actual survival curves were close, with no significant differences (Figure 2C and D), indicating a good overall consistency of the model. HL test showed a good fit (χ2=5.291, p=0.726, Nagelkerke R2=0.137).
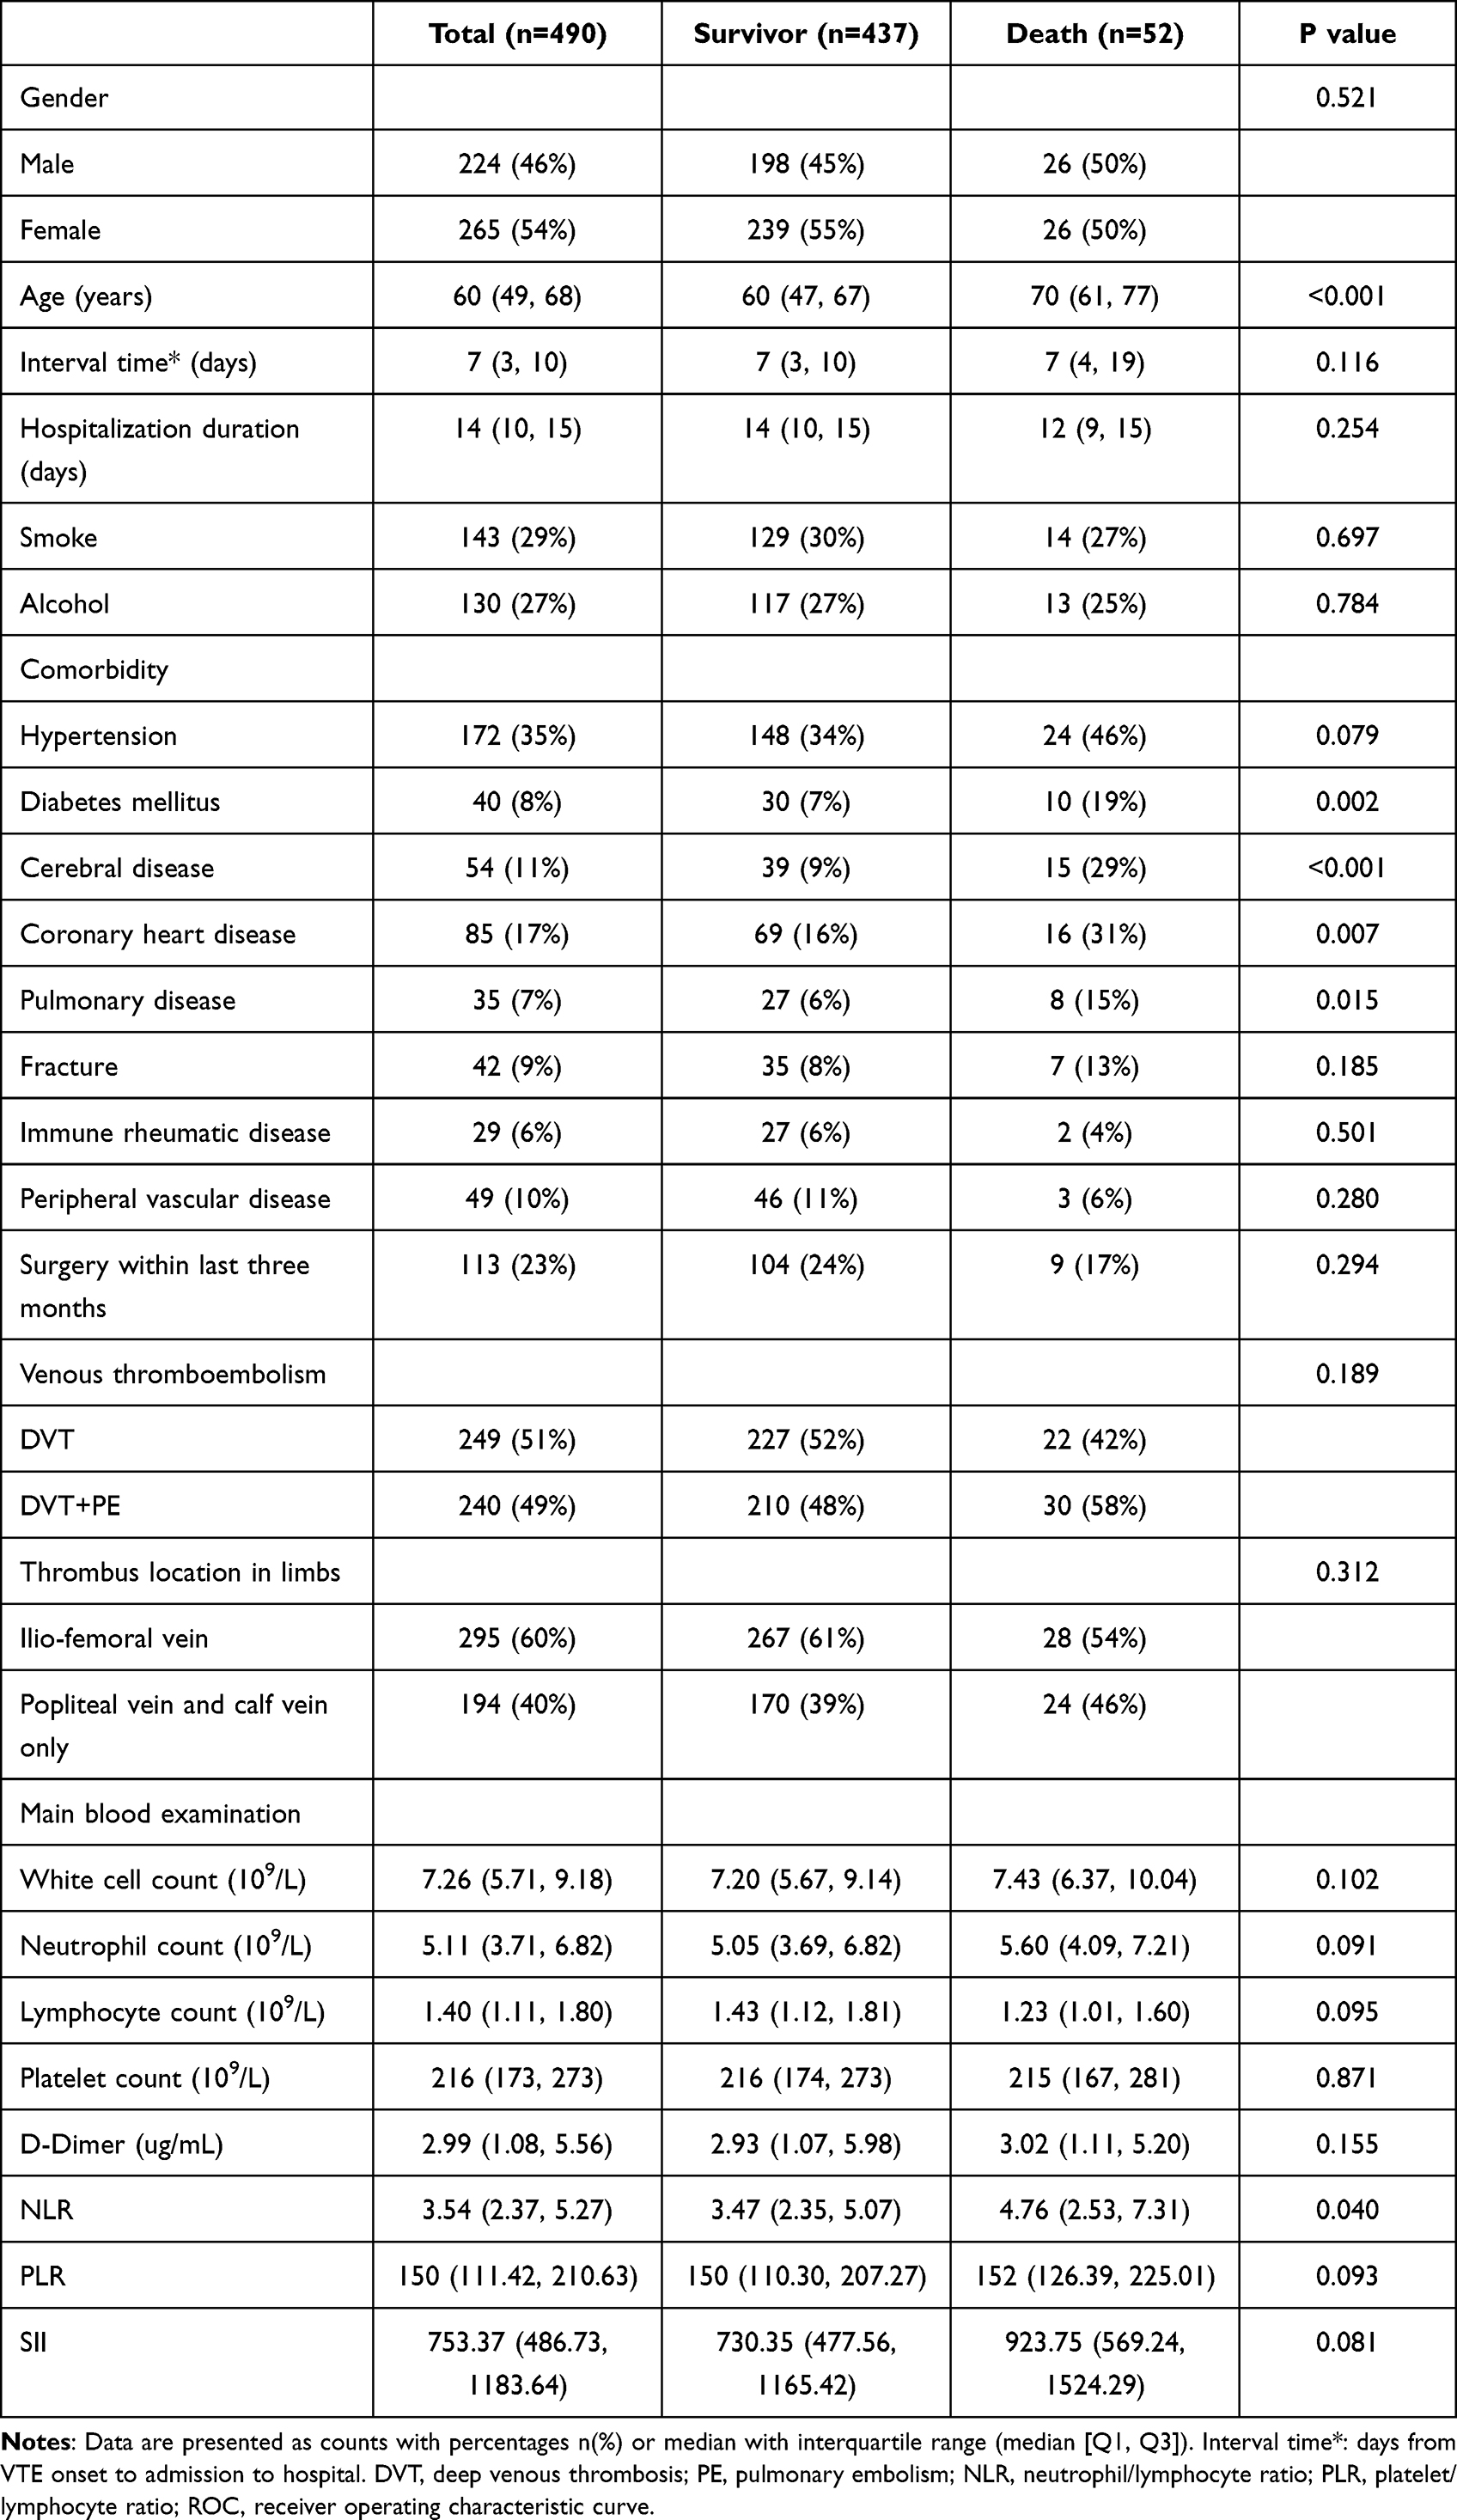 |
Table 2 Clinical Baseline Characteristics and Univariate Analyses Between Survivor and Death in Training Set |
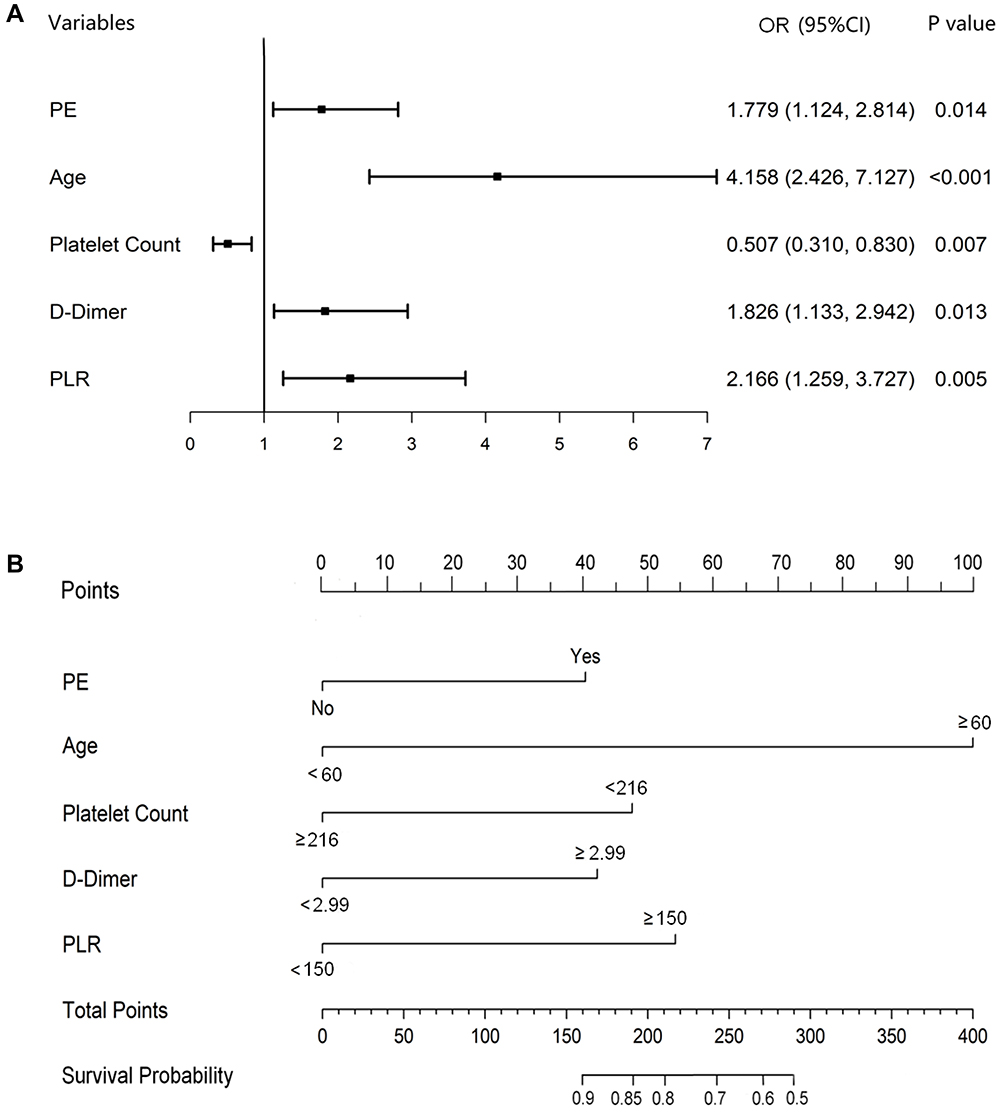 |
Figure 1 (A) A forest plot of independent risk variables with OR for all-cause mortality in patients with acute VTE. (B) The nomogram of the prediction model for mortality risk. Abbreviations: PE, pulmonary embolism; PLR, platelet/lymphocyte ratio. |
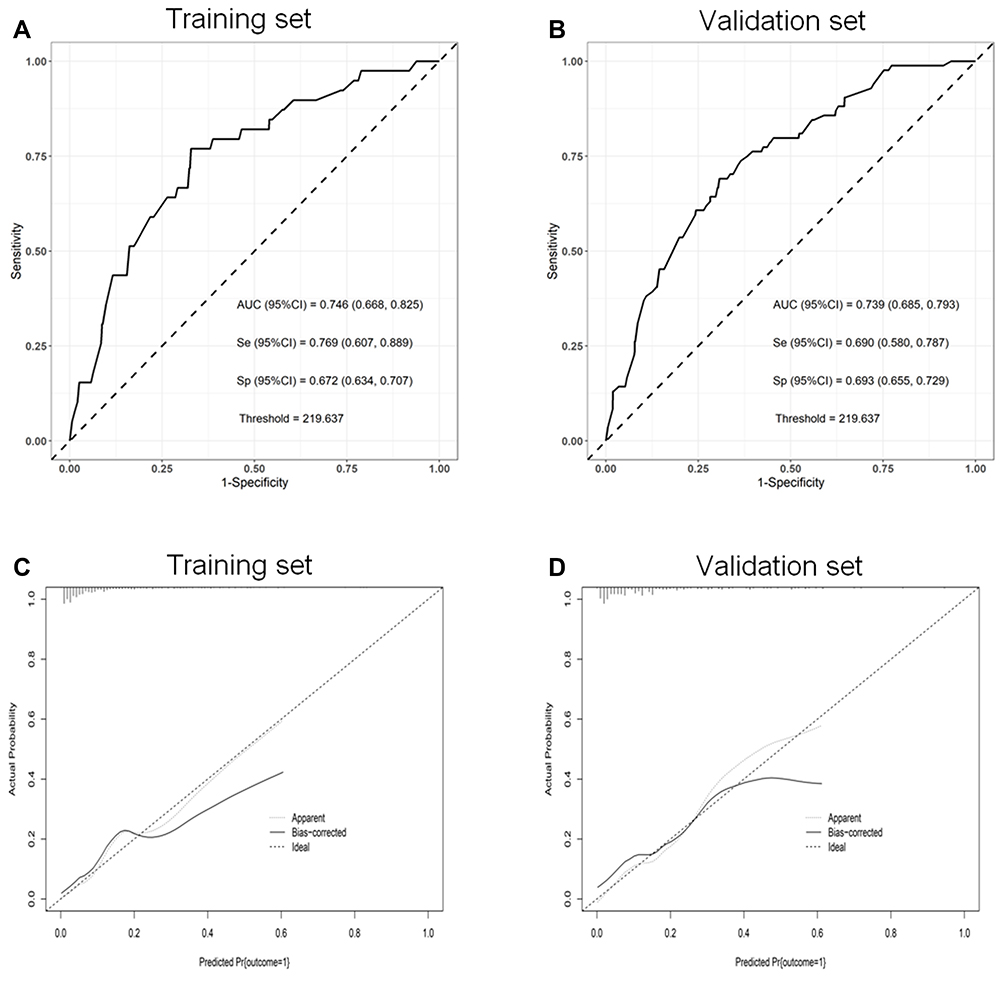 |
Figure 2 (A) The ROC curve of the prediction model in training set. (B) The ROC curve of the prediction model in validation set. (C) The calibration plot in training set. (D) The calibration plot in validation set. |
The total point for probability of survival in each patient was calculated, the median value of which was 200. Patients with scores ≥200 were assigned to the high-risk group, and those with scores <200 were assigned to the low-risk group. Kaplan-meier analysis showed that the survival probability of high-risk and low-risk groups was significantly different in both the training set and validation set, indicating that the prediction model was clinically useful.(Figure 3A and B) The DCA showed that the model curve is above the horizontal and dashed lines, indicating that the model provides sound clinical guidance.(Figure 3C and D) The DCA showed a better net benefit of our model for prediction of mortality risk within threshold probability ranged from 0% to 19% in training set, and 0% to 13% in validation set.
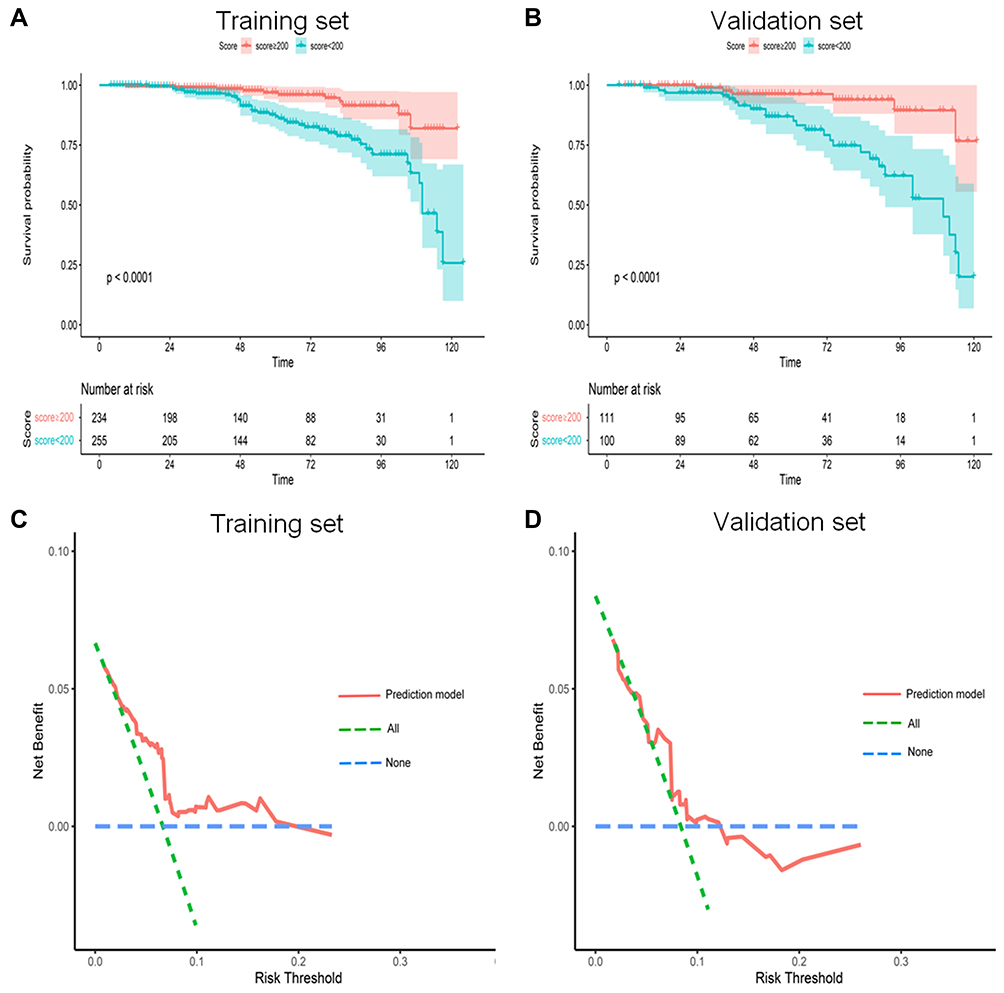 |
Figure 3 Kaplan-meier analysis of survival probability based on the median value of the total point in the nomogram showed a significant difference between the ≥200 and <200 groups (Log rank p<0.001) in training set (A) and validation set (B). The DCA showed a better net benefit of the prediction model for mortality risk within threshold probability ranged from 0% to 19% in training set (C), and 0% to 13% in validation set (D). |
Discussion
Most previous studies in this area have focused on the prediction of VTE risk in specific populations.7–11,35 For example, McCurdy et al identified the incidence and risk variables for VTE in 2161 patients with inflammatory bowel disease (IBD) after discharge and developed a prediction model to assess VTE risk.35 The final model included age >45 years, multiple admissions, intensive care unit admissions, length of admissions >7 days and central venous catheters. The model was able to differentiate between discharges associated with and without VTE (optimism corrected statistic, 0.70; 95% CI: 0.58–0.77). The nomogram in this report also provides a useful and easy calculation of VTE risk after discharge in patients with IBD. However, emergency physicians are interested in assessing the death risk of patients with acute VTE in the emergency setting.
Only a few studies on prediction models of prognosis in VTE patients are available. For example, Huang et al identified serum albumin, tumor stage and history of surgery within 30 days as independent risk variables for 6-month survival in patients with malignancy combined with VTE who underwent inferior vena cava filter placement.11 The prediction model had an AUC of 0.815. However, the authors did not provide further parameters or calibration plots for this model, and neither internal nor external validation was conducted. A nomogram was also not available. As there is little relevant literature focusing on this topic, we developed a predictive model based on the baseline characteristics of VTE patients who required an emergency hospital admission. In comparison, our prediction model for VTE prognosis has an AUC of 0.746 with specific parameters indicating a good predictive capability. The model has also been calibrated and internally validated, and a nomogram is also available.
There are several notable differences in this study compared to previous studies on VTE prediction models. Firstly, we enrolled patients with VTE less than 30 days from onset to hospital admission, which means that patients were in the acute or subacute phase. The result therefore provides important clinical guidance for the management of patients with acute VTE. Secondly, the prediction model includes all-cause VTE, rather than VTE in a specific population, which has excellent broad applicability for clinical practice. Third, our prediction model was able to evaluate all-cause mortality in patients with VTE at the time of admission. Fourth, the immune/inflammation indicators used in the model have been widely verified to be associated with the occurrence and prognosis of VTE. However, these indicators have rarely been included in the development and validation of prediction models. In the present study, we included these indicators in the prediction model in addition to the common clinical variables. The above guarantees both the innovation of this study and the clinical utility of the prediction models.
New immune/inflammatory indicators including NLR, PLR, and SII have been reported in several studies to be closely related to the diagnosis and prognosis of vascular diseases such as VTE and ASO.36,37 In this study, we identified D-dimer, PLR, advanced age and pulmonary embolism as independent risk variables for mortality, while platelet count was protective variables. These variables are readily available in clinical practice, and therefore a nomogram consisting of these variables is clinically convenient and practical. The total points calculated from the nomogram can predict the mortality probability of VTE patients, and can therefore be applied to stratify the risk of VTE with different clinical intervention strategies. For a patient with acute VTE admitted to the emergency clinic, the emergency physician can assess the risk of death using the prediction nomogram. If the patient is identified as being at high risk of death, additional brain/cardiac/peripheral vascular examinations and screening for occult disease, as well as primary and secondary prevention, can be performed in addition to treatment for VTE.
There are also some limitations to this study. Firstly, the patient screening criterion have excluded patients with malignancy and these patients may have had a different prognosis than the present cohort. Secondly, the prediction model cannot provide guidance for patients with VTE in the chronic stage (>30 days). Thirdly, external validation and calibration using an independent cohort dataset is required for this model before it can be implemented into clinical practice.
Conclusion
This study identified independent risk variables for all-cause mortality risk in patients with acute VTE, and developed a clinical prediction model and provided a nomogram with good prediction capability and clinical utility, which may facilitate risk stratification and individualized treatment strategies. Prospective cohort studies are still required to validate and calibrate this model before clinical application.
Abbreviations
AUC, area under the curve; CI, confidence interval; DCA, decision curve analysis; DVT, deep venous thrombosis; OR, odds ratio; NB, net benefit; NLR, neutrophil/lymphocyte ratio; OR, odds ratio; PE, pulmonary embolism; PLR, platelet/lymphocyte ratio; PTS, posthrombotic syndrome; ROC, receiver operating characteristic curve; SE, standard errors; SII, systemic immune/inflammatory index; VTE, venous thromboembolism.
Data Sharing Statement
The datasets used and/or analyzed during the current study are available from the corresponding author on reasonable request.
Ethics Approval and Consent to Participate
The study was conducted in accordance with the Declaration of Helsinki (as revised in 2013). And it was approved by the Ethics Committee of Qilu Hospital of Shandong University and individual consent for this retrospective analysis was waived.
Acknowledgments
We thank John Daniel from Liwen Bianji (Edanz) (www.liwenbianji.cn/) for editing the English text of a draft of this manuscript.
Author Contributions
All authors made a significant contribution to the work reported, whether that is in the conception, study design, execution, acquisition of data, analysis and interpretation, or in all these areas; took part in drafting, revising or critically reviewing the article; gave final approval of the version to be published; have agreed on the journal to which the article has been submitted; and agree to be accountable for all aspects of the work. Jianjun Jiangand Junshuai Xue contribute equally to this work and share first authorship.
Funding
This report is supported by National Natural Science Foundation of China (Grant No.82000451).
Disclosure
The authors declare that they have no competing interests.
References
1. Wendelboe AM, Raskob GE. Global Burden of Thrombosis: epidemiologic Aspects. Circ Res. 2016;118(9):1340–1347.
2. Zhai Z, Kan Q, Li W, et al. VTE Risk Profiles and Prophylaxis in Medical and Surgical Inpatients: the Identification of Chinese Hospitalized Patients’ Risk Profile for Venous Thromboembolism (DissolVE-2)-A Cross-sectional Study. Chest. 2019;155(1):114–122.
3. Kahn SR, Shrier I, Julian JA, et al. Determinants and time course of the postthrombotic syndrome after acute deep venous thrombosis. Ann Intern Med. 2008;149(10):698–707.
4. Ende-Verhaar YM, Tick LW, Klok FA, et al. Post-thrombotic syndrome: short and long-term incidence and risk variables. Thromb Res. 2019;177:102–109.
5. Bartlett MA, Mauck KF, Stephenson CR, Ganesh R, Daniels PR. Perioperative Venous Thromboembolism Prophylaxis. Mayo Clin Proc. 2020;95(12):2775–2798.
6. Barbar S, Noventa F, Rossetto V, et al. A risk assessment model for the identification of hospitalized medical patients at risk for venous thromboembolism: the Padua Prediction Score. J Thromb Haemost. 2010;8(11):2450–2457.
7. Dentali F, Fontanella A, Cohen AT, et al. Derivation and Validation of a Prediction Model for Venous Thromboembolism in Primary Care. Thromb Haemost. 2020;120(4):692–701.
8. Pabinger I, van Es N, Heinze G, et al. A clinical prediction model for cancer-associated venous thromboembolism: a development and validation study in two independent prospective cohorts. Lancet Haematol. 2018;5(7):e289–e298.
9. Hippisley-Cox J, Coupland C. Development and validation of risk prediction algorithm (QThrombosis) to estimate future risk of venous thromboembolism: prospective cohort study. BMJ. 2011;343:d4656.
10. Sultan AA, West J, Grainge MJ, et al. Development and validation of risk prediction model for venous thromboembolism in postpartum women: multinational cohort study. BMJ. 2016;355:i6253.
11. Huang SY, Odisio BC, Sabir SH, et al. Development of a predictive model for 6 month survival in patients with venous thromboembolism and solid malignancy requiring IVC filter placement. J Thromb Thrombolysis. 2017;44(1):30–37.
12. Shen C, Ge B, Liu X, Chen H, Qin Y, Shen H. Predicting the occurrence of venous thromboembolism: construction and verification of risk warning model. BMC Cardiovasc Disord. 2020;20(1):249.
13. Matsuo K, Yessaian AA, Lin YG, et al. Predictive model of venous thromboembolism in endometrial cancer. Gynecol Oncol. 2013;128(3):544–551.
14. Stuck AK, Spirk D, Schaudt J, Kucher N. Risk assessment models for venous thromboembolism in acutely ill medical patients. A systematic review. Thromb Haemost. 2017;117(4):801–808.
15. Qiu P, Liu J, Wan F, et al. A predictive model for postthrombotic syndrome in proximal deep vein thrombosis patients. Ann Transl Med. 2021;9(7):558.
16. Méan M, Limacher A, Alatri A, Aujesky D, Mazzolai L. Derivation and Validation of a Prediction Model for Risk Stratification of Post-Thrombotic Syndrome in Elderly Patients with a First Deep Vein Thrombosis. Thromb Haemost. 2018;118(8):1419–1427.
17. Amin EE, van Kuijk SMJ, Joore MA, Prandoni P, Ten Cate H, Ten Cate-Hoek AJ. Development and Validation of a Practical Two-Step Prediction Model and Clinical Risk Score for Post-Thrombotic Syndrome. Thromb Haemost. 2018;118(7):1242–1249.
18. Rabinovich A, Ducruet T, Kahn SR. SOX Trial investigators. Development of a clinical prediction model for the postthrombotic syndrome in a prospective cohort of patients with proximal deep vein thrombosis. J Thromb Haemost. 2018;16(2):262–270.
19. Chopard R, Albertsen IE, Piazza G. Diagnosis and Treatment of Lower Extremity Venous Thromboembolism: a Review. JAMA. 2020;324(17):1765–1776.
20. Bhat TM, Afari ME, Garcia LA. Neutrophil lymphocyte ratio in peripheral vascular disease: a review. Expert Rev Cardiovasc Ther. 2016;14(7):871–875.
21. Mozos I, Malainer C, Horbańczuk J, et al. Inflammatory Markers for Arterial Stiffness in Cardiovascular Diseases. Front Immunol. 2017;8:1058.
22. Neupane R, Jin X, Sasaki T, Li X, Murohara T, Cheng XW. Immune Disorder in Atherosclerotic Cardiovascular Disease-Clinical Implications of Using Circulating T-Cell Subsets as Biomarkers. Circ J. 2019;83(7):1431–1438.
23. Kremers B, Wübbeke L, Mees B, Ten Cate H, Spronk H, Ten Cate-Hoek A. Plasma Biomarkers to Predict Cardiovascular Outcome in Patients With Peripheral Artery Disease: a Systematic Review and Meta-Analysis. Arterioscler Thromb Vasc Biol. 2020;40(9):2018–2032.
24. Ates H, Ates I, Kundi H, Yilmaz FM. Diagnostic validity of hematologic parameters in evaluation of massive pulmonary embolism. J Clin Lab Anal. 2017;31(5):e22072.
25. Akgüllü Ç, Ömürlü İK, Eryılmaz U, et al. Predictors of early death in patients with acute pulmonary embolism. Am J Emerg Med. 2015;33(2):214–221.
26. Bi W, Liang S, He Z, et al. The Prognostic Value of the Serum Levels of Brain Natriuretic Peptide, Troponin I, and D-Dimer, in Addition to the Neutrophil-to-Lymphocyte Ratio, for the Disease Evaluation of Patients with Acute Pulmonary Embolism. Int J Gen Med. 2021;14:303–308.
27. Liu C, Zhan HL, Huang ZH, et al. Prognostic role of the preoperative neutrophil-to-lymphocyte ratio and albumin for 30-day mortality in patients with postoperative acute pulmonary embolism. BMC Pulm Med. 2020;20(1):180.
28. Karataş MB, Ipek G, Onuk T, et al. Assessment of Prognostic Value of Neutrophil to Lymphocyte Ratio and Platelet to Lymphocyte Ratio in Patients with Pulmonary Embolism. Acta Cardiol Sin. 2016;32(3):313–320.
29. Cannon NA, Meyer J, Iyengar P, et al. Neutrophil-lymphocyte and platelet-lymphocyte ratios as prognostic variables after stereotactic radiation therapy for early-stage non-small-cell lung cancer. J Thorac Oncol. 2015;10(2):280–285.
30. Dolan RD, McSorley ST, Park JH, et al. The prognostic value of systemic inflammation in patients undergoing surgery for colon cancer: comparison of composite ratios and cumulative scores. Br J Cancer. 2018;119(1):40–51.
31. Gok M, Kurtul A. A novel marker for predicting severity of acute pulmonary embolism: systemic immune-inflammation index. Scand Cardiovasc J. 2021;55(2):91–96.
32. Peng J, Wang H, Zhang L, Lin Z. Construction and efficiency analysis of prediction model for venous thromboembolism risk in the elderly after Hip fracture. Zhong Nan Da Xue Xue Bao Yi Xue Ban. 2021;46(2):142–148.
33. Kahn SR, Partsch H, Vedantham S, Prandoni P, Kearon C. Subcommittee on Control of Anticoagulation of the Scientific and Standardization Committee of the International Society on Thrombosis and Haemostasis. Definition of post-thrombotic syndrome of the leg for use in clinical investigations: a recommendation for standardization. J Thromb Haemost. 2009;7(5):879–883.
34. Moons KG, Altman DG, Reitsma JB, et al. Transparent Reporting of a multivariable prediction model for Individual Prognosis or Diagnosis (TRIPOD): explanation and elaboration. Ann Intern Med. 2015;162:W1–73.
35. McCurdy JD, Israel A, Hasan M, et al. A clinical predictive model for post-hospitalisation venous thromboembolism in patients with inflammatory bowel disease. Aliment Pharmacol Ther. 2019;49(12):1493–1501.
36. Xue J, Ma D, Jiang J, Liu Y. Diagnostic and Prognostic Value of Immune/Inflammation Biomarkers for Venous Thromboembolism: is It Reliable for Clinical Practice? J Inflamm Res. 2021;14:5059–5077.
37. Celebi S, Berkalp B, Amasyali B. The association between thrombotic and inflammatory biomarkers and lower-extremity peripheral artery disease. Int Wound J. 2020;17(5):1346–1355.
 © 2022 The Author(s). This work is published and licensed by Dove Medical Press Limited. The full terms of this license are available at https://www.dovepress.com/terms.php and incorporate the Creative Commons Attribution - Non Commercial (unported, v3.0) License.
By accessing the work you hereby accept the Terms. Non-commercial uses of the work are permitted without any further permission from Dove Medical Press Limited, provided the work is properly attributed. For permission for commercial use of this work, please see paragraphs 4.2 and 5 of our Terms.
© 2022 The Author(s). This work is published and licensed by Dove Medical Press Limited. The full terms of this license are available at https://www.dovepress.com/terms.php and incorporate the Creative Commons Attribution - Non Commercial (unported, v3.0) License.
By accessing the work you hereby accept the Terms. Non-commercial uses of the work are permitted without any further permission from Dove Medical Press Limited, provided the work is properly attributed. For permission for commercial use of this work, please see paragraphs 4.2 and 5 of our Terms.