")
Back to Journals » Cancer Management and Research » Volume 13
A Powerful Nomogram Based on the Novel D-Index to Predict Prognosis After Surgical Resection of Hepatocellular Carcinoma
Received 4 February 2021
Accepted for publication 5 March 2021
Published 17 March 2021 Volume 2021:13 Pages 2581—2594
DOI https://doi.org/10.2147/CMAR.S305253
Checked for plagiarism Yes
Review by Single anonymous peer review
Peer reviewer comments 2
Editor who approved publication: Professor Seema Singh
Xia Du,1 Cheng-Nan Guo,2 Xiao-Dong Bao3
1Department of Hepatobiliary Surgery, The First Affiliated Hospital of Wenzhou Medical University, Wenzhou, Zhejiang, People’s Republic of China; 2Department of Statistics, School of Public Health and Management, Wenzhou Medical University, Wenzhou, Zhejiang, People’s Republic of China; 3Central Laboratory, The First Affiliated Hospital of Wenzhou Medical University, Wenzhou, Zhejiang, People’s Republic of China
Correspondence: Xiao-Dong Bao
Central Laboratory, The First Affiliated Hospital of Wenzhou Medical University, Wenzhou, Zhejiang, 325003, People’s Republic of China
Tel +86 1 881 500 0923
Email [email protected]
Purpose: Conventional staging and scoring systems such as the Tumor, Node, and Metastasis; Cancer of the Liver Italian Program; Barcelona Clinic Liver Cancer; and Okuda have failed to predict overall survival (OS) in patients with resected primary hepatocellular carcinoma. Thus, we aimed to establish a novel D-index and nomogram to improve prognostic accuracy.
Patients and Methods: We selected 396 patients who underwent liver resection between January 2007 and February 2015 at the First Affiliated Hospital of Wenzhou Medical University. These patients were randomly divided into the training and validation groups in a ratio of 7:3.
Results: We generated a nomogram using five independent risk factors, including the D-index (calculated by total bilirubin × tumor size/the ratio of fat-to-muscle area 0.5) in the training set. The predictive performance of the nomogram was similar in both the training and validation cohorts according to the concordance index. The nomogram demonstrated the strongest predictive power for 1-year, 3-year, and 5-year OS, with the area under the receiving operating characteristic curve being 0.8486, 0.7785, and 0.752, respectively. The calibration curves exhibited stable capabilities in both cohorts. The stratification of the Kaplan-Meier curve was significant (P < 0.001).
Conclusion: The associated nomogram of the D-index demonstrated a powerful and accurate predictive ability for OS in patients with primary hepatocellular carcinoma.
Keywords: primary hepatocellular carcinoma, resection, D-index, nomogram, prognosis
Introduction
Liver carcinoma is the sixth most commonly diagnosed cancer worldwide and the fourth main cause of cancer-related death. Hepatocellular carcinoma (HCC) accounts for 75–85% of primary hepatic carcinomas. In China, aflatoxin and chronic hepatitis B are the main risk factors for the high incidence of HCC.1 Current treatments for HCC include resection, ablation, transarterial embolization, radiotherapy, systemic pharmacological treatment, and liver transplantation.2 Liver transplantation is considered the best treatment for HCC, as complete tumor resection eliminates underlying disease (eg, liver cirrhosis).3 However, due to the considerable resources needed for organ transplantation, surgical resection remains the primary treatment choice in China.
Several staging/scoring systems are widely used, including the Tumor, Node, and Metastasis (TNM) staging system (eighth edition),4 Barcelona Clinic Liver Cancer (BCLC) staging system,5 Cancer of the Liver Italian Program (CLIP) scoring system,6 and Okuda staging system.7 Many indices have also been used to predict prognostic outcomes. For instance, the spleen stiffness measurement evaluated using transient elastography can reliably predict late recurrence of HCC.8 Malnutrition is also a prognostic factor for HCC.9 In patients who undergo HCC resection, the systemic immune inflammation index is a potent index of poor prognosis.10 These systems and indices play an essential role in predicting prognosis and influencing treatment choice.
However, those traditional systems have limitations. The TNM is based only on postoperative diagnosis, and the BCLC system is too complex for clinical use. The TNM and BCLC are reportedly unable to evaluate overall survival (OS) in HCC patients.11 The CLIP may not be accurate when performance status is not included.12 The Okuda was developed at a time when most patients were diagnosed with advanced-stage liver cancer. Although early diagnosis of cancer has been greatly improved, the predictive capacity of tools has become extremely inadequate.12 Such factors may discourage the use of traditional staging/scoring systems. Several novel systems have been considered to predict prognosis in HCC patients, including the Italian Liver Cancer13 and the Hong Kong Liver Cancer staging systems.14 Nonetheless, those systems failed to accurately and quantitatively evaluate OS after surgical resection and are not convenient as a single index.
Nomograms are frequently used to predict prognosis in cancer patients, as they can create a single digital estimation of the possibility of a clinical event and can stratify patients in clinical tests by generating individual predictions for each patient.15 Nomograms can establish biologically and clinically integrated models by assimilating various prognostic and determinant variables, thereby personalizing treatment. Moreover, the predicted prognoses are easier to understand than conventional staging.16
Our study aimed to establish a novel index and nomogram to predict the prognosis of HCC patients and accurately quantify OS.
Patients and Methods
Patient Screening
For this retrospective study, 682 patients diagnosed with HCC between January 2007 and February 2015 were selected from our hospital database. We included patients who had a) primary tumors, b) tumors completely excised without tumor manipulation during surgery, c) complete laboratory blood tests and imaging examinations, d) pathologically diagnosed HCC, e) no severe postoperative complications, f) no other malignant tumors, g) not undertaken treatment for cancer before surgery, and h) normal brain, heart, and kidney function. Patients were excluded if they a) had incomplete data and b) received additional treatments after hepatectomy such as ablation, transarterial embolization, radiotherapy, systemic pharmacological treatment, or transplantation. Finally, we enrolled 396 patients for the study and randomly divided them into the training and validation groups at a ratio of 7:3.
The first follow-up date was considered the date of surgical resection. All patients were followed up by outpatient or telephone visits every 3 months for the first two years, every 6 months since the third year, and every 12 months after five years. Follow-up ceased on August 1, 2018. OS was defined as the duration from hepatectomy until the date of death or last visit.
Clinical Information and Laboratory Results
Clinical information included age, sex, weight, height, body mass index, and alcohol consumption. Laboratory reports included levels of alpha-fetoprotein, albumin, fibrinogen, total bilirubin (TBIL), total cholesterol, alanine transaminase, aspartate transaminase (AST), γ-glutamyl transpeptidase, neutrophil, monocyte, lymphocyte, platelet, and prothrombin time (PT). The pathological diagnosis and other information were acquired from surgical records, including the presence of ascites fluid, liver cirrhosis, tumor size (TS), tumor capsule, tumor stage, satellite nodules, peri-cancerous invasion, single/multiple tumors, invasion of the biliary duct, metastasis of lymph nodes, vascular invasion, tumor thrombus in the portal vein (PVT), intrahepatic metastasis, degree of tumor differentiation, and adjacent invasion (AI).
Radiographic Results and Imaging Analysis
All patients underwent preoperative abdominal noncontrast computed tomography (CT) to evaluate the general abdominal cavity. Two experienced radiologists (with 5 years of imaging experience), who were blinded to the patients’ clinical data, analyzed the CT images using a postprocessing station (GE Healthcare Advantage Workstation, version 4.6) with the axial image at the level of the L3 vertebra. A cross-sectional CT image at the inferior aspect of the third lumbar vertebra (L3) was selected for estimating muscle area (TAMA), subcutaneous fat area (SFA), and visceral fat area (VFA) as described previously.17–21 Adipose tissue was distinguished from other tissue by using the Hounsfield scale, and the boundaries were outlined manually as needed. The predetermined Hounsfield unit (HU) thresholds were −29 to −150 HU for TAMA, −30 to −190 HU for SFA, and −50 to −150 HU for VFA (Supplemental Figure 1). Fat area was defined as the sum of visceral and subcutaneous fat areas. We also calculated the ratio of fat-to-muscle area (RFM).
Statistical Analysis
To improve the robustness and reliability of this study, the enrolled 397 participants were randomly split into a training set and another separate validation set at a ratio of 7:3 without replacement. The comparability of the two sets was then evaluated (Table 1). Continuous variables with normal distribution are presented as means ± standard deviation (x ± s). For variables with a skewed distribution, the median (1st quartile, 3rd quartile) was utilized. Categorical variables are represented as frequencies (proportion). The independent-sample t-test or Mann–Whitney U-test was used for continuous variables with normal or skewed distributions, respectively. The chi-square test or Fisher’s exact test was used to compare categorical variable.

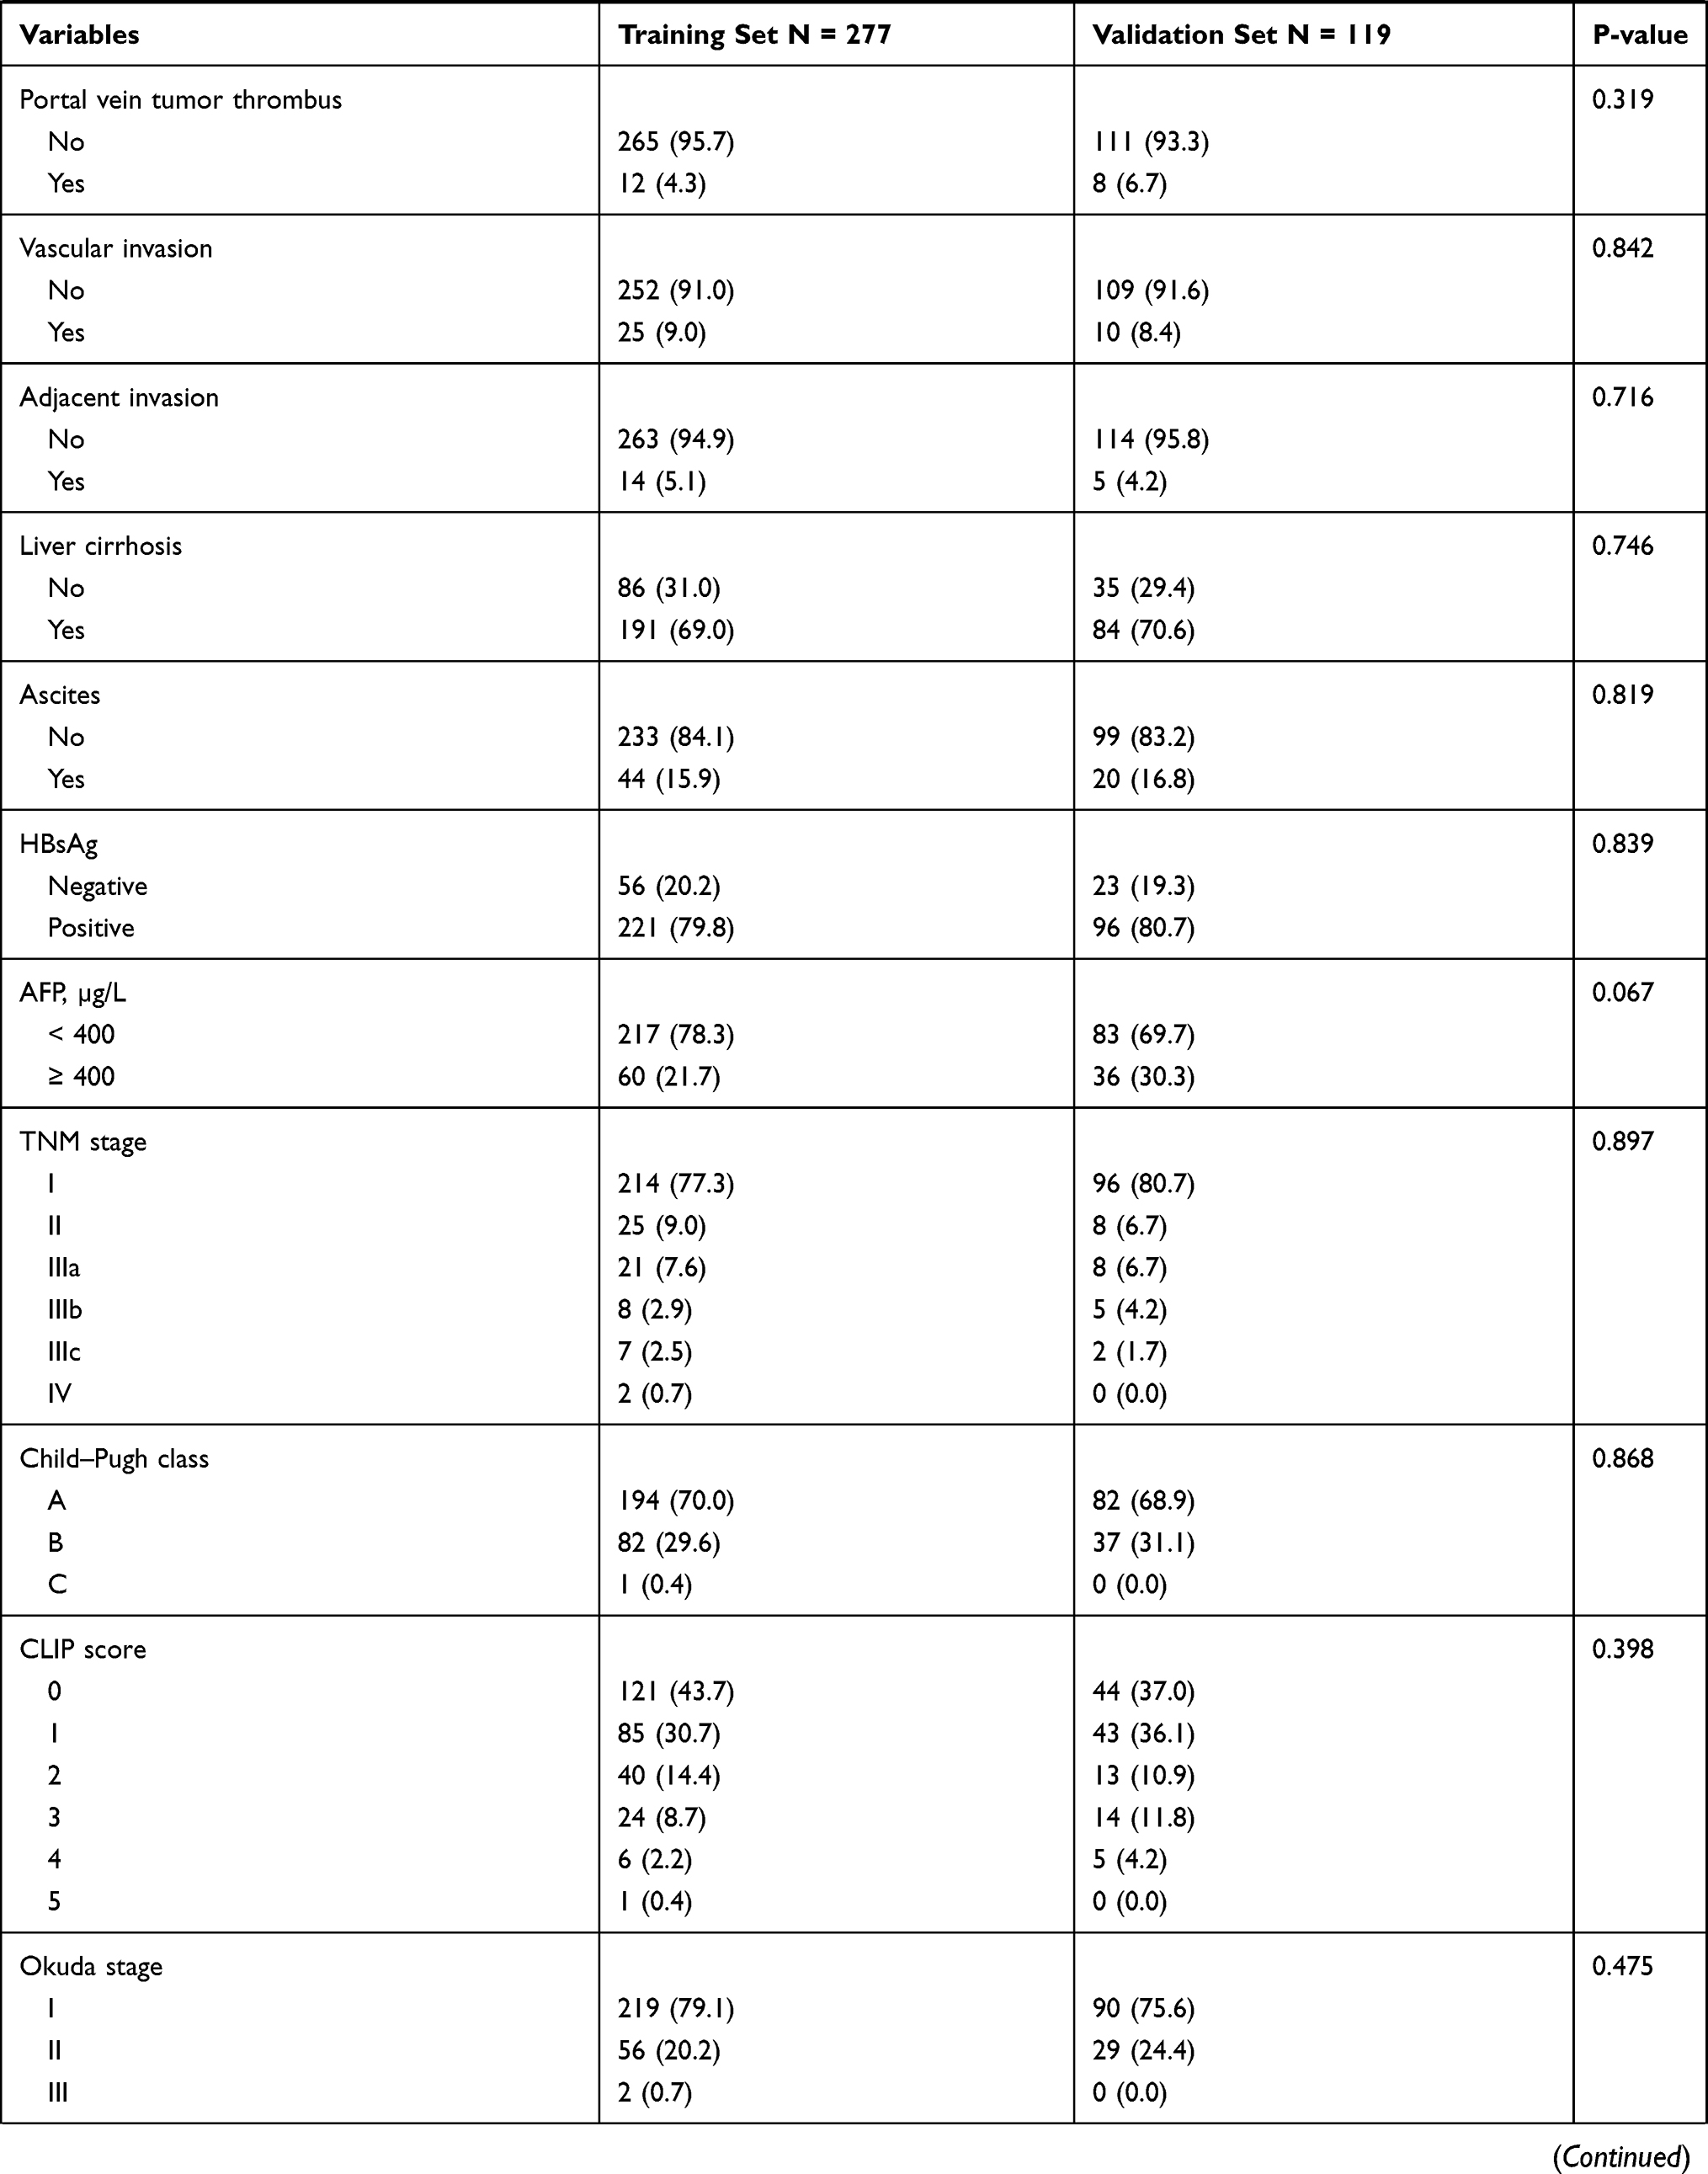
Table 1 Baseline Characteristics of the Study Participants in the Training and Validation Cohorts
Univariate and multivariable Cox analyses were utilized to filter possible indicators and estimate their weights in the training set. Significant risk factors (P < 0.05) of the univariate analysis were included in the multivariate analysis. Factors with p-values less than 0.05 in the multivariate Cox analysis were retained in the associated models. After then, a candidate nomogram model was built depending on the five most significant risk factors, including D-index. Survival curves were plotted using the X-tile software and Kaplan-Meier method from the diagnosis date to the death or last follow-up date in the training and validation sets, respectively. Survival curves were assessed using Log rank tests. The curve (AUC) of the receiver operating characteristic (ROC) analysis and the consistency index (C-index) were used to compare the predictive performance of the nomogram and other models. The clinical net benefit of the D-index and all systems mentioned in this study were evaluated using decision curve analysis (DCA). R version 3.6.3 and SPSS version 25.0 (SPSS, Chicago, IL, USA) were used for the statistical analyses.
Study of the Novel D-Index
To select the most important indicators from the clinical diagnostic variables and generate a model for the D-index, the laboratory and radiographic indices of all 396 patients were included in the logistic regression analysis. Important variables linked to Cox regression were subsequently chosen. Related indicators that would determine participant mortality (P < 0.1) were chosen using univariate analysis. The variance inflation factor was used to evaluate potential collinearity between the screened variables. Based on the partial regression coefficients of multivariate analysis, five indicators, including preoperative PT, TS, neutrophil counts, TBIL levels, and RFM, were added as candidate variables (Supplemental Table 1). Considering the partial regression coefficients, all potential combinations of candidate indicators were modeled, and the area under the ROC curve (AUC) of each model was compared. According to Occam’s razor, we selected three indicators and built a formula based on their mathematical relations.22 We obtained the D-index, which has a correspondingly large diagnostic value. The larger the D-index, the greater the mortality risk. The D-index was calculated as follows:
The D-index cutoff with the best sensitivity and specificity was obtained using Youden’s index. The best D-index cutoff was 37.9 (AUC 0.71, 95% confidence interval [CI] 0.66–0.76) (Supplemental Table 2).
Results
Clinical Variables
In total, 277 participants comprised the training cohort, and 119 comprised the validation cohort (ratio 7:3). Comparisons between both cohorts and baseline variables are shown in Table 1. There were no significant differences in baseline variables between both cohorts (P ≥ 0.05). The OS rates at 1, 3, and 5 years in the training and validation cohorts were 88.4%, 70.8%, and 56.3%, and 83.2%, 67.2%, and 58.8%, respectively; 63.2% and 64.7% of participants in the training and validation cohorts, respectively, had a D-index of ≥ 37.9. The mean survival time and median follow-up time were 3.77 and 5.33 years, respectively, in the training cohort and 3.65 and 5.12 years, respectively, in the validation cohort.
Predictive Indicators of the Training Cohort
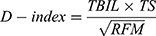
Results of the Cox proportional hazard analyses in the training cohort are summarized in Table 2. Because the D-index was a combination of three risk indicators and every scoring system was independent, the staging systems and the three factors of TBIL, TS, and RFM were not included in this process. Furthermore, the predictive capability of the D-index and the three variables that informed it was quantified using the AUC (Supplemental Table 3). According to the results, we believe that D-index is clearly advantageous over TBIL, TS, and RFM in terms of AUC and Youden’s index. It may be a powerful, optional indicator for the clinicians to consider. Both univariate and multivariate Cox proportional hazards analyses included criteria with P < 0.05. The indicators with multivariate Cox analysis revealed five important independent risk indicators: D-index, PT, AST, PVT, and AI.
 |
Table 2 Univariate and Multivariable Cox Proportional Hazard Analyses of the Training Cohort |
Generation and Validation of the Prognostic Nomogram
We generated a nomogram based on the five indicators (Figure 1). Every chosen factor was assigned a correlated score based on its value in the nomogram. A sample vertical line generated by the total score helped predict 1-year, 3-year, or 5-year survival after the total score was calculated. Ascertaining the interval where the total score was located enabled obtaining the estimated survival possibility easily. Concordance indices (C-indices) were calculated at three time points in both cohorts to evaluate the nomogram’s predictive performance. The C-indices of the training and validation sets at 1, 3, and 5 years were 0.780 (95% CI 0.705–0.854), 0.733 (95% CI 0.680–0.786), and 0.727 (95% CI 0.683–0.772), and 0.815 (95% CI 0.726–0.903), 0.758 (95% CI 0.686–0.830), and 0.739 (95% CI 0.670–0.808), respectively (Supplemental Table 4). At each time point, the C-indices of both cohorts performed similarly, indicating the robustness of the nomogram in predicting OS. The cutoff point of the nomogram was detected by X-tile analysis and adopted to estimate incompatible HCC-related death risk in the training set (Figure 2). Participants were separated into three groups using the X-tile software. These three groups followed the cutoff nodes described above in the validation set (low risk: < 69.2; medium risk: 69.2119.9; high risk: ≥ 119.9). The cumulative survival rates according to risk are shown in Figure 3. Compared to participants in the medium- or low-hazard group, individuals in the high or medium risk group had hazard ratios of 3.67 (95% CI 1.54–8.76) and 2.14 (95% CI 1.05–4.35), respectively, in the validation set. The calibration (Figure 4) and Kaplan-Meier curves are also displayed in the training and validation cohorts (Figures 2 and 3). The calibration curves showed high consistency in predicting survival in patients with primary hepatocellular carcinoma (PHCC) in both cohorts. The two sets of calibration curves were compatible with the prediction outcomes of the Kaplan-Meier curves.
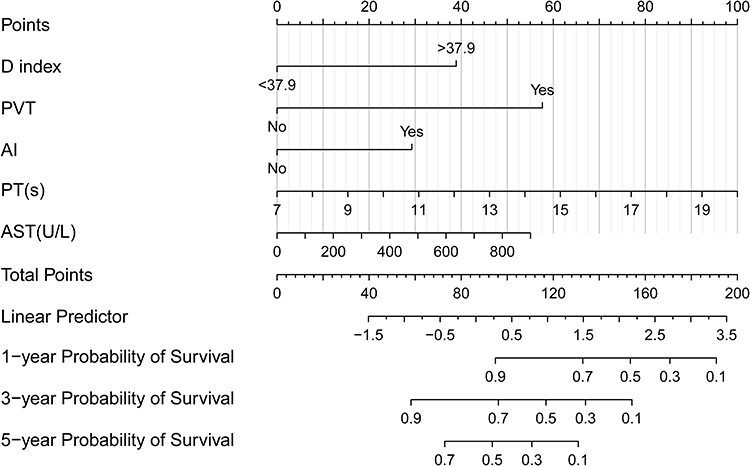 |
Figure 1 Nomogram of the D-index for predicting the overall survival after curative resection of PHCC. The scores of each variable were added to obtain the total score, and a vertical line was drawn on the total score to obtain the corresponding survival probability. Abbreviations: PHCC, primary hepatocellular carcinoma; PVT, portal vein tumor thrombus; AI, adjacent infiltration; PT prothrombin time; AST, aspartate transaminase. |
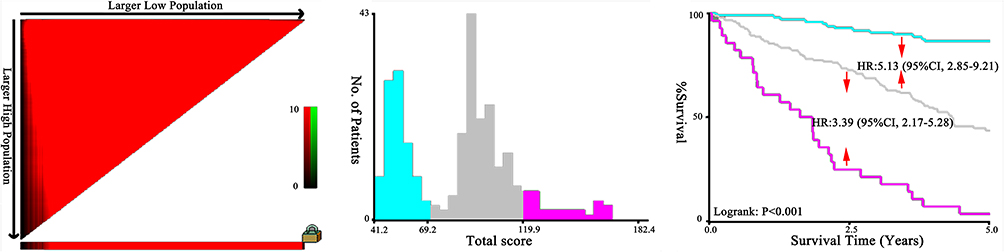 |
Figure 2 Results of using X-tile analysis by total risk score calculated by the nomogram scoring system in the training cohort. |
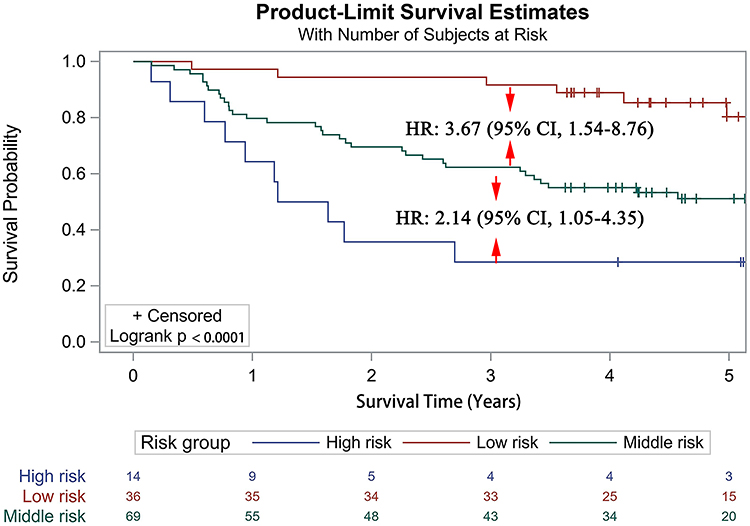 |
Figure 3 Survival curves stratified by total risk score (low risk: < 69.2; medium risk: 69.2–119.9; and high risk: ≥ 119.9) in the validation cohort. |
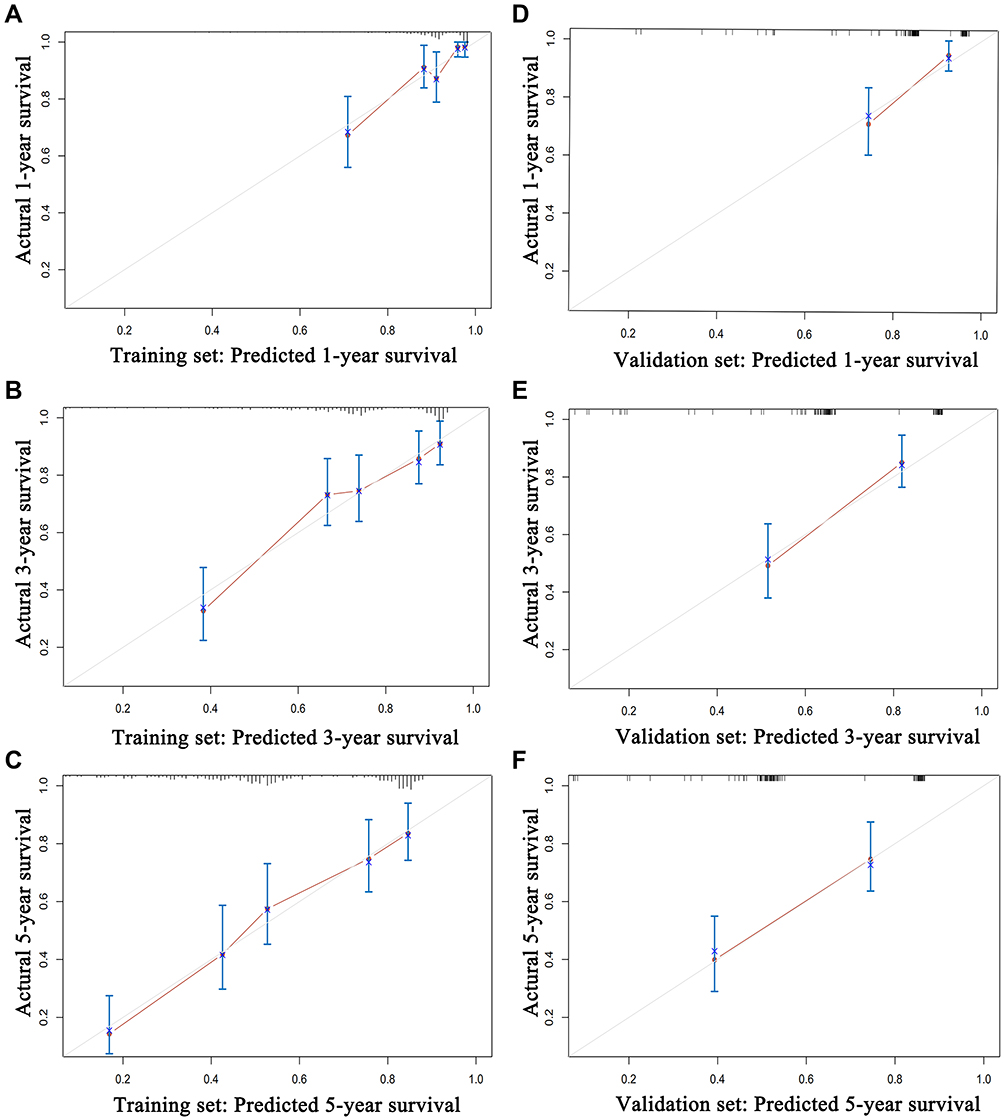 |
Figure 4 Calibration curves for predicting the overall survival rate by nomogram scoring system in the training and validation cohorts. Calibration curves of the prognostic nomogram for (A) 1-year overall survival, (B) 3-year overall survival, and (C) 5-year overall survival in the training set, and calibration curves for (D) 1-year overall survival, (E) 3-year overall survival, and (F) 5-year overall survival in the validation set. |
Predictive Ability of the Nomogram Model
To further confirm the predominance of the nomogram (D-index, PT, AST, PVT, and AI) for assessing prediction in PHCC patients, we depicted ROC curves to compare predictive ability among the D-index, prognostic nomogram, CLIP, TNM, Child–Pugh, BCLC, Okuda, and the combined group (CLIP, TNM, Child–Pugh, BCLC, and Okuda) (Figure 5). The performance of all methods at 1-, 3-, and 5-year OS was completed using AUC values; the D-index AUC values were 0.8103, 0.7479, and 0.7338, respectively. The D-index performed better than all ordinary systems (CLIP, TNM, Child–Pugh, BCLC, and Okuda) for 1-, 3-, and 5-year OS. Furthermore, the Child–Pugh was the worst predictor (0.6038) of 3-year OS, and the Okuda was the worst predictor of 1- and 5-year OS (0.6315 and 0.5576, respectively). Overall, the nomogram showed the greatest accomplishment. For 1-year OS, the nomogram’s C-index was > 0.8 in the validation cohort. The nomogram was the only one that performed better than the combined group (1-year OS, 0.8251; 3-year OS, 0.7462; 5-year OS, 0.6776).
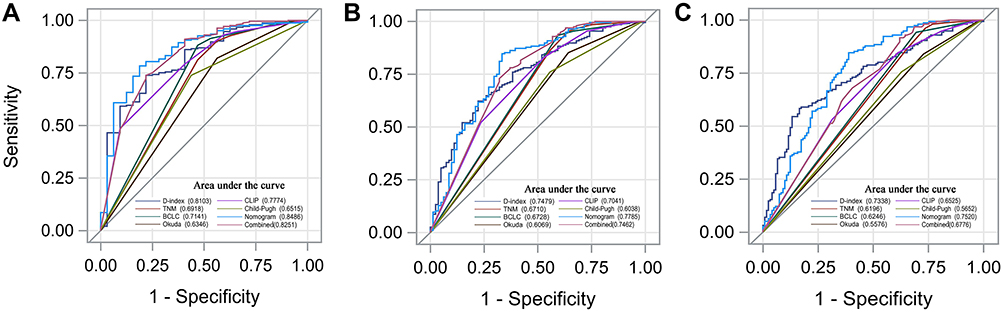 |
Figure 5 ROC curve of the D-index, prognostic nomogram, CLIP, TNM, Child–Pugh, BCLC, Okuda system, and combined group in the training cohort. ROC curve for (A) 1-year survival, (B) 3-year survival, and (C) 5-year survival. The combined group included the CLIP, TNM, Child–Pugh, BCLC, and Okuda. Abbreviations: CLIP, Cancer of the Liver Italian Program; TNM, Tumor, Node, Metastasis classification; BCLC, Barcelona Clinic Liver Cancer; ROC, receiver operating characteristic. |
Decision Curve Analysis
As shown in the DCA (Figure 6), disregarding how large the threshold possibility was (excluding the 0.35–0.45 range wherein the nomogram was concurrent with the D-index), the nomogram was the best predictor in most cases, achieving the highest clinical net profit. In contrast to the traditional staging systems, the D-index is clinically important. When the threshold was within 0.2–0.5, the net profit of the nomogram including the D-index as well as the D-index itself was larger than that of the other systems. These values could provide a more practical and beneficial predictive ability. As the boundary was > 0.5, the clinical net profits to patients decreased significantly.
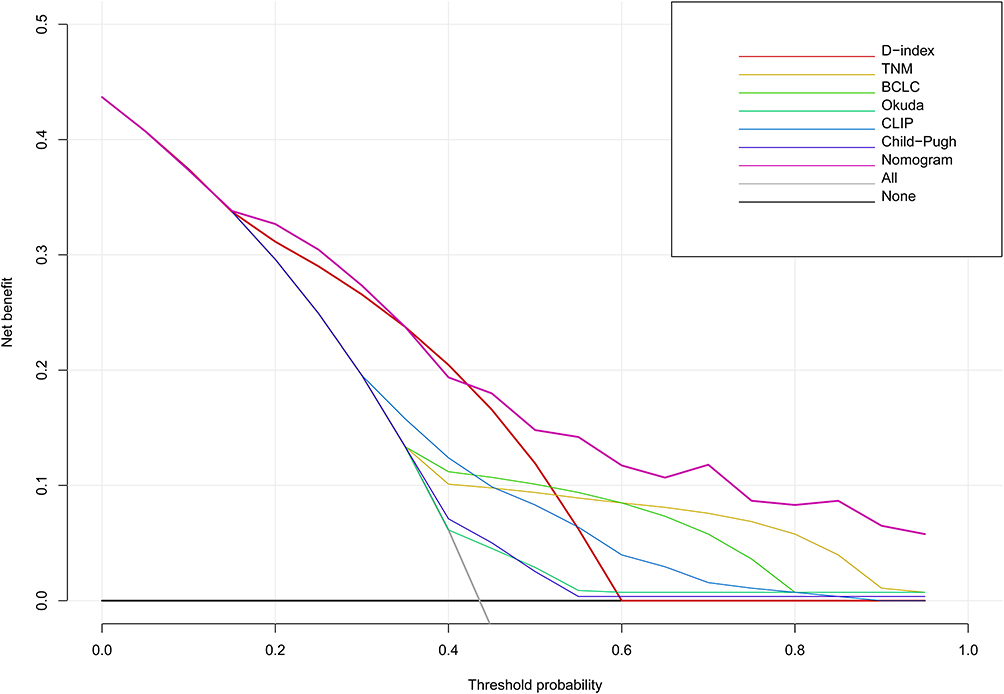 |
Figure 6 DCA curve of the D-index, TNM, BCLC, Okuda, CLIP, and prognostic nomogram in the training cohort. The horizontal axis represents the threshold value, which is the reference probability of whether a patient receives treatment, and the vertical axis represents the net benefit rate after the advantages minus the disadvantages. Under the same threshold probability, the larger net benefit implies that patients can obtain the maximum benefit using the diagnosis of this model. The closer the curve in the DCA graph to the top, the higher the value of the model diagnosis. Abbreviations: DCA, decision curve analysis; TNM, Tumor, Node, Metastasis classification; BCLC, Barcelona Clinic Liver Cancer; CLIP, Cancer of the Liver Italian Program. |
Discussion
Nomograms are more practical and accurate than other staging systems in building a predictive model for certain tumors.23–25 Here, we generated and validated a novel nomogram to accurately forecast survival in HCC patients. The nomogram considered five risk factors: D-index, PT, AST, PVT, and AI. Participants were divided into three series (low, moderate, and high risk) using X-tile analysis. Calibration curves showed high consistency between predicted and actual values in the training and validation cohorts, confirming the reliability of our nomogram for reuse. The nomogram better predicted OS than other ordinary systems at 1 (AUC: 0.8486), 3 (AUC: 0.7785), and 5 years (AUC: 0.752). Moreover, the DCA, generally utilized to obtain the maximum net profit and considered to be more accurate than the ROC curve,26 was used to examine the nomogram’s clinical performance. DCA can be utilized to combine clinical effects and compare prognostic models.27,28
Compared with other nomograms, our nomogram had relatively higher sensitivity and accuracy owing to the D-index. Liao et al29 built a nomogram that included TS, tumor number, microvascular invasion, and NMLR to predict postoperative OS in HCC patients; the nomogram demonstrated great predictive capability at 3 years (AUC: 0.821) but a general one at 5 years (AUC: 0.664). Chen et al30 reported that tumors were associated with diverse and complex factors; however, their S-index only combined blood indicators, suggesting that nomograms based on multiple factors have better predictive performance [1-year (AUC: 0.738), 3-year (AUC: 0.7293), 5-year (AUC: 0.752)]. Our D-index not only combined blood indicators but also included tumor characteristics and size, and we considered body composition by calculating the RFM. Thus, our nomogram has superior performance than other nomograms and better calibration ability than that created by Chen et al.
Our D-index was associated with TBIL levels, TS, and the RFM. Elevated TBIL levels can appear when hepatic cells are damaged, increasing the risk of hepatic fibrosis among HBV-infected patients31 and increasing the invasiveness of HCC.32 Therefore, HCC patients with high bilirubin are likely to have a poor prognosis, and TS influences the 5-year all-cause mortality.33 Preoperative sarcopenia and obesity are considered risk factors for poor prognosis in patients who underwent HCC resection.34–37 This suggests that higher fat and lower muscle contents are related to a poor prognosis. In our D-index formula, the RFM can be regarded as the quantification of fat and muscle tissue content. However, the formula infers that higher fat and lower muscle contents predict a favorable prognosis, which is contrary to the abovementioned studies. Zhang et al38 reported that sarcopenia may be triggered by cachexia and malnutrition caused by cancer; they found that patients with advanced cancer had a higher risk of skeletal muscle consumption. One possible explanation is that our patients were at an earlier stage of cancer, without severe muscle decomposition. Furthermore, in the early stages of cancer, the body mainly mobilizes fat against the high consumption of malignant tumors. Alternatively, a lower RFM may imply a more serious consumption condition and, therefore, a poorer prognosis. However, these are mere speculations and require further investigation.
Our nomogram involved five independent risk factors. Among them, PVT, AI, AST, and PT have already been shown to correlate with poor prognosis after HCC resection.39–43 In terms of these risk factors, our research is consistent with previous studies.
Our nomogram has several advantages. The D-index had better predictive power than the conventional systems, so our nomogram had favorable stability and accuracy. The variables were easy to obtain from clinical practice and were objective, avoiding the effects of surgeon subjectivity. Moreover, implementing the scoring system was simple and convenient. By producing an accurate prognosis, this nomogram could help to select specific treatment regimens for patients under variable conditions. Furthermore, the nomogram could help surgeons to stratify patients and provide more tailored treatment.
However, our study has some limitations. First, it was restricted to a single center; thus, our results need to be verified by multicenter investigations. Second, the nomogram was mainly based on baseline levels of the D-index, PT, AST, PVT, and AI, whose levels might have not remained steady during the whole phase, affecting accuracy, especially for 3- and 5-year survival. Finally, this model is not suitable for patients who receive treatments other than PHCC resection. There are far more factors to be investigated and used to predict the prognosis of HCC.
Conclusion
Our team managed to use a novel index and nomogram to predict OS in PHCC patients undergoing liver resection. Our nomogram showed a powerful predictive ability and could help clinicians make better therapeutic decisions. We hope our results can be verified further and widely used.
Data Sharing Statement
Data sharing is not applicable to this article as no datasets were generated or analyzed during the current study.
Ethics Approval and Informed Consent
All procedures performed in studies involving human participants were in accordance with the ethical standards of the institutional and/or national research committee and with the 1964 Helsinki Declaration and its later amendments or comparable ethical standards. The study was approved by the Ethics Committee of the First Affiliated Hospital of Wenzhou Medical University, Wenzhou, China. Informed consent was obtained from the participants via telephone.
Acknowledgment
We would like to thank Editage (www.editage.cn) for English language editing.
Author Contributions
All authors contributed to data analysis, drafting or revising the article, have agreed on the journal to which the article will be submitted, gave final approval of the version to be published, and agree to be accountable for all aspects of the work.
Funding
No funds, grants, or other support was received.
Disclosure
The authors report no conflicts of interest in this work.
References
1. Bray F, Ferlay J, Soerjomataram I, Siegel RL, Torre LA, Jemal A. Global cancer statistics 2018: GLOBOCAN estimates of incidence and mortality worldwide for 36 cancers in 185 countries. CA Cancer J Clin. 2018;68(6):394–424. doi:10.3322/caac.21492
2. Yang JD, Hainaut P, Gores GJ, Amadou A, Plymoth A, Roberts LR. A global view of hepatocellular carcinoma: trends, risk, prevention and management. Nat Rev Gastroenterol Hepatol. 2019;16(10):589–604. doi:10.1038/s41575-019-0186-y
3. Vibert E, Schwartz M, Olthoff KM. Advances in resection and transplantation for hepatocellular carcinoma. J Hepatol. 2020;72(2):262–276. doi:10.1016/j.jhep.2019.11.017
4. Chen LJ, Chang YJ, Chang YJ. Survival predictability between the American joint committee on cancer, eighth edition staging system and the barcelona clinic liver cancer classification in patients with hepatocellular carcinoma. Oncologist. 2020. doi:10.1002/onco.13535
5. Tsilimigras DI, Bagante F, Sahara K, et al. Prognosis after resection of Barcelona Clinic Liver Cancer (BCLC) stage 0, A, and B hepatocellular carcinoma: a comprehensive assessment of the current BCLC classification. Ann Surg Oncol. 2019;26(11):3693–3700. doi:10.1245/s10434-019-07580-9
6. Lin CY, Kee KM, Wang JH, et al. Is the cancer of the liver italian program system an adequate weighting for survival of hepatocellular carcinoma? Evaluation of intrascore prognostic value among 36 subgroups. Liver Int. 2009;29:74–81. doi:10.1111/j.1478-3231.2008.01702.x
7. Lu W, Dong J, Huang Z, Guo D, Liu Y, Shi S. Comparison of four current staging systems for Chinese patients with hepatocellular carcinoma undergoing curative resection: okuda, CLIP, TNM and CUPI. J Gastroenterol Hepatol. 2008;23(12):1874–1878. doi:10.1111/j.1440-1746.2008.05527.x
8. Marasco G, Colecchia A, Colli A, et al. Role of liver and spleen stiffness in predicting the recurrence of hepatocellular carcinoma after resection. J Hepatol. 2019;70(3):440–448. doi:10.1016/j.jhep.2018.10.022
9. Schütte K, Tippelt B, Schulz C, et al. Malnutrition is a prognostic factor in patients with hepatocellular carcinoma (HCC). Clin Nutr. 2015;34(6):1122–1127. doi:10.1016/j.clnu.2014.11.007
10. Hu B, Yang X-R, Xu Y, et al. Systemic immune-inflammation index predicts prognosis of patients after curative resection for hepatocellular carcinoma. Clin Cancer Res. 2014;20(23):6212–6222. doi:10.1158/1078-0432.CCR-14-0442
11. Huitzil-Melendez F-D, Capanu M, O’Reilly EM, et al. Advanced hepatocellular carcinoma: which staging systems best predict prognosis? J Clin Oncol. 2010;28(17):2889–2895. doi:10.1200/JCO.2009.25.9895
12. Addissie BD, Roberts LR. Classification and staging of hepatocellular carcinoma: an aid to clinical decision-making. Clin Liver Dis. 2015;19(2):277–294. doi:10.1016/j.cld.2015.01.011
13. Parikh ND, Singal AG. The ITA.LI.CA staging system: a novel staging system for hepatocellular carcinoma. PLOS Med. 2016;13(4):e1002005. doi:10.1371/journal.pmed.1002005
14. Yau T, Tang VY, Yao TJ, Fan ST, Lo CM, Poon RT. Development of Hong Kong liver cancer staging system with treatment stratification for patients with hepatocellular carcinoma. Gastroenterology. 2014;146:1691–700.e3. doi:10.1053/j.gastro.2014.02.032
15. Iasonos A, Schrag D, Raj GV, Panageas KS. How to build and interpret a nomogram for cancer prognosis. J Clin Oncol. 2008;26(8):1364–1370. doi:10.1200/JCO.2007.12.9791
16. Balachandran VP, Gonen M, Smith JJ, DeMatteo RP. Nomograms in oncology: more than meets the eye. Lancet Oncol. 2015;16(4):e173–e180. doi:10.1016/S1470-2045(14)71116-7
17. Huang DD, Huang SL, Zhuang CL, et al. Sarcopenia, as defined by low muscle mass, strength, and physical performance, predicts complications after surgery for colorectal cancer. Colorectal Dis. 2015;17(11):O256–O264. doi:10.1111/codi.13067
18. Wang S-L, Zhuang C-L, Huang -D-D. Sarcopenia adversely impacts postoperative clinical outcomes following gastrectomy in patients with gastric cancer: a Prospective Study. Ann Surg Oncol. 2016;23(2):556–564. doi:10.1245/s10434-015-4887-3
19. Prado CMM, Lieffers JR, Mccargar LJ, et al. Prevalence and clinical implications of sarcopenic obesity in patients with solid tumours of the respiratory and gastrointestinal tracts: a population-based study. Lancet Oncol. 2008;9(7):605–607. doi:10.1016/S1470-2045(08)70153-0
20. Malietzis G, Currie AC, Athanasiou T, et al. Influence of body composition profile on outcomes following colorectal cancer surgery[J]. Br J Surg. 2016;103(5):572–580. doi:10.1002/bjs.10075
21. Pecorelli N, Carrara G, Cobelli FD, et al. Effect of sarcopenia and visceral obesity on mortality and pancreatic fistula following pancreatic cancer surgery. Br J Surg. 2016;103(4):434–442. doi:10.1002/bjs.10063
22. Van Den Berg HA. Occam’s razor: from ockham’s via moderna to modern data science. Sci Prog. 2018;101:261–272. doi:10.3184/003685018X15295002645082
23. Weiser MR, Landmann RG, Kattan MW, et al. Individualized prediction of colon cancer recurrence using a nomogram. J Clin Oncol. 2008;26(3):380–385. doi:10.1200/JCO.2007.14.1291
24. Xu L, Peng ZW, Chen MS, et al. Prognostic nomogram for patients with unresectable hepatocellular carcinoma after transcatheter arterial chemoembolization. J Hepatol. 2015;63:122–130. doi:10.1016/j.jhep.2015.02.034
25. Huang Y-Q, Liang C-H, He L, et al. Development and validation of a radiomics nomogram for preoperative prediction of lymph node metastasis in colorectal cancer. J Clin Oncol. 2016;34(18):2157–2164. doi:10.1200/JCO.2015.65.9128
26. Rousson V, Zumbrunn T. Decision curve analysis revisited: overall net benefit, relationships to ROC curve analysis, and application to case-control studies. BMC Med Inform Decis Mak. 2011;11(1):45. doi:10.1186/1472-6947-11-45
27. Kerr KF, Brown MD, Zhu K, Janes H. Assessing the clinical impact of risk prediction models with decision curves: guidance for correct interpretation and appropriate use. J Clin Oncol. 2016;34(21):2534–2540. doi:10.1200/JCO.2015.65.5654
28. Lamain-de Ruiter M, Kwee A, Naaktgeboren CA, et al. External validation of prognostic models to predict risk of gestational diabetes mellitus in one Dutch cohort: prospective multicentre cohort study. BMJ. 2016;354:i4338. doi:10.1136/bmj.i4338
29. Liao R, Peng C, Li M, et al. Comparison and validation of the prognostic value of preoperative systemic immune cells in hepatocellular carcinoma after curative hepatectomy. Cancer Med. 2018;7(4):1170–1182. doi:10.1002/cam4.1424
30. Chen L, Cai BB, Zhou CJ, et al. A sample model established by S-index predicting overall survival after curative resection of primary hepatocellular carcinoma. Cancer Manag Res. 2019;11:693–703. doi:10.2147/CMAR.S193593
31. Du M, Zhang S, Xiao L, et al. The relationship between serum bilirubin and elevated fibrotic indices among HBV carriers: a cross-sectional study of a Chinese population. Int J Mol Sci. 2016;17(12):2057. doi:10.3390/ijms17122057
32. Carr BI, Guerra V, Giannini EG, et al. Association of abnormal plasma bilirubin with aggressive hepatocellular carcinoma phenotype. Semin Oncol. 2014;41(2):252–258. doi:10.1053/j.seminoncol.2014.03.006
33. Dai C-Y, Lin C-Y, Tsai P-C, et al. Impact of tumor size on the prognosis of hepatocellular carcinoma in patients who underwent liver resection. J Chin Med Assoc. 2018;81(2):155–163. doi:10.1016/j.jcma.2017.06.018
34. Fujiwara N, Nakagawa H, Kudo Y, et al. Sarcopenia, intramuscular fat deposition, and visceral adiposity independently predict the outcomes of hepatocellular carcinoma. J Hepatol. 2015;63(1):131–140. doi:10.1016/j.jhep.2015.02.031
35. Hamaguchi Y, Kaido T, Okumura S, et al. Preoperative intramuscular adipose tissue content is a novel prognostic predictor after hepatectomy for hepatocellular carcinoma. J Hepatobiliary Pancreat Sci. 2015;22:475–485. doi:10.1002/jhbp.236
36. Voron T, Tselikas L, Pietrasz D, et al. Sarcopenia impacts on short- and long-term results of hepatectomy for hepatocellular carcinoma. Ann Surg. 2015;261(6):1173–1183. doi:10.1097/SLA.0000000000000743
37. Kobayashi A, Kaido T, Hamaguchi Y, et al. Impact of sarcopenic obesity on outcomes in patients undergoing hepatectomy for hepatocellular carcinoma. Ann Surg. 2019;269(5):924–931. doi:10.1097/SLA.0000000000002555
38. Zhang G, Li X, Sui C, et al. Incidence and risk factor analysis for sarcopenia in patients with cancer. Oncol Lett. 2016;11(2):1230–1234. doi:10.3892/ol.2015.4019
39. Shen S-L, Fu S-J, Chen B, et al. Preoperative aspartate aminotransferase to platelet ratio is an independent prognostic factor for hepatitis B-induced hepatocellular carcinoma after hepatic resection. Ann Surg Oncol. 2014;21(12):3802–3809. doi:10.1245/s10434-014-3771-x
40. Wang X-P, Mao MJ, He Z-L, et al. A retrospective discussion of the prognostic value of combining prothrombin time(PT) and fibrinogen(Fbg) in patients with hepatocellular carcinoma. J Cancer. 2017;8(11):2079–2087. doi:10.7150/jca.19181
41. Kato Y, Okamura Y, Sugiura T, et al. The impact of serosal invasion on prognosis after curative hepatectomy for hepatocellular carcinoma: invasion to adjacent organs and rupture of tumor were crucial tumor-related prognostic factors needed for survival. Dig Surg. 2018;35:155–163. doi:10.1159/000477270
42. Mähringer-Kunz A, Steinle V, Düber C, et al. Extent of portal vein tumour thrombosis in patients with hepatocellular carcinoma: the more, the worse? Liver Int. 2019;39(2):324–331. doi:10.1111/liv.13988
43. Mao M, Wang X, Song Y, et al. Novel prognostic scores based on plasma prothrombin time and fibrinogen levels in patients with AFP-negative hepatocellular carcinoma. Cancer Control. 2020;27(1):107327482091552. doi:10.1177/1073274820915520
 © 2021 The Author(s). This work is published and licensed by Dove Medical Press Limited. The full terms of this license are available at https://www.dovepress.com/terms.php and incorporate the Creative Commons Attribution - Non Commercial (unported, v3.0) License.
By accessing the work you hereby accept the Terms. Non-commercial uses of the work are permitted without any further permission from Dove Medical Press Limited, provided the work is properly attributed. For permission for commercial use of this work, please see paragraphs 4.2 and 5 of our Terms.
© 2021 The Author(s). This work is published and licensed by Dove Medical Press Limited. The full terms of this license are available at https://www.dovepress.com/terms.php and incorporate the Creative Commons Attribution - Non Commercial (unported, v3.0) License.
By accessing the work you hereby accept the Terms. Non-commercial uses of the work are permitted without any further permission from Dove Medical Press Limited, provided the work is properly attributed. For permission for commercial use of this work, please see paragraphs 4.2 and 5 of our Terms.