")
Back to Journals » Cancer Management and Research » Volume 12
A Polyethylene Glycol-Based Method for Enrichment of Extracellular Vesicles from Culture Supernatant of Human Ovarian Cancer Cell Line A2780 and Body Fluids of High-Grade Serous Carcinoma Patients
Authors Jiao R , Sun S, Gao X , Cui R, Cao G , Wei H, Wang S, Zhang Z, Bai H
Received 26 August 2019
Accepted for publication 3 July 2020
Published 24 July 2020 Volume 2020:12 Pages 6291—6301
DOI https://doi.org/10.2147/CMAR.S228288
Checked for plagiarism Yes
Review by Single anonymous peer review
Peer reviewer comments 2
Editor who approved publication: Professor Bilikere Dwarakanath
Ruili Jiao,1,2,* Shipeng Sun,3,* Xiaoqiong Gao,1 Ran Cui,1 Guangming Cao,1 Huali Wei,4 Shuzhen Wang,1 Zhenyu Zhang,1 Huimin Bai1
1Department of Obstetrics and Gynecology, Beijing Chao-Yang Hospital, Capital Medical University, Beijing 100020, People’s Republic of China; 2Department of Obstetrics and Gynecology, Maternal and Child Health Hospital, Beijing, People’s Republic of China; 3Clinical Laboratories, Guang’anmen Hospital, China Academy of Chinese Medical Sciences, Beijing, People’s Republic of China; 4Department of Obstetrics and Gynecology, Emergency General Hospital, Beijing, People’s Republic of China
*These authors contributed equally to this work
Correspondence: Huimin Bai; Zhenyu Zhang Email [email protected]; [email protected]
Objective: This study tried to evaluate whether 8% polyethylene glycol (PEG) 6000 precipitation combined with differential ultracentrifugation (PPDU) was an efficient and practical method for the enrichment and purification of extracellular vesicles (EVs) derived from the culture supernatant of human ovarian cancer cell line A2780 and from body fluids of patients with high-grade serous carcinoma (HGSC).
Methods: PPDU was used to enrich and purify the EVs derived from body fluids of patients with HSGC and cell culture supernatant of subclones of human ovarian cancer cell line A2780 with high/low invasive capacity (named as A-H/A-L, respectively). Transmission electron microscope (TEM) and nanoparticle tracking analysis (NTA) were used to identificate the EVs size and distribution. Western blots (WB) were used to detect the expression of CD9, CD63, Alix and Calnexin. The high-purity EVs derived from the cell culture supernatant of A-H/A-L were detected by the protein profile. Expression of integrins (ITGs) αV, β 1 and β 3 in the EVs derived from body fluids of HGSC patients was also evaluated.
Results: The diameter of EVs was about 30– 260 nm observed under the TEM. Under the NTA identification, the peak size of EVs was ranged from 70 to 159nm. EVs derived from different specimens did not significantly differ in mean size and peak size. Presence of CD9, CD63 and Alix and absence of Calnexin were confirmed in the EVs. The protein concentrations of EVs’ sample extracted from A-H/A-L cell culture supernatant were 0.36μg/μL and 0.20μg/μL, respectively. The total amount of protein obtained from 300ul EVs was 108.02ug and 61.44ug, respectively. Totally, 2397 peptides and 952 proteins were identified by isobaric tags for relative and absolute quantitation (ITRAQ). The expression of ITGαV, β 1, and β 3 in the EVs from plasma and ascites of HGSC patients was significantly higher than the control group (plasma: all P< 0.0001; ascites: P=0.036, 0.001 and 0.004, respectively). The expression level of ITGαV and β 1 in EVs of HGSC’s ascites was significantly higher than that in plasma (P= 0.004, 0.001, respectively). The expression of ITGβ 3 was also slightly elevated in EVs-derived HGSC patients’ ascites (P=0.492).
Conclusion: PPDU was an efficient and practical method to enrich EVs from body fluids and cell culture supernatant. The characteristic expression of ITGαV, β 1 and β 3 in ascites and plasma EVs of patients with HGSC provided useful information on the development of EVs in HGSC.
Keywords: EVs, PEG6000 precipitation, HGSC, body fluids, cell culture supernatant
Introduction
Epithelial ovarian cancer was the most lethal gynecologic malignancy.1 Due to a lack of effective methods for early diagnosis and screening, most patients were diagnosed at an advanced stage, and the five-year survival rate was approximately 30%.2 EVs exist in many body fluids and contain a variety of genetic information from parental cells. EVs participate in the exchange of intercellular information and material.3 Tumor-derived EVs (TDE) were a liquid biopsy tissue and served as important noninvasive tumor biomarkers that could be used in the early diagnosis and treatment of cancer.4
At present, commonly used methods for EV isolation depended on their physical properties, such as their density or size, and their chemical properties, including isolation through interactions of surface proteins of EVs.5,6 Ultracentrifugation (UC) was currently regarded as the gold standard for EV isolation. High-purity exosomes could be obtained, but this method had a low yield and was time-consuming.7–10 Commercial kits had the advantages of quickly obtaining EVs and a high yield, but these methods were associated with low purity and high cost.11 Recently developed immunocapture methods could be used to isolate specific subgroups of EVs, but these methods also had a high cost.12 None of these methods were suitable to handle samples with large volumes. The precipitation method was suitable for a large sample size, and this method was simple, inexpensive and could obtain EVs with a high yield.13 However, the purity was low. To date, simple, high-purity and high-yield technology for EV isolation and extraction was still not available. Several researchers had combined two or more methods to obtain EVs.14,15 Ultrafiltration followed by size exclusion chromatography (UF-SEC) produced a high yield and EV-to-protein purity rate.14 However, the sepharose CL-4B matrix used in this method may impair the differentiation between EVs and high-density lipoprotein (HDL) due to its low size exclusion limit, and therefore this method might not be suitable for isolating EVs derived from plasma.
Integrins (ITGs), which belonged to a large family of cell adhesion receptors, consisted of two transmembrane glycoproteins (α and β subunits). ITGs played a key role in mediating bidirectional transmembrane signals.16,17 ITGαvβ1/αvβ3 could active TGF-β1 through binding to the arginine-glycine-aspartate sequence (Arg-Gly-Asp, RGD) at the carboxyl end of its inactive form. ITGαvβ1/αvβ3 played an important role in promoting cell proliferation and migration and inhibiting cell differentiation and anoikis.18–20
However, controversy existed regarding the relationship between ITGαvβ1/αvβ3 and ovarian cancer. Some studies21–24 had found that high expression of ITGαvβ1 and αvβ3 might be related to the promotion of ovarian cancer. Other scholars25,26 had suggested that ITGαvβ3 might also be a suppressor gene that downregulates the invasive features of ovarian cancer cells.
ITGs were mainly expressed in the cell membrane, with low or no expression in the intercellular fluid.27,28 ITGs might be mediated by EVs through autocrine or paracrine pathways to transmit information between cells.29 However, the role of ITGαvβ1/αvβ3 in the formation of the ovarian cancer microenvironment mediated by EVs has not been reported.
In this study, we used the PPDU method to enrich EVs, which involved low-speed centrifugation, followed by a single small-volume UC purification step. The efficiency and effectiveness of this method in the extraction and enrichment of EVs derived from the culture supernatant of a human ovarian cancer cell line (A2780) and body fluids of patients with high-grade serous carcinoma (HGSC) were evaluated. The potential role of EV-mediated ITGαvβ1/αvβ3 expression in the diagnosis of ovarian cancer was also explored.
Materials and Methods
Cell Culture and the Supernatant Collection
A-H/A-L, a pair of single-cell subclones with distinct invasive/migratory capacities, were isolated and established from the A2780 human ovarian cancer cell line using the limited dilution methodology performed in our previous study.21,30 (A2780 human ovarian cancer cell line was purchased from National Infrastructure of Cell Line Resource). Compared to A-L cells, the A-H cells exhibited significantly more aggressive phenotypes with respect to their biological functions in vitro and tumor formation in vivo. The A-H/A-L cell lines comprise an ideal model of tumor heterogeneity for ovarian cancer. The A-H/A-L cell lines were maintained in RPMI-1640 supplemented with 10% predepleted of EVs fetal bovine serum (FBS). (100,000x g ultracentrifugation of FBS for 18 hours). The cells were seeded in T75 culture flasks (Corning) and incubated in humidified air with 5% CO2 at 37°C. The cell culture supernatant was collected in a sterile bottle, totaling approximately 1000 mL, and stored in a freezer at −80°C until analysis.
Body Fluid Collection
Ten patients diagnosed with HGSC and treated at Beijing Chao-Yang Hospital between March 2017 and March 2018 were included in this study. Ten patients with benign ovarian cysts were included in the control group. All patients provided written informed consent. Tubes containing EDTA (K2EDTA, 10 mL volume, Becton Dickinson) were used for blood sample collection. Fasting plasma samples were collected from donors. A 21-gauge needle was used for venipuncture of an antecubital vein after applying a light tourniquet. The blood collection tubes were gently inverted five times to mix anticoagulants with the blood. Centrifugation was performed within 1 h after venipuncture. The blood was centrifuged at 3000 rpm for 10 minutes at room temperature using a Thermo Scientific™ SL16 tabletop centrifuge. At least 500 μL of platelet-poor plasma (PPP) was left in the tube to minimize the contamination of the cells.31 Approximately 5 mL of supernatant was retained and packed in the EP tube. Two hundred milliliters of ascites or peritoneal lavage fluid was collected from ovarian tumor patients during surgery. Ascites from recurrent HGSC patients were collected during abdominal drainage. Heparin sodium (80 mg) was aseptically injected32 (0.4 mg/mL) to prevent platelet release from EVs caused by coagulation. The above specimens were stored at 4°C until differential separation. Separation was completed within 12 h after collection.
EVs Isolation and Purification
The PPDU process used for EV separation is as follows (Figure 1):
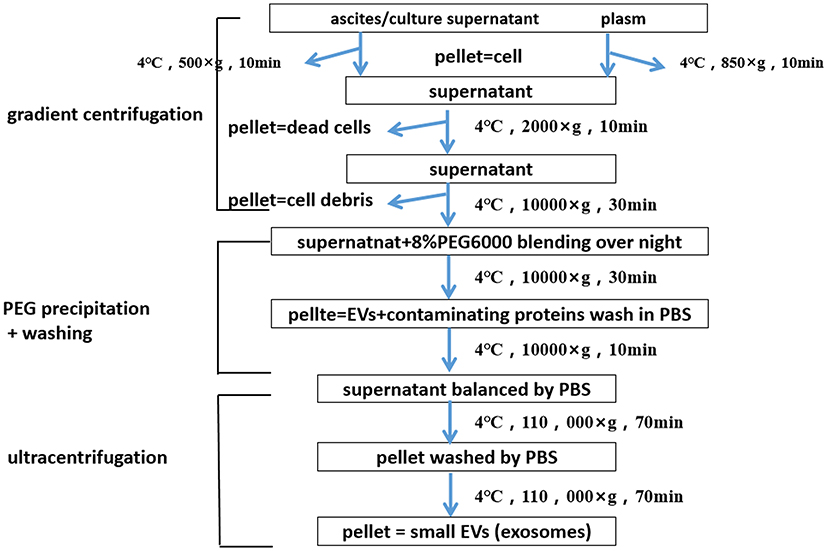 |
Figure 1 Flow chart for the EVs purification procedure based on 8% PEG6000 precipitation combined with differential ultracentrifugation (PPDU). The first stage is differential centrifugation. After each of the first three centrifugations, pellets (cells, dead cells, cell debris) are discarded. The second stage is PEG precipitation. The supernatant of previous procedure is kept for blending well with 8% PEG6000 over night. When washed by PBS, it goes to the next procedure. The third stage is super-centrifugation. In contrast, after the 110,000×g centrifugations, Precipitated pellets (EVs + contaminant proteins+ PEG) are kept, and supernatants are discarded. After PBS was fully mixed again, the vesicle particles containing small EVs were obtained by another round of ultra-centrifugation. Note: All centrifugation steps were conducted at 4°C. |
Conditioned media harvested from A-H/A-L cell cultures and ascites from HGSC patients were first centrifuged for 10 minutes at 500 g. Plasma was centrifuged for 10 min at 850 g to remove cells and larger debris. The supernatant was then transferred to a new tube and centrifuged at 2000 x g for 10 min to remove cell debris and larger vesicles, such as apoptotic bodies. Large microvesicles were depleted by centrifugation at 10,000 x g for 30 min.
The supernatant of the previous procedure was mixed thoroughly with 8% PEG 6000 by inversion and incubated at 4°C overnight (at least 12 h). After the mixture was centrifuged at 10,000 x g for 30 min, the supernatant was discarded, and the precipitate (containing EVs, PEG and proteins) was diluted with 3–10 mL of phosphate-buffered saline (PBS) and fully mixed. The pellet was resuspended in PBS after centrifugation for 10–12 min at 10,000 x g, added to 13.2 mL polypropylene centrifuge tubes (Beckman Coulter, Inc. #331372) and centrifuged at 110,000 x g (average relative centrifugal force) for 70 min in a Beckman LE-80K ultracentrifuge (Beckman Coulter, Inc.). Then, the precipitate was mixed with PBS and centrifuged again at 110,000 x g for 70 minutes. The pellet was resuspended in 300 µL of particle-free PBS followed by shaking on a Vortex Oscillator for 15 min at room temperature until the solution was transparent and free of all aggregates. The protein was quantified by the bicinchoninic acid (BCA) method and stored at −80°C until use. All centrifugation steps were conducted at 4°C.
Identification of EVs
The morphology of EVs was observed by transmission electron microscopy (TEM). Approximately 30 μL of prepared EV solution was loaded onto a 2-mm diameter carbon-coated copper mesh and allowed to adsorb for 10 min before the excess fluid was drained. The samples were fixed with 10 μL of 2.5% glutaraldehyde for 5 min, washed once with distilled water, negatively stained with 1% uranium acetate and dried at room temperature for 20 min. Thereafter, the prepared EVs were observed under a transmission electron microscope (Hitachi, JEM-2100) at 160.0 kV, and images were captured by a digital camera.
Nanoparticle tracking analysis (NTA) was performed to determine particle size and concentration using a Nano Sight NS300 Instrument (Nano Sight, Malvine, UK) configured with a blue (488 nm) laser and a sCMOS camera. Samples (stored at −80°C) were thawed and gently vortexed before further dilution in sterile, particle-free PBS at a ratio of 1:500–1:16,000 to achieve particle concentrations consistent with the optimal analysis range of the software (between 2×10⁸ and 1.8×10⁹ particles per mL).33,34 PBS was tracked before each experiment to ensure that it was particle-free. Samples were manually mixed three times by aspirating and expelling the diluted particle suspension using a 1-mL syringe. Each sample was then injected into the specimen chamber. The camera shutter speed was fixed at 30 frames per second.
Western blots (WBs) were performed to detect the expression of CD9, CD63, and Alix (commonly used EV markers) and Calnexin (a negative EV marker) in EVs. Each assay was performed in triplicate. The images were semi-quantitatively analyzed using Image J software. The primary antibodies are listed in Table S1.
1D SDS-PAGE and In-Gel Digestion and Nano-LC–ESI-MS/MS
The purified EVs (30 μg) derived from the cell culture supernatant of A-H/A-L cells were subjected to 12% 1D SDS-PAGE. After bromophenol blue reached 2–3 cm into the resolving gel, the gel was stained with Coomassie brilliant blue. Each gel slice was destained with 200 μL of 50% acetonitrile (ACN) in 50 mM NH4HCO3, dehydrated with 50 μL of ACN, and dried. In-gel tryptic digestion was carried out overnight at 37°C using a 10 ng/μL solution of sequencing-grade trypsin (Promega, Madison, WI) in 50 mM ammonium bicarbonate, pH 8.0. Tryptic peptides resulting from the digestion were sequentially extracted with 5% formic acid/50% ACN and 0.1% formic acid/75% ACN. The tryptic peptides for each pooled sample were labeled using iTRAQ reagents (Applied Biosystems, Foster City, CA, USA) following the manufacturer’s protocol. The peptides were separated with a Shimadzu LC-20AB HPLC Pump system coupled with a high-pH RP column.
The extracted peptides were resuspended in buffer A (2% ACN and 0.1% formic acid in water) and centrifuged at 20,000 g for 10 min. The supernatant was loaded onto a C18 trap column at a rate of 5 μL/min for 8 min using the autosampler of a LC-20AD nano-HPLC instrument (Shimadzu, Kyoto, Japan).The peptides separated by nanoHPLC were subjected to analysis with the tandem mass spectrometry Q EXACTIVE (Thermo Fisher Scientific, San Jose, CA) instrument for data-dependent acquisition (DDA) detection by nano-electrospray ionization.
Expression of ITGαV, β1, and β3 in the EVs Derived from Body Fluids of HGSC Patients
The expression of ITGαV, β1, and β3 in EVs derived from plasma and ascites from HGSC patients and the control group was evaluated using WBs. The standard sample was an artificial parameter derived from EVs extracted from 10 mL of mixed plasma from 10 healthy controls. This standard sample was also used as an external reference for gel electrophoresis in the sample side lane to reduce exposure errors caused by external factors in gels run at different times. The gray value of each sample (including EVs from plasma and ascites) after exposure and detection was compared with that of the standard sample, and the ratios were statistically analyzed.
The study protocol was approved by the ethics committees of the Affiliated Beijing Chao-Yang Hospital of China, Capital Medical University. This study was performed in accordance with the ethical standards of the responsible committee on human experimentation (institutional and national) and with the Helsinki Declaration of 1975, as revised in 2008.
Statistical Analysis
Descriptive statistics (mean±SD) were used for the assessments of continuous variables, and frequencies or percentages were used for categorical variables. For TEM, NTA, BCA and WB analyses, an independent samples t test or Pearson test was performed for data with a normal distribution, and a Mann–Whitney U-test or Spearman test was performed as a nonparametric test to compare data with a non-normal distribution. P values <0.05 were considered to be statistically significant. All data were statistically analyzed with SPSS software version 22.0.
Results
Clinical and Pathological Characteristics of Patients
The clinical pathological parameters of 10 ovarian cancer patients included in this study are summarized in Table 1. The age of the patients was 55.6±1.93 years. Seven patients had primary cancer, and the remaining 3 patients had recurrent cancer. Patients were staged according to the International Federation of Obstetrics and Gynecology (FIGO) 2013 staging standard.35 Stages I–II and stages III–IV were identified in 4 and 6 cases, respectively. The pathological type was HGSC in all patients. The serum CA125 level was above 35 IU/mL in 8 patients and higher than 1000 IU/mL in 3 patients. Lymph node metastasis was detected in 4 cases.
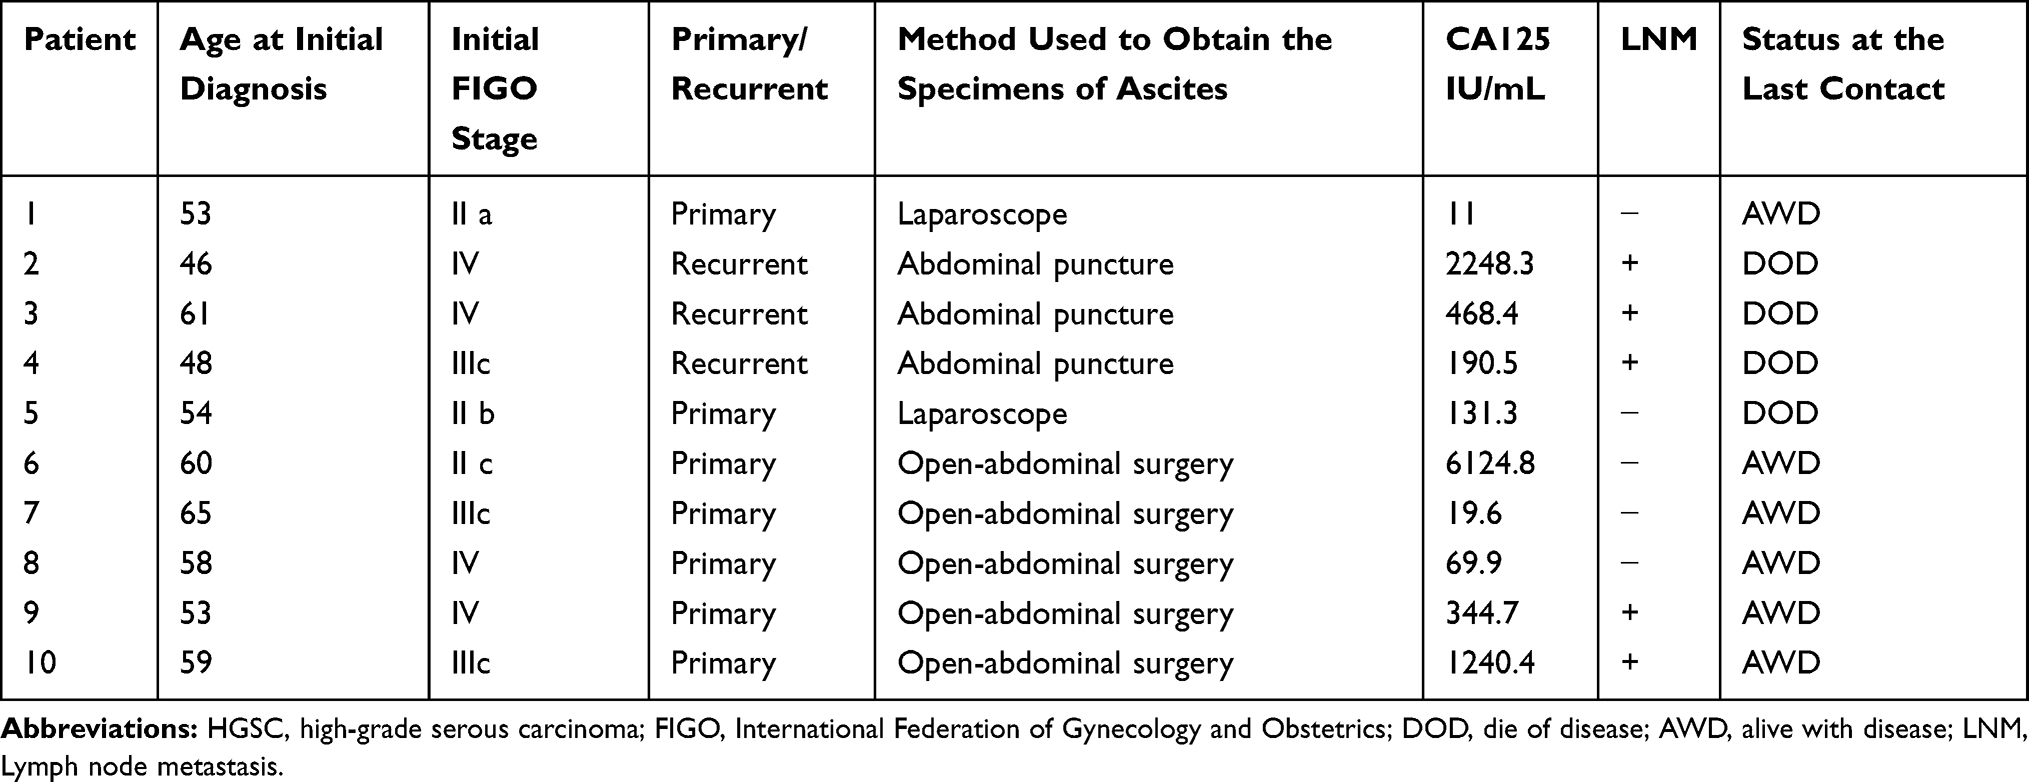 |
Table 1 The Clinicopathological Characteristics of These Patients with HGSC |
EVs Identification
Upon TEM examination, the sizes of the EVs ranged from 30 to 260 nm. The mean sizes of EVs derived from cell culture supernatant and patient plasma and ascites were not statistically different. The typical appearance of the EVs was spherical or cup-shaped, and a clear bilayer plasma membrane structure was observed (Figure 2A).
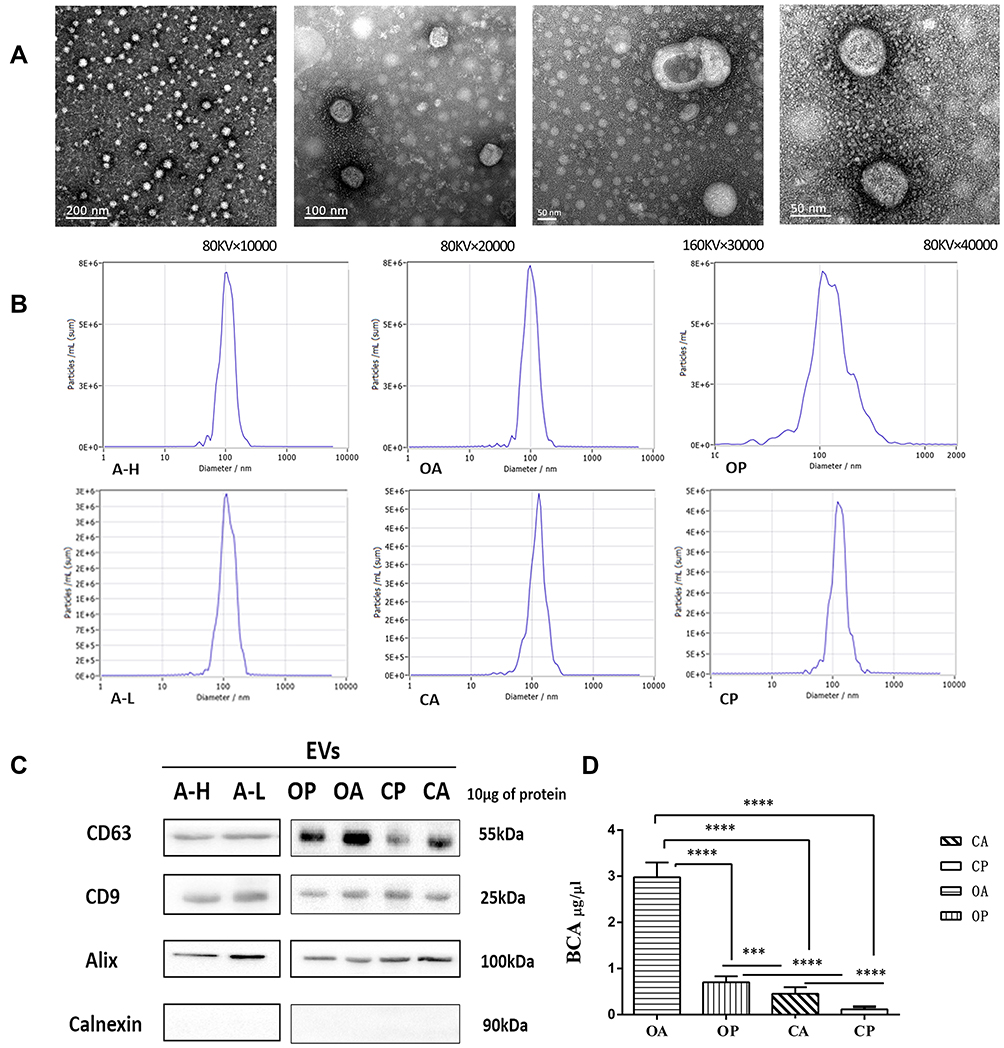 |
Figure 2 (A) TEM images of EVs derived from cell culture supernatant of A-H/A-L and body fluids of HGSC patients and control group. The sizes of the EVs ranged from 30 to 260 nm. The EVs evenly distributed in the field of vision. Structure of bilayer lipid membranes and typical “cup-shape” morphologies. (B) Sizes and size distributions of EVs as analyzed by NTA. EVs of A-H (A2780 Subclones with high invasive capacity) and A-L (A2780 Subclones with low invasive capacity) derived from cell culture supernatant 1000mL respectively; EVs of OA (Ascites of patients with HGSC) and CA (Ascites or peritoneal lavage fluids of control group) derived from patients’ ascites or peritoneal lavage fluids 200mL respectively; EVs of OP (Plasm of patients with HGSC) and CP (Plasm of control group) derived from patients’ plasm 5mL respectively. The mean sizes and peak sizes of EVs derived from different specimens were not significantly different (all P>0.05). (C) Among all the samples of EVs identified by WB, CD9, CD63 and Alix were positively expressed, Calnexin was negatively expressed. (D) Comparison of protein content of EVs from OP/CP/OA/CA by BCA. ***P < 0.001, ****P < 0.0001. |
Under NTA, the peak sizes of EVs from A-H and A-L cells were 107.2±30.9 nm and 114.6±43 nm. The peak sizes of EVs from ascites of HGSC patients (OA), plasma of HGSC patients (OP), ascites or peritoneal lavage fluids from the control group (CA), and plasma of the control group (CP) were 100.1±30.1 nm, 128.6±19.2 nm, 115.2±21.9 nm and 128±19.8 nm, respectively. Similarly, EVs derived from different specimens did not significantly differ in mean size (all P>0.05, Table 2). The mode curve was linear and smooth in the NTA test report (Figure 2B).
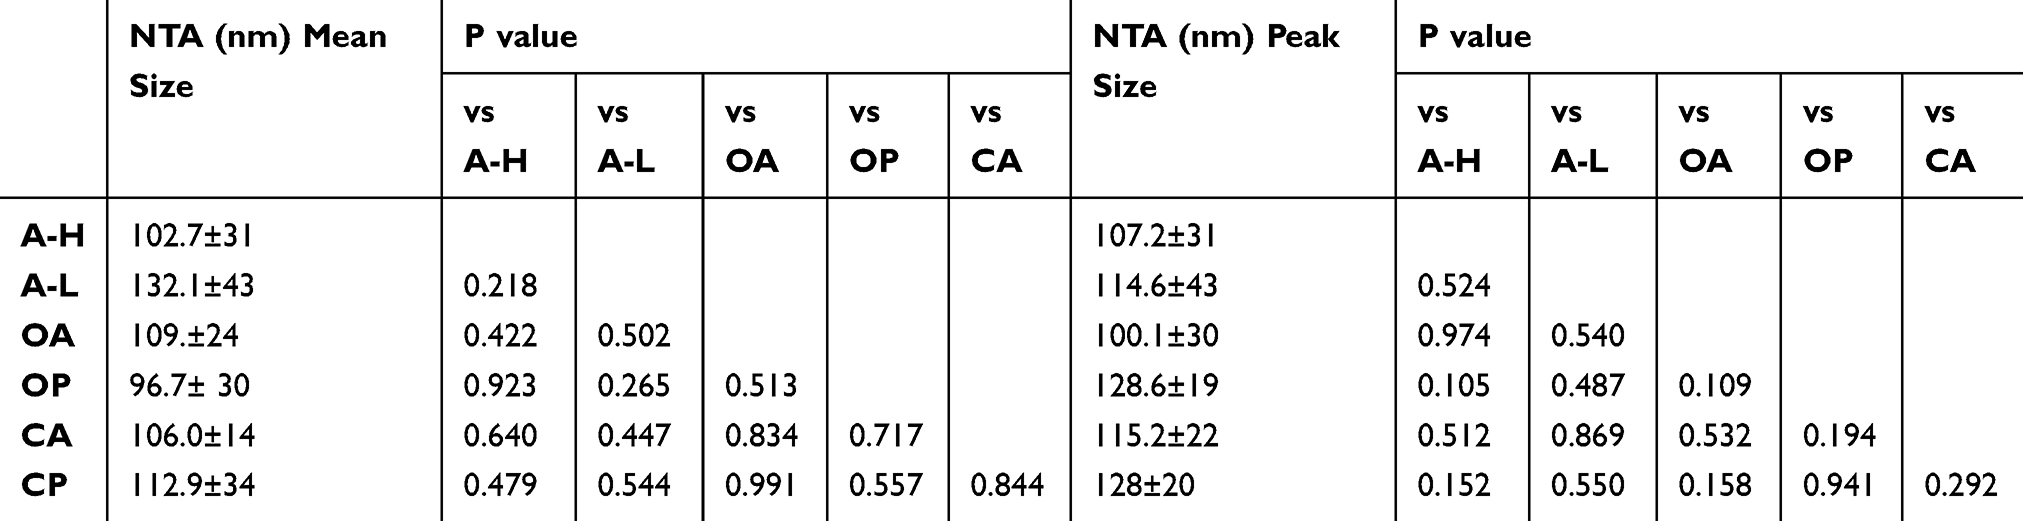 |
Table 2 The P value of Mean Size and Peak Size of EVs Derived from the Culture Supernatant of A-H/A-L and Body Fluids of Patients with HGSC and Control Group by NTA |
The protein content of the EVs from the OA group was 2.9781±0.9616 μg/μL, which was significantly higher than that of the OP, CA, and CP groups (all P<0.0001). The protein content of EVs from ascites was significantly higher than that from plasma (P<0.0001). The protein content of EVs from the OP group was significantly higher than that from the CA and CP groups (P=0.001, P<0.0001). The protein content of EVs from the CA group was significantly higher than that from the Cp group (P<0.0001; Table 3, Figure 2D)
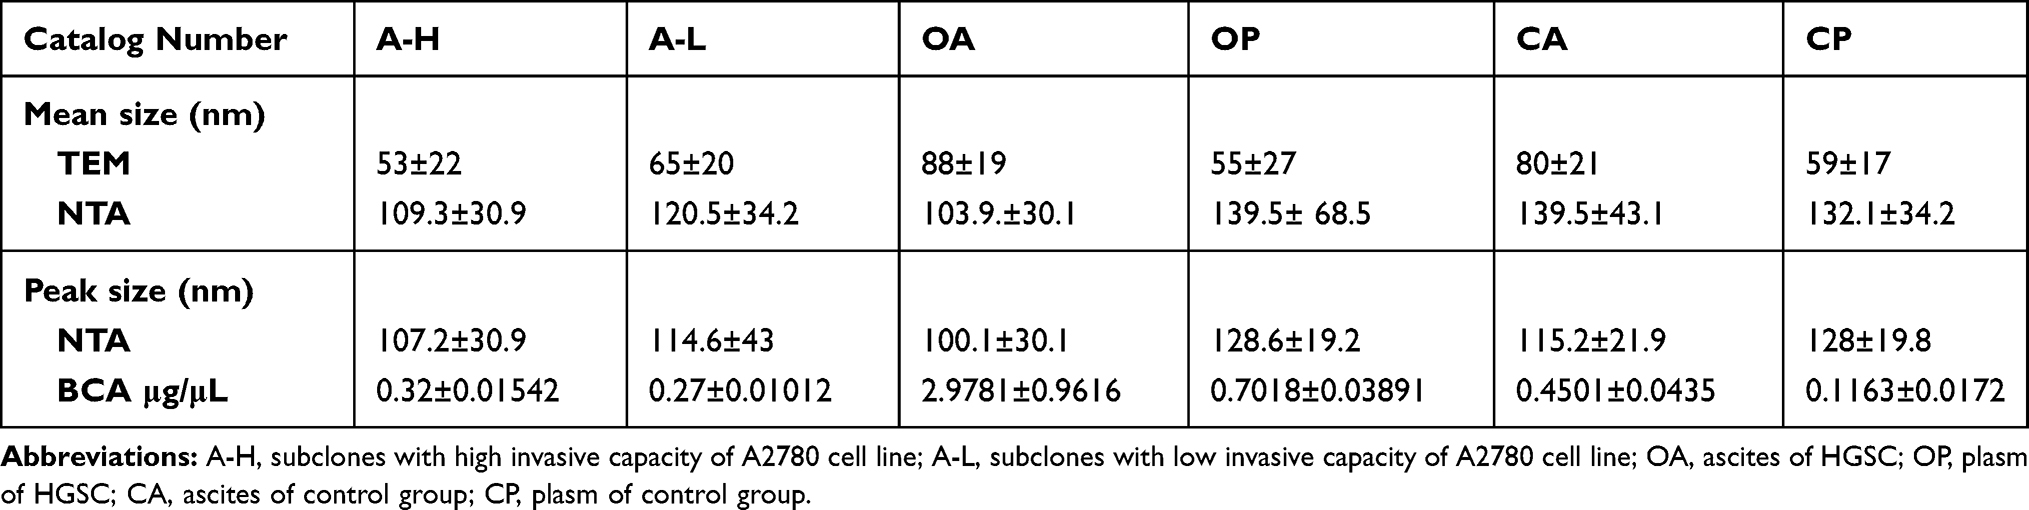 |
Table 3 The Results of Different Identification Methods of EVs Derived from the Culture Supernatant of A-H/A-L and Body Fluids of Patients with HGSC and Control Group |
CD9, CD63 and Alix were positively expressed, and Calnexin was negative by WB analysis for the six types of EVs (Figure 2C).
Quality of EV Proteins Derived from A-H and A-L Cells Detected by Protein Mass Spectrometry
EV samples (300 µL) were separately extracted from 1000 mL of A-H/A-L cell culture supernatant, and the protein concentrations were 0.36 µg/µL and 0.20 µg/µL, respectively. The total protein amounts obtained from 300 μL of EVs were 108.02 µg and 61.44 µg, respectively. To determine the protein profile of A-H/A-L cell-derived EVs, total EV proteins were separated by 1D SDS-PAGE on a 12% gel, which was then sliced into 4 bands. After each band was cut into pieces and subjected to trypsin digestion in 1.5 mL Eppendorf tubes overnight, the extracted peptides were analyzed by nano-LC-MS/MS.
For ITRAQ quantification, two EVs’ samples of A-H and A-L cells were analyzed. In total, 282,333 spectrums were generated, and 2397 peptides and 952 proteins were identified with a 1% false discovery rate (FDR). According to a fold change of ≥1.2 or ≤0.8 and a Q-value <0.05, a total of 831 non-differentially expressed proteins were identified. (Table 4)
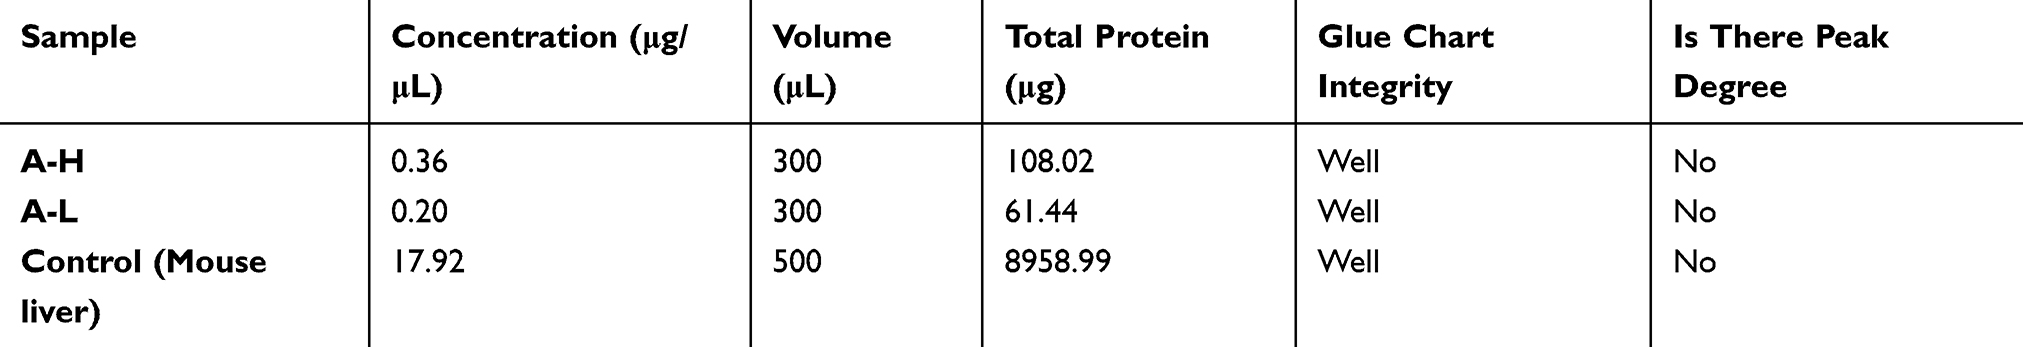 |
Table 4 Quality Evaluation of A-H/A-L EVs Protein by Mass Spectrometry |
Expression of ITGαV, β1, and β3 in EVs Derived from Body Fluids of HGSC Patients
The expression of ITGαV, β1 and β3 in the EVs of plasma and ascites from patients with HGSC was significantly upregulated compared to the control group (plasma: P<0.0001, <0.0001, and <0.0001; ascites: P=0.036, 0.001 and 0.004, respectively; Figure 3A–F). In addition, the expression of ITGαV and β1 in EVs derived from ascites from HGSC patients was significantly higher than that in EVs derived from plasma (P=0.004, <0.001, respectively; Figure 3G and H). The expression of ITGβ3 was also slightly elevated in EVs-derived ascites of HGSC patients. (P=0.492; Figure 3I).
 |
Figure 3 ITGαV, ITGβ1 and ITGβ3 were positively expressed in WB of EVs derived from A-H/A-L/OA/OP/CA/CP. The expression of ITGαV, ITGβ1 and ITGβ3 in the EVs of plasma and ascites from patients with HGSC was significantly upregulated, compared to the control group (A–F). In addition, the expression of ITGαV and ITGβ1 in EVs derived from HGSC patients’ ascites was significantly higher than that derived from plasma (G and H).There was no significant difference in the expression of ITGβ3 in ascites and plasma of HGSC patients (I). **P < 0.01; ****P < 0.0001. |
Discussion
Pan36 and Harding37 first reported vesicles in sheep reticulocytes and rat reticulocytes in 1983. EVs are considered to restore the dynamic and steady-state conditions of cells by discarding excessive or harmful molecules.38 In recent years, EVs have been shown to exhibit a variety of biological functions through intercellular communication, the endosomal membrane, the endocytosis pathway or ligand receptor interactions,39,40 such as inflammation,41 immunoregulation,42 tissue regeneration,43 aging and cancer-related functions.44
In this study, the PPDU method was used to enrich and purify EVs derived from the supernatant of A-H and A-L cell lines and the plasma and ascites of HGSC patients. Typical EVs structures, such as round, cup-shaped and direct double-layer plasma membrane nanoparticles, were observed by TEM. The mean size of the EVs in samples uniformly ranged from 31 to 85 nm. The visual background was clear with few impurities according to TEM observation. The NTA results showed that the peak particle diameter of samples ranged from 76 nm to 171 nm. Some researchers45,46 have suggested that cup-shaped EVs are artifacts of the fixation step of the negative staining technique. NTA does not involve the use of fixatives, which allowed the studied vesicles to retain their natural shape. Therefore, the average particle size evaluated by NTA was larger than that evaluated by TEM, which is consistent with our findings in this analysis.
EVs were assessed for three classical EV protein markers47 (CD63, CD9, and Alix) and one non-EV marker (calnexin) to demonstrate EV purity. Calnexin48,49 is a protein that is associated with the endoplasmic reticulum and can be released by cells suffering mechanical damage (ie, during tissue preparation). All EV samples, including EVs isolated from HGSC patients and the control group as well as EVs derived from cell culture supernatant, were positive for CD63, CD9 and Alix, indicating the presence of EV proteins. Furthermore, all of the samples were negative for calnexin.
The protein concentrations of samples extracted from A-H/A-L cell culture supernatant were 0.36 μg/μL and 0.20 μg/μL, respectively. The total amounts of EV protein obtained were 108.02 μg and 61.44 μg, respectively. A total of 952 proteins were identified by ITRAQ quantification. The high overlap of proteins between EVs from A-H and A-L cell lines suggested that a satisfactory concentration and purity of EV protein can be obtained by PPDU. A satisfactory protein concentration can also be obtained with the PPDU method when isolating and purifying EVs from the body fluid of HGSC patients. These data suggested that PPDU was a reproducible and practical method for EV isolation.
High levels of EVs were found in the body fluids of patients with ovarian cancer.50,51 Andrel52 and Peng53 detected the signal of Her2/neu and CA125 signals on the surface of EVs from ovarian cancer patients by WB and Immunoelectron-microscopy. ITGs may transfer information between cells by means of autocrine or paracrine EVs secretion.54 ITGαVβ3 was significantly upregulated in serum-derived EVs of prostate cancer patients.55 ITGαVβ3 could act on β3-negative receptor cells in a paracrine manner.
The expression of ITGβ1/β3 in ovarian cancer is still controversial. ITGβ21,22 and ITGβ323,24 were highly expressed in ovarian cancer tissues. These data indicated that upregulation of ITGαVβ1/αVβ3 increased the risk of ovarian cancer. However, Chen et al25 demonstrated that ITGαVβ3 levels were low in the highly invasive cell subpopulation of ovarian cancer, with decreased expression of E-cadherin. The authors’ explanation for this paradox was the tumor heterogeneity of ovarian cancer. In this analysis, the expression of ITGαVβ1/αVβ3 in EVs derived from plasma and ascites of HGSC patients was significantly higher than that of the control group. In addition, the expression of ITGαVβ1/αVβ3 tends to be increased in ascites compared to the plasma of patients. The specific molecular mechanism of ITGαVβ1/αVβ3 in the development of ovarian cancer necessitates further evaluation.
Conclusion
PPDU was an efficient and practical method to enrich EVs from body fluids and cell culture supernatant. The characteristic expression of ITGαV, β1 and β3 in ascites and plasma EVs of patients with HGSC provided useful information on the development of EVs in HGSC.
Acknowledgments
This work was sponsored by the National Natural Science Foundation of China (No. 81972424), Beijing Municipal Administration of Hospitals Clinical medicine Development of special funding-YangFan Project (grant No. ZYLX201713) and the National Natural Science Foundation of China (No. 81403192 and National Clinical Research Base of Traditional Chinese Medicine and Institute Level Scientific Research). We thank XueYun Hou and HongLei Ye (Clinical Laboratories, Guang’anmen Hospital, China Academy of Chinese Medical Sciences) for technical help.
Disclosure
The authors declare no conflict of interest for this article.
References
1. Siegel RL, Miller KD, Jemal A. Cancer statistics, 2015. CA Cancer J Clin. 2015;65(1):5–29. doi:10.3322/caac.21254
2. Alizadeh AA, Aranda V, Bardelli A, et al. Toward understanding and exploiting tumor heterogeneity. Nat Med. 2015;21(8):846–853. doi:10.1038/nm.3915
3. Rayamajhi S, Nguyen TDT, Marasini R, et al. Macrophage-derived exosome-mimetic hybrid vesicles for tumor targeted drug delivery. Acta Biomater. 2019;94:482–494. doi:10.1016/j.actbio.2019.05.054
4. Zhang P, Zhou X, He M, et al. Ultrasensitive detection of circulating exosomes with a 3D-nanopatterned microfluidic chip. Nat Biomed Eng. 2019;3(6):438–451. doi:10.1038/s41551-019-0356-9
5. Szatanek R, Baran J, Siedlar M, et al. Isolation of extracellular vesicles: determining the correct approach (Review). Int J Mol Med. 2015;36(1):11–17. doi:10.3892/ijmm.2015.2194
6. Li J, He X, Deng Y, et al. An update on isolation methods for proteomic studies of extracellular vesicles in biofluids. Molecules. 2019;24(19). doi:10.3390/molecules24193516
7. Huang T, Banizs AB, Shi W, et al. Size exclusion HPLC detection of small-size impurities as a complementary means for quality analysis of extracellular vesicles. J Circ Biomark. 2015;4:6. doi:10.5772/61148
8. An M, Wu J, Zhu J, et al. Comparison of an optimized ultracentrifugation method versus size-exclusion chromatography for isolation of exosomes from human serum. J Proteome Res. 2018;17(10):3599–3605. doi:10.1021/acs.jproteome.8b00479
9. Théry C, Amigorena S, Raposo G, et al. Isolation and characterization of exosomes from cell culture supernatants and biological fluids. Curr Protoc Cell Biol. 2006;30(1):3–22.
10. Taylor DD, Shah S. Methods of isolating extracellular vesicles impact down-stream analyses of their cargoes. Methods. 2015;87:3–10. doi:10.1016/j.ymeth.2015.02.019
11. Helwa I, Cai J, Drewry MD, et al. A comparative study of serum exosome isolation using differential ultracentrifugation and three commercial reagents. PLoS One. 2017;12(1):e0170628. doi:10.1371/journal.pone.0170628
12. Klingeborn M, Skiba NP, Stamer WD, et al. Isolation of retinal exosome biomarkers from blood by targeted immunocapture. Adv Exp Med Biol. 2019;1185:21–25. doi:10.1007/978-3-030-27378-1_4
13. Joncas FH, Lucien F, Rouleau M, et al. Plasma extracellular vesicles as phenotypic biomarkers in prostate cancer patients. Prostate. 2019;79(15):1767–1776. doi:10.1002/pros.23901
14. Benedikter BJ, Bouwman FG, Vajen T, et al. Ultrafiltration combined with size exclusion chromatography efficiently isolates extracellular vesicles from cell culture media for compositional and functional studies. Sci Rep. 2017;7(1):15297.
15. Koh YQ, Almughlliq FB, Vaswani K, et al. Exosome enrichment by ultracentrifugation and size exclusion chromatography. Front Biosci. 2018;23:865–874.
16. Sun Z, Guo SS, Fässler R. Integrin-mediated mechanotransduction. J Cell Biol. 2016;215(4):445–456. doi:10.1083/jcb.201609037
17. Horton ER, Byron A, Askari JA, et al. Definition of a consensus integrin adhesome and its dynamics during adhesion complex assembly and disassembly. Nat Cell Biol. 2015;17(12):1577–1587.
18. Yang D, Tang Y, Fu H, et al. Integrin β1 promotes gemcitabine resistance in pancreatic cancer through Cdc42 activation of PI3K p110β signaling. Biochem Biophys Res Commun. 2018;505(1):215–221.
19. Kobayashi M, Sawada K, Kimura T. Potential of integrin inhibitors for treating ovarian cancer: a literature review. Cancers. 2017;9(7):83.
20. Zhang Y, Wu Z, Yu H, et al. Chinese Herbal Medicine Wenxia Changfu formula reverses cell adhesion-mediated drug resistance via the integrin β1-PI3K-AKT pathway in lung cancer. J Cancer. 2019;10(2):293–304.
21. Bai H, Li H, Li W, et al. The PI3K/AKT/mTOR pathway is a potential predictor of distinct invasive and migratory capacities in human ovarian cancer cell lines. Oncotarget. 2015;6(28):25520–25532.
22. Wang X, Ivan M, Hawkins SM. The role of MicroRNA molecules and MicroRNA-regulating machinery in the pathogenesis and progression of epithelial ovarian cancer. Gynecol Oncol. 2017;147(2):481–487. doi:10.1016/j.ygyno.2017.08.027
23. Dai X, Chen C, Yang Q, et al. Exosomal circRNA_100284 from arsenite-transformed cells, via microRNA-217 regulation of EZH2, is involved in the malignant transformation of human hepatic cells by accelerating the cell cycle and promoting cell proliferation. Cell Death Dis. 2018;9(5):454.
24. Xiong DD, Dang YW, Lin P, et al. A circRNA-miRNA-mRNA network identification for exploring underlying pathogenesis and therapy strategy of hepatocellular carcinoma. J Transl Med. 2018;16(1):220.
25. Chen J, Zhang J, Zhao Y, et al. Integrin beta3 down-regulates invasive features of ovarian cancer cells in SKOV3 cell subclones. J Cancer Res Clin Oncol. 2009;135(7):909–917.
26. Partheen K, Levan K, Osterberg L, et al. External validation suggests Integrin beta 3 as prognostic biomarker in serous ovarian adenocarcinomas. BMC Cancer. 2009;9:336.
27. Chen CH, Shyu MK, Wang SW, et al. MUC20 promotes aggressive phenotypes of epithelial ovarian cancer cells via activation of the integrin β1 pathway. Gynecol Oncol. 2016;140(1):131–137.
28. Watanabe T, Hashimoto T, Sugino T, et al. Production of IL1-beta by ovarian cancer cells induces mesothelial cell beta1-integrin expression facilitating peritoneal dissemination. J Ovarian Res. 2012;5(1):7.
29. Kenny HA, Nieman KM, Mitra AK, et al. The first line of intra-abdominal metastatic attack: breaching the mesothelial cell layer. Cancer Discov. 2011;1(2):100–102.
30. Cui R, Cao G, Bai H, et al. LPAR1 regulates the development of intratumoral heterogeneity in ovarian serous cystadenocarcinoma by activating the PI3K/AKT signaling pathway. Cancer Cell Int. 2019;19:201. doi:10.1186/s12935-019-0920-0
31. György B, Pálóczi K, Kovács A, et al. Improved circulating microparticle analysis in acid-citrate dextrose (ACD) anticoagulant tube. Thromb Res. 2014;133(2):285–292. doi:10.1016/j.thromres.2013.11.010
32. Manandhar S, Park J, Kothandan VK, et al. Properties of heparinoids premixed with tumor-derived extracellular vesicles. Bioconjug Chem. 2018;29(11):3757–3767. doi:10.1021/acs.bioconjchem.8b00637
33. Rider MA, Hurwitz SN, Meckes DG. ExtraPEG: a polyethylene glycol-based method for enrichment of extracellular vesicles. Sci Rep. 2016;6:23978. doi:10.1038/srep23978
34. Soo CY, Song Y, Zheng Y, et al. Nanoparticle tracking analysis monitors microvesicle and exosome secretion from immune cells. Immunology. 2012;136(2):192–197.
35. Montavon Sartorius C, Mirza U, Schötzau A, et al. Impact of the new FIGO 2013 classification on prognosis of stage I epithelial ovarian cancers. Cancer Manag Res. 2018;10:4709–4718. doi:10.2147/cmar.s174777
36. Pan BT, Johnstone RM. Fate of the transferrin receptor during maturation of sheep reticulocytes in vitro: selective externalization of the receptor. Cell. 1983;33(3):967–978. doi:10.1016/0092-8674(83)90040-5
37. Harding C, Heuser J, Stahl P. Receptor-mediated endocytosis of transferrin and recycling of the transferrin receptor in rat reticulocytes. J Cell Biol. 1983;97(2):329–339. doi:10.1083/jcb.97.2.329
38. Takahashi A, Okada R, Nagao K, et al. Exosomes maintain cellular homeostasis by excreting harmful DNA from cells. Nat Commun. 2017;8:15287.
39. Montecalvo A, Larregina AT, Shufesky WJ, et al. Mechanism of transfer of functional microRNAs between mouse dendritic cells via exosomes. Blood. 2012;119(3):756–766.
40. Costa Verdera H, Gitz-Francois JJ, Schiffelers RM, et al. Cellular uptake of extracellular vesicles is mediated by clathrin-independent endocytosis and macropinocytosis. J Control Release. 2017;266:100–108.
41. Shefler I, Salamon P, Levi-Schaffer F, et al. MicroRNA-4443 regulates mast cell activation by T cell-derived microvesicles. J Allergy Clin Immunol. 2018;141(6):2132–2141.e2134.
42. Kumar B, Garcia M, Weng L, et al. Acute myeloid leukemia transforms the bone marrow niche into a leukemia-permissive microenvironment through exosome secretion. Leukemia. 2018;32(3):575–587.
43. Tassew NG, Charish J, Shabanzadeh AP, et al. Exosomes mediate mobilization of autocrine Wnt10b to promote axonal regeneration in the injured CNS. Cell Rep. 2017;20(1):99–111.
44. Zhang Y, Kim MS, Jia B, et al. Hypothalamic stem cells control ageing speed partly through exosomal miRNAs. Nature. 2017;548(7665):52–57.
45. Arraud N, Linares R, Tan S, et al. Extracellular vesicles from blood plasma: determination of their morphology, size, phenotype and concentration. J Thromb Haemost. 2014;12(5):614–627.
46. Nolan JP. Flow cytometry of extracellular vesicles: potential, pitfalls, and prospects. Curr Protoc Cytom. 2015;73:
47. Chen IH, Xue L, Hsu CC, et al. Phosphoproteins in extracellular vesicles as candidate markers for breast cancer. Proc Natl Acad Sci. 2017;114(12):3175–3180.
48. Melo SA, Luecke LB, Kahlert C, et al. Glypican-1 identifies cancer exosomes and detects early pancreatic cancer. Nature. 2015;523(7559):177–182.
49. Li W, Li C, Zhou T, et al. Role of exosomal proteins in cancer diagnosis. Mol Cancer. 2017;16(1):145. doi:10.1186/s12943-017-0706-8
50. Szajnik M, Derbis M, Lach M, et al. Exosomes in plasma of patients with ovarian carcinoma: potential biomarkers of tumor progression and response to therapy. Obstet Gynecol. 2013:3.
51. Taylor DD, Gercel-Taylor C. MicroRNA signatures of tumor-derived exosomes as diagnostic biomarkers of ovarian cancer. Gynecol Oncol. 2008;110(1):13–21. doi:10.1016/j.ygyno.2008.04.033
52. Andre F, Schartz NE, Movassagh M, et al. Malignant effusions and immunogenic tumour-derived exosomes. Lancet. 2002;360(9329):295–305. doi:10.1016/s0140-6736(02)09552-1
53. Peng P, Yan Y, Keng S. Exosomes in the ascites of ovarian cancer patients: origin and effects on anti-tumor immunity. Oncol Rep. 2011;25(3):749–762. doi:10.3892/or.2010.1119
54. Paolillo M, Schinelli S. Integrins and exosomes, a dangerous liaison in cancer progression. Cancers. 2017;9(8):95.
55. Krishn SR, Singh A, Bowler N, et al. Prostate cancer sheds the αvβ3 integrin in vivo through exosomes. Matrix Biol. 2019;77:41–57.
 © 2020 The Author(s). This work is published and licensed by Dove Medical Press Limited. The full terms of this license are available at https://www.dovepress.com/terms.php and incorporate the Creative Commons Attribution - Non Commercial (unported, v3.0) License.
By accessing the work you hereby accept the Terms. Non-commercial uses of the work are permitted without any further permission from Dove Medical Press Limited, provided the work is properly attributed. For permission for commercial use of this work, please see paragraphs 4.2 and 5 of our Terms.
© 2020 The Author(s). This work is published and licensed by Dove Medical Press Limited. The full terms of this license are available at https://www.dovepress.com/terms.php and incorporate the Creative Commons Attribution - Non Commercial (unported, v3.0) License.
By accessing the work you hereby accept the Terms. Non-commercial uses of the work are permitted without any further permission from Dove Medical Press Limited, provided the work is properly attributed. For permission for commercial use of this work, please see paragraphs 4.2 and 5 of our Terms.