")
Back to Journals » Cancer Management and Research » Volume 12
A PI-RADS-Based New Nomogram for Predicting Clinically Significant Prostate Cancer: A Cohort Study
Authors Zhang Y, Zhu G, Zhao W, Wei C, Chen T, Ma Q, Zhang Y, Xue B, Shen J
Received 20 February 2020
Accepted for publication 5 May 2020
Published 19 May 2020 Volume 2020:12 Pages 3631—3641
DOI https://doi.org/10.2147/CMAR.S250633
Checked for plagiarism Yes
Review by Single anonymous peer review
Peer reviewer comments 2
Editor who approved publication: Dr Chien-Feng Li
Yueyue Zhang,1,2,* Guiqi Zhu,3,* Wenlu Zhao,1 Chaogang Wei,1 Tong Chen,1 Qi Ma,4 Yongsheng Zhang,5 Boxin Xue,6 Junkang Shen1,2
1Department of Radiology, The Second Affiliated Hospital of Soochow University, Suzhou, Jiangsu 215004, People’s Republic of China; 2Department of Radiotherapy Institute, The Second Affiliated Hospital of Soochow University, Suzhou, Jiangsu 215004, People’s Republic of China; 3Liver Cancer Institute, Zhongshan Hospital, Fudan University, Shanghai 200032, People’s Republic of China; 4Department of Ultrasound, The Second Affiliated Hospital of Soochow University, Suzhou, Jiangsu 215004, People’s Republic of China; 5Department of Pathology, The Second Affiliated Hospital of Soochow University, Suzhou, Jiangsu 215004, People’s Republic of China; 6Department of Urology, The Second Affiliated Hospital of Soochow University, Suzhou, Jiangsu 215004, People’s Republic of China
*These authors contributed equally to this work
Correspondence: Junkang Shen Tel +86-512-67783842
Email [email protected]
Purpose: To develop and validate a PI-RADS-based nomogram for predicting the probability of clinically significant prostate cancer (csPCa) at initial prostate biopsy.
Patients and Methods: From February 2015 to October 2018, 573 consecutive patients made up the development cohort (DC), and another 253 patients were included as an independent validation cohort (VC). Univariate and multivariate analysis were used for determining the dependent clinical risk factors for csPCa. Prediction model1 was constructed by integrating independent clinical risk factors. Then added the PI-RADS score to model1 to develop the prediction model2 and present it in the form of a nomogram. The performance of the nomogram was assessed by receiver operating characteristic curve, net reclassification improvement analysis, calibration curve, and decision curve.
Results: All clinical candidate factors were significantly different between csPCa and non-csPCa in both the DC and VC. Age, PSA density (PSAD), and free-to-total PSA ratio (f/t) were ultimately determined as dependent clinical risk factors for csPCa and integrated into prediction model1. Then, prediction model2 was developed and presented in a nomogram. In the DC, the nomogram (AUC=0.894) was superior to model1, PI-RADS score, or other clinical factors alone in detecting csPCa. Similar result (AUC=0.891) was obtained in the VC. NRI analysis showed that the nomogram improved the classification of patients significantly compared with model1. Furthermore, the nomogram showed favorable calibration and great clinical usefulness.
Conclusion: This study developed and validated a nomogram that integrates PI-RADS score with other independent clinical risk factors to facilitate prebiopsy individualized prediction in high-risk patients with csPCa.
Keywords: prostate imaging reporting and data system, nomogram, clinically significant prostate cancer, cohort study
Introduction
Prostate cancer (PCa) ranks as the second most common malignant tumor and the fifth leading cause of cancer-related death in men all over the world,1 which seriously threatens the health of older men. Therefore, early and accurate detection of clinically significant lesions requiring intervention is extremely important for individual prognosis.
Although prostate-specific antigen (PSA) is an indicator that has been widely used to select men for prostate biopsy, overdiagnosis and subsequent overtreatment have always been an inevitable problem. In an aim to improve the sensitivity and specificity of PCa diagnosis, other PSA-derived markers, including free PSA (fPSA), free-to-total PSA ratio (f/t), PSA density (PSAD), PSA velocity, etc., have been proposed.2,3 Although many studies have shown that these indicators improved the accuracy of PCa detection, they are suboptimal and insufficient for early and accurate PCa detection.4
Multiparametric MRI (mpMRI) has the advantages of being noninvasive and non-radiation, with high-resolution and simultaneous functional imaging, and it has been recognized as the preferred strategy for PCa detection. In 2015, the Prostate Imaging Reporting and Data System version 2.0 (PI-RADS v2) was promulgated, which aims to provide criterion for interpreting mpMRI and to set up standardized report to detect clinically significant PCa (csPCa) accurately.5 Since the publication of PI-RADS v2, many studies have validated its high accuracy and reproducibility in diagnosing csPCa.6–9 However, the PI-RADS v2 scoring criterion is only based on visual assessment about the findings of mpMRI and does not involve other clinical information of patient.5
In order to better evaluate the individual risk of PCa, several PCa risk calculating models have been developed and validated, such as the Prostate Cancer Prevention Trial Risk Calculator (PCPT-RC), the European Randomized Study for Screening of Prostate Cancer Risk Calculator (ERSPC-RC) and the Chinese Prostate Cancer Consortium Risk Calculator (CPCC-RC),10–12 all of which including multiple clinical factors and have a good performance in predicting the risk of PCa; however, none of them take the prostatic mpMRI into account.
Nomogram is a widely used predictive tool that simplifies the statistical prediction models of clinical events into simple pictorial representations and can be tailored to patient’s profile.13,14 A user-friendly graphical interface motivates the use of nomogram for clinical decision-making. Therefore, the primary objective of this study was to develop and validate a nomogram for detecting csPCa that incorporated the PI-RADS score and other classical clinical risk factors, so as to assist in clinical decision-making.
Patients and Methods
Patient Population
This retrospective study was authorized by the institutional review board at the Second Affiliated Hospital of Soochow University and waived the requirement for the written informed consent for all patients because this study only retrospectively extracted the patient’s data without any intervention, which will not have any impact on the patient’s outcome. All patient data were maintained with confidentiality and compliance with the Declaration of Helsinki. Between February 2015 and October 2018, a total of 2,570 consecutive patients with elevated PSA levels (>4 ng/mL), abnormal digital rectal examination (DRE), or urinary symptoms went to our department for prostatic mpMRI examination. Patients recruited from February 2015 to October 2017 were included in a development cohort (DC) and those from November 2017 to October 2018 were put into a validation cohort (VC). A flowchart detailing the recruitment is shown in Figure 1.
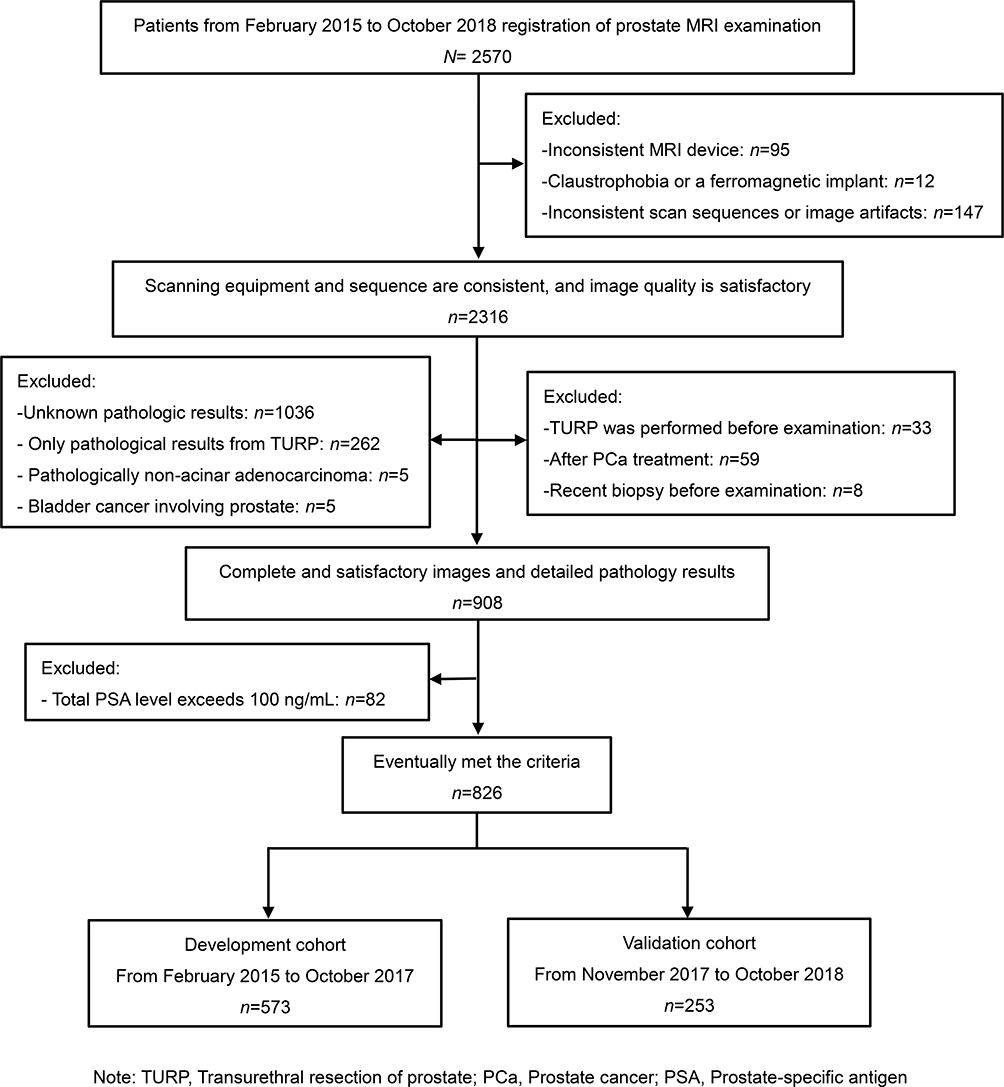 |
Figure 1 Flow diagram outlining patient selection. Abbreviations: TURP, transurethral resection of the prostate; PCa, prostate cancer; PSA, prostate-specific antigen. |
MRI Protocols and Imaging Interpretation
All patients underwent prostatic mpMRI examination using a 3.0 T MRI scanner (Ingenia; Philips Healthcare, Best, the Netherlands). MRI protocols including T1-weighted and T2-weighted imaging, multi-b values diffusion-weighted imaging, and dynamic contrast-enhanced MR imaging. The imaging parameters of each scanning sequence are shown in Supplementary Information(SI 1), which were set according to PI-RADS v2.5
Two relatively experienced urogenital radiologists, who were blinded to patients’ clinical information, retrospectively and independently interpreted prostatic mpMRI according to PI-RADS v2 guidelines.5 If a suspicious lesion was found, both the location and PI-RADS score would be recorded. Any disagreement on the interpreted results between the two radiologists was resolved by a third senior urogenital radiologist. If multiple lesions were present, the PI-RADS score would be assigned to the lesion with the largest size or the most malignant feature (i.e., extraprostatic extension). The MRI-measured prostate volume (PV) is calculated according to the ellipsoid volume formula (SI 2). PSAD is obtained by dividing total PSA (tPSA) by PV.
Histopathology Acquisition
The prostate biopsies were performed by an ultrasound physician with the aid of transrectal ultrasound (TRUS). All patients underwent a systematic biopsy, from which ten cores were biopsied from base to apex (six in the peripheral zone and four in the transitional zone). MRI-TRUS fusion biopsy with 2–3 cores was specifically applied to lesions of highly suspected PCa on mpMRI. Some patients underwent radical prostatectomy, which were confirmed to be PCa by biopsy and recommended for radical prostatectomy according to the National Comprehensive Cancer Network (NCCN) guidelines.15 An experienced uropathologist reviewed all the pathological sections. All PCa lesions were assigned Gleason scores (GS) according to the 2005 International Society of Urogenital Pathology (ISUP) guidelines.16 For this study, csPCa was defined as GS ≥ 3+4, and/or a volume ≥ 0.5 cm3 (diameter ≥ 10 mm), and/or extraprostatic extension, which is in accordance with PI-RADS v2 guidelines.5
Statistical Analysis
The categorical variables were presented as frequency (percentage), and continuous variables were displayed as  or median (interquartile range), as appropriate. The Shapiro–Wilk test and Levene’s test were used for testing the normality and homoscedasticity of the variables, respectively. The Chi-squared test was used to identify the difference in the prevalence of csPCa between the DC and VC. Independent sample t-tests or Mann–Whitney U-tests were applied where appropriate to determine significant differences in all variables between the DC and VC, as well as between csPCa and non-csPCa groups in the two cohorts.
In the DC, multivariate regression analysis, including the classical clinical candidate factors (age, tPSA, fPSA, PV, f/t, and PSAD), was used to determine independent clinical predictors for csPCa. Odds ratio and 95% confidence interval (CI) were determined. Binary logistic regression was applied to combine independent clinical factors to construct traditional prediction model1; then, a new prediction model2 was developed by adding PI-RADS score to model1. The nomogram for evaluating the incidence rate of csPCa was then built based on model2.
Receiver operating characteristic (ROC) curve analysis was performed on different variables and models in the DC and VC, and the area under the ROC curve (AUC) was used for evaluating the performance in discriminating patients with or without csPCa. Performance differences were evaluated via pairwise comparisons of AUC, using the method developed by DeLong et al.17 Net reclassification improvement (NRI) analysis was introduced as a complementary method to ROC analysis by Pencina et al.18 Therefore, NRI was also calculated to evaluate whether the nomogram of PI-RADS-based model2 could improve patient classification.
Furthermore, the calibration curves were depicted in the DC and VC to estimate the agreement between the estimated risk of nomogram and the actual risk about csPCa. The Hosmer–Lemeshow goodness-of-fit test was also performed to judge the fitting quality of the nomogram, and a result of P> 0.05 indicated well calibrated.
In addition, the clinical utility of the nomogram was further evaluated in the VC by decision curve analysis, which was described by Vickers and Elkin.19 The net benefits of a series of different threshold probabilities (Pt) are quantified into an equation (SI 3). Where Pt is the probability at which the effect of a false-positive intervention is equal to the effect of a false-negative non-intervention.19
All statistical analysis was conducted using R package version 3.5.1 (R foundation for Statistical Computing, Vienna, Austria, http://www.R-project.org) and SPSS 22.0.0 (IBM, New York, NY, USA). All P-values were bilateral and a P-value of less than 0.05 was considered statistically significant.
Results
Clinical Characteristics of the Patients
Finally, 826 patients were recruited for this study (573 patients in DC and 253 patients in VC). No significant difference appeared in csPCa prevalence between the DC and VC (28.8% vs 26.5%, P= 0.596). Although the patients were recruited at different time periods, there were no significant differences between the DC and VC in all variables (PI-RADS score and other clinical factors) (P > 0.05). The baseline characteristics of the two cohorts are shown in Table 1.
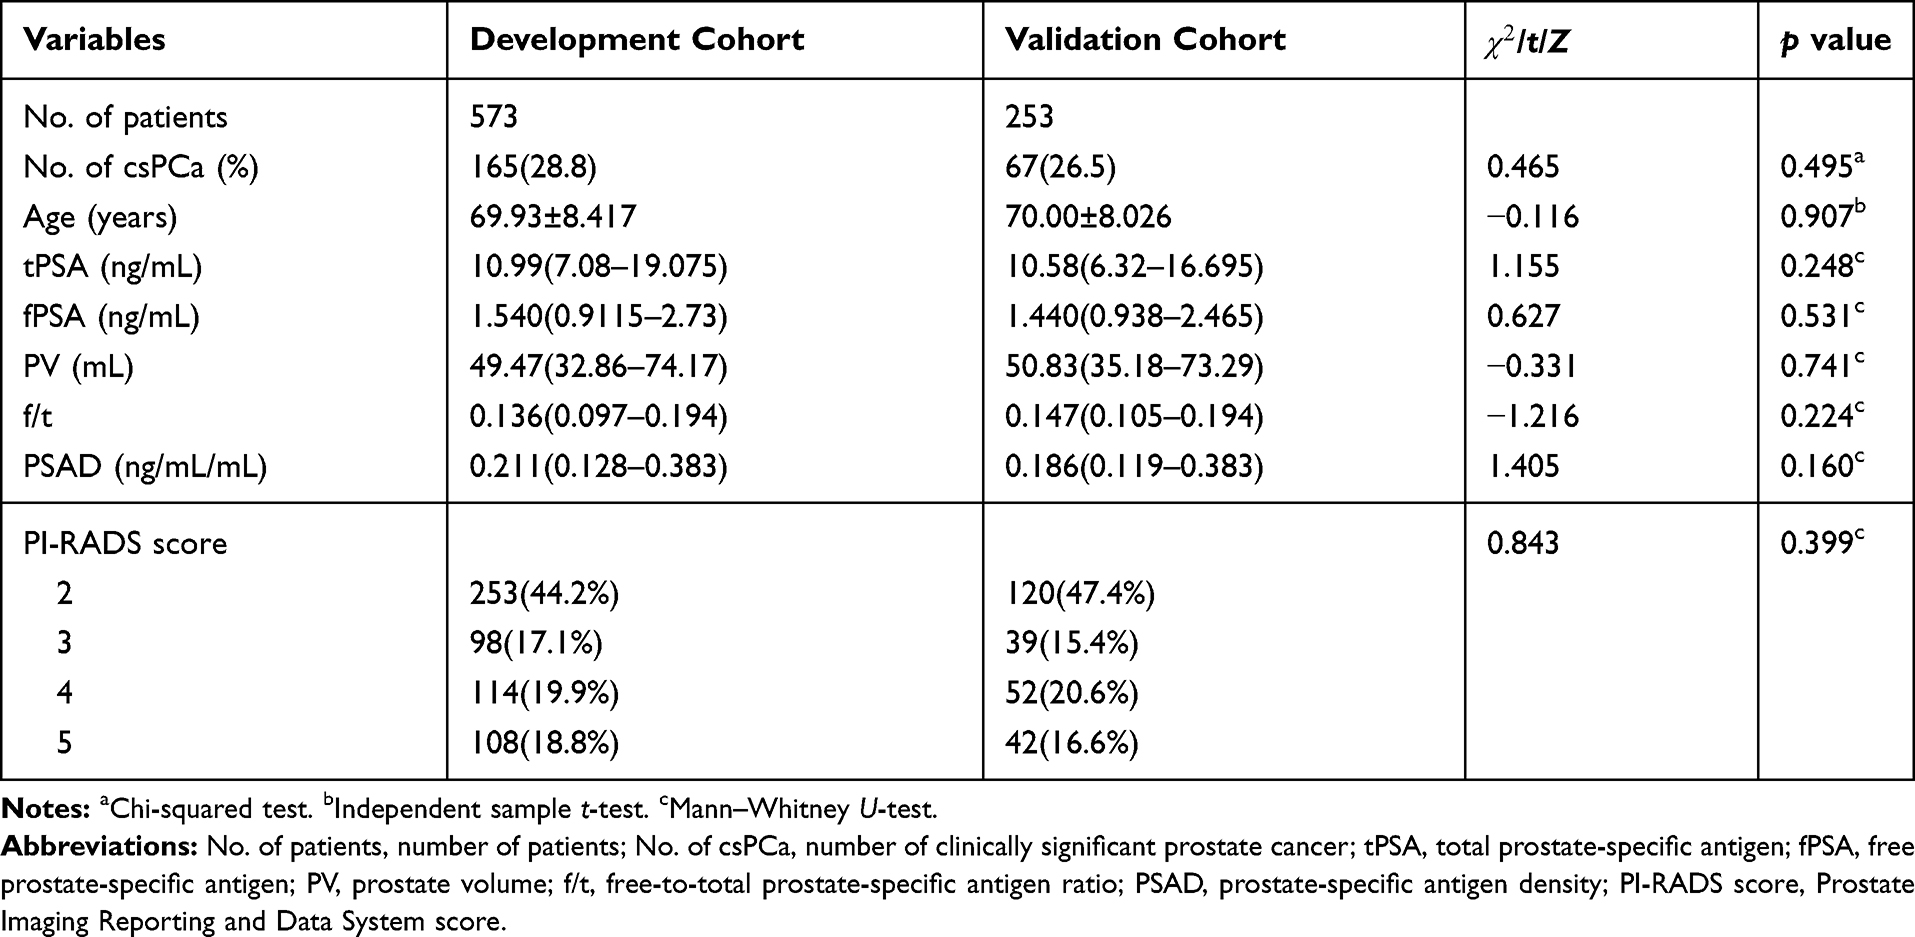 |
Table 1 Baseline Characteristics of Patients in the Two Cohorts |
Developed Nomogram
Univariate analysis indicated distinct differences between the csPCa and non-csPCa groups in PI-RADS score and all other clinical variables, both in the DC and VC (P < 0.05, Table 2). In the DC, multivariate regression analysis demonstrated that age, f/t, PV, and PSAD were independent predictors in detecting csPCa (P < 0.05, Table 3). Since the PSAD was obtained by dividing tPSA by PV, and to avoid introducing a confounding factor, the final constructed model excluded PV with smaller AUCs compared with PSAD. Therefore, the traditional prediction model1 finally integrated three clinical factors: age, f/t, and PSAD. And then added the PI-RADS score to the three clinical factors to develop a new prediction model2 (Table 4). The regression equations of the two models are shown in SI 4, and the individual incidence of csPCa was simultaneously calculated according to another equation (SI 5). Then, the individualized prediction nomogram was built based on the model2 (Figure 2).
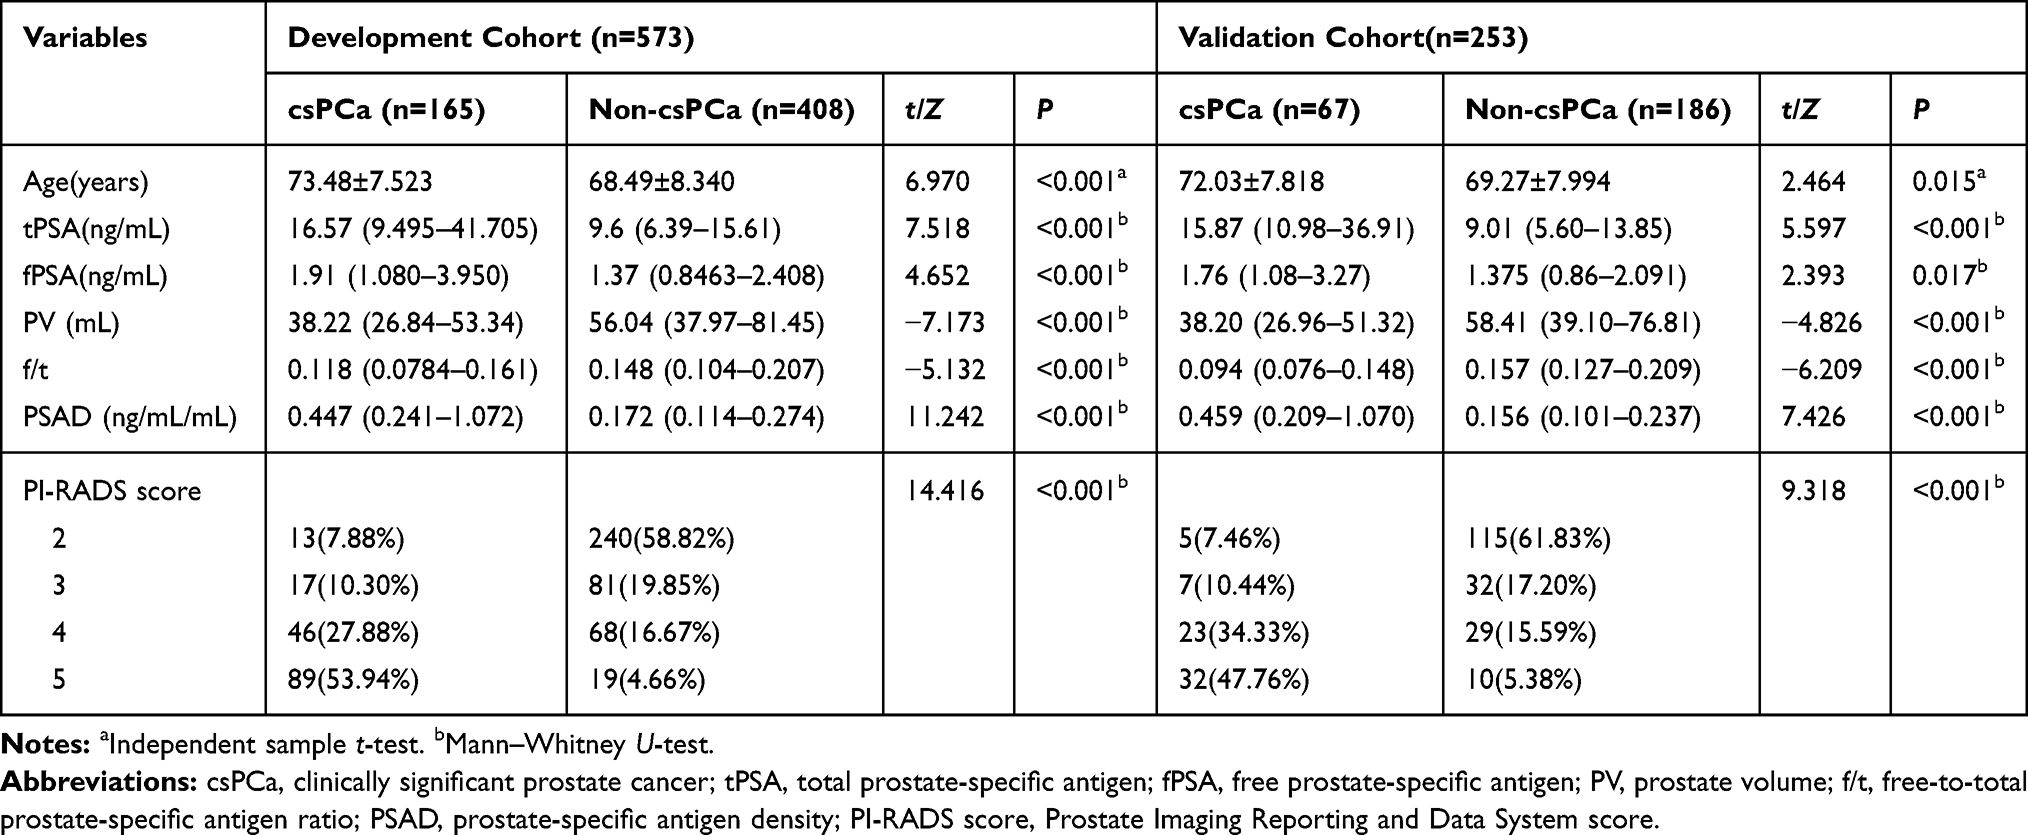 |
Table 2 Univariate Analysis in the Development and Validation Cohorts |
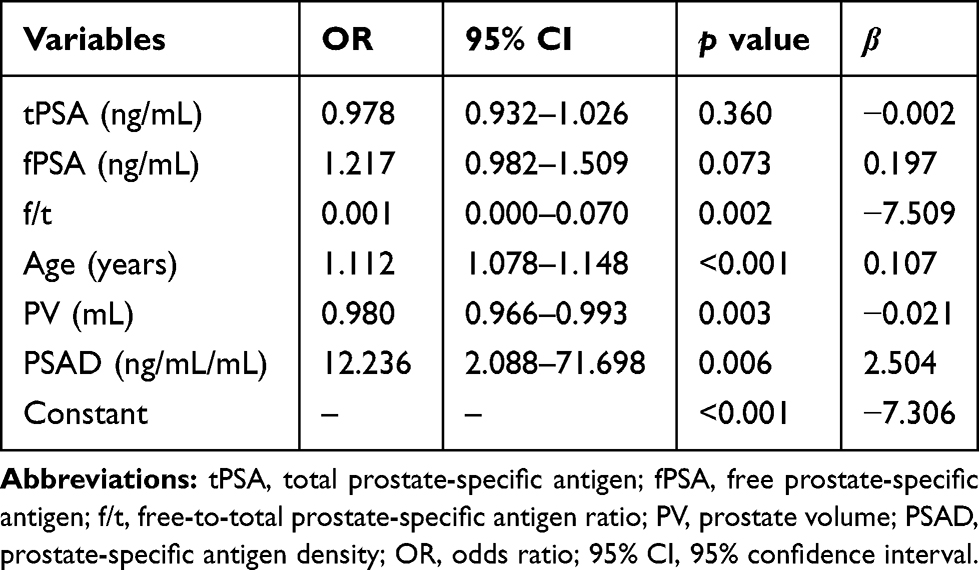 |
Table 3 Multivariate Logistic Regression Analysis in the Development Cohort |
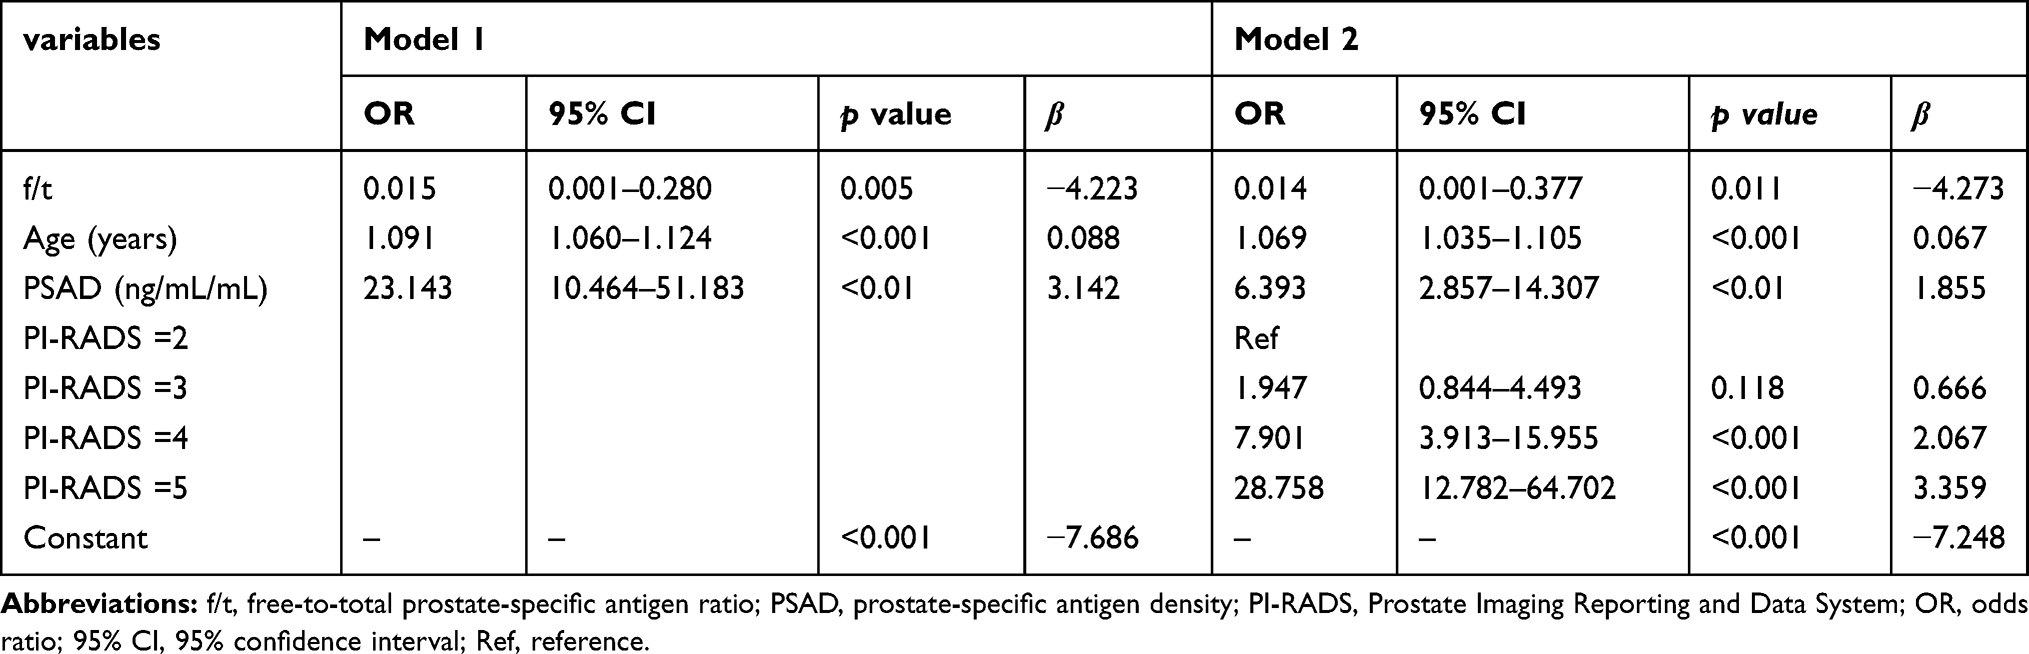 |
Table 4 Binary Logistic Regression About Prediction Model |
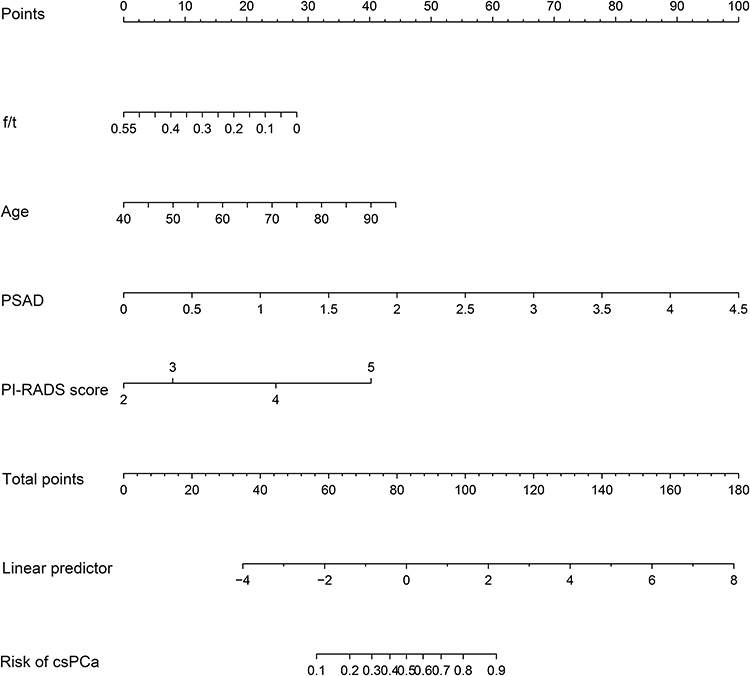 |
Figure 2 Developed nomogram based on PI-RADS score and other clinical factors. Note: The nomogram mapped the predicted probability of each variable into points on a scale from 0 to 100, and the total point accumulated by each variable corresponds to the integrated predicted probability of csPCa. Abbreviations: f/t, free-to-total prostate-specific antigen ratio; PSAD, prostate-specific antigen density; PI-RADS score, Prostate Imaging Reporting and Data System score; csPCa, clinically significant prostate cancer. |
Validated Nomogram
The ROC curve analysis indicated that the PI-RADS-based nomogram possessed good discrimination. In the DC, the AUC of the nomogram was 0.894 (95% CI, 0.863–0.926), while the AUC of model1 and the other single clinical predictors were significantly lower (all P < 0.05), with an AUC of 0.829, 0.863, 0.800, 0.673, and 0.670 for model1, PI-RADS score, PSAD, f/t, and age, respectively. As in the DC, similar results were noticed in the VC. The AUC of the nomogram was 0.891 (95% CI, 0845–0.936), which was higher than that of model1 and other single predictors (all P < 0.05). Specific results for ROC curve analysis are shown in Table 5, Table 6 and Figure 3. NRI analysis indicated that the nomogram had improved patient classification in both the DC (NRI = 0.128) and VC (NRI = 0.163) compared to model1.
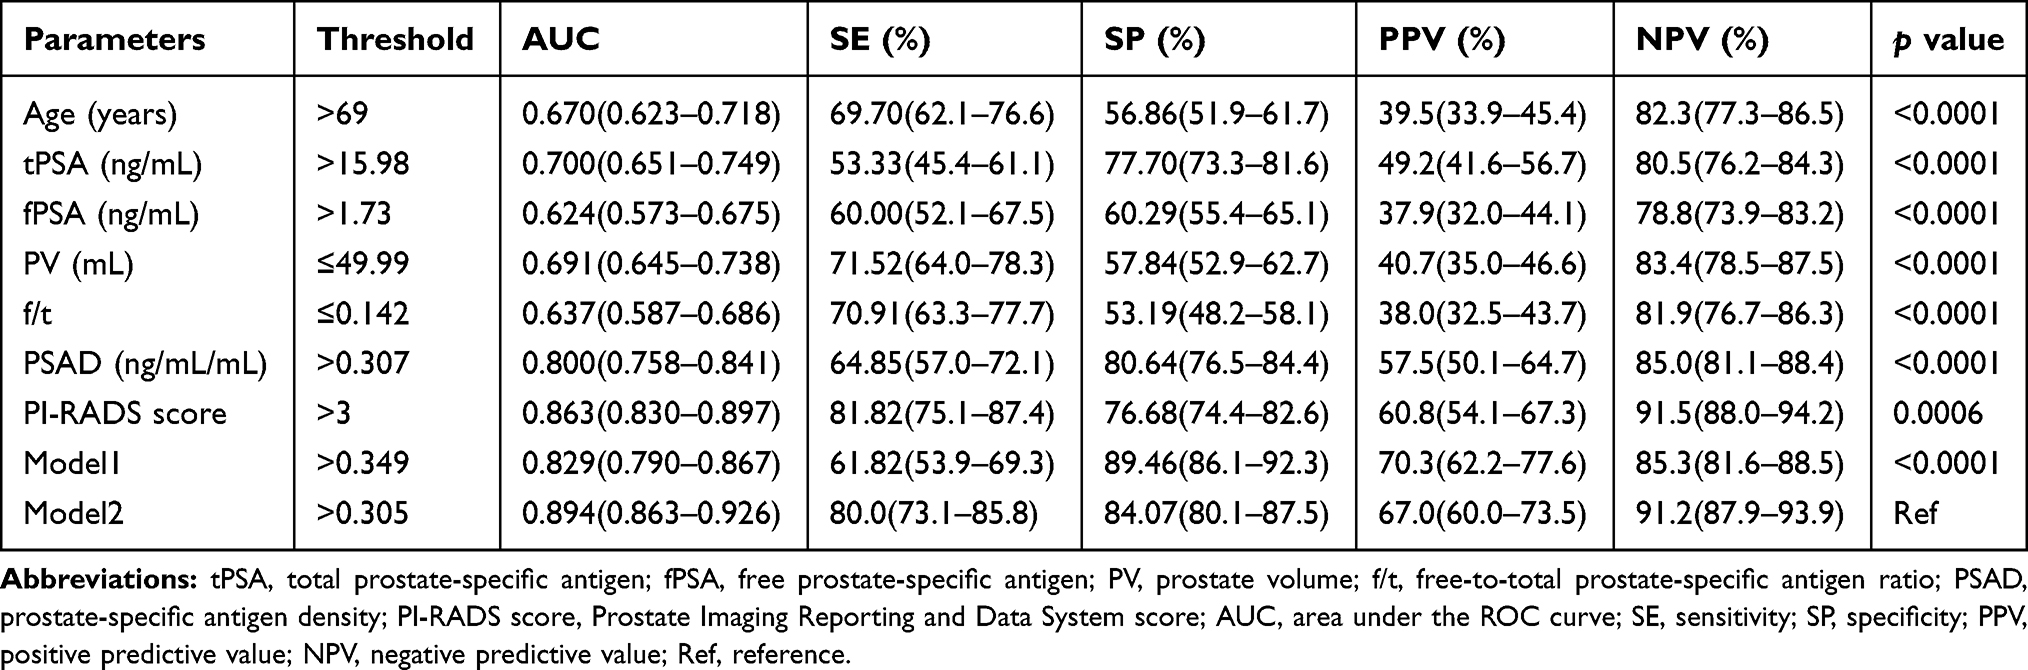 |
Table 5 ROC Curve Analysis in the Development Cohort |
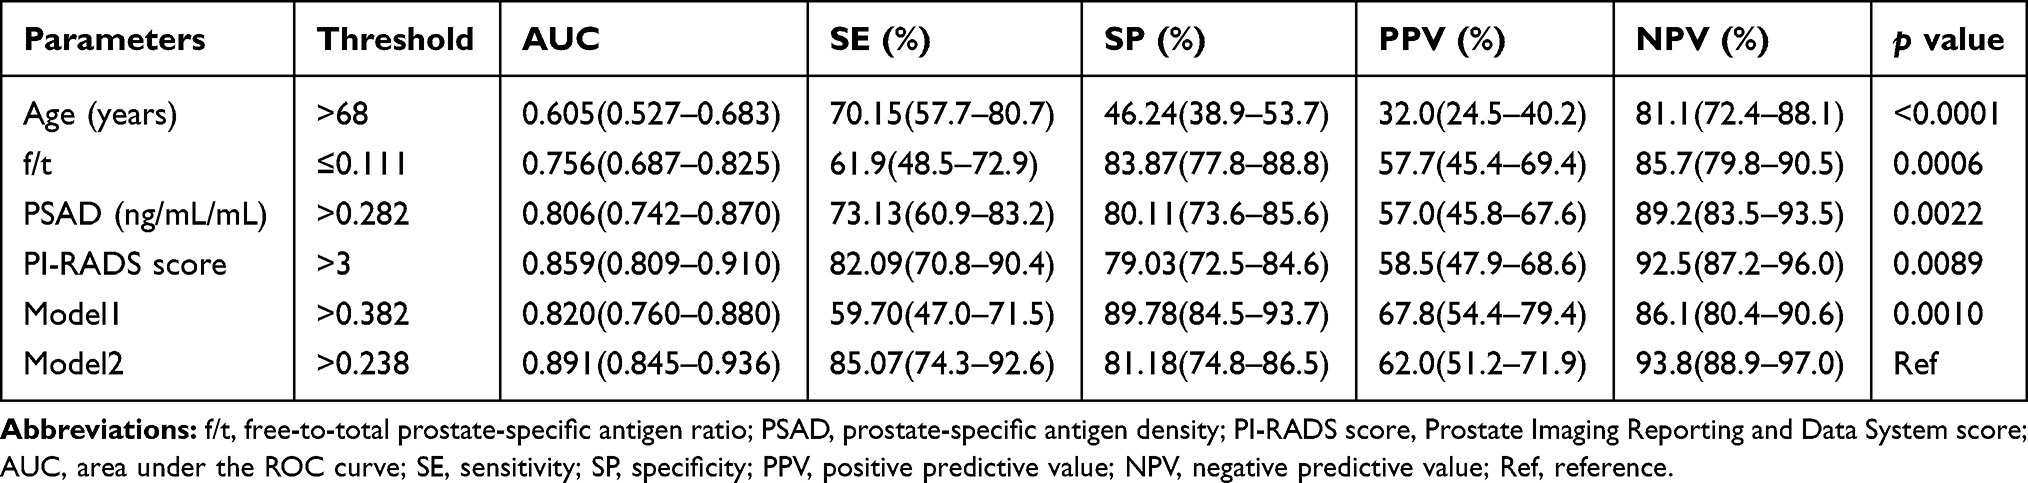 |
Table 6 ROC Curve Analysis in the Validation Cohort |
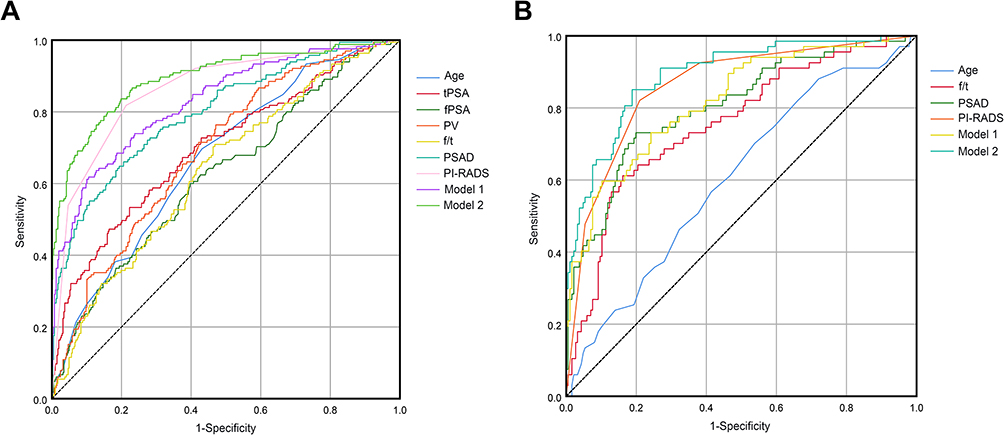 |
Figure 3 ROC curve analysis in the development (A) and validation (B) cohorts. Abbreviations: tPSA, total prostate-specific antigen; fPSA, free prostate-specific antigen; PV, prostate volume; f/t, free-to-total prostate-specific antigen ratio; PSAD, prostate-specific antigen density; PI-RADS, Prostate Imaging Reporting and Data System. |
The calibration curve of the nomogram showed a good agreement between the predicted probability and the actual risk of csPCa in both the DC and VC (Figure 4). The ideal red diagonal line fell within the light-yellow area that the 95% CI of the actual fitted curve based on the predicted and observed probabilities. The Hosmer-Lemeshow goodness-of-fit test also indicated that the PI-RADS-based nomogram was almost a good fit in both the DC (P = 0.330) and VC (P = 0.831).
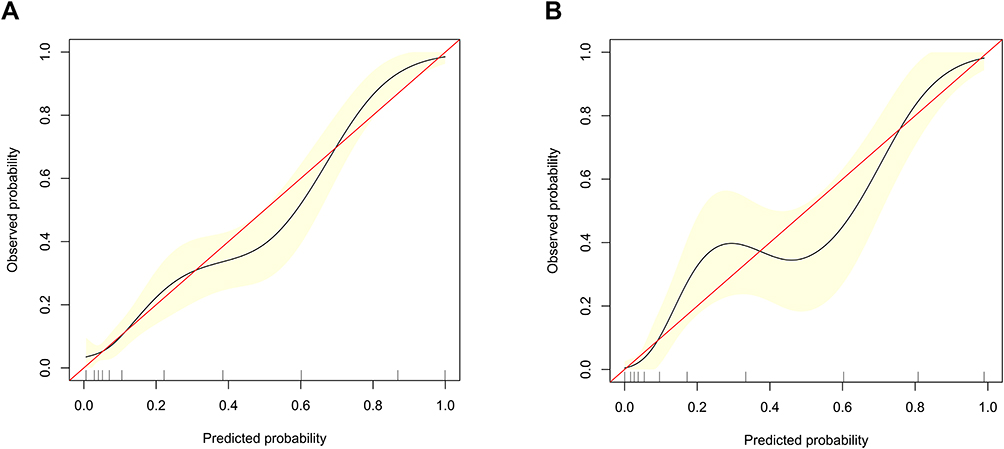 |
Figure 4 Calibration curve of the nomogram in the development (A) and validation (B) cohorts. Note: The red diagonal line is the ideal predicted curve; the black curve is the actual fitted curve based on the predicted and observed probabilities of csPCa; the light-yellow area is the 95% confidence interval (CI) of the actual fitted curve. |
The decision curve analysis is presented in Figure 5. When the threshold probability is greater than 0.06, both model1 and the PI-RADS v2-based nomogram could offer a higher net benefit than intervening with all patients or no patients. In addition, the net benefit of using the nomogram based on model2 was higher than that of model1 in almost all ranges of the threshold probabilities, and this suggested the nomogram has more advantages in guiding clinician decision-making.
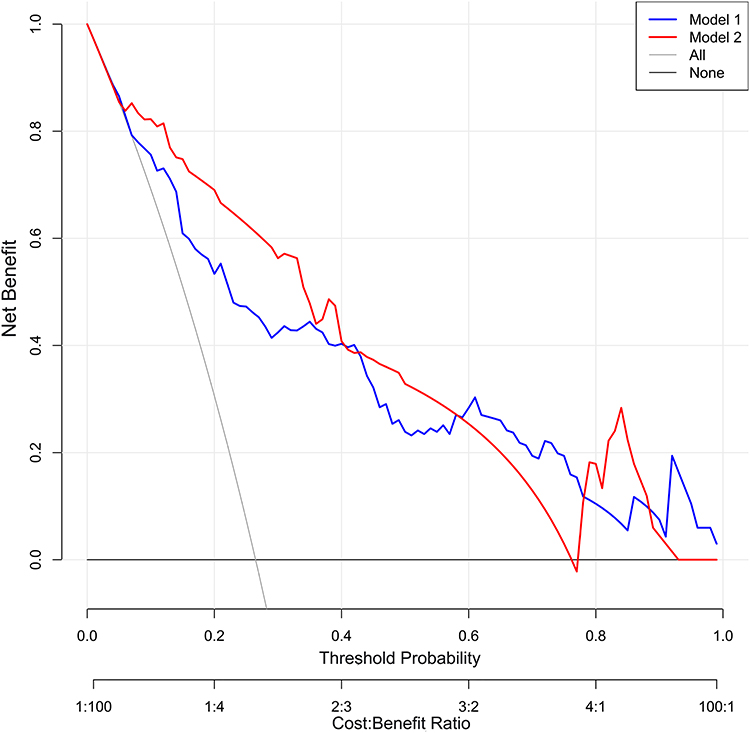 |
Figure 5 Decision curve analysis in the validation cohort. |
Discussion
In order to reduce unnecessary prostate biopsies and potential overtreatment, we developed and validated a PI-RADS-based nomogram for prebiopsy individualized prediction of patients who suspected of csPCa. The easy-to-use nomogram eventually incorporated four items: PI-RADS score, patient age, f/t, and PSAD, and produced a highly discriminative ability, good calibration, and substantial improvement in clinical benefit.
The csPCa detection rate was lower in both cohort, 28% (165/573) and 26% (67/253), compared to the results in other papers. The main reason is that patients with PSA levels in the range of 4–10 ng/mL in this study accounted for a relatively high proportion, 37.0% (212/573) in DC and 37.55% (95/253) in VC, and some patients with PSA less than 4ng/mL also underwent biopsy and were included in this study due to heavier urinary symptoms or fear of prostate cancer. Due to the low csPCa detection rate of these patients, the overall clinically significant cancer detection rate was low in both cohorts.
As a new form of statistical prediction model, nomogram can integrate various predictive indicators and provide the probability of clinical events individually and accurately via a user-friendly graphical interface. It has been widely used for tumor risk assessment and prognosis. In this study, the novel nomogram achieved commendable accuracy in csPCa detection in both the DC and VC, with an AUC of 0.894 (95% CI, 0.863–0.926) and 0.891 (95% CI, 0.845–0.936), respectively. In addition, either in the DC or VC, the nomogram showed a significantly higher AUC than model1 or any single clinical factors. This is consistent with other similar studies.20–23 Meanwhile, the nomogram exhibited an effective reclassification improvement in both the DC and VC, compared to model1. This suggested that the combination of the mpMRI-based PI-RADS score and other independent clinical factors is superior to mpMRI or clinical factors alone for discriminating csPCa. By integrating the subjective mpMRI interpretation and objective clinical indicators and exerting their respective advantages, the sensitivity and specificity of csPCa detection can be effectively improved. Therefore, prebiopsy nomogram assessment can help clinicians to more accurately determine whether it is necessary for patients to undergo a prostate biopsy, thereby saving medical resources and avoiding over-examination.
The determination of covariates is crucial when it comes to developing a nomogram model; however, more covariates do not imply greater predictive ability.13 Introducing confounding variates may reduce the accuracy of the nomogram because it might affect other covariates or even the primary outcome.13,14 Before constructing the nomogram, six indicators that were easily obtained clinically and were included in other PCa risk prediction models were selected as candidate variables in this study.20,22,24 Although univariate analysis indicated significant differences between csPCa and non-csPCa for all candidate variables, multivariate logistic regression ultimately determined three independent clinical risk factors for csPCa. The PI-RADS score as a subjective evaluation of prostatic mpMRI has been recognized as a useful indicator for diagnosing csPCa.6,9 Therefore, the nomogram was eventually constructed that incorporated PI-RADS score and three independent clinical risk factors. In addition, in order to ensure the accuracy of the model fitting, 573 patients were recruited in the DC, which is in full compliance with the sample size requirement of the constructing model proposed by Rao, that is, the sample size was at least ten times greater than the number of variables contained in the model.25 DRE did not incorporate in the nomogram, although previous studies have proven DRE was also a significant predictor of csPCa.10,11,20,23,24 Because we wanted the nomogram to be as simple and objective as possible, and DRE is usually performed by doctors with different experiences, which may affect the accuracy of the nomogram if incorporated. Some novel biomarkers, such as HOXC6 and DLX1 mRNA expression levels, were incorporated into the csPCa prediction model and achieved excellent performance with an AUC of 0.90 (95% CI, 0.85–0.95).8 However, these biomarker tests have not been widely used in clinical practice, and few patients accept these tests routinely.
More recently, several prediction models combining mpMRI and other PSA-related evolutional markers have been proposed to predict csPCa. A nomogram integrating the PI-RADS v1 score and PSAD was built for predicting csPCa by Distler et al.20 The AUC in their study was 0.789 (90% CI, 0.760–0.817), which was lower than our nomogram. Further, their study was limited by the lack of an independent validation, which is indispensable for verifying the reliability of a nomogram. This deficiency was overcome in our study, and the VC showed similar good performance compared with the DC. Another PI-RADS-based nomogram was constructed and validated by Niu et al,21 and the AUCs for predicting csPCa were 0.86 (95% CI, 0.79–0.93) and 0.83 (95% CI, 0.76–0.89) in the DC and VC, respectively. However, the enrolled patients were less than the present study in both the DC (573 vs. 158) and VC (253 vs. 89), and even more regretfully they did not evaluate the calibration of their nomogram. Zhang et al developed and validated a prediction model including the PI-RADS score, PSAD, and patient’s age to assess the risk of csPCa, and indicated that the prediction model performed better than any of the variables alone.22 However, their model did not present with a nomogram and the diagnostic performance was lower than our nomogram in both the DC (AUC = 0.753 [95% CI, 0.678–0.828]) and VC (AUC = 0.834 [90% CI, 0.787–0.882]). The primary reason for this might be that, although the PI-RADS score has been determined as the most influential factor in their multivariate analysis (the highest odds ratio), all patients’ PI-RADS scores were given by only one urologist by interpreting the prostatic mpMRI. The accuracy and reproducibility of a non-radiologist’s scoring results is open to question.
Discrimination and calibration are two equally crucial aspects in evaluating the performance of a nomogram.13,14 Nevertheless, in some studies, discrimination was commonly assessed, while calibration may be overlooked.20,21 In this study, calibration curve was plotted to assess the agreement between the nomogram predicted risk and the actual risk of csPCa. Moreover, we got satisfactory results, with the fitted curve in the DC or VC all falling along the ideal 45-degree line.
In addition to effective discrimination and perfect calibration, clinical utility is also important for assessing the availability of a nomogram.19,26 Therefore, decision cure analysis was employed to evaluate the clinical utility of the nomogram, which measures the net benefit at a series of threshold probabilities and displays them using a visual graph. The results showed that when the threshold probability exceeded 0.06, using the nomogram to predict the risk of csPCa could obtain higher net benefit than treating all or no patient. This implied that using the nomogram developed in this study to assist clinicians in decision-making would potentially improve the patient’s profitability.
There are several limitations to this study. First, this is a retrospective single-center study that lacks the prospective multi-center external dataset to further verify the practicality and accuracy of the nomogram. In addition, the PV was measured using a widely used method, according to the calculation formula for ellipsoid volumes, which may not be accurate enough, compared to computer-assisted volume measurement. Furthermore, the definition of csPCa in this study was inconsistent with some others.20–22,24 Nevertheless, the definition of csPCa has not yet been unified, and our definition is basically consistent with that in PI-RADS v2 guidelines and other studies.5,6
Conclusion
In conclusion, this study developed and validated a nomogram that integrates the mpMRI-based PI-RADS score and other independent clinical risk factors that can be conveniently applied to prebiopsy individualized prediction of csPCa in patients with high-risk factors.
Abbreviations
MRI, magnetic resonance imaging; DC, development cohort; VC, validation cohort; PCa, prostate cancer; csPCa, clinically significant prostate cancer; PSA, prostate-specific antigen; tPSA, total PSA; fPSA, free PSA; f/t, free-to-total PSA ratio; PV, prostate volume; PSAD, PSA density; mpMRI, multiparametric MRI; TRUS, transrectal ultrasound; PI-RADS, Prostate Imaging Reporting and Data System; GS, Gleason scores; ROC, receiver operating characteristic; AUC, the area under the ROC curve; NRI, net reclassification improvement.
Disclosure
The authors have stated that they have no conflicts of interest.
References
1. Bray F, Ferlay J, Soerjomataram I, Siegel RL, Torre LA, Jemal A. Global cancer statistics 2018: GLOBOCAN estimates of incidence and mortality worldwide for 36 cancers in 185 countries. CA Cancer J Clin. 2018;68(6):394–424. doi:10.3322/caac.21492
2. Catalona WJ, Southwick PC, Slawin KM, et al. Comparison of percent free PSA, PSA density, and age-specific PSA cutoffs for prostate cancer detection and staging. Urology. 2000;56(2):255–260. doi:10.1016/s0090-4295(00)00637-3
3. Schroder FH, Roobol MJ, van der Kwast TH, Kranse R, Bangma CH. Does PSA velocity predict prostate cancer in pre-screened populations? Eur Urol. 2006;49(3):460–465. doi:10.1016/j.eururo.2005.12.026
4. Verma A, St Onge J, Dhillon K, Chorneyko A. PSA density improves prediction of prostate cancer. Can J Urol. 2014;21(3):7312–7321.
5. Weinreb JC, Barentsz JO, Choyke PL, et al. PI-RADS prostate imaging - reporting and data system: 2015, version 2. Eur Urol. 2016;69(1):16–40. doi:10.1016/j.eururo.2015.08.052
6. Giannarini G, Girometti R, Crestani A, et al. A prospective accuracy study of prostate imaging reporting and data system version 2 on multiparametric magnetic resonance imaging in detecting clinically significant prostate cancer with whole-mount pathology. Urology. 2019;123:191–197. doi:10.1016/j.urology.2018.07.067
7. Kasel-Seibert M, Lehmann T, Aschenbach R, et al. Assessment of PI-RADS v2 for the detection of prostate cancer. Eur J Radiol. 2016;85(4):726–731. doi:10.1016/j.ejrad.2016.01.011
8. Van Neste L, Hendriks RJ, Dijkstra S, et al. Detection of high-grade prostate cancer using a urinary molecular biomarker-based risk score. Eur Urol. 2016;70(5):740–748. doi:10.1016/j.eururo.2016.04.012
9. Zhang L, Tang M, Chen S, Lei X, Zhang X, Huan Y. A meta-analysis of use of prostate imaging reporting and data system version 2 (PI-RADS V2) with multiparametric MR imaging for the detection of prostate cancer. Eur Radiol. 2017;27(12):5204–5214. doi:10.1007/s00330-017-4843-7
10. Chen R, Xie L, Xue W, et al. Development and external multicenter validation of Chinese prostate cancer consortium prostate cancer risk calculator for initial prostate biopsy. Urol Oncol. 2016;34(9):
11. Roobol MJ, Steyerberg EW, Kranse R, et al. A risk-based strategy improves prostate-specific antigen-driven detection of prostate cancer. Eur Urol. 2010;57(1):79–85. doi:10.1016/j.eururo.2009.08.025
12. Thompson IM, Ankerst DP, Chi C, et al. Assessing prostate cancer risk: results from the prostate cancer prevention trial. J Natl Cancer Inst. 2006;98(8):529–534. doi:10.1093/jnci/djj131
13. Balachandran VP, Gonen M, Smith JJ, DeMatteo RP. Nomograms in oncology: more than meets the eye. Lancet Oncol. 2015;16(4):e173–e180. doi:10.1016/s1470-2045(14)71116-7
14. Iasonos A, Schrag D, Raj GV, Panageas KS. How to build and interpret a nomogram for cancer prognosis. J Clin Oncol. 2008;26(8):1364–1370. doi:10.1200/jco.2007.12.9791
15. Mohler JL, Antonarakis ES, Armstrong AJ, et al. Prostate cancer, version 2.2019, NCCN clinical practice guidelines in oncology. J Natl Compr Canc Netw. 2019;17(5):479–505. doi:10.6004/jnccn.2019.0023
16. Epstein JI, Allsbrook WC
17. DeLong ER, DeLong DM, Clarke-Pearson DL. Comparing the areas under two or more correlated receiver operating characteristic curves: a nonparametric approach. Biometrics. 1988;44(3):837–845. doi:10.2307/2531595
18. Pencina MJ, D’Agostino RB
19. Vickers AJ, Elkin EB. Decision curve analysis: a novel method for evaluating prediction models. Med Decis Making. 2006;26(6):565–574. doi:10.1177/0272989x06295361
20. Distler FA, Radtke JP, Bonekamp D, et al. The value of PSA density in combination with PI-RADS for the accuracy of prostate cancer prediction. J Urol. 2017;198(3):575–582. doi:10.1016/j.juro.2017.03.130
21. Niu XK, He WF, Zhang Y, et al. Developing a new PI-RADS v2-based nomogram for forecasting high-grade prostate cancer. Clin Radiol. 2017;72(6):458–464. doi:10.1016/j.crad.2016.12.005
22. Zhang Y, Zeng N, Zhu YC, Huang YXR, Guo Q, Tian Y. Development and internal validation of PI-RADs v2-based model for clinically significant prostate cancer. World J Surg Oncol. 2018;16(1):102. doi:10.1186/s12957-018-1367-9
23. Boesen L, Thomsen FB, Norgaard N, Logager V, Balslev I. A predictive model based on biparametric magnetic resonance imaging and clinical parameters for improved risk assessment and selection of biopsy-naive men for prostate biopsies. Prostate Cancer Prostatic Dis. 2019;22(4):609–616. doi:10.1038/s41391-019-0149-y
24. Washino S, Okochi T, Saito K, et al. Combination of prostate imaging reporting and data system (PI-RADS) score and prostate-specific antigen (PSA) density predicts biopsy outcome in prostate biopsy naive patients. BJU Int. 2017;119(2):225–233. doi:10.1111/bju.13465
25. Rao SJ. Regression modeling strategies: with applications to linear models, logistic regression, and survival analysis. Publ Am Stat Assoc. 2005;98(461):257–258. doi:10.1198/jasa.2003.s263
26. Localio AR, Goodman S. Beyond the usual prediction accuracy metrics: reporting results for clinical decision making. Ann Intern Med. 2012;157(4):294–295. doi:10.7326/0003-4819-157-4-201208210-00014
 © 2020 The Author(s). This work is published and licensed by Dove Medical Press Limited. The full terms of this license are available at https://www.dovepress.com/terms.php and incorporate the Creative Commons Attribution - Non Commercial (unported, v3.0) License.
By accessing the work you hereby accept the Terms. Non-commercial uses of the work are permitted without any further permission from Dove Medical Press Limited, provided the work is properly attributed. For permission for commercial use of this work, please see paragraphs 4.2 and 5 of our Terms.
© 2020 The Author(s). This work is published and licensed by Dove Medical Press Limited. The full terms of this license are available at https://www.dovepress.com/terms.php and incorporate the Creative Commons Attribution - Non Commercial (unported, v3.0) License.
By accessing the work you hereby accept the Terms. Non-commercial uses of the work are permitted without any further permission from Dove Medical Press Limited, provided the work is properly attributed. For permission for commercial use of this work, please see paragraphs 4.2 and 5 of our Terms.