")
Back to Journals » International Journal of Nanomedicine » Volume 15
A pH-Responsive Charge-Reversal Drug Delivery System with Tumor-Specific Drug Release and ROS Generation for Cancer Therapy
Authors Xu C, Song R, Lu P, Chen J, Zhou Y, Shen G , Jiang M, Zhang W
Received 7 September 2019
Accepted for publication 10 December 2019
Published 8 January 2020 Volume 2020:15 Pages 65—80
DOI https://doi.org/10.2147/IJN.S230237
Checked for plagiarism Yes
Review by Single anonymous peer review
Peer reviewer comments 5
Editor who approved publication: Dr Mian Wang
Chen Xu,1,2,* Rijin Song,1,* Pei Lu,1,* Jianchun Chen,2 Yongqiang Zhou,2 Gang Shen,2 Minjun Jiang,2 Wei Zhang1
1Department of Urology, The First Affiliated Hospital of Nanjing Medical University, Nanjing 210029, People’s Republic of China; 2Department of Urology, Affiliated Wujiang Hospital of Nantong Univerisity, Suzhou 215200, People’s Republic of China
*These authors contributed equally to this work
Correspondence: Wei Zhang Email [email protected]
Minjun Jiang Email [email protected]
Introduction: Poor cell uptake and incomplete intracellular drug release are the two major challenges for polymeric prodrug-based drug delivery systems (PPDDSs) in cancer treatment.
Methods: Herein, a PPDDS with pH-induced surface charge-reversal and reactive oxygen species (ROS) amplification for ROS-triggered self-accelerating drug release was developed, which was formed by encapsulating a ROS generation agent (vitamin K3 (VK3)) in pH/ROS dual-sensitive polymetric prodrug (PEG-b-P(LL-g-TK-PTX)-(LL-g-DMA)) based micelle nanoparticles (denoted as PVD-NPs).
Results: The surface charge of the PVD-NPs can change from negative to positive for enhanced cell uptake in response to tumor extracellular acidity pH. After internalization by cancer cells, PVD-NPs demonstrate dual drug release in response to intracellular ROS-rich conditions. In addition, the released VK3 can produce ROS under the catalysis by NAD(P)H:quinone oxidoreductase-1, which facilitates tumor-specific ROS amplification and drug release selectively in cancer cells to enhance chemotherapy.
Conclusion: Both in vitro and in vivo experiments demonstrated that the PVD-NPs showed significant antitumor activity in human prostate cancer.
Keywords: charge-reversal, dual-responsive, ROS generation, cancer specific chemotherapy
Introduction
During the past decades, polymeric prodrug-based drug delivery systems (PPDDSs) have emerged as a promising platform for cancer therapy.1,2 Compared with conventional chemotherapeutic drugs, PPDDSs for cancer therapy have the following advantages: improved drug solubility, prolonged circulation time, improved tumor selectivity, and reduced side effects.3,4 Along with therir advantages in terms of prodrug delivery and stimuli-responsive drug release capabilities, PPDDSs could obviously improve the drug accumulation in the tumor tissue via the enhanced permeability and retention (EPR) effect, thereby remarkably increasing the therapeutic effects.5–7 However, the poor tumor cells’ internalization and incomplete drug release are the two major drawbacks hindering the clinical translation of PPDDSs.
Poly(ethylene glycol) (PEG) is mostly used as the hydrophilic component of PPDDSs because of its good hydrophilicity, biocompatibility, and sustained blood circulation.2,8 However, PEG surface modification could impede the uptake of PPDDSs by cancer cells.9–11 It has been reported that the positively surface-charged nanoparticles can improve cellular uptake via electrostatic attraction to negatively charged cell membranes.12,13 However, rapid body elimination and tissue toxicity hindering the application of positively surface-charged nanoparticles.14,15 Recently, a new strategy of combining the advantages of PEGylation and positively surface charged, named as surface charge-reversal strategy, has been used for drug delivery.12–16 Such PPDDSs could maintain a negative charged under physiological conditions (pH 7.4) to reduce protein adsorption and avoid clearance by the reticuloendothelial system (RES), and then charge to a positively surface charge under conditions of extracellular acidity (pH 6.0–7.0) to improve cellular uptake.
After internalization in cancer cells, drugs should be released selectively at the tumor site in a tumor-specific manner, using cues such as an acidic environment, increased secretion of enzymes, or high levels of glutathione (GSH) or reactive oxygen species (ROS).17,18 Because both cancer and healthy cells have lysosomes with an acidic pH and high intracellular levels of GSH, pH- and GSH-triggered drug release mechanisms offer limited selectively between healthy and cancer cells.19 However, ROS levels in cancer cells are tens-to-hundreds times higher than those in healthy cells, and therefore ROS-responsive drug delivery systems provide more tumor-specific drug release.20,21 Various ROS-sensitive linkages such as thioketal (TK), boronic ester, and alkylene sulfide have been widely evaluated in ROS-responsive drug delivery systems for cancer treatment.22,23 Unfortunately, variations in endogenous ROS concentrations because of tumor heterogeneity result in incomplete complete drug release from ROS-sensitive drug delivery systems in vivo.5,24,25 Therefore, pH/ROS charge-reversal PPDDSs with ROS production capabilities represent a promising alternative strategy to overcome the drawbacks of PPDDSs.
Menadione, also named VK3, a quinone-type natural molecule, showed an anti-tumor effect against prostate, lung, hepatic, and breast cancer.26,27 Moreover, many studies have shown that VK3 can produce ROS under catalysis by NAD(P)H:quinone oxidoreductase-1 (NQO1).25,27,28 Because NQO1 is specifically overexpressed in cancer cells, VK3 can specifically increase ROS levels in tumor cells rather than in healthy cells.29,30 Therefore, ROS-responsive PPDDSs co-loaded with VK3 could remarkably amplify ROS levels for complete drug release.
To overcome the aforementioned drawbacks, in the current study, we report a self-amplifiable drug release PPDDS with charge reversal capability, created by loading VK3 in a pH/ROS dual-responsive micelle nanoparticle (Scheme 1). In this nanosystem, a ROS-sensitive paclitaxel (PTX) pro-drug (PTX-TK) and 2,3-dimethylmaleic anhydride (DMA) were conjugated to the amino groups of PEG-b-PLL to produce a pH/ROS dual-responsive component: PEG-b-P((LL-g-TK-PTX)-(LL-g-DMA)), and then VK3 was encapsulated into the polymer micelles formed by PEG-b-P((LL-g-TK-PTX)-(LL-g-DMA)) (denoted as PVD-NPs). After intravenous administration to mice, PVD-NPs could ideally maintain a negative surface charge in blood circulation, which quickly changed to a positive charge when they reached tumor tissue, allowing them to be quickly ingested by cancer cells. Finally, endogenous ROS can trigger PTX and VK3 release, and the released VK3 could induce ROS generation, consequently amplifying drug release.
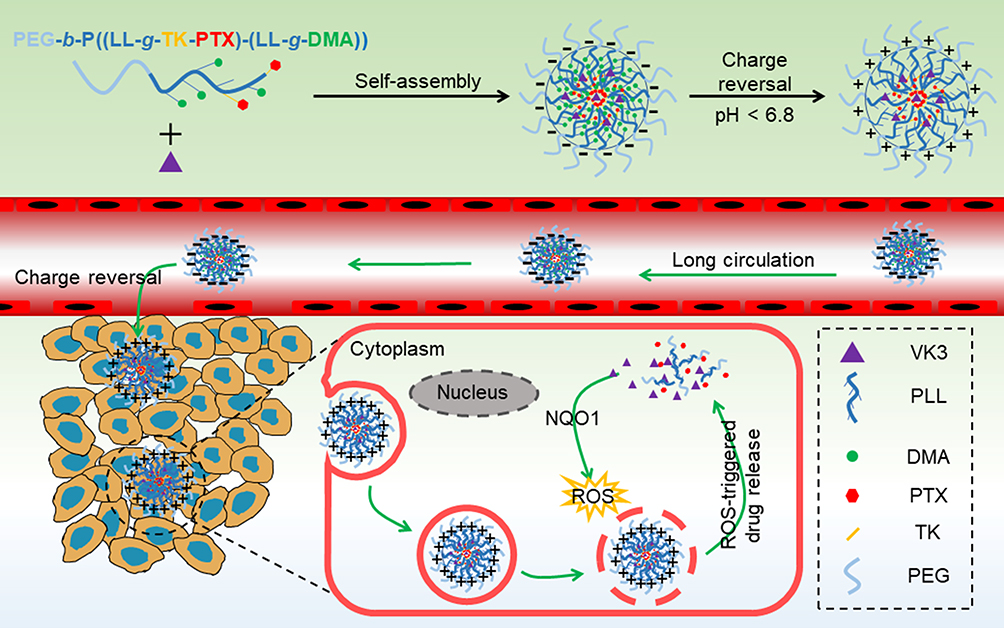 |
Scheme 1 The illustration of the charge-reversal and intracellular ROS generation of PVD-NPs in tumor tissue. |
Experimental Section
Materials
PTX was purchased from Beijing Huafeng United Technology Co., Ltd (Beijing, China). Vitamin K3, 2.3-dimethylmaleic anhydride (DMA), succinic anhydride (SA) and 3-mercaptopropionic acid were purchased from Aladdin Reagent Company (Shanghai, China). Poly(ethylene glycol)-b-poly(L-lysine) (PEG-b-PLL) was synthesized as previously reported.1 Dichlorofluorescindiacetate (DCFA-DA), a BCA kit, 3-(4,5-dimethylthiazol-2-yl)-2,5-diphenyl tetrazolium bromide (MTT) and DAPI were purchased from Beyotime Institute of Biotechnology (Shanghai, China).
Animal and Cell Lines
The human prostate cancer cell line PC-3 and mouse embryonic fibroblast NIH-3T3 cells were obtained from the Institute of Biochemistry and Cell Biology, Shanghai Institutes for Biological Sciences, Chinese Academy of Sciences (Shanghai, China). PC-3 cells were cultured in RPMI 1640 culture medium, containing 10% (v/v) fetal bovine serum, 100 IU/mL penicillin and 100 µg/mL streptomycin at 37°C in a humidified 5% CO2 atmosphere. The NIH-3T3 cells were cultured in DMEM culture medium, containing 10% (v/v) bovine calf serum, 1% glutamax, 1% non-essential amino acids, 1% sodium pyruvate (100 mM), 100 IU/mL penicillin, and 100 µg/mL streptomycin at 37°C in a humidified 5% CO2 atmosphere.
BALB/c nude mice (male, 4–6 w, 20 ± 2 g) were purchased from the Vital River Laboratory Animal Technology Co., Ltd. (Beijing, China). All animals received care in compliance with the guidelines outlined in the Guide for the Care and Use of Laboratory Animals and all procedures were approved by The First Affiliated Hospital of Nanjing Medical University Care and Use Committee.
Characterization
Nuclear magnetic resonance (NMR) spectra were recorded using a Bruker AVANCE III spectrometer at 300 MHz with deuterated dimethyl sulfoxide (DMSO-d6) or D2O as the solvent. The size, size distribution, and the zeta potential of particles in aqueous solution were determined through dynamic light scattering (DLS, Zs90, Malvern Instruments, Malvern, UK). The morphology of the particles was investigated using transmission electron microscopy (TEM, Hitachi Ltd, Tokyo, Japan).
Synthesis of Thioketal (TK)
The TK linker was prepared as previously reported.24 Briefly, anhydrous 3-mercaptopropinonic (6.0 g, 56.6 mmol) and anhydrous acetone (6.8 g, 115.6 mmol) were mixed and stirred at room temperature for 6 h under dry hydrogen chloride. At the end of the reaction, the flask was placed in an ice-salt bath until the crystallization was completed. Then, the mixture was filtered, washed with abundant hexane and ice-cold water. The TK product was obtained after drying under vacuum.
Synthesis of TK-PTX
TK-PTX was prepared as previously reported.31 Briefly, TK (201.6 mg, 0.8 mmol), 1-ethyl-3-[3-dimethylaminopropyl]carbodiimide hydrochloride (EDC, 230.4 mg, 1.2 mmol), and N-hydroxysuccinimide (NHS, 138.0 mg, 1.2 mmol) were dissolved in 40 mL of dry N,N-dimethylformamide (DMF) and the reaction mixture was maintained under stirring for 2 h under nitrogen atmosphere at room temperature. Then, PTX (427.0 mg, 0.5 mmol) and 4-dimethylaminopyridine (73.2 mg, 0.6 mmol) were added to the solution and incubated for a further 24 h under nitrogen atmosphere at room temperature. Finally, the solution was precipitated with 400 mL of 0.1 M pre-chilled diluted hydrochloric acid. TK-PTX was obtained through vacuum drying.
Synthesis of PEG-b-P(LL-g-TK-PTX)
In brief, TK-PTX (2.176 g, 2.0 mmol), EDC (480 mg, 2.5 mmol) and NSH (287.5 mg, 2.5 mmol) were dissolved in 80 mL of dry DMF and stirred for 4 h at room temperature under nitrogen atmosphere. Then, PEG-b-PLL (2.93 g, 0.4 mmol) was dissolved in 40 mL of dry DMF and added to the mixture, which underwent further stirring at room temperature for 48 h in a nitrogen atmosphere. Finally, the mixture was dialyzed (MWCO, 3500 Da) against DMF to remove unreacted small molecules and then, dialyzed against distilled water to remove DMF. The product PEG-b-P(LL-g-TK-PTX) was obtained through lyophilization.
Synthesis of PEG-b-P(LL-g-TK-PTX)-(LL-g-DMA)
Briefly, PEG-b-P(LL-g-TK-PTX) (1.7 g, 0.1 mmol) and DMA (252.0 mg, 2.0 mmol) were dissolved in 50 mL of DMF, and then TEA (150 µL) was added under nitrogen atmosphere. The mixture was stirred at room temperature for 12 h. At end of the reaction, the mixture was dialyzed (MWCO 3500 Da) against distilled water at pH 8–9 for 24 h and the product, PEG-b-P(LL-g-TK-PTX)-(LL-g-DMA), was obtained through lyophilization.
As a control, SA was reacted with PEG-b-P(LL-g-TK-PTX) using the same method mentioned above to obtain a no-charge-conversion polymer prodrug: PEG-b-P((LL-g-TK-PTX)-(LL-g-SA)).
PTX content in the PEG-b-P((LL-g-TK-PTX)-(LL-g-DMA)) and PEG-b-P((LL-g-TK-PTX)-(LL-g-SA)) was determined using a 1H NMR and UV spectrophotometer at a wavelength of 254 nm. The PTX content was calculated using the following formula:
Nanoparticles Preparation
VK3 and PTX co-loaded nanoparticles were prepared using the coprecipitation method. Typically, PEG-b-P((LL-g-TK-PTX)-(LL-g-DMA)) (15 mg) and VK3 (3 mg) were dissolved in 1 mL of DMF and stirred for 1 h at room temperature. Then, the mixture was added dropwise into 10 mL of distilled water under vigorous stirring and then dialyzed (Mw: 3500 Da) against water for 12 h. The PVD-NPs were obtained after filtration using a Millipore filter (pore size: 0.45 µm) to remove unencapsulated VK3. The control groups used the following treatments: 1) PTX-loaded PPDDSs named PD-NPs; 2) PTX and VK3 co-loaded PPDDSs with no surface charge-reversal capability named PVS-NPs. Moreover, coumarin-6 loaded PVD-NPs and PVS-NPs were also prepared using the same method.
The drug loading content (DLC) for VK3 was determined through HPLC. The HPLC analysis for PTX was performed using a phase column (Agilent ODS C18 column, 4.6 × 250 mm2, 5 μm particle size) eluted with methanol: water (65/35, v/v) at a flow rate of 1 mL/min and the column effluent was monitored using a UV detector set at 227 nm. For VK3 analysis, the mobile phase consisted of methanol: water (70/30, v/v) and UV detection at 265 nm was used.32 The DLC was calculated using the following formula:

pH-Triggered Charge Changes in PVD-NPs
The surface charge changes of the particles at different pH values were determined by incubating PVD-NPs (0.1 mg/mL) and PVS-NPs (0.1 mg/mL) in PBS (pH 6.5 or 7.4, 0.1 mM) at 37°C. Samples were taken at designated times, and the zeta potential was determined through DLS.
In vitro Drug Release
PTX and VK3 release from PVD-NPs at various ROS levels was measured via the dialysis method. Typically, 2 mL of PVD-NPs containing 1.0 mg of PTX and 0.5 mg of VK3 was transferred into a dialysis bag (Mw: 5000 Da) and immersed in 48 mL of PBS (pH 7.4) containing 0.8% Tween 80 with 0 mM, 0.1 mM or 10 mM H2O2. Every sample was gently shaken at an appropriate speed at 37°C. At predetermined time points, 1 mL of solute outside the dialysis bag was removed and replaced with an equal volume of fresh medium. The amount of released PTX and VK3 was measured using HPLC.
Protein Adsorption and Stability of PVD-NPs
Bovine serum albumin (BSA) was used as a model protein to investigate the protein adsorption capacity of the PVD-NPs, as previously reported.1 The PVD-NPs and PVS-NPs were separately incubated with a BSA solution in PBS at pH 6.5 or 7.4, and the final concentration of nanoparticles and proteins was fixed at 0.3 and 0.5 mg/mL, respectively. After incubation at 37°C for 12 h, each sample was centrifuged at 12,000 rpm for 10 min to precipitate the protein-adsorbed nanoparticles. The concentration of residual BSA in the supernatant was measured using commercial BCA protein assay kits.
For stability tests, PVD-NPs, PD-NPs, and PVS-NPs were incubated in PBS (pH 7.4) with or without 20% fetal bovine serum (FBS) for 1, 2, 4, 8, 12, 24, or 48 h. At the end of the incubation, the size of all nanoparticles was measured through DLS.
Cell Uptake in Different pH Conditions
The pH-enhanced cell uptake of PVD-NPs in PC-3 cells was visualized using a confocal laser scanning microscope (CLSM) and quantitatively analyzed through flow cytometry. PC-3 cells were seeded in six-well plates (2 × 10⁵ cells per well) and incubated overnight under normal culture conditions. Then, the culture medium was replaced with RPMI 1640 medium containing PVD-NPs and PVS-NPs (equal to 5 µg/mL of PTX, 200 ng/mL of coumarin-6) at pH 7.4 or 6.5. After 1, 2, or 4 h of incubation, the cells were washed using PBS and fixed using a 4% paraformaldehyde solution for 10 min. The cell nuclei were stained using DAPI for 10 min and then observed using a CLSM (Zeiss, Germany).
For flow cytometry analysis, PC-3 cells were seeded into six-well plates at a density of 2 × 10⁵ cells per well and incubated for 24 h under normal culture conditions. Then, the culture medium was replaced with RPMI 1640 medium containing PVD-NPs or PVS-NPs (equal to 20 µg/mL of PTX, 200 ng/mL of coumarin-6) at pH 7.4 or 6.5 for 1, 2, or 4 h at 37°C, and then the medium was removed and the cells were washed thrice using PBS. Subsequently, the cells were harvested, and quickly assessed through flow cytometry (MACSQuant Analyzer 10, Miltenyi Biotec, Germany)
Intracellular ROS Generation Study
The concentration of intracellular ROS was detected using a CLSM and flow cytometer by using DCFA-DA as a probe. For the CLSM assay, PC-3 cells were seeded in six-well plates at a density of 1 × 10⁵ cells per well for 24 h. The cells were incubated with VK3, PVD-NPs, PVD-NPs + dicoumarol (DIC), or PD-NPs for 8 h (equivalent to PTX 20 µg/mL or VK3 30 µg/mL). Cells without any treatment were used as a control. After treatment, the cells were washed using pre-chilled PBS three times and the media were replaced with 2ʹ,7ʹ-dichlorofluorescein diacetate (DCFH-DA) at 37°C for 20 min. After washing, the cells were observed using a CLSM.
For flow cytometry quantitative analysis, PC-3 cells were seeded onto six-well plates and incubated for 48 h. Then, the cells were treated using VK3, PVD-NPs, PVD-NPs + DIC, or PD-NPs. After incubation for 8 h, the cells were washed using PBS three times and the cell culture medium was replaced with DCFH-DA at 37°C for 20 min. Then, the cells were collected, washed with PBS, and quickly assessed using a flow cytometer.
The intracellular ROS generation ability of VK3 in normal NIH-3T3 cells treated with VK3, PVD-NPs, or PD-NPs was also determined through flow cytometry.
Intracellular Drug Release
The intracellular ROS-responsive drug release of PVD-NPs and PD-NPs was investigated through HPLC. For the HPLC study, PC-3 cells were seeded in six-well plates and incubated for 24 h. Then, the cells were treated using PVD-NPs, PVD-NPs + DIC, or PD-NPs (equal to 20 µg/mL PTX) for 8 h, 12 h, or 24 h. After incubation, the cells were washed twice using cold PBS. Subsequently, 200 μL of cell lysis buffer (1% TritonX-100) was added and incubated for 30 min. Then, the cell lysate (400 μL) was mixed with acetonitrile (200 μL) through ultrasonication for drug extraction, followed by centrifugation at 8000 rpm for 10 min. The supernatant was collected and the concentration of active PTX was measured through HPLC.2 The PTX content was normalized to the protein concentrations of the cell lysate. The protein concentration of the cells was measured using a BCA kit.
In vitro Cytotoxicity Study
An MTT assay was employed to evaluate the cytotoxicity of all the drug forms. In brief, PC-3 cells and NIH-3T3 cells were seeded in 96-well plates at a density of 5 × 10³ cells per well for 24 h. Then, the cells were treated with PTX, VK3, PTX + VK3, PVD-NPs, PVS-NPs, or PD-NPs at different concentrations. After incubation for 48 h, 20 µL of MTT solution (5 mg/mL) was added to each well and incubated for another 4 h. Subsequently, the cell medium was replaced with 200 µL of DMSO, and the absorbance was detected at 490 nm using a microplate reader (Thermo Multiclan MK3; Thermo Fisher Scientific, USA).
Hemolysis Assay
Fresh mouse blood was diluted using PBS (pH 7.4), and red blood cells (RBCs) were collected through centrifugation. The RBCs were further diluted using PBS. Then, the RBC suspension was added to the PVD-NP, PVS-NP, and PD-NP solutions, and the concentration of PTX in the nanoparticles ranged from 0.0001 to 1 mg/mL. The mixtures were maintained at 37°C for 2 h after gentle shaking. After that, the mixtures were centrifuged, and the absorbance of the supernatant of each sample was detected using a microplate reader at 540 nm. PBS and TritonX-100 (2%) were used as a negative and positive control, respectively. The hemolysis ratio (HR) of the RBCs was calculated using the following formula:

All hemolysis experiments were carried out in triplicate.
Pharmacokinetics of PVD-NPs and Free PTX
PC-3 tumor-bearing mice were randomly divided into two groups (n = 3 per group) and then intravenously injected with PTX or PVD-NPs at a PTX-equivalent dose of 5 mg/kg. At predetermined times, blood samples were collected and centrifuged at 6000 rpm and 4°C for 10 min, and then 100 µL of the supernatant plasma was mixed with 900 µL of acetonitrile to precipitate all the proteins. After centrifugation, the supernatant was collected and concentrated, and subsequently, the concentration of PTX was determined through HPLC.
PTX Biodistribution in Major Organs and Tumor Tissue
Mice bearing PC-3 tumors were randomly divided into two groups (n = 3) and intravenously injected with PTX or PVD-NPs at a PTX-equivalent dose of 5 mg/kg. After 24 h, all the treatment mice were sacrificed, and the major organs, including the heart, liver, spleen, lung, and kidneys, as well as the tumor were collected and washed using PBS. Subsequently, the organs were homogenized, and PTX was extracted with 200 µL of pre-chilled acetonitrile containing 0.5% acetic acid.24 After centrifugation, the supernatant was concentrated and assessed using HPLC.
Evaluation of in vivo Antitumor Therapy
Mice bearing PC-3 tumors were randomly divided into six groups (n = 6) and intravenously injected with saline, PTX, PTX + VK3, PVD-NPs, PVS-NPs, or PD-NPs at an equivalent PTX injection dose of 5 mg/kg. The treatment was implemented through an intravenous injection once every 3 d.31 The body weight and the tumor volumes were measured at intervals of 3 d. Tumor volumes were calculated by the formula: volume = (L × W2)/2, where L and W are the largest and smallest diameters of the tumor, respectively. After 21 d, the mice were sacrificed, and the major organs or tissues including the heart, liver, spleen, lung, kidney, and tumor tissues were collected and fixed in 4% formaldehyde for histological examination. Hematoxylin and eosin (H&E) staining was performed to evaluate acute toxicity.
Statistical Analysis
All the results are expressed as mean ± standard deviation (SD). The differences among groups were calculated using Student’s t-test or one-way ANOVA. Differences were considered significant when * p<0.05, ** p<0.01, *** p<0.001, respectively.
Results and Discussion
Preparation and characterization of PEG-b-P((LL-g-TK-PTX)-(LL-g-DMA))
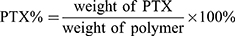
The detailed synthesis route of the pH/ROS dual-responsive prodrug polymer PEG-b-P((LL-g-TK-PTX)-(LL-g-DMA)) is shown in Scheme S1. The PEG-b-PLL was synthesized as reported in our previous study, and the degree of polymerization of lysine was 18.1 Firstly, a ROS-sensitive TK linker was synthesized as previously reported (1H NMR in Figure S1).24 Secondly, TK was reacted with PTX to obtain TK-PTX (1H NMR in Figure S2, mass spectrum in Figure S3). Finally, TK-PTX and DMA were conjugated to the side chain of PEG-b-PLL through an amide reaction to obtain the final product. The 1H NMR spectrum of PEG-b-P((LL-g-TK-PTX)-(LL-g-DMA)) is shown in Figure 1. As shown in the 1H NMR spectrum of PEG-b-P((LL-g-TK-PTX)-(LL-g-DMA)), the characteristic peaks at 1.60, 2.65, and 2.85 ppm were attributed to TK; the typical peaks at 7.3–8.1 ppm were attributed to PTX; the characteristic peaks at 1.8 ppm were attributed to DMA; the representative peaks at 3.6 ppm were ascribed to protons of PEG. These results suggest that TK-PTX and DMA were successfully conjugated to the side chain of PEG-b-PLL. The degree of substitution of DMA on PLL is 67%, as assessed through the peak area of MDA and PEG. The PTX content in PEG-b-P((LL-g-TK-PTX)-(LL-g-DMA)) was calculated as 24.3% (weight ratio) by comparing the peak integration of the phenyl proton of PTX with the PEG methylene proton signal; the content of PTX was measured as 20.3% using a UV spectrophotometer. Because of the relative accuracy of the UV spectrophotometer, we finally chose 20.3% as the content of PTX.
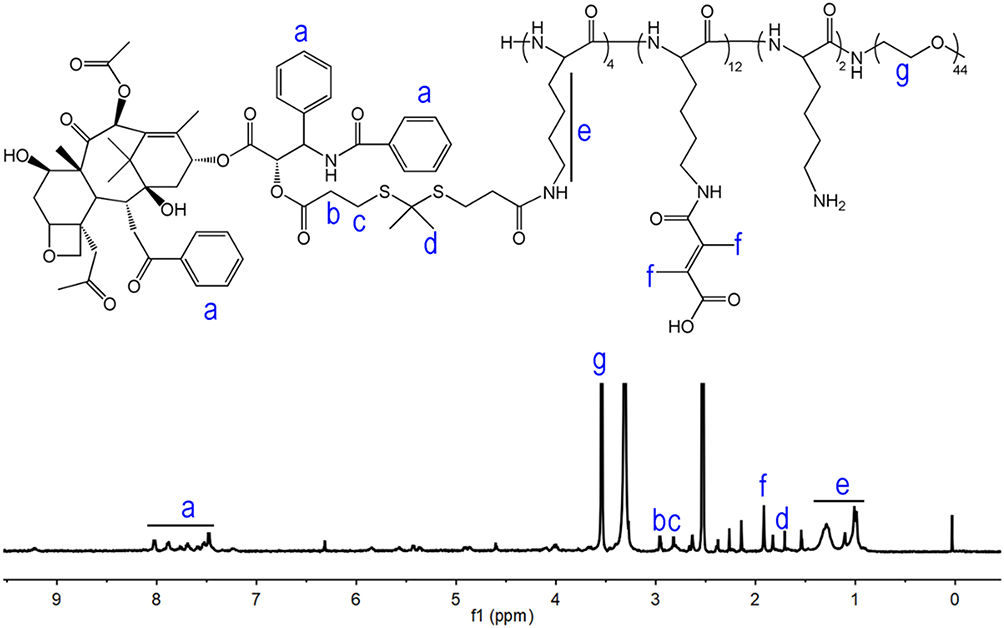 |
Figure 1 The 1H NMR spectrum of PEG-b-P((LL-g-TK-PTX)-(LL-g-DMA)). |
The Characteristics of PVD-NPs
The PTX-loaded charge-reversal PPDDSs (denoted as PD-NPs), PTX and VK3 co-loaded charge-reversal PPDDSs (denoted as PVD-NPs), and the PTX and VK3 co-loaded no-charge-reversal PPDDSs (denoted as PVS-NPs) were prepared through a nano-precipitation method. The characterization data for these three nanoparticle types are shown in Table 1 and Figure 2. The DLC of PTX and VK3 in the PVD-NPs was 9.3 ± 0.9%, and 2.3 ± 0.2%, respectively. Moreover, as shown in Figure 2, the size of the PVD-NPs, PVS-NPs, and PD-NPs in aqueous solution, as measured through DLS, was 123 ± 3.3 nm, 112 ± 3.5 nm, and 105 ± 2.7 nm, respectively. The morphology of the nanoparticles was observed through TEM, and the images showed that all micelles were well-dispersed with a regular spherical shape (Figure 2A–C) and their size was approximately 100 nm, which is consistent with the DLS results (Table 1). A fluorescence assay showed that the PD-NPs had a relatively low critical micelle concentration of 2.8 µg/mL (Figure 2D). Moreover, a stability assay indicated these three nanoparticle types had good structural stability in PBS (pH 7.4), with or without 20% serum (Figure 2E and F). In addition, the hemolysis rate of these nanoparticles at pH 7.4 (blood pH environment) was less than 5% at 0.0001 mg/mL to 1 mg/mL of PTX (Figure S4). These results suggest that these nanoparticles may overcome the dilution effect in blood circulation and could be injected intravenously.5
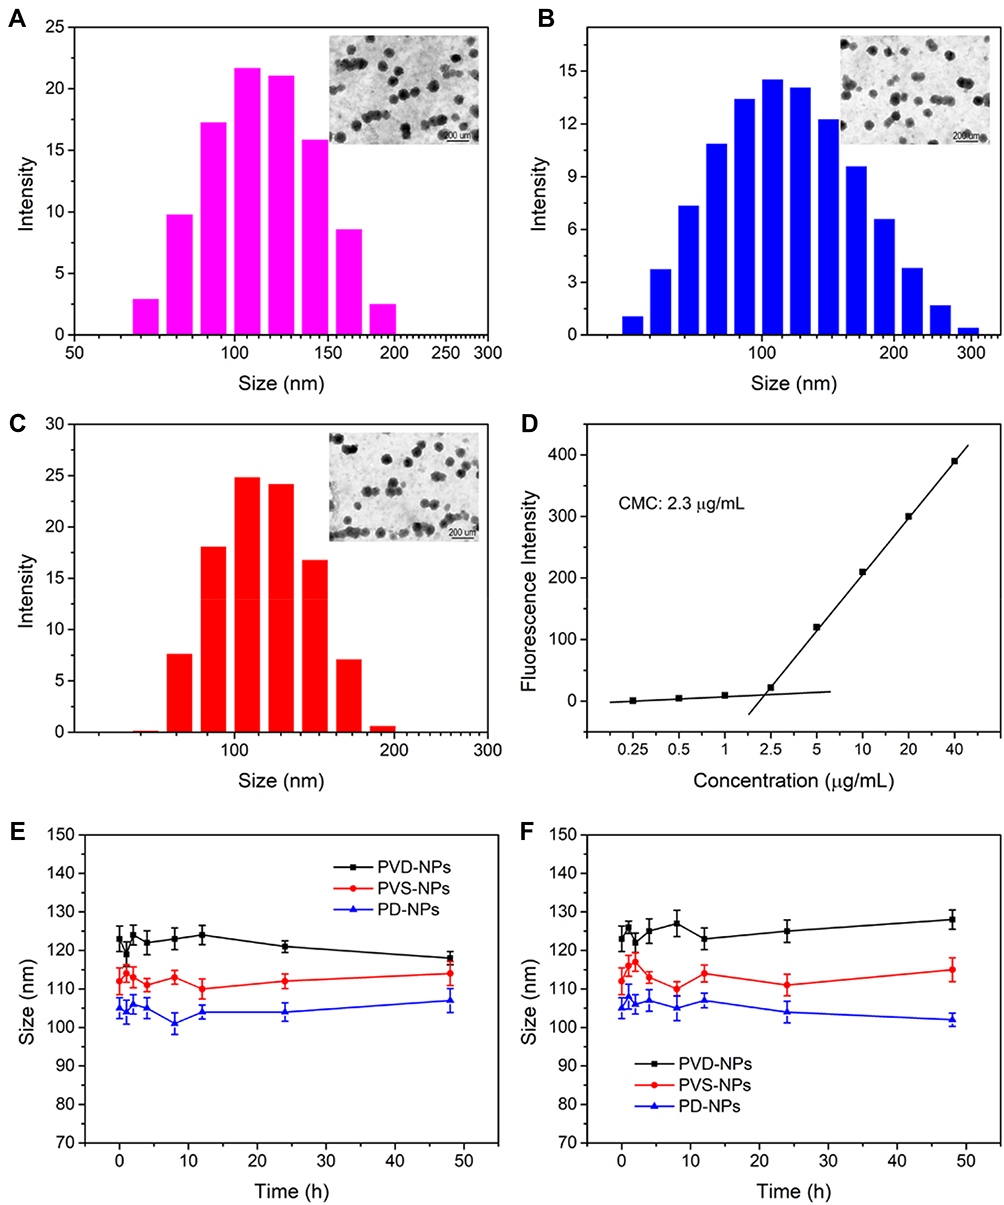 |
Figure 2 Characterization of PVD-NPs, PD-NPs, and PVS-NPs. (A–C) TEM images and size of PVD-NPs (A), PD-NPs (B), and PVS-NPs (C). (D) The critical micelle concentration (CMC) value of PD-NPs. (E–F) The stability of the three PPDDSs in PBS (E) and PBS with 20% FBS (F). Data are shown as mean ± SD, n = 3. |
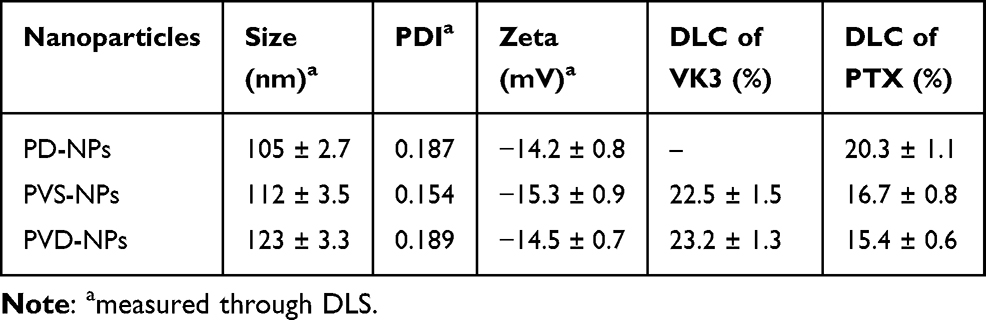 |
Table 1 Characteristics of All Drug-Loaded Nanoparticles |
Surface Charge Conversion Capacity of PVD-NPs
One of the major features of the PVD-NPs is their weakly acidic tumor microenvironment-activated charge-reversal. The changes in the surface charge of the PVD-NPs after incubation at pH 7.4 or 6.5 were measured. As shown in Figure 3A, the surface charge of the PVD-NPs and PVS-NPs remained strongly negative under physiological conditions (pH 7.4) and only slightly changed after incubation for 6 h. However, under weakly acidic conditions, the zeta potential of the PVD-NPs rapidly changed from negative to positive (from −11.3 mV to +12.3 mV) at pH 6.5 within 6 h (Figure 3B). This is ascribed to the hydrolysis of DMA derived amides of PLL in response to the acidic environment.2 However, no significant charge-switchable behavior was observed for the PVS-NPs because the SA group is more stable than DMA, and it is not easily hydrolyzed in a slightly acidic environment.14,15,33 These results indicate that the PVD-NPs had good surface charge conversion capabilities. It is has been reported that NPs with a positive charge can adsorb large amounts of protein.5,10 Therefore, BSA was used as a model protein to investigate the protein adsorption ability of the PVD-NPs. As shown in Figure 3C, only a small quantity of BSA was adsorbed onto the PVD-NPs (9.1%) and the PVS-NPs (8.3%) at pH 7.4 within 12 h. However, more than 80% BSA adsorption was observed for the PVD-NPs at pH 6.5 within 12 h. In comparison, the BSA adsorption of the PVS-NPs at pH 6.5 for the same duration was below 15%. These results were ascribed to the pH-triggered charge-switching of the PVD-NPs. PEG functionalized and negatively charged nanoparticles can minimize nonspecific serum protein absorption and prolong circulation time,34,35 which is consistent with the results of the stability assay (Figure 2E and F). In addition, positively charged NPs can promote cell uptake and subsequent drug accumulation at tumor sites.36 Because of the acidic microenvironment of tumor tissue, the pH-triggered charge-switching of the PVD-NPs could potentially improve drug delivery efficiency.
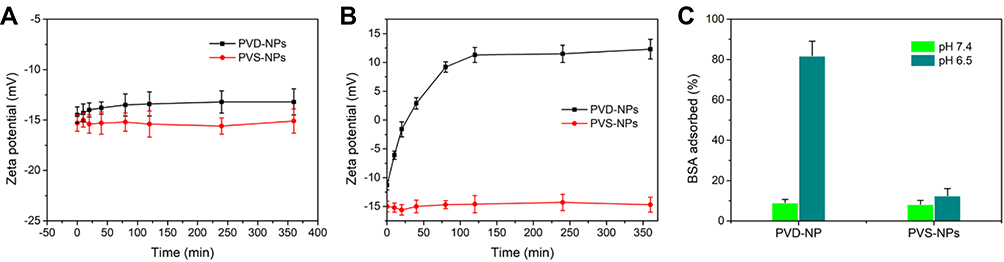 |
Figure 3 (A, B) The surface charge changes of PVD-NPs and PVS-NPs in pH 7.4 (A) and pH 6.5 (B) condition, respectively. (C) Bovine serum albumin (BSA) adsorption of PVD-NPs and PVS-NPs in pH 7.4 and pH 6.5. Data showed mean ± SD, (n = 3). |
Enhanced Cell Uptake of PVD-NPs
In our previous work, we demonstrated that NPs with charge-reversal properties could enhance cell uptake.1 To investigate this phenomenon, PC-3 cells were treated with coumarin-6 loaded PVD-NPs and PVS-NPs at pH 7.4 or 6.5, respectively, and then analyzed through CLSM and flow cytometry. As shown in Figure 4A, the green fluorescence signals of coumarin-6 in PC-3 cells were enhanced with increased incubation time in all treated groups. At pH 7.4, after incubation for the same time, the fluorescence intensity in PVD-NPs and PVS-NPs was not significantly different. However, at the same incubation time, the fluorescence intensity in the PVD-NP group was significantly higher than that in the PVS-NP group at pH 6.5. As shown in Figure 4B, the mean fluorescence intensity (MFI) in PC-3 cells cultured with PVD-NPs and PVS-NPs at pH 7.4 was not significantly different at different incubation times. However, after the pH value decreased to 6.5 (Figure 4C), the MFI in PC-3 cells treated with PVD-NPs was 5.6-, 8.7-, and 6.2-fold higher than that of the PVS-NPs group after culture for 1 h, 2 h, and 4 h, respectively. These results suggest that the response of PVD-NPs to the weakly acid conditions of the tumor microenvironment could enhance their uptake by cancer cells. The surfaces charge of PVD-NPs can switch from negative to positive under acidic conditions, resulting in enhanced PVD-NP attachment to the negatively charged cell membranes.37,38
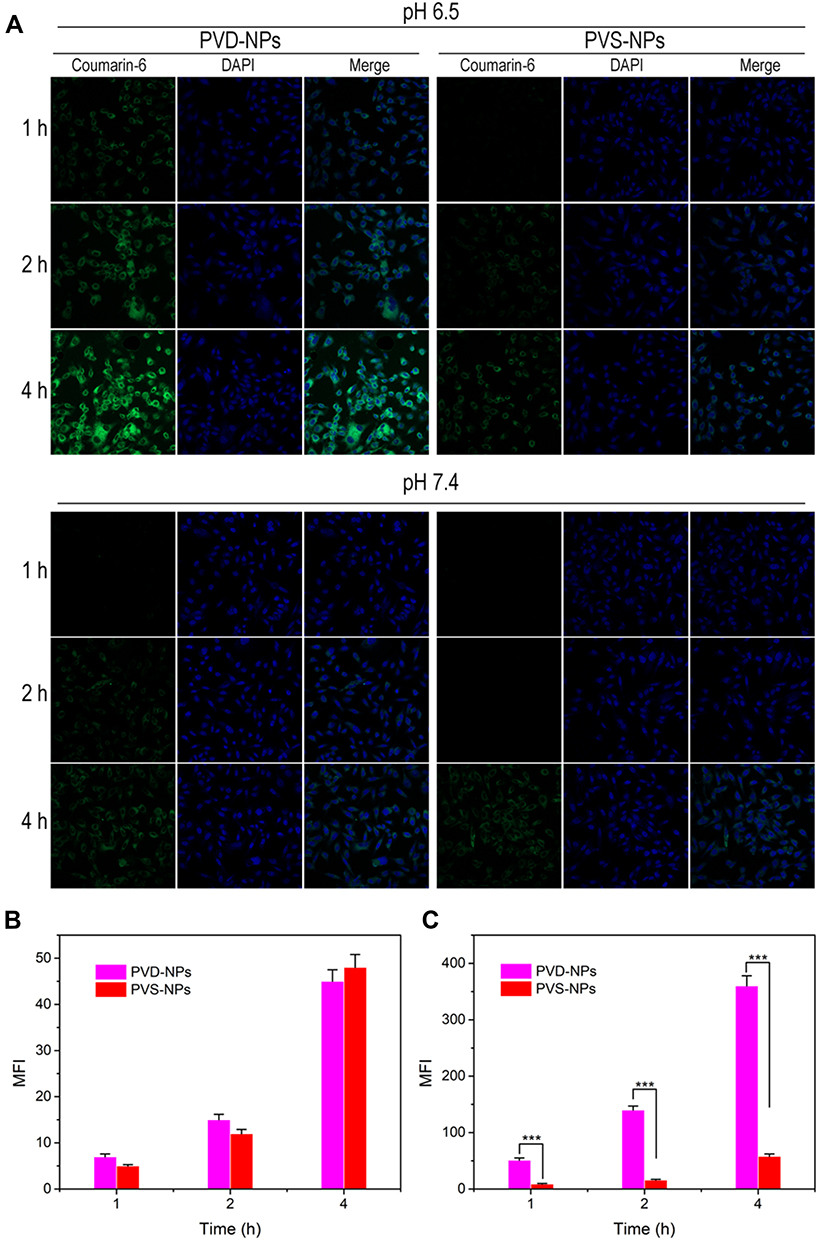 |
Figure 4 Cellular uptake of PVD-NPs and PVS-NPs under various conditions. (A) CLSM images of PC-3 cells after treatment with PVD-NPs and PVS-NPs for 1, 2, or 4 h at pH 7.4 and 6.5, respectively. (B, C) Mean fluorescence intensity (MFI), as assessed through flow cytometry, of coumarin-6 signal of PVD-NPs and PVS-NPs in PC-3 cells after incubation at pH 7.4 or 6.5 for 1, 2, and 4 h, respectively. Data are shown as mean ± SD, n = 3, *** p<0.001. |
ROS-Triggered Drug Release from PVD-NPs
To study the ROS-responsive properties of the PVD-NPs, H2O2 was used to imitate the ROS conditions in cancer cells.39 As shown in Figure 5A and B, after incubation for 48 h in the absence of ROS, there was almost no PTX release from the PVD-NPs, and only 27.2% VK3 release from the PVD-NPs was observed, indicating the good stability of the PVD-NPs. After treatment using 0.1 mM H2O2 for 48 h, approximately 51.3% of the PTX and 66.0% of the VK3 were released from the PVD-NPs. When the H2O2 concentration was increased to 10 mM, the cumulative release of PTX and VK3 increased to 88% and 96%, respectively, at the same time point. These results suggest that the PVD-NPs have good ROS-responsive properties. Moreover, the size changes in the PVD-NPs after treatment using different concentration of H2O2 for 12 h was measured through DLS. As shown in Figure 5C, the size of the PVD-NPs in the absence of H2O2 was approximately 120 nm. However, this rapidly changed to 630 nm in the presence of 10 mM H2O2, and the PDI changed from 0.12 to 0.88, indicating the high sensitivity of the nanoparticles to ROS. The hydrophobic core of the nanoparticles becomes hydrophilic after the dissociation of PTX mediated by ROS, which then induces nanoparticle disassembly.
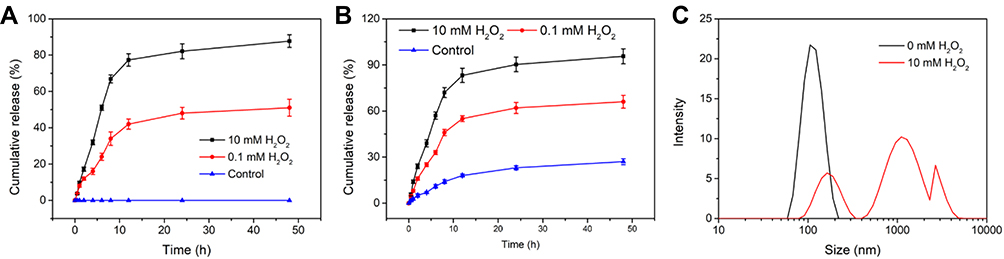 |
Figure 5 (A, B) Cumulative release of PTX (A) and VK3 (B) from PVD-NPs in various concentrations of H2O2. Data are shown as mean ± SD, n = 3. (C) Size changes in PVD-NPs after treatment with various concentrations of H2O2 for 8 h. |
Intracellular ROS-Generation and Self-Amplifying Drug Release
The intracellular ROS-generation and self-amplifying drug release capabilities of the PVD-NPs were investigated in the PC-3 human prostate cancer cell line and the NIH-3T3 non-cancerous cell line, using a DCFH-DA assay, in which non-fluorescent DCFH-DA can be easily oxidized by ROS and produce highly fluorescent 2.7-dichlorofluorescein (DCF).5,39 PC-3 cells treated with VK3, PD-NPs, PVD-NPs, and PVD-NPs with DIC, an NQO1 inhibitor,40 were stained using a DCFH-DA kit, and intracellular ROS production was determined through CLSM and flow cytometry. As shown in Figure 6A, both VK3 and the PVD-NP groups significantly generated ROS compared with the control and PD-NPs groups. PVD-NP treatment resulted in the highest ROS levels, which were 170-fold higher than those of the control group (Figure 6A and B). These results demonstrate the potential ROS production capability of the PVD-NPs in cancer cells. However, the PVD-NP-mediated induction of ROS generation in PC-3 cells was significantly suppressed after the addition of DIC, an NQO1 inhibitor. It was demonstrated that the ROS production ability of PVD-NPs in PC-3 cells was dependent on NQO1. It has been reported that NQO1 is overexpressed 100-fold in cancer cells compared with healthy cells.29,30 For comparison, we investigated the ROS levels in NIH-3T3 cells through flow cytometry. As shown in Figure S5, the MFI in all drug formulation treatment groups in NIH-3T3 cells was significantly lower than that in cancer cells during the same incubation period, demonstrating the limited ROS-generation of VK3 in non-cancerous cells. Therefore, PD-NPs can effectively and selectively induce ROS generation in cancer cells, resulting in intracellular self-amplifiable drug release.
To further verify the intracellular self-amplifiable drug release behavior of the PVD-NPs, active PTX in PC-3 cells after treatment with PVD-NPs and PD-NPs was detected through HPLC. As shown in Figure 6C, after incubation for 8 h, 12 h, and 24 h, the active PTX in the PVD-NPs group was 10.1-, 8.1-, and 7.2-fold higher than that in the PD-NPs group, respectively. Moreover, PTX released from the PVD-NPs in the PC-3 cells was evidently suppressed on adding DIC. This result suggests that the PVD-NPs could effectively realize intracellular self-amplifiable drug release, which was dependent on NQO1.
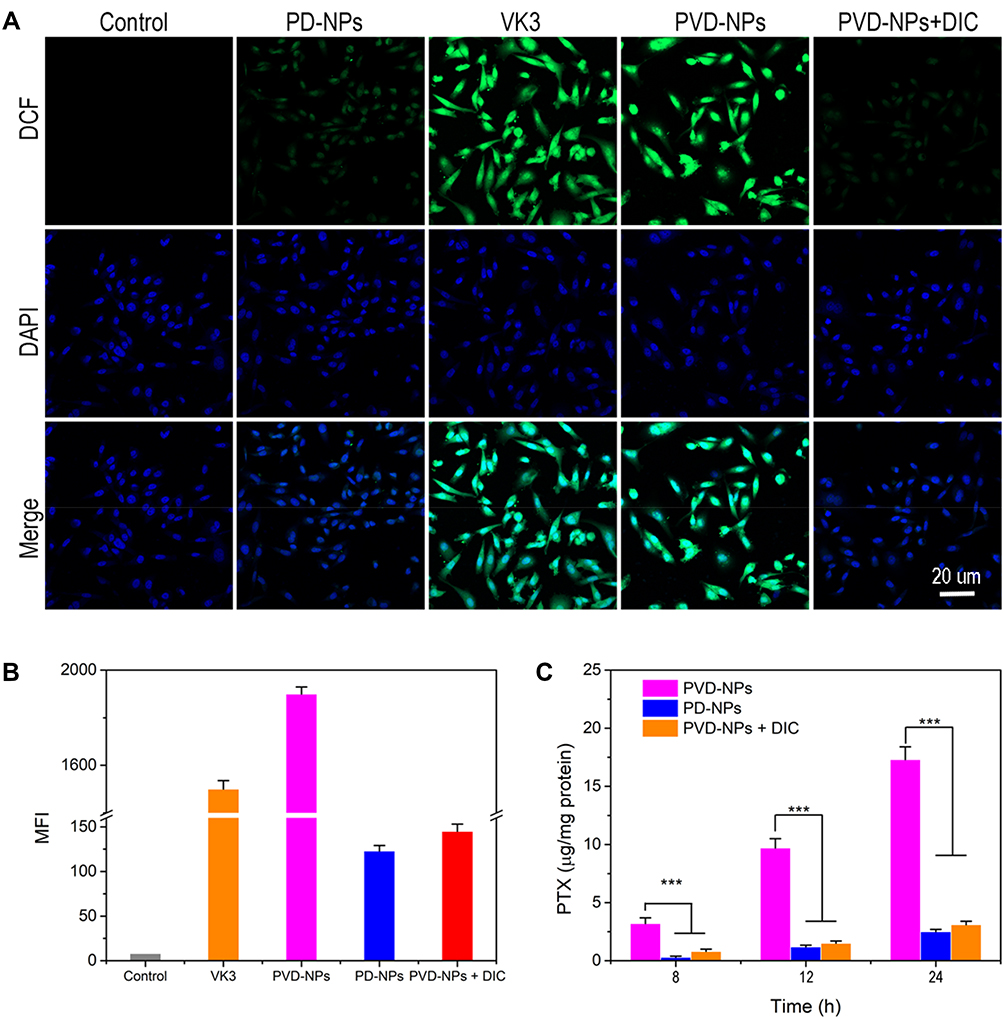 |
Figure 6 Intracellular ROS generation of different drug formulations. (A) CLSM images of ROS levels in PC-3 cells after treatment with PD-NPs, VK3, PVD-NPs, and PVD-NPs + DIC (dicoumarol). (B) Mean fluorescence intensity (MFI), analyzed through flow cytometry, of DCF signal in PC-3 cells after treatment with PD-NPs, VK3, PVD-NPs, and PVD-NPs + DIC. (C) Intracellular active PTX concentration in PC-3 cells after treatment with PVD-NPs, PD-NP, and PVD-NPs + DIC. Data are shown as mean ± SD, n = 3, *** p<0.001. |
In vitro Tumor Specific Cytotoxicity of PVD-NPs
The in vitro cytotoxicity of the PVD-NPs, PD-NPs, and PVS-NPs, as well as the free drugs, was determined through MTT assays in PC-3 cells. Firstly, the cytotoxicity of the free drugs was evaluated. As shown in Figure 7A, the cytotoxicity of PTX combined with VK3 at the relevant weight ratio (approximately 1: 1.5) was not significantly higher than that of free PTX, suggesting a low combination effect for PTX and VK3. Compared with the PD-NPs, the PVD-NPs produced lower cell viability after the introduction of VK3 (Figure 7B). The IC50 value of the PVD-NPs was 4.5-fold lower than that of the PD-NPs (Figure 7E). However, when the PVD-NPs were combined with the NQO1 inhibitor DIC, their cytotoxicity significantly decreased, indicating that NQO1 was critical in promoting PTX release (Figure 7B and E). Considering the low combination effect of PTX and VK3, the high cytotoxicity of the PVD-NPs was not attributed to the combined effect of PTX and VK3, but VK3 could effectively generate ROS when catalyzed by NQO1, resulting in accelerating PTX release and severe cytotoxicity. For comparision, the cytotoxicity of all the drug formulations against NIH-3T3 cells was also determined through MTT. As presented in Figure S6, the cytotoxicity of the PVD-BPs and PD-NPs against NIH-3T3 cells was not significantly different, and it was significantly lower than that against PC-3 cells, indicating cancer cell selectivity. Additionally, the cytotoxicity of the PVS-NPs and the PVD-NPs was not significantly different at pH 7.4 (Figure 7C and E). However, at pH 6.5, the cell viability of the PC-3 cells treated with PVS-NPs was remarkably higher than those in the PVD-NPs group, and the IC50 value of the PVD-NPs at pH 6.5 was 2.6-fold that of the PVS-NPs (Figure 7D and E). These results indicate that the surface charge-reversal of the PVD-NPs could effectively enhance cell uptake and lead to greater cytotoxicity.
 |
Figure 7 In vitro cytotoxicity at 48 h measured using the MTT method. (A) PC-3 cell viability after treatment with PTX, VK3, or PTX + VK3. (B) Cell viability after incubation with PVD-NPs, PD-NPs, and PVD-NPs + DIC, respectively. (C, D) Cell viability after treatment with PVD-NPs and PVS-NPs at pH 7.4 (C) or 6.5 (D), respectively. (E) The IC50 value of all formulations at 48 h. Data are shown as mean ± SD, n = 6, * p<0.05, ** p<0.01. |
In vivo Pharmacokinetics and Biodistribution
As mentioned above, the PVD-NPs were stable in PBS (pH 7.4) with 20% FBS, indicating that they could prolong circulation time. To evaluate this capability, the in vivo pharmacokinetics of the PVD-NPs were measured in PC-3 tumor-bearing mice. As shown in Figure 8A, the PVD-NPs showed great longevity in circulation compared with free PTX over the same period. The t1/2 of PTX was 2.38 h, which was 3.5-fold lower than that of the PVD-NPs. The area under the curve (AUC) of the PVD-NPs was 5.7-times higher than that of PTX. This was attributed to the protection of the PEG layer and the negatively charged surface of the PVD-NPs.5 Prolonged blood circulation could promote nanoparticle accumulation in tumor tissue through the EPR effect.1,2 Therefore, we studied the in vivo biodistribution of the PVD-NPs. As shown in Figure 8B, compared with free PTX, the amount of PVD-NPs in the tumor tissue was increased nearly three-fold, demonstrating that the PVD-NPs could effectively deliver PTX to the tumor tissue through the EPR effect and pH-triggered surface charge-reversal.
In vivo Tumor Inhibition of PVD-NPs
The above experiments demonstrated that the PVD-NPs could effectively accumulate in tumor tissue and be internalized by tumor cells. These advantages were further confirmed by assessing tumor growth inhibition in PC-3 tumor-bearing mice. When the tumor volume reached 100 cm3, the mice were treated with free saline, PTX, PTX + VK3, PVD-NPs, PD-NPs, or PVS-NPs. The tumor volume changes, isolated tumor weight, and tumor inhibition rate are shown in Figure 8C–E. Compared with the saline group, the free PTX and PD-NP groups demonstrated only moderately inhibited tumor growth and the tumor inhibition rate was 38.9% and 50.1%, respectively. Administration of the PVS-NPs resulted in a slightly better inhibition of tumor growth (tumor inhibition rate: 72.2%), while treatment with the PVD-NPs resulted in a more significant suppression (tumor inhibition rate: 83.4%) of tumor growth compared with the PD-NPs or PVS-NPs. The H&E staining results for tumor sections obtained at the end of the treatments are shown in Figure 8G. Compared with the other formulations, the PVD-NPs produced the most efficient suppression of tumor cell proliferation. The potential reasons for this are as follows: 1) the negative surface charge and PEGylation of the PVD-NPs could remarkably prolong their circulation time and lead to increased particle accumulation at the tumor site through the EPR effect; 2) the tumor tissue pH-triggered surface charge-reversal could significantly increase PVD-NP internalization in cancer cells; 3) endogenous ROS could trigger drug release and lead to PVD-NP disassembly, whereupon released VK3 could induce ROS generation, resulting in accelerated drug release and PVD-NP disassembly.41,42 These factors contributed to the superior anti-tumor efficacy of the PVD-NPs.
The in vivo biosafety of the PVD-NPs was also studied. As shown in Figure 8F, the body weight of mice treated with PTX and PTX +VK3 reduced by approximately 20% during treatment. However, mouse body weight in the PVD-NPs, PD-NPs, and PVS-NPs treated groups showed no significant changes during treatment, indicating that the nano-drug formulations could remarkably reduce systemic toxicity. Furthermore, H&E staining of the major organs including the heart, liver, spleen, lung, and kidney also showed that all the formulations produced no distinct damage (Figure S7). These results demonstrate that the PVD-NPs produced no obvious systemic toxicity.
 |
Figure 8 In vivo pharmacokinetics, biodistribution, and anti-tumor effects assay. (A) Pharmacokinetics of PTX and PVD-NPs after intravenous injection into PC-3 tumor-bearing mice at a PTX dose of 3 mg/kg for 48 h. (B) Biodistribution of PTX and PVD-NPs in PC-3 tumor-bearing mice after treatment for 24 h. (C–E) Relative tumor volume (C), extracted tumor weight (D), and tumor inhibition rate (E) of mice after treatment with different formulations. (F) Mouse body weight after treatment with different formulations. (G) H&E staining of tumor sections. The images were acquired at 20× objective. Data represent the mean ± SD (n = 6), * p<0.05, ** p<0.01. |
Conclusion
In summary, we have developed a pH/ROS dual-responsive drug delivery platform (PVD-NPs) with surface charge-reversal and self-accelerating drug release for tumor therapy. PVD-NPs exhibit prolonged circulation time, because their PEGylation and negative surface charge leads to reduced non-specific protein absorption. The response of the PVD-NPs to the acidic tumor microenvironment results in a transformation to a positive surface charge and thereby enhances cancer cell internalization in vivo. Moreover, a high level of NQO1 in cancer cells could catalyze the production of ROS by VK3, resulting in an amplification of drug release, which in turn increases the inhibition of tumor growth and reduces side effects. The current study provides a promising drug release nano-platform with superior tumor therapy efficacy.
Acknowledgments
This study was financially supported by the Talent Health Youth Project of Suzhou city, China (GGRC052) and the Livelihood Technology Project of Soochow (SYS2019012).
Disclosure
The authors report no conflicts of interest in this work.
References
1. Xu C, Song R-J, Lu P, et al. ph-triggered charge-reversal and redox-sensitive drug-release polymer micelles co-deliver doxorubicin and triptolide for prostate tumor therapy. Int J Nanomedicine. 2018;13:7229. doi:10.2147/IJN.S182197
2. Huo Q, Zhu J, Niu Y, et al. pH-triggered surface charge-switchable polymer micelles for the co-delivery of paclitaxel/disulfiram and overcoming multidrug resistance in cancer. Int J Nanomedicine. 2017;12:8631–8647. doi:10.2147/IJN
3. Mao J, Li Y, Wu T, et al. A simple dual-pH responsive prodrug-based polymeric micelles for drug delivery. ACS Appl Mater Interfaces. 2016;8:17109. doi:10.1021/acsami.6b04247
4. Yáñez JA, Wang SWJ, Knemeyer IW, et al. Intestinal lymphatic transport for drug delivery ☆. Adv Drug Deliv Rev. 2011;63:923–942. doi:10.1016/j.addr.2011.05.019
5. Dai L, Li X, Duan X, et al. A pH/ROS cascade-responsive charge-reversal nanosystem with self-amplified drug release for synergistic oxidation-chemotherapy. Adv Sci. 2019;6:1801807. doi:10.1002/advs.v6.4
6. Dai L, Cai R, Li M, et al. Dual-targeted cascade-responsive prodrug micelle system for tumor therapy in vivo. Chem Mater. 2017;29:6976–6992. doi:10.1021/acs.chemmater.7b02513
7. Dai L, Yu Y, Luo Z, et al. Photosensitizer enhanced disassembly of amphiphilic micelle for ROS-response targeted tumor therapy in vivo. Biomaterials. 2016;104:1–17. doi:10.1016/j.biomaterials.2016.07.002
8. Lim C, Sim T, Hoang NH, et al. A charge-reversible nanocarrier using PEG-PLL (-g-Ce6, DMA)-PLA for photodynamic therapy. Int J Nanomedicine. 2017;12:6185–6196. doi:10.2147/IJN.S142912
9. Chen S, Rong L, Lei Q, et al. A surface charge-switchable and folate modified system for co-delivery of proapoptosis peptide and p53 plasmid in cancer therapy. Biomaterials. 2016;77:149–163. doi:10.1016/j.biomaterials.2015.11.013
10. Wu L, Ming W, Lin X, et al. Magnetite nanocluster and paclitaxel loaded charge-switchable nanohybrids for MR imaging and chemotherapy. J Mater Chem B. 2016;5:849–857. doi:10.1039/C6TB02804G
11. Hung CC, Huang WC, Lin YW, et al. Active tumor permeation and uptake of surface charge-switchable theranostic nanoparticles for imaging-guided photothermal/chemo combinatorial therapy. Theranostics. 2016;6:302–317. doi:10.7150/thno.13686
12. Wang Y, Lv S, Deng M, et al. A charge-conversional intracellular-activated polymeric prodrug for tumor therapy. Polym Chem. 2016;7:2253–2263. doi:10.1039/C5PY01618E
13. Yuan YY, Mao CQ, Du XJ, et al. Surface charge switchable nanoparticles based on zwitterionic polymer for enhanced drug delivery to tumor. Adv Mater. 2012;24:5476–5480. doi:10.1002/adma.201202296
14. Han SS, Li ZY, Zhu JY, et al. Dual-pH sensitive charge-reversal polypeptide micelles for tumor-triggered targeting uptake and nuclear drug delivery. Small. 2015;11:2543–2554. doi:10.1002/smll.201402865
15. Li S-X, Liu L, Zhang L-J, et al. Synergetic enhancement of antitumor efficacy with charge-reversal and reduction-sensitive polymer micelles. Polym Chem. 2016;7:5113–5122. doi:10.1039/C6PY00874G
16. Zhao X, Liu P, Song Q, et al. Surface charge-reversible polyelectrolyte complex nanoparticles for hepatoma-targeting delivery of doxorubicin. J Mater Chem B. 2015;3:6185–6193. doi:10.1039/C5TB00600G
17. Zhu J, Niu Y, Li Y, et al. Stimuli-responsive delivery vehicles based on mesoporous silica nanoparticles: recent advances and challenges. J Mater Chem B. 2016;5;1339–1352.
18. York AW, Kirkland SE, Mccormick CL. Advances in the synthesis of amphiphilic block copolymers via RAFT polymerization: stimuli-responsive drug and gene delivery. Adv Drug Deliv Rev. 2008;60:1018–1036. doi:10.1016/j.addr.2008.02.006
19. Ye M, Han Y, Tang J, et al. A tumor-specific cascade amplification drug release nanoparticle for overcoming multidrug resistance in cancers. Adv Mater. 2017;29:1702342. doi:10.1002/adma.201702342
20. Wei X, Liu L, Guo X, et al. Light-activated ROS-responsive nanoplatform codelivering apatinib and doxorubicin for enhanced chemo-photodynamic therapy of multidrug-resistant tumors. ACS Appl Mater Interfaces. 2018;172:83.
21. Li Y, Li Y, Ji W, et al. Positively charged polyprodrug amphiphiles with enhanced drug loading and ROS-responsive release ability for traceable synergistic therapy. J Am Chem Soc. 2018;140:
22. Xu X, Saw PE, Tao W, et al. ROS‐responsive polyprodrug nanoparticles for triggered drug delivery and effective cancer therapy. Adv Mater. 2017;29:1700141. doi:10.1002/adma.v29.33
23. Lee SH, Gupta MK, Bang JB, et al. Current progress in Reactive Oxygen Species (ROS)-responsive materials for biomedical applications. Adv Healthc Mater. 2013;2:908–915. doi:10.1002/adhm.201200423
24. Yuan Y, Liu J, Liu B. Conjugated-polyelectrolyte-based polyprodrug: targeted and image-guided photodynamic and chemotherapy with on-demand drug release upon irradiation with a single light source. Angew Chem. 2014;53:7163–7168. doi:10.1002/anie.201402189
25. Yang -G-G, Zhang H, Zhang D-Y, et al. Cancer-specific chemotherapeutic strategy based on the vitamin K3 mediated ROS regenerative feedback and visualized drug release in vivo. Biomaterials. 2018;185:73–85. doi:10.1016/j.biomaterials.2018.08.065
26. Ren X, Santhosh SM, Coppo L, et al. The combination of ascorbate and menadione causes cancer cell death by oxidative stress and replicative stress. Free Radic Biol Med. 2019;134:350–358. doi:10.1016/j.freeradbiomed.2019.01.037
27. Ivanova D, Zhelev Z, Getsov P, et al. Vitamin K: redox-modulation, prevention of mitochondrial dysfunction and anticancer effect. Redox Biol. 2018;16:352–358. doi:10.1016/j.redox.2018.03.013
28. Russo I, Caroppo F, Alaibac M. Vitamins and melanoma. Cancers. 2015;7:1371–1387. doi:10.3390/cancers7030841
29. Zhang L, Chen Z, Yang K, et al. β-Lapachone and paclitaxel combination micelles with improved drug encapsulation and therapeutic synergy as novel nanotherapeutics for NQO1-targeted cancer therapy. Mol Pharm. 2015;12:3999–4010. doi:10.1021/acs.molpharmaceut.5b00448
30. Huang X, Motea EA, Moore ZR, et al. Leveraging an NQO1 bioactivatable drug for tumor-selective use of poly(ADP-ribose) polymerase inhibitors. Cancer Cell. 2016;30:940. doi:10.1016/j.ccell.2016.11.006
31. Pei Q, Hu X, Zheng X, et al. Light-activatable red blood cell membrane-camouflaged dimeric prodrug nanoparticles for synergistic photodynamic/chemotherapy. ACS Nano. 2018;12:1630–1641. doi:10.1021/acsnano.7b08219
32. Hu YP, Wu CY, Chan WK, et al. Determination of anticancer drug vitamin K3 in plasma by high-performance liquid chromatography. J Chromatogr B Biomed Sci Appl. 1995;666:299. doi:10.1016/0378-4347(94)00572-M
33. Du JZ, Mao CQ, Yuan YY, et al. Tumor extracellular acidity-activated nanoparticles as drug delivery systems for enhanced cancer therapy. Biotechnol Adv. 2014;32:789–803. doi:10.1016/j.biotechadv.2013.08.002
34. Zhou Q, Hou Y, Li Z, et al. Dual-pH sensitive charge-reversal nanocomplex for tumor-targeted drug delivery with enhanced anticancer activity. Theranostics. 2017;7:1806–1819. doi:10.7150/thno.18607
35. Luo Y, Huang L, Yang Y, et al. A programmed nanoparticle with self-adapting for accurate cancer cell eradication and therapeutic self-reporting. Theranostics. 2017;7:1245–1256. doi:10.7150/thno.18187
36. Nagy A, Zane A, Cole SL, et al. Contrast of the biological activity of negatively and positively charged microwave synthesized CdSe/ZnS quantum dots. Chem Res Toxicol. 2011;24:2176–2188. doi:10.1021/tx2003195
37. Zhou Z, Shen Y, Tang J, et al. Charge-reversal drug conjugate for targeted cancer cell nuclear drug delivery. Adv Funct Mater. 2010;19:3580–3589. doi:10.1002/adfm.200900825
38. Chang Y, Huang Z, Jiao Y, et al. pH-induced charge-reversal amphiphile with cancer cell-selective membrane-disrupting activity. ACS Appl Mater Interfaces. 2018;10:21191–21197. doi:10.1021/acsami.8b06660
39. Yin W, Ke W, Chen W, et al. Integrated block copolymer prodrug nanoparticles for combination of tumor oxidative stress amplification and ROS-responsive drug release. Biomaterials. 2019;195:63–74. doi:10.1016/j.biomaterials.2018.12.032
40. Chen M, Gong L, Qi X, et al. Inhibition of renal NQO1 activity by dicoumarol suppresses nitroreduction of aristolochic acid I and attenuates its nephrotoxicity. Toxicol Sci. 2011;122:288–296. doi:10.1093/toxsci/kfr138
41. Hu JJ, Lei Q, Peng M-Y, et al. A positive feedback strategy for enhanced chemotherapy based on ROS-triggered self-accelerating drug release nanosystem. Biomaterials. 2017;128:136–146. doi:10.1016/j.biomaterials.2017.03.010
42. Lv X, Zhu Y, Ghandehari H, et al. An ROS-responsive and self-accelerating drug release nanoplatform for overcoming multidrug resistance. Chem Commun. 2019;55:3383–3386. doi:10.1039/C9CC00358D
 © 2020 The Author(s). This work is published and licensed by Dove Medical Press Limited. The full terms of this license are available at https://www.dovepress.com/terms.php and incorporate the Creative Commons Attribution - Non Commercial (unported, v3.0) License.
By accessing the work you hereby accept the Terms. Non-commercial uses of the work are permitted without any further permission from Dove Medical Press Limited, provided the work is properly attributed. For permission for commercial use of this work, please see paragraphs 4.2 and 5 of our Terms.
© 2020 The Author(s). This work is published and licensed by Dove Medical Press Limited. The full terms of this license are available at https://www.dovepress.com/terms.php and incorporate the Creative Commons Attribution - Non Commercial (unported, v3.0) License.
By accessing the work you hereby accept the Terms. Non-commercial uses of the work are permitted without any further permission from Dove Medical Press Limited, provided the work is properly attributed. For permission for commercial use of this work, please see paragraphs 4.2 and 5 of our Terms.