")
Back to Journals » Journal of Pain Research » Volume 8
A particular effect of sleep, but not pain or depression, on the blood-oxygen-level dependent response during working memory tasks in patients with chronic pain
Authors Elvemo NA, Landrø NI, Borchgrevink PC, Håberg A
Received 25 February 2015
Accepted for publication 3 April 2015
Published 7 July 2015 Volume 2015:8 Pages 335—346
DOI https://doi.org/10.2147/JPR.S83486
Checked for plagiarism Yes
Review by Single anonymous peer review
Peer reviewer comments 4
Editor who approved publication: Dr Michael Schatman
Nicolas A Elvemo,1 Nils I Landrø,2,3 Petter C Borchgrevink,3,4 Asta K Håberg1,5
1Department of Neuroscience, Medical Faculty, Norwegian University of Science and Technology (NTNU), Trondheim, Norway; 2Clinical Neuroscience Research Group, Department of Psychology, University of Oslo, Oslo, Norway; 3Department of Circulation and Medical Imaging, Norwegian University of Science and Technology (NTNU), Trondheim, Norway; 4National Norwegian Advisory Unit for Complex Disorders, St Olav University Hospital, Trondheim, Norway; 5Department of Medical Imaging, St Olav University Hospital, Trondheim, Norway
Background: Patients with chronic pain (CP) are often reported to have deficits in working memory. Pain impairs working memory, but so do depression and sleep problems, which are also common in CP. Depression has been linked to changes in brain activity in CP during working memory tasks, but the effect of sleep problems on working memory performance and brain activity remains to be investigated.
Methods: Fifteen CP patients and 17 age-, sex-, and education-matched controls underwent blood-oxygen-level dependent (BOLD) functional magnetic resonance imaging at 3T while performing block design 0-back, 2-back, and paced visual serial addition test paradigms. Subjects also reported their level of pain (Brief Pain Inventory), depression (Beck Depression Inventory II), and sleep problems (Pittsburgh Sleep Quality Index) and were tested outside the scanner with neuropsychological tests of working memory.
Results: The CP group reported significantly higher levels of pain, depression, and sleep problems. No significant performance difference was found on the neuropsychological tests in or outside the scanner between the two groups. There were no correlations between level of pain, depression, and sleep problems or between these and the neuropsychological test scores. CP patients exhibited significantly less brain activation and deactivation than controls in parietal and frontal lobes, which are the brain areas that normally show activation and deactivation during working memory tasks. Sleep problems independently and significantly modulated the BOLD response to the complex working memory tasks and were associated with decreased brain activation in task-positive regions and decreased deactivation in the default mode network in the CP group compared to the control group. The pain and depression scores covaried with working memory activation.
Discussion: Sleep problems in CP patients had a significant impact on the BOLD response during working memory tasks, independent of pain level and depression, even when performance was shown not to be significantly affected.
Keywords: magnetic resonance imaging, 2-back, serial addition test, deactivation, activation
Introduction
Cognitive complaints are common in patients with chronic pain (CP),1 as well as objectively measured cognitive deficits.2,3 Working memory is often reduced in CP, and the reduction is independent of local analgesia.4 The effect of CP on working memory is moderate and there is considerable discrepancy between studies.5 Furthermore, working memory is affected by depression6 and sleep problems,7 both of which are common in CP patients. Approximately 70% of CP patients are reported to be moderately or severely depressed,8 and/or experience sleep problems.9,10 It has been shown that pain sensitivity is increased by the induction of sad mood in CP11 and by sleep deprivation.12,13 Moreover, sleep deprivation has negative effects on mood,14 and sleep problems are present in the majority of depressed subjects.15 Several prospective studies have also found that sleep problems increase the risk of later CP,16–20 and that restorative sleep is independently associated with later resolution of widespread pain.21 Thus, CP, depression, and sleep problems are closely entwined, and all may affect working memory.
A number of studies have investigated the effect of experimental pain on brain activity during working memory tasks with T2* weighted, blood-oxygen-level dependent (BOLD) functional magnetic resonance imaging (fMRI),22,23 but only one fMRI study has investigated working memory in a group of CP patients.24 In the latter study, patients with chronic fibromyalgia exhibited reduced brain activation relative to controls, and a significant effect of level of depression on brain activity was reported. Since sleep deprivation is also known to reduce BOLD activation in brain regions during working memory tasks in healthy controls (HC),25–31 sleep problems may impact working memory related brain activity in CP patients, but this remains to be studied. Indeed, fMRI studies on working memory in CP patients that simultaneously take into account level of pain, depression, and sleep problems are lacking.
The aim of the current study was to investigate BOLD activation in CP patients compared with HC during different working memory tasks, and to study the relationship between BOLD activation and level of pain, depression, and sleep problems to verify the contribution of each of these to BOLD signal differences.
Methods
The study was approved by the Regional Committee for Medical Research Ethics and the Norwegian Social Sciences Data Service. Written informed consent was obtained from all participants. In addition, all participants were informed personally and in writing that they could withdraw their consent at any time without any consequences. All participants were offered a monetary compensation of 400 NOK and pictures from their morphological brain scan.
Subjects
A total of 20 CP patients (16 females) were recruited from a local university hospital pain clinic. Inclusion criteria for the CP group were ≥6 months with average pain intensity of ≥4 on the Verbal Rating Scale.32,33 An experienced clinician performed the clinical assessment. To minimize external effects on cognition or brain activity, subjects with high consumption of analgesics were excluded (>180 mg codeine or equivalent per 24 hours, 24 hours continuous benzodiazepine treatment, or using carisoprodol). The included subjects were instructed not to consume caffeine and/or nicotine in the hours prior to testing and scanning. No morphological abnormalities were detected in the MRIs of any of the participants.
In addition, a control group of 20 age-, sex-, and education-matched HC (18 females) were recruited from the local community. Exclusion criteria for both CP patients and HC were severe psychiatric disorder and any neurological disorders, including traumatic brain injury (<13 Glasgow Coma Scale at the time of injury) and MRI contraindications. A diagnosis of mild or moderate depression did not warrant exclusion in any of the groups, neither did use of antidepressants. All participants reported being right-handed, and were assessed with the Edinburgh Handedness Inventory34 (CP: 0.82±0.21, range: 0.43–1; HC: 0.91±0.16, range: 0.45–1).
One subject was excluded after previous neurological disease was discovered in the clinical interview. A series of technical problems caused data loss that resulted in the final groups consisting of 15 CP subjects (13 females) and 17 HC subjects (16 females). Of the 15 included patients, ten were classified as having musculoskeletal pain, four idiopathic pain, and one as having visceral pain. None had neuropathic pain.
Pain
Pain intensity was assessed using the validated Norwegian translation35 of the Brief Pain Inventory (BPI).36 Total BPI score was calculated. In BPI, the intensity of pain during the last 24 hours is rated using a numerical rating scale (NRS), where 0 is no pain and 10 is worst imaginable pain. The NRS measure was used as an estimate of individual level of pain at time of the experiment and applied in the fMRI analysis.
Depression
The level of depression was assessed with the validated Norwegian translation37 of the Beck Depression Inventory (BDI) II.38 BDI has been validated in a CP population with BDI Negative Thoughts and BDI Behavior,39 and recommended for use in clinical studies of CP.40 Score on the BDI was used as the level of depression in analyses, and not for diagnosing the presence or absence of clinical depression.
Quality of sleep
The Norwegian validated version41 of the Pittsburgh Sleep Quality Index (PSQI)42 was used to measure the quality of sleep. PSQI is related to the subjective sleep experience rather than objective measures of sleep quality and sleep problems.43 It has been used in a number of studies in patients with CP.44–46 The cut-off value of five was used to differentiate good sleepers from bad sleepers (sensitivity 89.6%, specificity 86.5%).42
Working memory and fMRI task design
The Wechsler Adult Intelligence Scale (WAIS)-III subtests Digit Span and Letter Number Sequencing47 were administered to all subjects. Age-adjusted scores for the groups are reported. While the Digit Span Forward requires basic attention, phonological loop, and short-term memory, the Digit Span Backward, and to a larger extent the Letter Number Sequencing, requires maintaining and updating the information. WAIS-III subtests were performed according to the instructions described by Wechsler.47
For the fMRI experiments, 0- and 2-back (collectively referred to as n-back) plus paced visual serial addition test (PVSAT) paradigms were implemented. The n-back task is one of the more popular paradigms for studying working memory with functional neuroimaging48 and is frequently used.49 The PVSAT is an adapted version of a working memory, attention, and processing speed test used in CP and other patient groups.50 The n-back and PVSAT paradigms test different attention and executive processes: basic attention and the phonological loop (0- and 2-back and PVSAT), updating and maintaining information (2-back and PVSAT), and manipulation of information (PVSAT). The 0-back probes sustained attention and other processes that underlie working memory. The design of the 0/n-back paradigm resembles a Go/No Go-task51 as subjects respond if the current element is identical to a predefined element, and in 66% of the trials the subject has to withhold the response. Reaction time (RT) variability on Go-elements of a Go/No Go-task has been used as a measure of inhibitory efficiency and is sensitive to sleep deprivation.52,53
The n-back and PVSAT paradigms were all block designs. There were six 30 seconds “off” blocks and five 30 seconds “on” blocks for the n-back paradigms. For the PVSAT paradigms, there were eight 30 seconds “off” blocks and seven 30 seconds “on” blocks. In the “off” blocks, participants were instructed to fixate on a white cross in the center of a black screen. In each “on” block in the n-back tasks, 12 numbers were shown for 500 ms with a fixation asterisk lasting for 2,000 ms between the numbers. In the “on” blocks in the PVSAT, 15 numbers were shown for 500 ms with a fixation asterisk lasting for 2,000 ms between the start of each numbers. The n-back and PVSAT tasks were balanced in such a way that the number of correct responses per block was similar for all three paradigms. This was done to ensure that data from the different conditions would later be comparable. The n-back and the PVSAT tasks were programmed, presented, and the subjects’ performance recorded in E-Prime 1.1 (Psychology Software Tools, Inc., Sharpsburg, PA, USA). The paradigm presentation order was randomized and the stimuli presentation order was pseudorandomized. During fMRI scanning, the tasks were displayed on an LCD screen mounted behind the bore opening, and viewed through a mirror mounted on the head coil. All responses were recorded using response buttons from NordicNeuroLab (NNL) (Bergen, Norway). The participants were familiarized with the fMRI paradigms outside the scanner and performed computer-based test versions of each paradigm until full compliance was obtained.
n-back paradigm
The subject was instructed to press a response button every time the number shown was identical to the number preceding it by n steps.54 Subjects were tested with n=0 and n=2, referred to as 0-back and 2-back, respectively. The numbers shown were between 1 and 13. For the 0-back, subjects were instructed to respond by pressing the button whenever the number shown was 7 or 13. Thus, no manipulation of information in working memory was required. For the 2-back condition, the subjects were instructed to press the button whenever they saw a number identical to the one before the previous. Both n-back trials induced button presses 33% of the time if performed correctly.54 n-back tasks are usually performed with letters. Since there is a small, but significant difference between using numbers and letters in an n-back paradigm,55 we used numbers in our n-back task in order to ensure comparability with the PVSAT paradigm.
PVSAT
All participants completed one PVSAT paradigm. In the PVSAT, subjects were shown a series of numbers between 1 and 12 and asked to add every number to the number before it. When the sum was either 7 or 13, the subject was instructed to press the response button. This was done in order to keep the PVSAT comparable to the n-back paradigms with regard to both the response method and the interstimulus intervals, ie, nonverbal button press responses. To ensure that all subjects did indeed add the numbers as instructed, the approach of Mainero et al56 was modified by asking subjects to press the response button every time the sum equaled 7 or 13. Previous research shows that training has a significant effect on Paced Auditory Serial Addition Test (PASAT) scores, partly because experience with the test alleviates frustration and anxiety, which have negative effects on scores.57 With this in mind, all participants received a standardized and thorough explanation of the task adapted from the Gronwall version of PASAT instructions,58 including an out-of-scanner 8-minute PVSAT training session, a set up identical to the fMRI run, but with 12 blocks of 15 numbers, and resting blocks only lasting 10 seconds. The training session paused at 33% and 66% completion, and started again when subjects decided they were ready to continue. The subjects also trained in the scanner before fMRI scanning commenced.
fMRI
Scanning was performed on a 3T Siemens Trio scanner with a 12-channel head matrix coil (Siemens AG, Erlangen, Germany). Foam pads were used to minimize head motion. T2* weighted, BOLD sensitive images were acquired using an echo-planar imaging pulse sequence (repetition time 3,000 ms, echo time 35 ms, field of view 220 mm, slice thickness =2.8 mm, slice number =41, in-plane resolution 2.8×2.8 mm). Each functional run contained either 111 (n-back) or 152 volumes (PVSAT), with slices positioned parallel to the plane through the anterior and posterior commissures. For anatomical reference, one T1 weighted 3D volume was acquired (2,300 ms repetition time, 2.88 ms echo time, 900 ms inversion time, 9° flip angle, 526 mm field of view, 160 slices, 1.2 mm slice thickness, 1.0×1.0 mm in-plane resolution).
Functional image analysis
Imaging data preprocessing and analysis were performed with FSL 4 (FMRIB Software Library; Analysis Group, FMRIB, Oxford, UK). Preprocessing involved brain extraction, motion correction (MCFLIRT), interleaved slice time correction, spatial smoothing (FWHM 6.0 mm), intensity normalization, and high-pass temporal filtering (cut-off 90 seconds). Nonlinear coregistration was performed to the 1 mm Montreal Neurological Institute (MNI) template with a warp resolution of 10 mm. For each paradigm, absolute and relative displacements were calculated for all participants.
Individual runs were analyzed with an uncorrected statistical threshold of P<0.05 in the first level. Intra-individual contrasts in the second level (2-back > 0-back, PVSAT > 0-back, PVSAT > 2-back) were analyzed with fixed effects analysis and an uncorrected statistical threshold of P<0.05. Between-subject differences were first investigated with a threshold of P<0.005 uncorrected and cluster size >20 voxels, which is equivalent to a false discovery rate (FDR) of q<0.05 and suggested for use in fMRI studies with smaller samples.59 Group differences were subsequently assessed with a mixed effects analysis (FLAME1) with pain, depression, and sleep scores as regressors (see Group differences on BOLD activations and impact of level of pain, depression, and sleep). These analyses were also subsequently thresholded with a cluster-corrected Z threshold of Z>3.0 and P<0.05. Stricter statistical thresholds were employed to enable better specification of the locations of activation differences between groups for the different contrasts.
It has been shown that CP,60,61 BDI depression score,62 and sleep deprivation25,29,63,64 can affect cerebral blood flow and/or the BOLD response. BOLD activity in the CP group could thus be significantly affected by level of pain, depression, and/or sleep problems, which could mask or increase group differences in brain activation between the CP and HC groups. To unpack the possible independent contributions of pain, depression, and sleep on brain activity during working memory tasks between the CP and HC group, we combined the three self-report measures (NRS rating, BDI score, and PSQI score), which were uncorrelated (“Results” section), as regressors in a common general linear model. Analyses were run one time for each regressor separately, each time with the two other regressors orthogonalized on the regressor of interest. This was done to establish the presence of a unique contribution to BOLD activity for pain, depression, and sleep scores in the CP and HC groups.
Study protocol
The experimental layout was as follows: day one: BDI and BPI, n-back and PVSAT; day two: PSQI and Wechsler Adult Intelligence Test-III. The testing was separated over 2 days to avoid exhausting the participants.
Statistical analysis
Questionnaires and fMRI behavioral data were analyzed using Excel 2004 (Microsoft Corporation, Redmond, WA, USA) and PASW Statistics 18 (SPSS Inc., Chicago, IL, USA). Results are given as mean ± standard deviation and range where normal distribution applied in both groups. Where results from one or both group were not normally distributed, median and range are reported. Normality was assessed with the Shapiro–Wilk test.
For each fMRI paradigm, correct responses and nonresponses were registered as total scores. Likewise, the total number of errors of commissions, ie, a response when a nonresponse was correct, and the total number of errors of omission, ie, a nonresponse when a response was correct, were calculated. RT was measured from the presentation of new stimulus to the time of first subsequent button press.
Sleep deprivation has been found to increase variability in RT.52,53 Since pain is associated with sleep problems we calculated, for each paradigm, the individual variability in RT over all trials where responses were given. RT variability was assessed with Intra-Individual Coefficient of Variation, which is defined as the standard deviation of individual RT divided by the mean individual RT, after removing all trials where subjects did not respond correctly.27 The RT variability was calculated for each fMRI paradigm and compared between the CP and HC groups.
Two-tailed, unpaired Student’s t-tests with P≤0.05 as a statistical threshold for significance were used on the behavioral data with normal distribution to statically evaluate the differences between the CP and HC groups. For measures that were not normally distributed (NRS, BDI, and PSQI among HC, and the majority of n-back and PVSAT behavioral measures), Independent Mann–Whitney U tests were used. To compare proportions in each group, chi-square test was used. Cohen’s d was calculated and classified as small (d=0.15–0.40), medium (d=0.40–0.75), or large (d>0.75). To evaluate potential relationships between the three self-report measures (NRS, BDI, and PSQI) and also with behavior, a correlation matrix with bivariate Spearman correlation was set up in the CP group. The behavioral data obtained from the three fMRI paradigms (total scores) and the scores of pain, depression, and sleep problem questionnaires were entered into the analysis. Similar correlations were not performed in the HC group due to the limited range in scores. Correlations with a P<0.05, two-tailed, were considered significant.
Results
Demographics
Age, sex distribution, and years of education were not significantly different between the groups (Table 1).
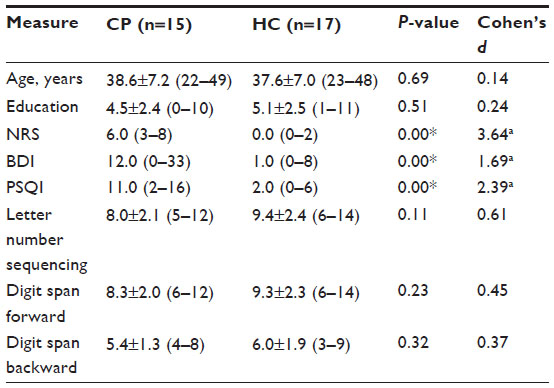 | Table 1 Demographics, level of pain, depression, and sleep quality and working memory performance in 15 chronic pain patients and matched healthy controls |
Subjects reported pain in a nonspecific pattern, both with regard to the localization of the painful areas and areas of maximal pain (Figure 1). Total BPI score was significantly higher in the CP group (45.0, range: 28–81) compared to that in the HC group (2.7, range: 0–16) (P<0.001), as was the average level of pain during the last 24 hours, in the CP group (6.0, range: 3–8) compared to that in the HC group (0.0, range: 0–2) (P<0.0001) (Table 1).
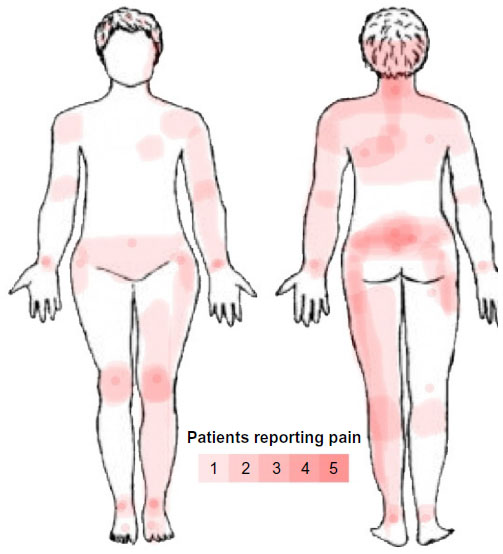 | Figure 1 Body map over pain location in CP group. |
The CP group scored significantly higher on BDI with 12.0 (range: 0–33), compared to the HC group scoring 1.0 (range: 0–8) (P<0.0001) (Table 1). According to a CP-specific BDI cut-off, only two patients had a BDI score that indicated they were likely clinically depressed.8 Three CP patients were on selective serotonin reuptake inhibitors.
The CP group had a significantly higher PSQI score of 11.0 (range: 2–16) compared to 2.0 (range: 0–6) in the HC group (P<0.0001). Indeed, the CP group differed significantly from the HC group on all the sleep problem subscales (P-values between P<0.02 and P<0.001) (Table 1). Furthermore, 86.7% in the CP group were poor sleepers, compared to 5.9% in the HC group (χ2[1] =21.13, P<0.001).
Working memory testing and fMRI task behavior
Analysis of motion correction data showed that there were no significant group differences in maximum absolute or relative displacement during scanning between the CP and HC groups, and also no large effect sizes.
There were no significant group differences on the neuropsychological working memory tests Letter Number Sequencing, Digit Forward or Digit Backward, but there was a medium effect size (Cohen’s d=0.61) for Letter Number Sequencing with lower scores in the CP group (Table 1).
Working memory performance during fMRI did not differ with regard to number of correct responses, errors of commission, errors of omission, average RT or RT variability on any of the fMRI paradigms between the CP and HC groups, although a large effect size was evident for RT variability on the 0-back (Table 2).
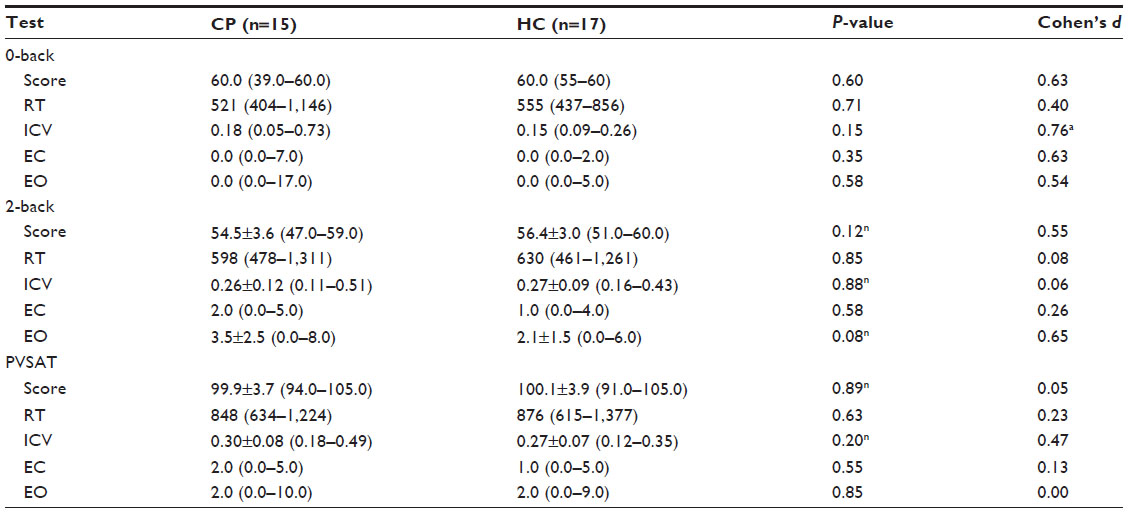 | Table 2 Performance on the fMRI paradigms for chronic pain patients and healthy controls |
There were no significant correlations between pain, depression, sleep, PVSAT-, and n-back scores in either group (CP group results shown in Table 3).
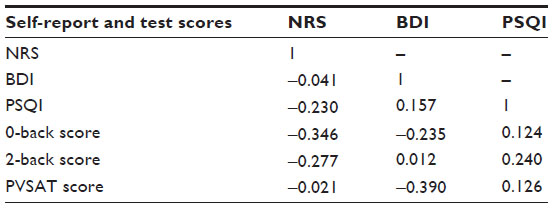 | Table 3 Correlations between working memory test, pain (NRS), depression (BDI), and sleep problems (PSQI) scores in chronic pain patients |
Group differences on BOLD activations and impact of level of pain, depression, and sleep
With FDR q<0.05, significant group differences were present for the 2-back > 0-back, PVSAT > 0-back, PVSAT > 2-back contrast without the three self-report measures as regressors. Differences in activations were found in all brain lobes for both HC > CP and HC < CP. In general, the HC groups had higher Z values and more extensive activations compared with the CP group for the 2-back and PVSAT versus 0-back (Table 4). When including pain, depression, and sleep problem scores as regressors, the number of significantly different voxels was reduced for pain and depression, but markedly increased for sleep problems. Since the areas of increased activation were quite extensive, a stricter statistical threshold (Z>3.0, cluster P≤0.05) was applied to enable better differentiation of the activations resulting from the different analyses. Again, significant group differences were demonstrated for all three contrasts (2-back > 0-back, PVSAT > 0-back, PVSAT > 2-back) for HC > CP and to a limited extent in CP > HC. As expected, the regions with activation differences were similar, but the activations were more confined. Moreover, only sleep scores remained a significant contributor to working memory related differences in brain activity between the CP and HC groups with the stricter statistical threshold. With sleep scores as the main regressor, the HC group had significantly increased activation compared with the CP group, both for the 2-back > 0-back (bilateral lateral occipital cortex, bilateral middle frontal gyrus, right superior frontal gyrus, bilateral paracingulate gyrus, frontal pole, inferior temporal gyrus, and the thalamus) and the PVSAT > 0-back (bilateral lateral occipital cortex, right middle frontal gyrus, bilateral paracingulate gyrus, left precentral gyrus, left supramarginal gyrus, and right inferior frontal gyrus). The HC group also had increased activation in the frontal poles, bilaterally, in the 2-back > PVSAT condition. In addition, PVSAT > 0-back elicited higher activation bilaterally in the medial frontal lobe, in the CP group compared to the HC group. Detailed information on activation differences between the groups for the different contrasts is given in Table 5 and Figure 2. The sleep score related reductions in brain activation in the CP group compared with that in the HC group were found in all regions of the dorsal attention and the frontoparietal control networks for the 2-back > 0-back contrast.65 Several areas in the dorsal attention and frontoparietal control networks also showed reduced activation in the PVSAT > 0-back contrast in the CP group. The regions with decreased activity in the CP compared with the HC group, resulted from less activation, not lack of activation. The increased activation in the CP > HC group for PVSAT > 0-back in the bilateral medial prefrontal gyrus, part of the default mode network,66,67 had a different origin. It stemmed from less deactivation in the CP group compared to the HC group (Figure 3). The CP group thus showed both significantly reduced activation in the dorsal attention and frontoparietal control networks and significantly reduced deactivation in the default mode network compared to controls during more complex working memory tasks that were performed similarly at the behavioral level in the two groups.
 | Table 4 Clusters of significantly increased or decreased activity in the CP versus HC groups during working memory fMRI |
 | Table 5 Localization of maxima of increased and decreased BOLD signal in patients with CP versus HC for working memory tasks with sleep problems as main regressor and pain and depression scores orthogonalized |
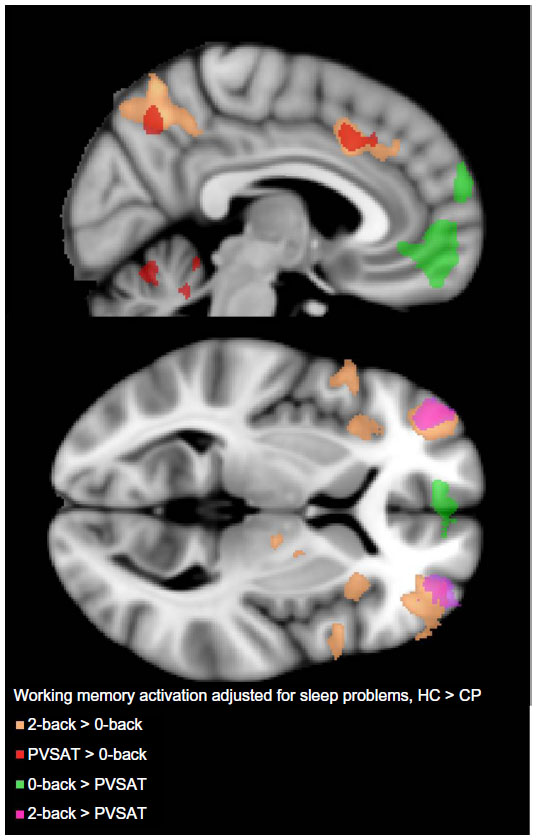 | Figure 2 Between-group differences in working memory activation. |
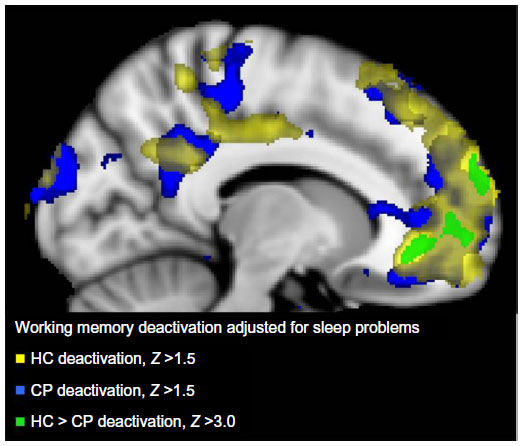 | Figure 3 Brain regions with decreased activation at the whole brain level for contrast 0-back > 2-back with sleep problem score (PSQI), and scores for depression (BDI) and pain (NRS) as orthogonalized covariates in the CP group alone (blue), HC group alone (yellow), and the significant difference between them (HC > CP; green). |
Discussion
The current study demonstrated that working memory performance was similar in the CP group and the matched HC group both for the traditional working memory tests and during fMRI. However, this similar performance was accompanied by areas of both reduced brain activation in the dorsal attention and frontoparietal control networks and deactivation in the default mode network in the CP group. Importantly, the difference in brain activity was explained by sleep problems in the CP group.
The CP and HC groups performed similarly on the working memory tests from WAIS-III and on the fMRI tasks. A lack of significant group differences on cognitive measures is not uncommon in CP studies.5 There was a large effect size for RT variability for the simplest task, 0-back, but not for the 2-back and PVSAT in the CP group. Increased RT variability is often seen in sleep deprivation, and simple rather than more complex tasks are most affected at the behavioral level.68 It should be noted that the CP group was not comparable to controls with total sleep deprivation. The CPs most likely suffered from partial sleep deprivation. In partial sleep deprivation in HC, the behavioral effects increase with time and the degree of deprivation, and significant performance effects are not observed before sleep deprivation reaches 50% of recommended sleep duration.69 The lack of significant effects or correlations between sleep scores and test scores are therefore not unexpected.
Importantly, despite similar performance, there were significant group differences in brain activation during the more complex working memory tests. The between-group differences in the current study are quite similar to those reported in the only other fMRI study of working memory in chronic fibromyalgia patients using an n-back task.24 Furthermore, the increased activity in the HC compared with that in the CP group during the 2-back and PVSAT tasks was located to areas where healthy subjects generally activate on the two tasks.48,70–72
The main finding in this study is that sleep problems contribute independently to the differences in brain activation between the CP and HC group. When using pain or depression scores as primary regressors, the difference in BOLD activations between the CP and HC groups during performance of working memory tasks became smaller (significant impact seen only using the less strict statistical threshold) and not present (with the stricter threshold). This is in line with the Seo et al24 study that reported a negative correlation between pain and depression scores and BOLD activity in frontoparietal regions in chronic fibromyalgia patients. Seo et al24 specifically noted that pain and depression could not fully explain the differences in brain activity between the CP patients and controls. The current study adds to their findings by demonstrating the importance of sleep for differences in brain activity between the CP and HC groups. Sleep problems are as frequent in CP groups referred to specialist pain services as depression, and are found in ~70%.8,9 Still, controlling for sleep in studies in CP is not common. In a meta-analysis of 23 behavioral working memory studies in CP, most of the studies did not control for sleep, which was described as a risk of bias.5 Specifically, the present results demonstrated that sleep problems had an effect on brain activity in the CP group during complex working memory tasks since brain activity differences were increased for 2-back > 0-back and PVSAT > 0-back with sleep scores included in the model and pain and depression scores orthogonalized. Depression and pain scores, on the other hand, covaried similarly with brain activity for 2-back, PVSAT, and 0-back conditions, and with these as main regressors, the differences in brain activity between the HC and CP groups were reduced (for the sensitive statistical threshold) or had no additional impact (with the stricter statistical threshold). Increasing sleep problems were associated primarily with decreased BOLD response in the CP group in the same areas that the HC group activated. Sleep deprivation has previously been demonstrated to reduce working memory related BOLD signal in parietal25–31 and frontal26,27,31 regions in HC, the same regions in which the CP group had lower activation compared with the HC group in the current study. Reduced activation in the frontoparietal areas in the CP group could be explained by reduced cerebral blood flow and glucose metabolism described in previous studies on sleep deprivation in HC.73,74 It is suggested that sleep deprivation causes local populations of neurons to collectively enter a nonrapid eye movement-sleep-like state and stop firing in wake subjects.75 Such “local sleep” could explain reduced cerebral blood flow, glucose metabolism, and BOLD signal. The lower activation implies a reduced ability in the CP group to recruit more neural resources within the task-positive networks with increasing sleep problems. The CP group also displayed lack of deactivation during working memory task performance in medial frontal lobe, part of the default mode network. With increasing sleep problems, an increasing impairment in de-engaging the default mode activity was detected in the CP group. This is in line with previous reports in HC,28,29,76–78 and in chronic back pain patients during a simple attention task.79 Taken together, sleep problems were shown to be connected to both reduced activation of task-positive networks and reduced deactivation of the default mode network during more complex working memory tasks in the CP group.
The areas involved in pain processing, sometimes referred to as the pain neuromatrix, include the primary and secondary somatosensory cortex, insula, anterior cingulate cortex, prefrontal cortex, and thalamus.80 One hypothesis for cognitive impairments in CP is the limited resource hypothesis.3,81 Here, brain activity caused by pain interferes with concurrent cognitive processing relying on the same brain regions. There was overlap between the regions where differences in working memory activations where detected between the CP and HC groups and areas in the pain neuromatrix. Both prefrontal cortex and thalamus had significantly lower activity levels in the CP compared with the HC groups both in the analysis with sleep as main regressor and in the between-group analysis without regressors. However, current pain did not increase activation differences between the CP and HC groups in this study. This may be due to spontaneous pain fluctuations occurring during fMRI scanning in the CP group being more important for brain activity than average pain reported prior to scanning.82 Nevertheless, these results indicated that CP per se affected brain activation rather than the current level of pain. Furthermore, CP may induce changes in the pain neuromatrix, which in turn influences cognitive processing capabilities. However, since the brain activity differences between the CP and HC groups without and with regressors were mostly outside the neuromatrix, other mechanisms appear to be more important for the altered BOLD response in CP than the limited resource hypothesis.
This study has several limitations. First, the CP group had CP of mixed etiology, which reduces the study’s sensitivity to any etiology-specific effects. This design does, however, increase the ecological validity and generalizability of the study’s results to CP patients in general. Moreover, most participants in the CP group were on analgesics and some on opioids, although high-dose users were excluded to avoid strong confounding effects, as opioids increase cerebral blood flow in HC.83 Opioids are known to affect sleep patterns in both healthy subjects and CP84,85 and could therefore influence the results. Similarly, three patients were on antidepressants, which might be a confounder. Exclusion of all patients on opioids or antidepressants would have made it impossible to study the effect of depression, pain, and sleep in the same group of patients, and reduced the ecological validity of the results, while stopping medication would have introduced confounding withdrawal effects and be ethically questionable. Moreover, the small sample size makes it sensitive to type I and type II errors. Relatively strict statistical thresholds were used in the fMRI analysis, while all other statistical analyses were uncorrected for multiple testing. This limits the generalizability of the results before more research is done. Another issue is PSQI as a measure of sleep. PSQI measures subjective sleep quality and habitual patterns of sleep over time, ie, aspects of the sleep–wake experience distinct from objective measures like actigraphy or polysomnography.43 The use of nonobjective measure of sleep problems makes it difficult to pinpoint the exact aspect(s) of the CPs’ sleep cycle, which is disturbed and possibly linked to the observed changes in brain activation. An objective measurement of habitual sleep behavior is very resource-intensive. For a first study of the impact of sleep on working memory performance and brain activity, PSQI is a reasonable compromise.
In conclusion, the current study demonstrated that sleep problems independently and significantly contributed to differences in BOLD activity in the CP group compared with the HC group during complex working memory tasks. The degree of sleep problems was associated with both decreased activation and deactivation in the CP group. These results suggest that working memory problems in CP stem from impaired recruitment of task-positive networks, which normally override the effects of lack of sleep as task complexity increases. This could have implications for future treatment of CP.
Disclosure
The authors report no conflicts of interest in this work.
References
McCracken LM, Iverson GL. Predicting complaints of impaired cognitive functioning in patients with chronic pain. J Pain Symptom Manage. 2001;21(5):392–396. | |
Landrø NI, Fors EA, Våpenstad LL, Holthe Ø, Stiles TC, Borchgrevink PC. The extent of neurocognitive dysfunction in a multidisciplinary pain centre population. Is there a relation between reported and tested neuropsychological functioning? Pain. 2013;154(7):972–977. | |
Moriarty O, McGuire BE, Finn DP. The effect of pain on cognitive function: a review of clinical and preclinical research. Prog Neurobiol. 2011;93(3):385–404. | |
Dick BD, Rashiq S. Disruption of attention and working memory traces in individuals with chronic pain. Anesth Analg. 2007;104(5):1223–1229. [tables of contents]. | |
Berryman C, Stanton TR, Jane Bowering K, Tabor A, McFarlane A, Lorimer Moseley G. Evidence for working memory deficits in chronic pain: a systematic review and meta-analysis. Pain. 2013;154(8):1181–1196. | |
Landrø N. Depressive symptoms account for deficient information processing speed but not for impaired working memory in early phase multiple sclerosis (MS). J Neurol Sci. 2004;217(2):211–216. | |
Nebes RD, Buysse DJ, Halligan EM, Houck PR, Monk TH. Self-reported sleep quality predicts poor cognitive performance in healthy older adults. J Gerontol B Psychol Sci Soc Sci. 2009;64(2):180–187. | |
Poole H, White S, Blake C, Murphy P, Bramwell R. Depression in chronic pain patients: prevalence and measurement. Pain Pract. 2009;9(3):173–180. | |
Pilowsky I, Crettenden I, Townley M. Sleep disturbance in pain clinic patients. Pain. 1985;23(1):27–33. | |
Morin CM, Gibson D, Wade J. Self-reported sleep and mood disturbance in chronic pain patients. Clin J Pain. 1998;14(4):311–314. | |
Tang NKY, Salkovskis PM, Hodges A, Wright KJ, Hanna M, Hester J. Effects of mood on pain responses and pain tolerance: an experimental study in chronic back pain patients. Pain. 2008;138(2):392–401. | |
Lee J, Kim J, Shin H. Effects of sleep deprivation on pain sensitivity in healthy subjects. Sleep Med. 2013;14(2013):e180. | |
Ødegård S, Omland P, Nilsen K, Gravdahl G, Stjern M, Sand T. The effect of two nights of partial sleep restriction on objective and subjective pain measurements. Sleep Med. 2013;14(2013):e256–e257. | |
Durmer JS, Dinges DF. Neurocognitive consequences of sleep deprivation. Semin Neurol. 2005;25(1):117–129. | |
Ohayon MM, Shapiro CM, Kennedy SH. Differentiating DSM-IV anxiety and depressive disorders in the general population: comorbidity and treatment consequences. Can J Psychiatry. 2000;45(2):166–172. | |
Gupta A, Silman AJ, Ray D, et al. The role of psychosocial factors in predicting the onset of chronic widespread pain: results from a prospective population-based study. Rheumatology (Oxford). 2007;46(4):666–671. | |
Miranda H, Viikari-Juntura E, Punnett L, Riihimäki H. Occupational loading, health behavior and sleep disturbance as predictors of low-back pain. Scand J Work Environ Health. 2008;34(6):411–419. | |
Salo P, Oksanen T, Sivertsen B, Hall M, Pentti J, Virtanen M. Sleep disturbances as a predictor of cause-specific work disability and delayed return to work. Sleep. 2010;33:10. | |
Nitter AK, Pripp AH, Forseth KØ. Are sleep problems and non-specific health complaints risk factors for chronic pain? A prospective population-based study with 17 year follow-up. Scand J Pain. 2012;3(4):210–217. | |
Lusa S, Miranda H, Luukkonen R, Punakallio A. Sleep disturbances predict long-term changes in low back pain among Finnish firefighters: 13-year follow-up study. Int Arch Occup Environ Health. 2014;88(3):369–379. | |
Davies KA, Macfarlane GJ, Nicholl BI, et al. Restorative sleep predicts the resolution of chronic widespread pain: results from the EPIFUND study. Rheumatology (Oxford). 2008;47(12):1809–1813. | |
Bingel U, Rose M, Gläscher J, Büchel C. fMRI reveals how pain modulates visual object processing in the ventral visual stream. Neuron. 2007;55(1):157–167. | |
Coen SJ, Aziz Q, Yágüez L, Brammer M, Williams SCR, Gregory LJ. Effects of attention on visceral stimulus intensity encoding in the male human brain. Gastroenterology. 2008;135(6):2065–2074,2074. e1. | |
Seo J, Kim SH, Kim YT, et al. Working memory impairment in fibromyalgia patients associated with altered frontoparietal memory network. PLoS One. 2012;7(6):e37808. | |
Mu Q, Nahas Z, Johnson KA, et al. Decreased cortical response to verbal working memory following sleep deprivation. Sleep. 2005;28(1):55–67. | |
Mu Q, Mishory A, Johnson KA, et al. Decreased brain activation during a working memory task at rested baseline is associated with vulnerability to sleep deprivation. Sleep. 2005;28(4):433–446. | |
Lim J, Choo W-C, Chee MWL. Reproducibility of changes in behaviour and fMRI activation associated with sleep deprivation in a working memory task. Sleep. 2007;30(1):61–70. | |
Choo W-C, Lee W-W, Venkatraman V, Sheu F-S, Chee MWL. Dissociation of cortical regions modulated by both working memory load and sleep deprivation and by sleep deprivation alone. Neuroimage. 2005;25(2):579–587. | |
Chee MWL, Choo WC. Functional imaging of working memory after 24 hr of total sleep deprivation. J Neurosci. 2004;24(19):4560–4567. | |
Bell-McGinty S, Habeck C, Hilton HJ, et al. Identification and differential vulnerability of a neural network in sleep deprivation. Cereb Cortex. 2004;14(5):496–502. | |
Lythe KE, Williams SCR, Anderson C, Libri V, Mehta MA. Frontal and parietal activity after sleep deprivation is dependent on task difficulty and can be predicted by the fMRI response after normal sleep. Behav Brain Res. 2012;233(1):62–70. | |
Apkarian AV, Baliki MN, Geha PY. Towards a theory of chronic pain. Prog Neurobiol. 2009;87(2):81–97. | |
Williamson A, Hoggart B. Pain: a review of three commonly used pain rating scales. J Clin Nurs. 2005;14(7):798–804. | |
Oldfield R. The assessment and analysis of handedness: the Edinburgh inventory. Neuropsychologia. 1971;9(1):97–113. | |
Klepstad P, Loge JH, Borchgrevink PC, Mendoza TR, Cleeland CS, Kaasa S. The Norwegian brief pain inventory questionnaire: translation and validation in cancer pain patients. J Pain Symptom Manage. 2002;24(5):517–525. | |
Cleeland CS. Pain assessment in cancer. In: Osoba D, editor. Effect of Cancer on Quality of Life. Boca Raton, FL: CRC Press; 1991:293–305. | |
Aasen, H. An empirical investigation of depression symptoms: norms, psychometric characteristics and factor structure of the Beck Depression Inventory-II [master’s thesis]. Bergen: University of Bergen; 2001. | |
Beck AT, Steer RA, Brown GK. Beck Depression Inventory Manual. 2nd ed. San Antonio, TX: Psychological Corporation; 1996. | |
Poole H, Bramwell R, Murphy P. Factor Structure of the Beck Depression Inventory-II in patients With chronic pain. Clin J Pain. 2006;22(9):790–798. | |
Dworkin RH, Turk DC, Wyrwich KW, et al. Interpreting the clinical importance of treatment outcomes in chronic pain clinical trials: IMMPACT recommendations. J Pain. 2008;9(2):105–121. | |
Pallesen S, Nordhus IH, Sivertsen BM, Bjorvatn B. Pittsburgh sleep quality index. Tidsskr Nor Psykol. 2005;42:714–717. | |
Buysse DJ, Reynolds CF, Monk TH, Berman SR, Kupfer DJ. The Pittsburgh Sleep Quality Index: a new instrument for psychiatric practice and research. Psychiatry Res. 1989;28(2):193–213. | |
Buysse DJ, Hall ML, Strollo PJ, et al. Relationships between the Pittsburgh Sleep Quality Index (PSQI), Epworth Sleepiness Scale (ESS), and clinical/polysomnographic measures in a community sample. J Clin Sleep Med. 2008;4(6):563–571. | |
Menefee LA, Cohen MJ, Anderson WR, Doghramji K, Frank ED, Lee H. Sleep disturbance and nonmalignant chronic pain: a comprehensive review of the literature. Pain Med. 2000;1(2):156–172. | |
Marin R, Cyhan T, Miklos W. Sleep disturbance in patients with chronic low back pain. Am J Phys Med Rehabil. 2006;85(5):430–435. | |
Naughton F, Ashworth P, Skevington SM. Does sleep quality predict pain-related disability in chronic pain patients? The mediating roles of depression and pain severity. Pain. 2007;127(3):243–252. | |
Wechsler D. Wechsler Adult Intelligence Scale-III (WAIS-III). New York, NY: Psychological Corporation; 1997. | |
Owen AM, McMillan KM, Laird AR, Bullmore E. N-back working memory paradigm: a meta-analysis of normative functional neuroimaging studies. Hum Brain Mapp. 2005;25(1):46–59. | |
Wager TD, Smith EE. Neuroimaging studies of working memory: a meta-analysis. Cogn Affect Behav Neurosci. 2003;3(4):255–274. | |
Wörz R. Pain in depression – depression in pain. Pain Clin Updat. 2003;11(5):1–4. | |
Donders FC. On the speed of mental processing. Acta Psychol (Amst). 1969;30:412–431. | |
Chuah YML, Venkatraman V, Dinges DF, Chee MWL. The neural basis of interindividual variability in inhibitory efficiency after sleep deprivation. J Neurosci. 2006;26(27):7156–7162. | |
Smith ME, McEvoy LK, Gevins A. The impact of moderate sleep loss on neurophysiologic signals during working-memory task performance. Sleep. 2002;25(7):784–794. | |
Braver TS, Cohen JD, Nystrom LE, Jonides J, Smith EE, Noll DC. A parametric study of prefrontal cortex involvement in human working memory. Neuroimage. 1997;5(1):49–62. | |
Knops A, Nuerk H-C, Fimm B, Vohn R, Willmes K. A special role for numbers in working memory? An fMRI study. Neuroimage. 2006;29(1):1–14. | |
Mainero C, Caramia F, Pozzilli C, et al. fMRI evidence of brain reorganization during attention and memory tasks in multiple sclerosis. Neuroimage. 2004;21(3):858–867. | |
Tombaugh TN. A comprehensive review of the Paced Auditory Serial Addition Test (PASAT). Arch Clin Neuropsychol. 2006;21(1):53–76. | |
Strauss E, Sherman E, Spreen O. A compendium of Neuropsychological Tests: Administration, Norms, and Commentary. 3rd ed. New York, NY: Oxford University Press; 2006:1204. | |
Lieberman MD, Cunningham WA. Type I and Type II error concerns in fMRI research: re-balancing the scale. Soc Cogn Affect Neurosci. 2009;4(4):423–428. | |
Wasan AD, Loggia ML, Chen LQ, Napadow V, Kong J, Gollub RL. Neural correlates of chronic low back pain measured by arterial spin labeling. Anesthesiology. 2011;115(2):364–374. | |
Duschek S, Mannhart T, Winkelmann A, et al. Cerebral blood flow dynamics during pain processing in patients with fibromyalgia syndrome. Psychosom Med. 2012;74(8):802–809. | |
Dunn RT, Kimbrell TA, Ketter TA, et al. Principal components of the beck depression inventory and regional cerebral metabolism in unipolar and bipolar depression. Biol Psychiatry. 2002;51(5):387–399. | |
Miyata S, Noda A, Ozaki N, et al. Insufficient sleep impairs driving performance and cognitive function. Neurosci Lett. 2010;469(2):229–233. | |
Schei J, Rector D. Evoked electrical and cerebral vascular responses following sleep deprivation. Prog Brain Res. 2011;193:233–244. | |
Vincent JL, Kahn I, Snyder AZ, Raichle ME, Buckner RL. Evidence for a frontoparietal control system revealed by intrinsic functional connectivity. J Neurophysiol. 2008;100(6):3328–3342. | |
Fox MD, Snyder AZ, Vincent JL, Corbetta M, Van Essen DC, Raichle ME. The human brain is intrinsically organized into dynamic, anticorrelated functional networks. Proc Natl Acad Sci U S A. 2005;102(27):9673–9678. | |
Raichle ME, MacLeod AM, Snyder AZ, Powers WJ, Gusnard DA, Shulman GL. A default mode of brain function. Proc Natl Acad Sci U S A. 2001;98(2):676–682. | |
Harrison Y, Horne JA. The impact of sleep deprivation on decision making: a review. J Exp Psychol Appl. 2000;6(3):236–249. | |
Van Dongen HP, Maislin G, Mullington JM, Dinges DF. The cumulative cost of additional wakefulness: dose-response effects on neurobehavioral functions and sleep physiology from chronic sleep restriction and total sleep deprivation. Sleep. 2003;26(2):117–126. | |
Niendam TA, Laird AR, Ray KL, Dean YM, Glahn DC, Carter CS. Meta-analytic evidence for a superordinate cognitive control network subserving diverse executive functions. Cogn Affect Behav Neurosci. 2012;12(2):241–268. | |
Tüdsö Z, Hok P, Hrdina L, Hluštík P. Modality effects in paced serial addition task: differential responses to auditory and visual stimuli. Neuroscience. 2014;272:10–20. | |
Lazeron RH, Rombouts SA, de Sonneville L, Barkhof F, Scheltens P. A paced visual serial addition test for fMRI. J Neurol Sci. 2003; 213(1–2):29–34. | |
Thomas M, Sing H, Belenky G, et al. Neural basis of alertness and cognitive performance impairments during sleepiness. I. Effects of 24 h of sleep deprivation on waking human regional brain activity. J Sleep Res. 2000;9(4):335–352. | |
Poudel G, Innes C, Jones R. Cerebral perfusion differences between drowsy and nondrowsy individuals after acute sleep restriction. Sleep. 2012;35(8):1085–1096. | |
Vyazovskiy V, Olcese U, Hanlon E, Nir Y. Local sleep in awake rats. Nature. 2011;472(7344):443–447. | |
Chee MWL, Chuah YML. Functional neuroimaging and behavioral correlates of capacity decline in visual short-term memory after sleep deprivation. Proc Natl Acad Sci U S A. 2007;104(22):9487–9492. | |
Sämann PG, Tully C, Spoormaker VI, et al. Increased sleep pressure reduces resting state functional connectivity. MAGMA. 2010; 23(5–6):375–389. | |
De Havas JA, Parimal S, Soon CS, Chee MWL. Sleep deprivation reduces default mode network connectivity and anti-correlation during rest and task performance. Neuroimage. 2012;59(2):1745–1751. | |
Baliki MN, Geha PY, Apkarian AV, Chialvo DR. Beyond feeling: chronic pain hurts the brain, disrupting the default-mode network dynamics. J Neurosci. 2008;28(6):1398–1403. | |
Apkarian AV, Bushnell MC, Treede R-D, Zubieta J-K. Human brain mechanisms of pain perception and regulation in health and disease. Eur J Pain. 2005;9(4):463–484. | |
Eccleston C, Crombez G. Pain demands attention: a cognitive-affective model of the interruptive function of pain. Psychol Bull. 1999;125(3):356–366. | |
Apkarian AV, Krauss BR, Fredrickson BE, Szeverenyi NM. Imaging the pain of low back pain: functional magnetic resonance imaging in combination with monitoring subjective pain perception allows the study of clinical pain states. Neurosci Lett. 2001;299(1–2):57–60. | |
Lorenz IH, Kolbitsch C, Hörmann C, et al. The influence of nitrous oxide and remifentanil on cerebral hemodynamics in conscious human volunteers. Neuroimage. 2002;17(2):1056–1064. | |
Dimsdale JE, Norman D, DeJardin D, Wallace MS. The effect of opioids on sleep architecture. J Clin Sleep Med. 2007;3(1):33–36. | |
Rose AR, Catcheside PG, McEvoy RD, et al. Sleep disordered breathing and chronic respiratory failure in patients with chronic pain on long term opioid therapy. J Clin Sleep Med. 2014;10(8):847–852. |
 © 2015 The Author(s). This work is published and licensed by Dove Medical Press Limited. The full terms of this license are available at https://www.dovepress.com/terms.php and incorporate the Creative Commons Attribution - Non Commercial (unported, v3.0) License.
By accessing the work you hereby accept the Terms. Non-commercial uses of the work are permitted without any further permission from Dove Medical Press Limited, provided the work is properly attributed. For permission for commercial use of this work, please see paragraphs 4.2 and 5 of our Terms.
© 2015 The Author(s). This work is published and licensed by Dove Medical Press Limited. The full terms of this license are available at https://www.dovepress.com/terms.php and incorporate the Creative Commons Attribution - Non Commercial (unported, v3.0) License.
By accessing the work you hereby accept the Terms. Non-commercial uses of the work are permitted without any further permission from Dove Medical Press Limited, provided the work is properly attributed. For permission for commercial use of this work, please see paragraphs 4.2 and 5 of our Terms.