")
Back to Journals » Cancer Management and Research » Volume 11
A panel of collagen genes are associated with prognosis of patients with gastric cancer and regulated by microRNA-29c-3p: an integrated bioinformatics analysis and experimental validation
Authors Zhang QN, Zhu HL, Xia MT, Liao J, Huang XT, Xiao JW , Yuan C
Received 15 December 2018
Accepted for publication 5 May 2019
Published 24 May 2019 Volume 2019:11 Pages 4757—4772
DOI https://doi.org/10.2147/CMAR.S198331
Checked for plagiarism Yes
Review by Single anonymous peer review
Peer reviewer comments 3
Editor who approved publication: Dr Beicheng Sun
Qiang-Nu Zhang,1,* Hui-Li Zhu,1,* Meng-Ting Xia,2,* Juan Liao,1 Xiao-Tao Huang,2 Jiang-Wei Xiao,3 Cong Yuan2
1Department of Gastroenterology, West China School of Public Health and West China Fourth Hospital, Sichuan University, Chengdu 610041, People’s Republic of China; 2Department of Gastroenterology, the Affiliated Hospital of North Sichuan Medical College, Nanchong 637000, Sichuan, People’s Republic of China; 3Department of Gastrointestinal Surgery, the Affiliated Hospital of North Sichuan Medical College, Nanchong 637000, People’s Republic of China
*These authors contributed equally to this work
Background: The systematic expression characteristics and functions of collagen genes in gastric cancer (GC) have not been reported. Through public data integration, combined with bioinformatics analysis, we identified a panel of collagen genes overexpressed in GC. The functions of these genes were analyzed and validated in a GC-related cohort. microRNAs that may potentially target such genes were investigated in vitro.
Methods: Four GC-related datasets retrieved from the Gene Expression Omnibus (GEO) were used to extract differentially expressed genes (DEGs) in GC. Functional annotation was performed to identify the potential roles of the identified DEGs. The association of candidate genes involved in the prognosis of GC patients (n=876) was determined using data provided by the Kaplan–Meier-plotter database, The Cancer Genome Atlas Stomach Adenocarcinoma (TCGA-STAD) repository, and a GC-related dataset (GSE15459). The expression characteristics of candidate genes and their associations with clinical parameters were validated in our in-house cohort (n=58). MicroRNAs able to target the identified candidate genes were predicted and confirmed using qRT-PCR, Western blotting, and dual-luciferase reporter assays in vitro.
Results: After the integration of four GEO datasets, 76 DEGs were identified. Gene Ontology and Kyoto Encyclopedia of Genes and Genomes pathway analysis indicated that these DEGs were significantly enriched in ECM-related functions and pathways. A group of collagen genes was significantly upregulated in the GC tissues and constituted a protein–protein interaction network as important nodes. Some of these collagen genes were closely associated with poor prognosis in GC patients. Overexpression of COL1A1 and COL4A1 was confirmed in our in-house cohort, and this was related to prognosis and certain clinicopathological parameters. We found that microRNA-29c-3p could directly target COL1A1 and COL4A1 in BGC-823 cells.
Conclusions: Collagen genes identified in this study were associated with patient prognosis in GC and may represent diagnostic markers or potential therapeutic targets. Aberrant expression of such candidate genes may be induced by microRNA-29c-3p.
Keywords: gastric cancer, collagen, prognosis, microRNA-29c-3p, COL1A1, COL4A1
Introduction
Gastric cancer (GC) ranks as the fourth most incident and the second most common cause of cancer-associated deaths worldwide.1 Because of routine early screening, such as endoscopic examinations, and recent advances in treatment techniques, long-term survival rates have improved. However, in developing countries, most GC patients are diagnosed at an advantage stage, with poor prognosis.2 Therefore, further studies should still be emphasized for the early detection and targeted therapy of GC. Numerous genes and complicated regulatory networks play pivotal roles in the initiation and development of GC.3 The popularity of high-throughput techniques such as microarray and RNA sequence analysis combined with the development of bioinformatics tools and resources has greatly facilitated research involving gene profile alterations, and such approaches have offered significant benefits in terms of the early diagnosis, treatment, and prognosis of GC patients.4
In the present study, we performed an integrated analysis based on four independent GC microarray datasets and the Cancer Genome Atlas Stomach Adenocarcinoma (TCGA-STAD) dataset to identify gene profile changes in GC. Interestingly, a group of collagen-family genes was revealed to be simultaneously upregulated in GC tissues. Analyses involving the Gene Ontology (GO) and Kyoto Encyclopedia of Genes and Genomes (KEGG) resources indicated the involvement of these collagen genes in the regulation of extracellular matrix (ECM) homeostasis. Previous studies have shown that ECM is typically deregulated in cancer and participates in malignant cell proliferation, adhesion, migration, and angiogenesis and drug metabolism.5,6 Because collagen is the main component of ECM, abnormalities involving it and its related genes have been frequently reported in various forms of cancer. For instance, increased expression of several collagen genes (COL1A1, COL5A2, COL12A1, and COL17A1) induces drug resistance in ovarian cancer cells.7 Zhang et al reported overexpression of COL1A1 in colorectal cancer and suggested that COL1A1 promotes metastasis by regulating the WNT/PCP pathway.8 Liu et al reported that COL5A1 induces metastasis in lung adenocarcinoma.9 Based on this evidence, we hypothesized that this panel of collagen genes play roles in the progression of GC. First, we analyzed the association of these collagen genes with prognosis of GC patients using public archives. Second, the results were validated in our in-house GC patient cohort. Finally, we found that these collagen genes may be targeted by microRNA-29c-3p and confirmed this to be the case in vitro.
Materials and methods
Detection of differentially expressed genes (DEGs) in GC tissues from public databases
Four GC-related microarray datasets (GSE13861, GSE27342, GSE54129, and GSE63089) were retrieved from the GEO database (
Functional annotation of DEGs
To reveal the biological functions and related pathways involving these overlapping DEGs, functional enrichment analysis was performed using online bioinformatics tools provided by the Database for Annotation, Visualization and Integrated Discovery (DAVID,
Survival analysis for candidate genes using public data
To better understand the roles of candidate genes (COL10A1, COL1A1, COL1A2, COL3A1, COL4A1, COL5A2, and COL6A3) in the prognosis of GC patients, survival analysis was performed using clinical data of 876 GC patients using the Kaplan–Meier-plotter database (
Patients and tissue specimens
To validate the results obtained from public data, the expression of candidate genes (COL1A1 and COL4A1) and their association with clinical parameters were analyzed in our in-house cohort. Fifty-eight matched gastric adenocarcinoma and adjacent non-tumor tissues were collected from patients undergoing surgical resection at the Affiliated Hospital of North Sichuan, China, from December 2009 to May 2012. The diagnosis of GC was confirmed by pathological examination. No patients had received anti-tumor therapy prior to surgery. Tissue samples were harvested and frozen at −80°C. In the present study, samples were collected after obtaining patient’s written informed consent. The ethics committee of the Affiliated Hospital of North Sichuan approved this study. This study was conducted in accordance with the Declaration of Helsinki.
Immunohistochemistry (IHC)
Tissue samples were routinely fixed and embedded in paraffin and sectioned into 5-mm thick slices. IHC was performed to detect COL1A1 and COL4A1 using a Dako Envision System (Dako, Denmark) according to the manufacturer’s protocol.
RNA extraction and real-time quantitative PCR
Total RNA from tissue samples was extracted using the TRIzol™ reagent (Thermo Fisher Scientific, MA, USA). After quality control, total RNA was reverse transcribed into cDNA using the PrimeScript™ RT reagent kit (Takara Biomedical Technology, Beijing, China). cDNA templates were amplified and quantified using the SYBR® Premix Ex Taq™ Reagent Kit (Takara Biomedical Technology, Beijing, China). All PCR conditions and reaction systems were prepared and conducted according to the manufacturer’s instructions. Primers for COL1A1 were 5′-GCCAAGACGAAGACATCCCA-3′ (forward) and 5′-GCACCATCATTTCCACGAGC-3′ (reverse) and those for COL4A1 were 5′-GTCTCCGCTTGGAGCCG-3′ (forward) and 5′-CTCTCCCCCTTTGTGCCATT-3′ (reverse). GAPDH was used as a reference for normalization. Primers for GAPDH were 5′-GTCTCCTCTGACTTCAACAGCG-3′ (forward) and 5′-ACCACCCTGTTGCTGTAGCCAA-3′ (reverse). The 2–∆∆Ct method was used to calculate the relative levels of expression of target genes.
Cell culture and transfection
Human gastric adenocarcinoma BGC-823 cells were obtained from the American Type Culture Collection (Manassas, VA, USA). Cells were cultured in RPMI-1640 supplemented with 10% fetal bovine serum and penicillin-streptomycin. Cells were maintained at 37°C in a 5% CO2 Atmosphere. To upregulate the expression of microRNA-29c-3p in BGC-823 cells, microRNA-29c-3p mimics, or a negative control sequence, were transfected into cells using the Lipofectamine® RNAimax kit (Thermo Fisher Scientific, MA, USA). To knock-down the expression of COL1A1 and COL4A1 in BGC-823 specific siRNA sequneces (COL1A1-siRNA and COL4A1-siRNA) were transfected into cells using Lipofectamine® RNAimax kit. To upregulate the expression of COL1A1 and COL4A1 expression vectors were constructed based on pcDNA3.1 and transfected into cells using Lipofectamine® 2000 Kit. Empty plasmids served as negative control.
Cell proliferation assay
BGC-823 cells were seeded into 96-well plates 24 hrs after transfection. Cell proliferation was determined based on metabolic activity using CellTiter-Blue® Cell Viability Assay kit. Measurement was performed at 24, 48, and 96 hrs after seeding according to the procedures manual from manufacturer. The relative proliferation was calculated by formula: Relative proliferation= cell viability (other time point)/cell viability (24 hrs).
Western blotting
Total protein was isolated from the transfected BGC-823 cells using RIPA reagent containing a protease inhibitor cocktail. The concentration of protein samples was measured using a BSA assay kit and heated in 4× loading buffer at 96°C for 8 mins. A total of 30 μg of protein was separated on 12% SDS-PAGE gels at 90 V for 2.0 hrs and then transferred to nitrocellulose membranes. After blocking with 5% milk, membranes were incubated with rabbit anti-COL1A1 (LifeSpan BioSciences, WA, USA), rabbit anti-COL4A1 (LifeSpan BioSciences), or rabbit anti-GAPDH (Abcam Plc, UK) antibodies, followed by incubation with HRP-labeled anti-rabbit lgG antibody (Abcam Plc). Protein bands were detected using an ECL chemiluminescence kit (Beyotime Co., Ltd, China).
Dual-luciferase reporter assay
A luciferase assay system (Promega Corporation, Shanghai, China) was used to confirm the target relationship between miR-29c-3p and COL1A1. Briefly, the wildtype 3′-UTR sequence of COL1A1 containing a miR-29c-3p binding site and a mutant 3′-UTR sequence of SIRT1 were inserted into PsiCHECK2 luciferase reporter vectors (PsiCHECK2 - COL1A1 3′-UTR-Wt and PsiCHECK2- COL1A1 3′-UTR-Mut). Similar PsiCHECK2 plasmids were prepared for COL4A1. PsiCHECK2 vectors were co-transfected with miR-29c-3p mimic, or mimic negative control, into BGC-823 cells. The cells were harvested, and relative luciferase activity (activity of firefly luciferase/activity of renilla luciferase) was detected.
Statistical analysis
Statistical analysis of data was performed with IBM® SPSS statistical software package (19.0). Normally distributed data were expressed as mean±standard deviation ( x ± SD). Mean values between two groups were compared using Student’s t-test. Clinicopathological variables involving the in-house cohort were analyzed by Chi-square test. P<0.05 was considered statistically significant.
Results
DEGs involved in the occurrence of GC
Four eligible GC microarray datasets (GSE13861, GSE27342, GSE54129, and GSE63089) were included, and 301 tumor tissues and 165 tumor-adjacent normal tissue samples were enrolled in the integrated analysis. The numbers of DEGs (fold change >2 or <0.5, P<0.05) involving tumor and tumor-adjacent normal tissues in each dataset are shown in the Venn diagram (Figure 1A). The results for the four datasets were intersected, and 76 overlapping DEGs (34 upregulated and 42 downregulated genes, Table S1) were identified as candidate genes involved in the occurrence of GC (Figure 1B).
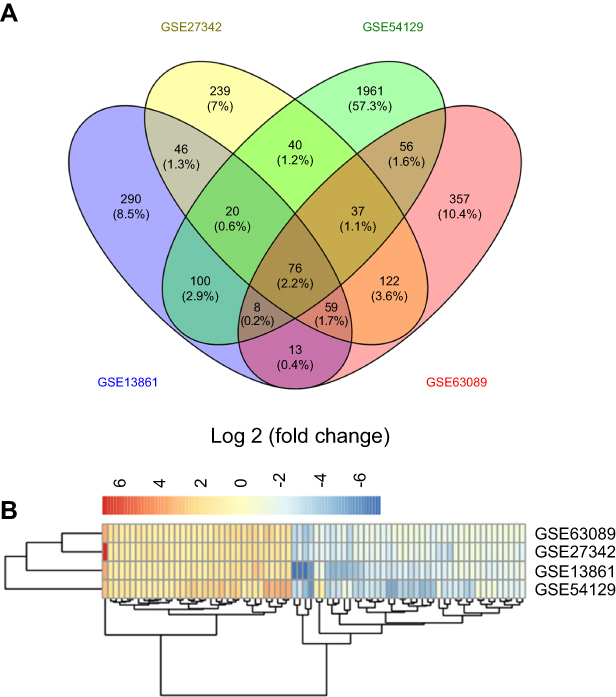 | Figure 1 Differently expressed genes in gastric cancer tissues compared with non-tumor tissues. (A) Seventy-six differently expressed genes were identified after integrating results obtained from four GEO gastric cancer-related dataset; (B) Heatmap displays the expression level of 76 differently expressed genes between tumor tissues and non-tumor tissues in four GEO gastric cancer-related dataset. |
GO and KEGG analysis of DEGs
To explore the potential biological functions of the 76 DEGs in the pathogenesis of GC, functional enrichment analysis based on GO and KEGG pathway databases was conducted. As shown in Figure 2A–C, the DEGs were mainly enriched in collagen- or extracellular matrix-related GO terms. For biological process, the DEGs were more significantly enriched for terms involving “collagen catabolic process”, “extracellular matrix organization”, “extracellular matrix disassembly”, and “collagen fibril organization”. For “cellular component”, terms regarding “extracellular space”, “extracellular region”, “collagen trimer”, and “proteinaceous extracellular matrix” were mainly involved. The molecular function terms indicated that these DEGs were largely related to “platelet-derived growth factor binding”, and “extracellular matrix structural constituent”. According to the KEGG database, the DEGs were mainly enriched for extracellular matrix–receptor interactions, protein digestion, and focal adhesion (Figure 2D).
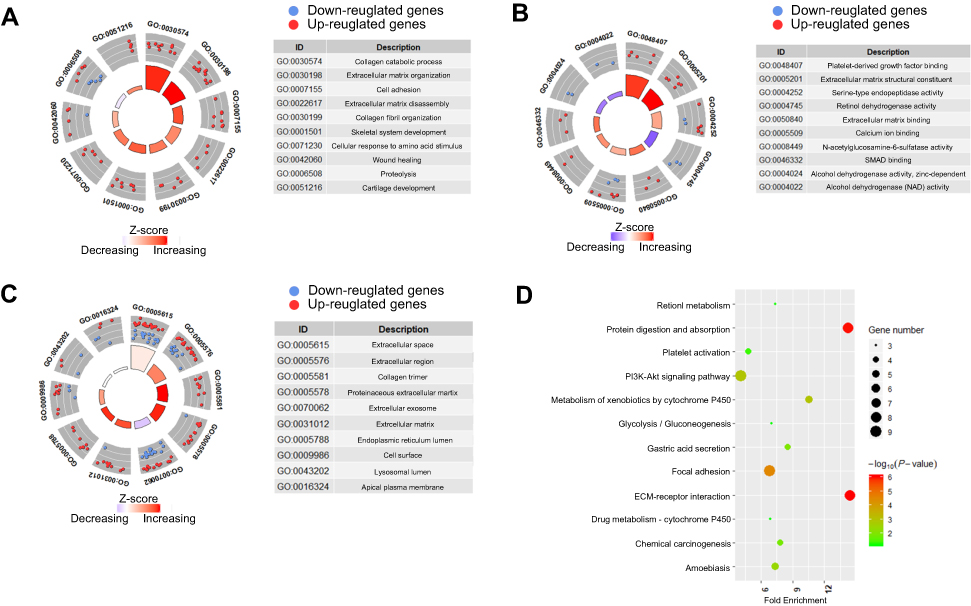 | Figure 2 Functional enrichment analyses for 76 differently expressed genes in gastric cancer tissues. Extracellular matrix-related terms or pathway were significantly enriched (A) Top ten enriched GO-biological process terms; (B) Top ten enriched GO-molecular function terms; (C) Top ten enriched GO-cellular component terms; (D) Top twelve enriched KEGG pathways. z-score=(fold change of upregulated genes- fold change of downregulated genes)/square root of gene count numbers. For each gene, the fold change used here was the average value calculated by the results obtained from four GEO datasets. |
A panel of collagen genes upregulated in GC and involved in the prognosis of patients
Interestingly, in the GO and KEGG enrichment analysis, we observed that several members of the collagen gene family were more frequently enriched. Moreover, PPI networks involving the 76 DEGs were constructed. Some DEGs could not constitute a part of a network and were excluded; however, seven collagen genes (COL10A1, COL1A1, COL1A2, COL3A1, COL4A1, COL5A2, and COL6A3) constituted a core network, with relative higher degree value of node (Figure 3). To better understand the potential functions of these collagen genes, GO terms (biological process, cellular component, and molecular function) for which these genes were enriched are shown in Figure 4A. Not surprisingly, these genes were mainly related to the regulation of ECM. Certain cancer-related terms, such as “cell adhesion” and “extracellular exosome”, were also involved. Next, we analyzed the effect of these collagen genes on the survival of GC patients. As shown in Figure 4B, all of these collagen genes were consistently expressed at higher levels in tumor tissues in the four GEO datasets (GSE13861, GSE27342, GSE54129, and GSE63089). Gene expression and clinical data involving the 876 GC patients were obtained from the KM-plotter database. Patients were divided into two groups using the median values of candidate collagen genes. Patients with higher levels of expression of COL10A1, COL1A1, COL1A2, COL4A1, or COL6A3 exhibited significantly lower overall survival (Figure 5), indicating that the higher expression of these collagen genes was related to poor prognosis of patients. In parallel, similar survival analysis was performed for TCGA-STAD dataset. As shown in Figure 6, patients with higher levels of expression of COL1A1, COL4A1, or COL5A2 showed poorer prognoses. Only the results for COL1A1 and COL4A1 were consistent among the 876 patients (from the KM-plotter database) and TCGA-STAD. Therefore, in the GSE15459 dataset—a cohort involving 200 primary gastric tumors from Singaporean patients—the effects of COL1A1 and COL4A1 in terms of the prognoses of patients were determined using Cox proportional hazard modeling. Based on multivariate Cox regression analysis, we obtained a model to estimate the risk of poor survival using COL1A1 and COL4A1 as risk factors. The model was risk score=0.45 COL1A1+0.48 COL4A1. The risk score was calculated using this model for GSE15459, and patients with high scores had significantly poorer survival rates (Figure 7A). The model was confirmed in TCGA-STAD data, and we obtained results similar to those obtained for GSE15459 (Figure 7B). Therefore, we proposed that these upregulated collagen genes, in particular COL1A1 and COL4A1, are associated with poor prognosis of GC patients.
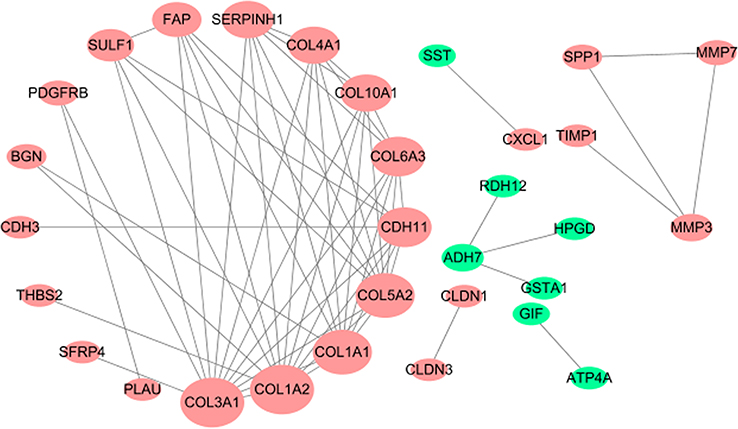 | Figure 3 Protein–protein interaction network for 76 differently expressed genes in gastric cancer tissues. Nodes that have zero degrees value were excluded. |
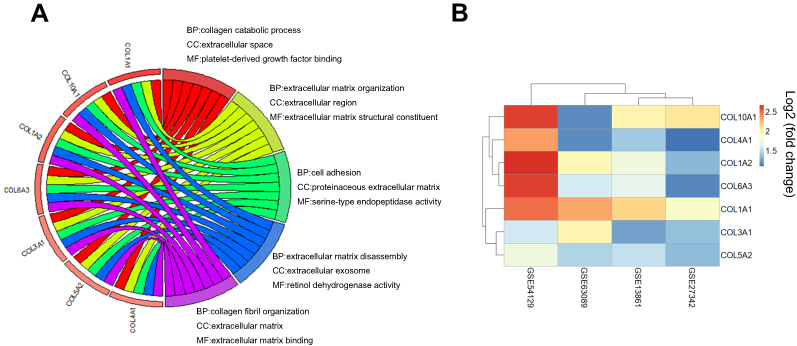 | Figure 4 Functional enrichment analyses and level expression of seven differently expressed collagen genes in gastric cancer. (A) Top five enriched Go-terms for COL10A1, COL1A1, COL1A2, COL3A1, COL4A1, COL5A2, and COL6A3. (B) Heatmap showed all of these seven collagen genes were upregulated significantly in gastric cancer among four GEO dataset. |
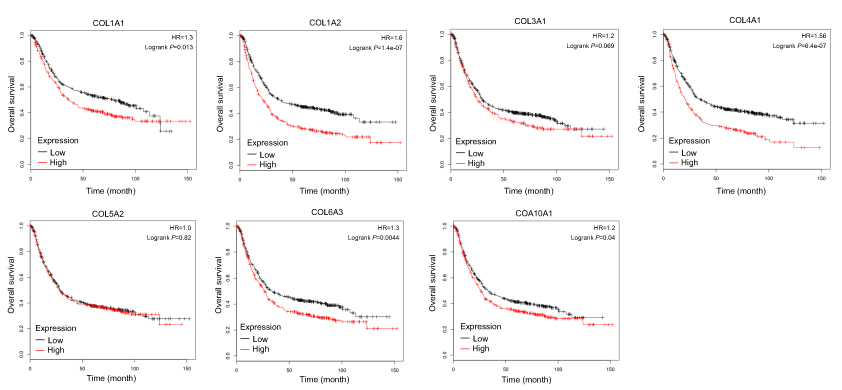 | Figure 5 Association of seven candidate collagen genes with the overall survival rate of 876 patients with gastric cancer. The data were collected from KM plotter database. (A) COL1A1; (B) COL1A2; (C) COL3A1; (D) COL1A1; (E) COL5A2; (F) COL6A3; (G) COL10A1. |
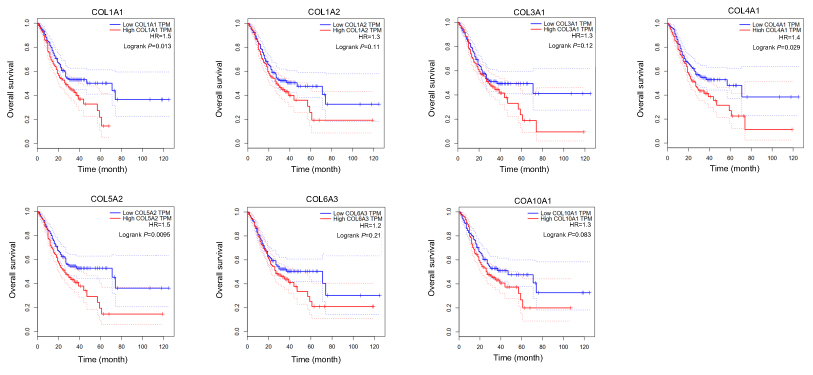 | Figure 6 Association of seven candidate collagen genes with the overall survival rate of patients in the Cancer Genome Atlas Stomach Adenocarcinoma (TCGA-STAD) dataset. (A) COL1A1; (B) COL1A2; (C) COL3A1; (D) COL1A1; (E) COL5A2; (F) COL6A3; (G) COL10A1. Survival curves were provided by online tool GEPIA ( |
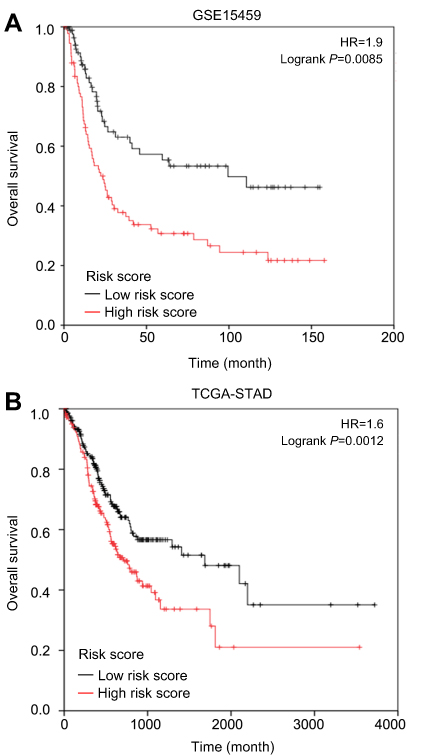 | Figure 7 The overall survival rate of gastric cancer patients with different (high and low). (A) Data collected from GSE15459; (B) Data collected from TCGA-STAD. The risk score was calculated by the formula: Risk score=0.45COL1A1+0.48COL4A1. |
Validation of expression of COL1A1 and COL4A1 and association with clinical parameters in an independent GC cohort
We further assessed differences between COL1A1 and COL4A1 expression between tumor and matched non-tumor tissues collected from our in-house GC cohort (n=58) using qRT-PCR and IHC. As shown in Figure 8 A and B, the expression of COL1A1 and COL4A1 was significantly elevated in tumor tissues compared with that in non-tumor tissues. Next, patients were grouped using median values of COL1A1 and COL4A1 mRNA levels. The expression difference folds of COL1A1 and COL4A 1 between high expression and low expression groups were showed in Figure 8C. The relationships of COL1A1 and COL4A1 levels with clinical parameters were analyzed (Table 1). The expression of COL1A1 and COL4A1 was not associated with sex, age, tumor location, size, or histological differentiation. Patients with a higher expression of COL1A1 exhibited greater potential to have an advanced TNM stage and higher rates of lymph node metastasis. A high expression of COL4A1 was related to lymph node metastasis, TNM staging, and tumor invasion depth. To confirm the prognostic value of COL1A1 and COL4A1 levels, we compared the overall survival of patients based on the expression of these genes. Patients with higher COL1A1 or COL4A1 mRNA levels presented poorer prognoses (Figure 9A and B). Moreover, the risk score was again calculated as 0.45 COL1A1+0.48 COL4A1. In accordance with the results obtained from the GEO dataset, patients with a high-risk score had a poor prognosis (Figure 9C). Subsequently, ROC analysis based on in-house data was conducted to further investigate the ability of COL1A1 and COL4A1 in GC prognosis. As shown in Figure 9D, the risk score calculated by COL1A1 and COL4A1 could distinguish tumor tissues from the non-tumor tissues with AUG of 0.811. It indicated that COL1A1 and COL4A1 excelled at differentiating between tumor and non-tumor tissues.
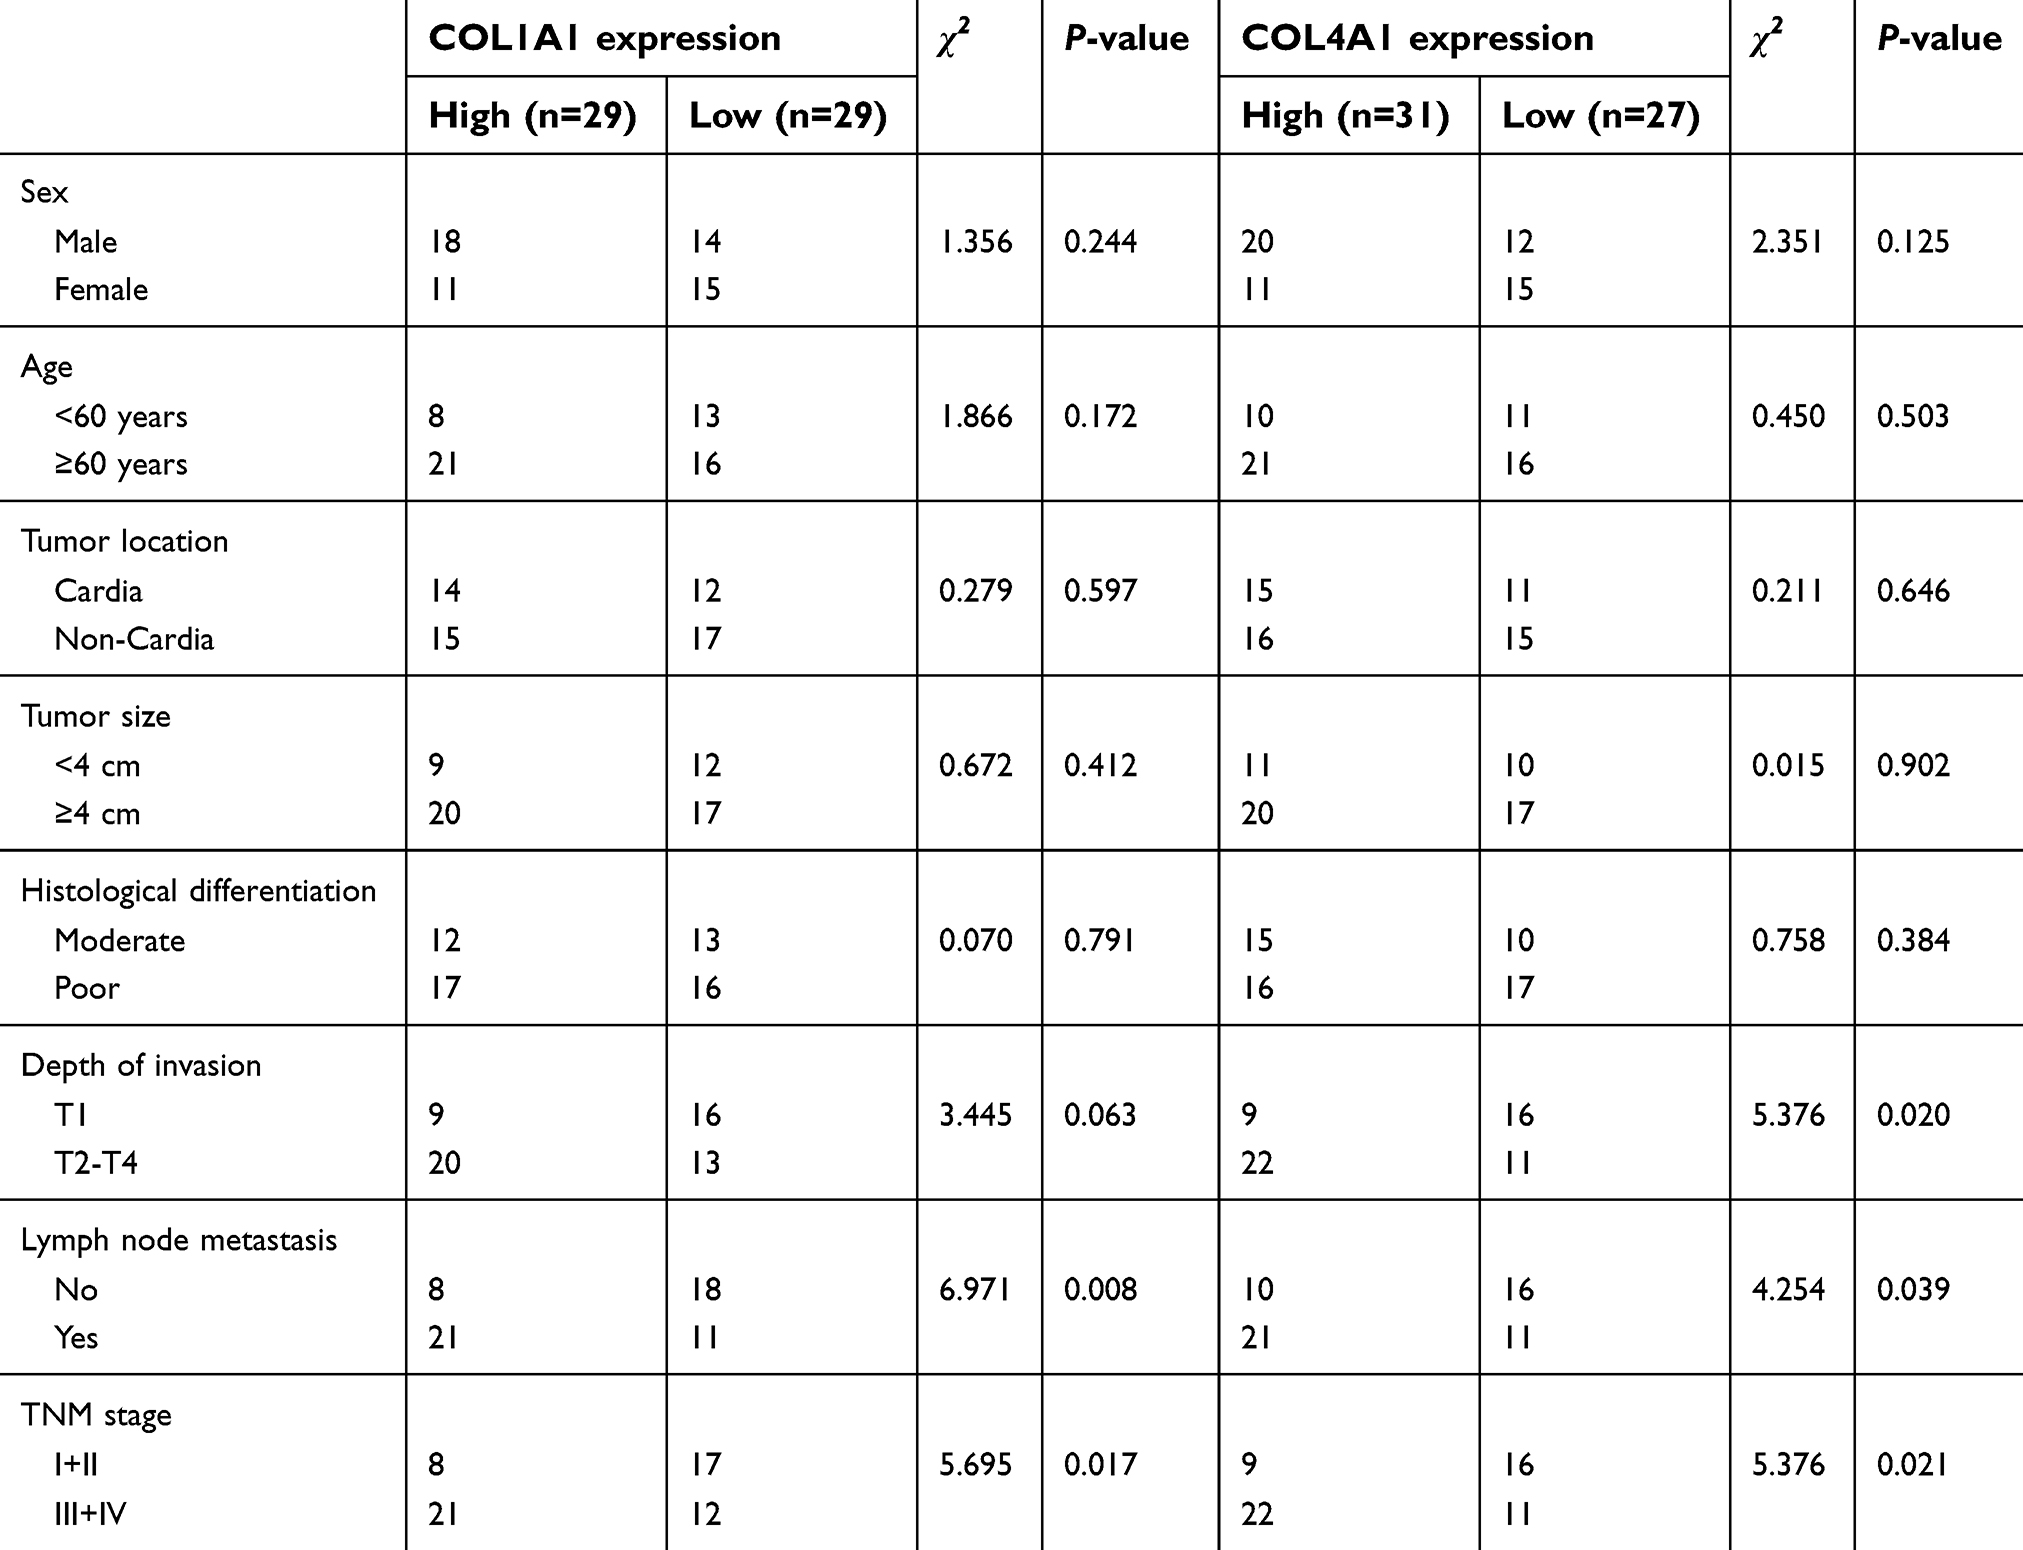 | Table 1 Association between clinicopathologic characteristics and COL1A1 and COL4A1 expression |
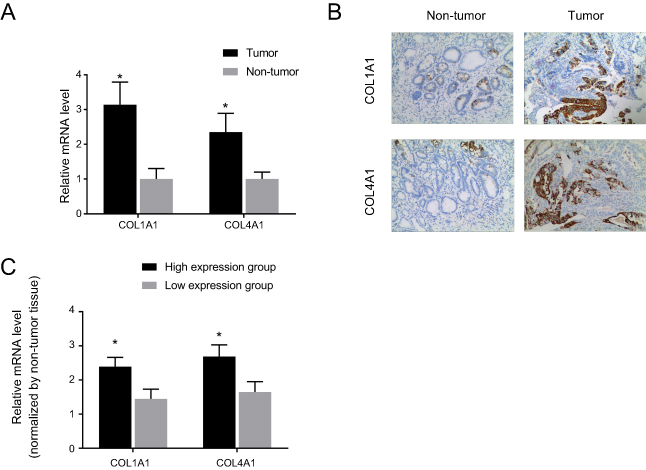 | Figure 8 Expression of COL1A1 and COL4A1 in the tissue samples from an independent in-house gastric cancer-related cohort. (A) qRT-PCR showed a higher COL1A1 and COL4A1 level in tumor tissues; (B) Representative images of immunohistochemical staining for COL1A1 and COL4A1 expression in tissue samples (100×). The higher positive rate of COL1A1 and COL4A1 was observed in tumor tissues. *P<0.05 compared with non-tumor tissues; (C) the expression difference folds of COL1A1 and COL4A1 between high expression and low expression groups. |
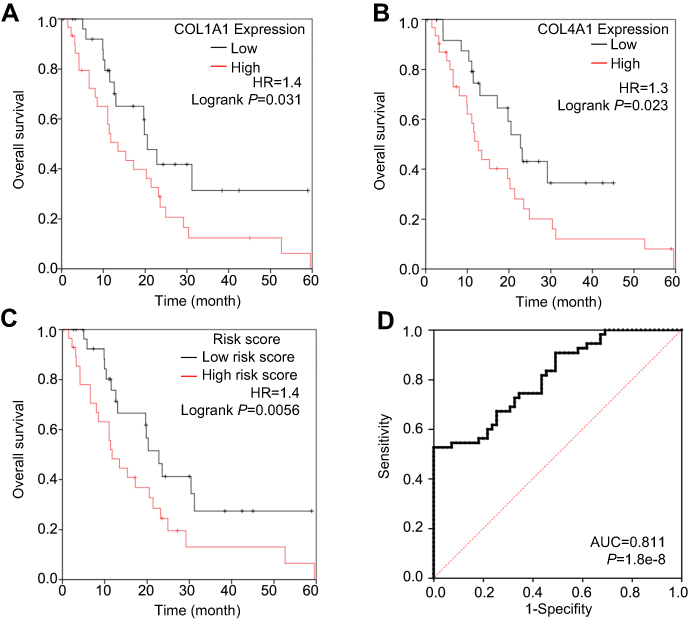 | Figure 9 Patients in the in-house cohort were stratified by the median of COL1A1, COL4A1 and risk score. The overall survival rate was analyzed and the diagnostic ability of risk score was analyzed. (A) Meidan of COL1A1 was used as cut-off; (B) Median of COL4A1 was used as cut-off; (C) Median of risk score was used as cut-off. The risk score was calculated by the formula: Risk score=0.45COL1A1+0.48COL4A1; (D) ROC analysis was conducted to further investigate the ability of risk score to distinguish tumor tissues from the non-tumor tissues. |
COL1A1 and COL4A1 are regulated by microRNA-29c-3p in GC
Survival analysis for 876 GC patients from KM-plotter database showed that high expression of COL10A1, COL1A1, COL1A2, COL4A1, and COL6A3 indicated poor prognosis. To reveal the upstream regulatory mechanisms involving these five candidate collagen genes, we investigated microRNAs that might target COL10A1, COL1A1, COL1A2, COL4A1, and COL6A3. We identified three members of the microRNA-29 family (microRNA-29a-3p, microRNA-29b-3p, and microRNA-29c-3p) that could potentially target COL10A1, COL1A1, COL1A2, COL4A1, and COL6A3 (Figure 10A). From TCGA-STAD data, only microRNA-29c-3p levels were found to be lower in tumor tissues (Figure 10B).
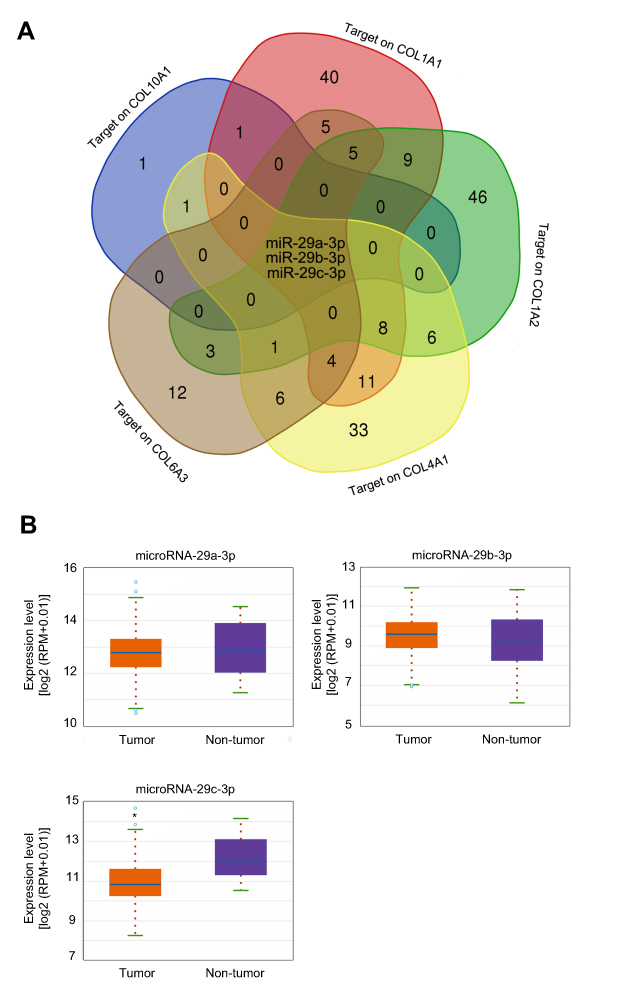 | Figure 10 microRNA-29c-3p was decreased in gastric cancer tissue and may target on the candidate collagen genes. (A) microRNAs that may target on COL10A1, COL1A1, COL1A2, COL4A1, and COL6A3 were predicted. Three members of the microRNA-29 family may target on both of candidate collagen genes. (B) The expression changes of three members of the microRNA-29 family in gastric cancer patients from TCGA-STAD dataset. *P<0.05 compared with non-tumor tissues. |
As mentioned earlier, only survival results for COL1A1 and COL4A1 were consistent among the 876 patients (from the KM-plotter database) and TCGA-STAD. Therefore, we confirmed the regulatory effects of microRNA-29c-3p only on COL1A1 and COL4A1 in vitro. In BGC-823 cells, the upregulation of microRNA-29c-3p significantly reduced mRNA and protein levels of COL1A1 and COL4A1 (Figure 11A and B). Dual-luciferase reporter assays indicated that microRNA-29c-3p directly binds to the 3′-UTRs of COL1A1 and COL4A1 (Figure 11C and D).
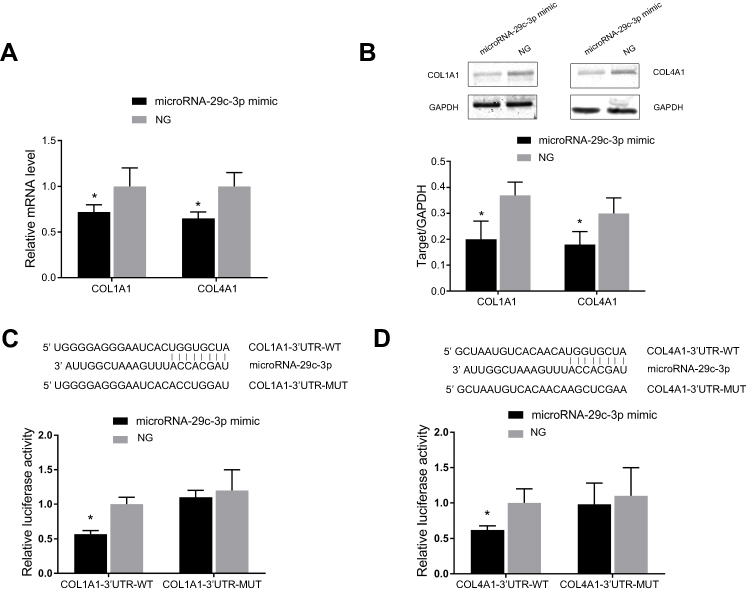 | Figure 11 microRNA-29c-3p directly target on COL1A1 and COL4A1. (A)Upregulation of microRNA-29c-3p reduced the mRNA level of COL1A1 and COL4A1; (B) Upregulation of microRNA-29c-3p decreased the protein level of COL1A1 and COL4A1; (C) and (D) Dual luciferase reporter assays indicated microRNA-29c-3p could bind to the 3ʹ-UTR of COL1A1 and COL4A1 mRNA directly. *P<0.05 compared with wild-type 3ʹUTR. |
Expression of COL1A1 and COL4A1 is involved with proliferation of GC cells
To reveal the role of COL1A1 and COL4A1 on GC cells we performed proliferation assay in vitro. First, we investigated the proliferation changes after microRNA-29c-3p mimics transfection, as shown in Figure 12A, upregulation of microRNA-29c-3p inhibited the proliferation of BGC-823 cells. Then, we found that regulation of COL1A1 and COL4A1 had an effect on the proliferation of GC cells. COL1A1 and COL4A1 knock-down inhibited cells proliferation, meanwhile, overexpression of COL1A1 and COL4A1 promoted proliferation (Figure 12B and C).
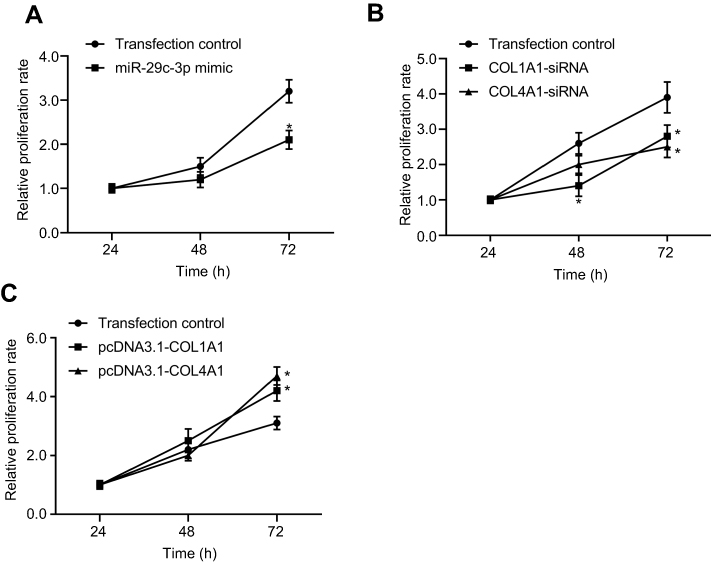 | Figure 12 The effect of microRNA-29c-3p, COL1A1, and COL4A1 on proliferation of GC cells in vitro. (A) Upregulation of microRNA-29c-3p inhibited (B) knock-down COL1A1and COL4A1 inhibited proliferation of GC cells; (C) overexpression of COL1A1and COL4A1 promoted proliferation of GC cells. |
Discussion
Over the last decades, great efforts have been made to provide novel understanding involving the early diagnosis, targeted therapy, and prognostic evaluation of GC.10,11 However, the overall survival time of GC patients remains unfavorable, particularly in some developing countries.12,13 Advances in high-throughput technology provide new opportunities to better understand the molecular mechanisms underlying GC, which prolong the long-term survival of GC patients. Several public databases, such as GEO, TCGA, and Oncomine (
In the present study, four microarray datasets were analyzed to establish the expression profiles of genes involved in GC. With a threshold of absolute fold change of >2.0 and P<0.05, DEGs in the tissues of GC patients in each cohort were identified. After overlap, 76 DEGs were selected. Among these 76 DEGs, some genes were typically reported in previous studies. About expression changes of these representative genes, our results were consistent with previous studies. For example, IGF2BP3 was described as oncogene in numerous cancers including gastric cancer.15,16 Zhou et al performed expression microarray analysis in GC cell lines and found that IGF2BP3 upregulated significantly in GC cells.17 In the present study gene function investigations, including GO and KEGG pathway analysis, were conducted for the selected DEGs to identify novel candidate genes that have greater potential to play roles in the process of GC. Among the 76 DEGs, seven genes (COL10A1, COL1A1, COL1A2, COL3A1, COL4A1, COL5A2, and COL6A3) from the collagen gene family were upregulated in tumor tissues. GO and KEGG pathway analysis indicated that these seven collagen genes were enriched in ECM-related functions or pathways. ECM is the most essential component of the tumor microenvironment and is involved with both the growth and the migration of tumor cells.18 Moreover, PPI analysis based on data from the STRING database showed that these collagen genes represent nodes of a high value in protein networks. Therefore, we believe that further studies on these seven collagen genes are required. Survival data from 876 GC patients were analyzed, which revealed that patients with higher COL1A1, COL1A2, COL4A1, COL6A3, and COL10A1 levels had poor prognoses. To reinforce this evidence, we performed a similar analysis using clinical data from TCGA-STAD. However, from TCGA-STAD data, only COL1A1 and COL4A1 showed significant association with survival rates of patients. One reason for this may be that using the median values of these genes as cut-offs may not be the best choice. If we use the third quartile of gene expression levels as the cut-off value, then we may establish more consistent results. In short, we support that most of these seven collagen genes could be indicative of the prognosis of GC patients. However, to establish more reliable results, we focused only on COL1A1 and COL4A1 for detailed study. Furthermore, we validated the results that we obtained from public datasets in one of our in-house GC cohorts. As expected, COL1A1 and COL4A1 were overexpressed in tumor tissues, and higher expression levels of these genes indicated lower survival rates. We also found that expression of COL1A1 and COL4A1 was involved with several clinical parameters, such as TNM staging, lymph node metastasis, and tumor invasion depth. This explains why COL1A1 and COL4A1 can be used to indicate the prognosis of patients. Moreover, a ROC curve of risk score calculated by mRNA level of COL1A1 and COL4A1 indicated that these two genes might become a diagnostic marker of GC when used in combination with each other.
Previous studies have already reported the different roles of collagen genes in various cancers. Interestingly, most such studies have indicated that the higher expression of collagen genes facilitates cancer cell proliferation and tumorigenesis. For example, Liu et al showed that COL1A1 levels are significantly increased in cervical cancer tissues and inhibit apoptosis induced by radiation in such cells.19 The high expression of COL1A1 was also observed in colorectal cancer and is regarded as a potential diagnostic biomarker and a promising therapeutic target.20 Su et al reported that targeting COL3A1 can suppress growth and metastasis in renal cell carcinoma.21 A bioinformatics analysis-based study showed that COL4A1 can induce trastuzumab resistance in GC.22 In lung adenocarcinoma, COL5A1 may contribute to metastasis.9
Previous studies have shown that microRNAs had effect on cancer cells by targeting collagen genes in. However, these studies only focused on a single member of the collagen gene family. For instance, Zhu et al found that microRNA-196b-5p suppresses cell proliferation and metastasis in breast cancer by targeting COL1A1.23 In our study, we found the expression of seven collagen genes to be simultaneously elevated in GC tissues. Therefore, we hypothesized that these seven collagen genes are regulated in a common manner. microRNA target identification tools indicated that three members of the microRNA-29 family, namely, microRNA-29a-3p, microRNA-29b-3p, and microRNA-29c-3p, could bind to COL10A1, COL1A1, COL1A2, COL4A1, and COL6A3. According to clinical data from TCGA-STAD, only microRNA-29c-3p is decreased in GC tissues. Therefore, only the regulatory effect of microRNA-29c-3p was confirmed in vitro. In BGC-823 cells, we found microRNA-29c-3p reduced COL1A1 and COL4A1 mRNA and protein levels. The abnormal expression of collagen genes may be caused by the alteration of microRNA-29c-3p activity. As a regulatory hub, microRNA-29c-3p may be useful in collagen gene-targeted treatment. In vitro proliferation assay showed that COL1A1 and COL4A1 have effect on the proliferation of GC cells. This evidence supported the clinical survival data obtained from GC cohorts. A limitation of our study was that we did not investigate functions of COL1A1 and COL4A1 in GC cells excepting proliferation assay.
Conclusion
We demonstrated that a panel of collagen genes is overexpressed in GC. Among these, COL1A1 and COL4A1 were closely associated with the overall survival of GC patients and could be regarded as risk factors for poor prognosis. COL1A1 and COL4A1 were involved with defined clinical parameters, including TNM staging, lymph node metastasis, and tumor invasion depth, in GC patients. This indicates that COL1A1 and COL4A1 may participate in the metastatic behavior of GC. The panel of collagen genes, particularly COL1A1 and COL4A1, may be regulated by microRNA-29c-3p. In conclusion, we suggest that collagen genes play crucial roles in the progression of GC and may be utilized for diagnosis and therapy.
Disclosure
The authors report no conflicts of interest in this work.
References
1. Sitarz R, Skierucha M, Mielko J, Offerhaus GJA, Maciejewski R, Polkowski WP. Gastric cancer: epidemiology, prevention, classification, and treatment. Cancer Manag Res. 2018;10:239–248. doi:10.2147/CMAR.S149619
2. Kim SG, Park CM, Lee NR, et al. Long-term clinical outcomes of endoscopic submucosal dissection in patients with early gastric cancer: a prospective multicenter cohort study. Gut Liver. 2018;12(4):402–410. doi:10.5009/gnl17414
3. Yuen ST, Leung SY. Genomics study of gastric cancer and its molecular subtypes. Adv Exp Med Biol. 2016;908:419–439. doi:10.1007/978-3-319-41388-4_21
4. D’Angelo G, Di Rienzo T, Ojetti V. Microarray analysis in gastric cancer: a review. World J Gastroenterol. 2014;20(34):11972–11976. doi:10.3748/wjg.v20.i34.11972
5. Pickup MW, Mouw JK, Weaver VM. The extracellular matrix modulates the hallmarks of cancer. EMBO Rep. 2014;15(12):1243–1253. doi:10.15252/embr.201439246
6. Yan Y, Wang LF, Wang RF. Role of cancer-associated fibroblasts in invasion and metastasis of gastric cancer. World J Gastroenterol. 2015;21(33):9717–9726. doi:10.3748/wjg.v21.i33.9717
7. Januchowski R, Swierczewska M, Sterzynska K, Wojtowicz K, Nowicki M, Zabel M. Increased expression of several collagen genes is associated with drug resistance in ovarian cancer cell lines. J Cancer. 2016;7(10):1295–1310. doi:10.7150/jca.15371
8. Zhang Z, Wang Y, Zhang J, Zhong J, Yang R. COL1A1 promotes metastasis in colorectal cancer by regulating the WNT/PCP pathway. Mol Med Rep. 2018;17(4):5037–5042. doi:10.3892/mmr.2018.8533
9. Liu W, Wei H, Gao Z, et al. COL5A1 may contribute the metastasis of lung adenocarcinoma. Gene. 2018;665:57–66. doi:10.1016/j.gene.2018.04.066
10. Badiyan SN, Hallemeier CL, Lin SH, Hall MD, Chuong MD. Proton beam therapy for gastrointestinal cancers: past, present, and future. J Gastrointest Oncol. 2018;9(5):962–971. doi:10.21037/jgo.2017.11.07
11. Tan AC, Chan DL, Faisal W, Pavlakis N. New drug developments in metastatic gastric cancer. Therap Adv Gastroenterol. 2018;11:1756284818808072. doi:10.1177/1756284818808072
12. Goetze OT, Al-Batran SE, Chevallay M, Monig SP. Multimodal treatment in locally advanced gastric cancer. Updates Surg. 2018;70(2):173–179. doi:10.1007/s13304-018-0539-z
13. Chen W, Zheng R, Baade PD, et al. Cancer statistics in China, 2015. CA Cancer J Clin. 2016;66(2):115–132. doi:10.3322/caac.21338
14. Ang YL, Yong WP, Tan P. Translating gastric cancer genomics into targeted therapies. Crit Rev Oncol Hematol. 2016;100:141–146. doi:10.1016/j.critrevonc.2016.02.007
15. Mizutani R, Imamachi N, Suzuki Y, et al. Oncofetal protein IGF2BP3 facilitates the activity of proto-oncogene protein eIF4E through the destabilization of EIF4E-BP2 mRNA. Oncogene. 2016;35(27):3495–3502. doi:10.1038/onc.2015.410
16. Palanichamy JK, Tran TM, Howard JM, et al. RNA-binding protein IGF2BP3 targeting of oncogenic transcripts promotes hematopoietic progenitor proliferation. J Clin Invest. 2016;126(4):1495–1511. doi:10.1172/JCI80046
17. Zhou Y, Huang T, Siu HL, et al. IGF2BP3 functions as a potential oncogene and is a crucial target of miR-34a in gastric carcinogenesis. Mol Cancer. 2017;16(1):77. doi:10.1186/s12943-017-0647-2
18. Zhu T, Hu X, Wei P, Shan G. Molecular background of the regional lymph node metastasis of gastric cancer. Oncol Lett. 2018;15(3):3409–3414. doi:10.3892/ol.2018.7813
19. Liu S, Liao G, Li G. Regulatory effects of COL1A1 on apoptosis induced by radiation in cervical cancer cells. Cancer Cell Int. 2017;17:73. doi:10.1186/s12935-017-0443-5
20. Zhang Z, Fang C, Wang Y, et al. COL1A1: A potential therapeutic target for colorectal cancer expressing wild-type or mutant KRAS. Int J Oncol. 2018;53(5):1869–1880. doi:10.3892/ijo.2018.4536
21. Su B, Zhao W, Shi B, et al. Let-7d suppresses growth, metastasis, and tumor macrophage infiltration in renal cell carcinoma by targeting COL3A1 and CCL7. Mol Cancer. 2014;13:206. doi:10.1186/1476-4598-13-206
22. Huang R, Gu W, Sun B, Gao L. Identification of COL4A1 as a potential gene conferring trastuzumab resistance in gastric cancer based on bioinformatics analysis. Mol Med Rep. 2018;17(5):6387–6396. doi:10.3892/mmr.2018.8664
23. Zhu X, Rao X, Yao W, Zou X. Downregulation of miR-196b-5p impedes cell proliferation and metastasis in breast cancer through regulating COL1A1. Am J Transl Res. 2018;10(10):3122–3132.
Supplementary material
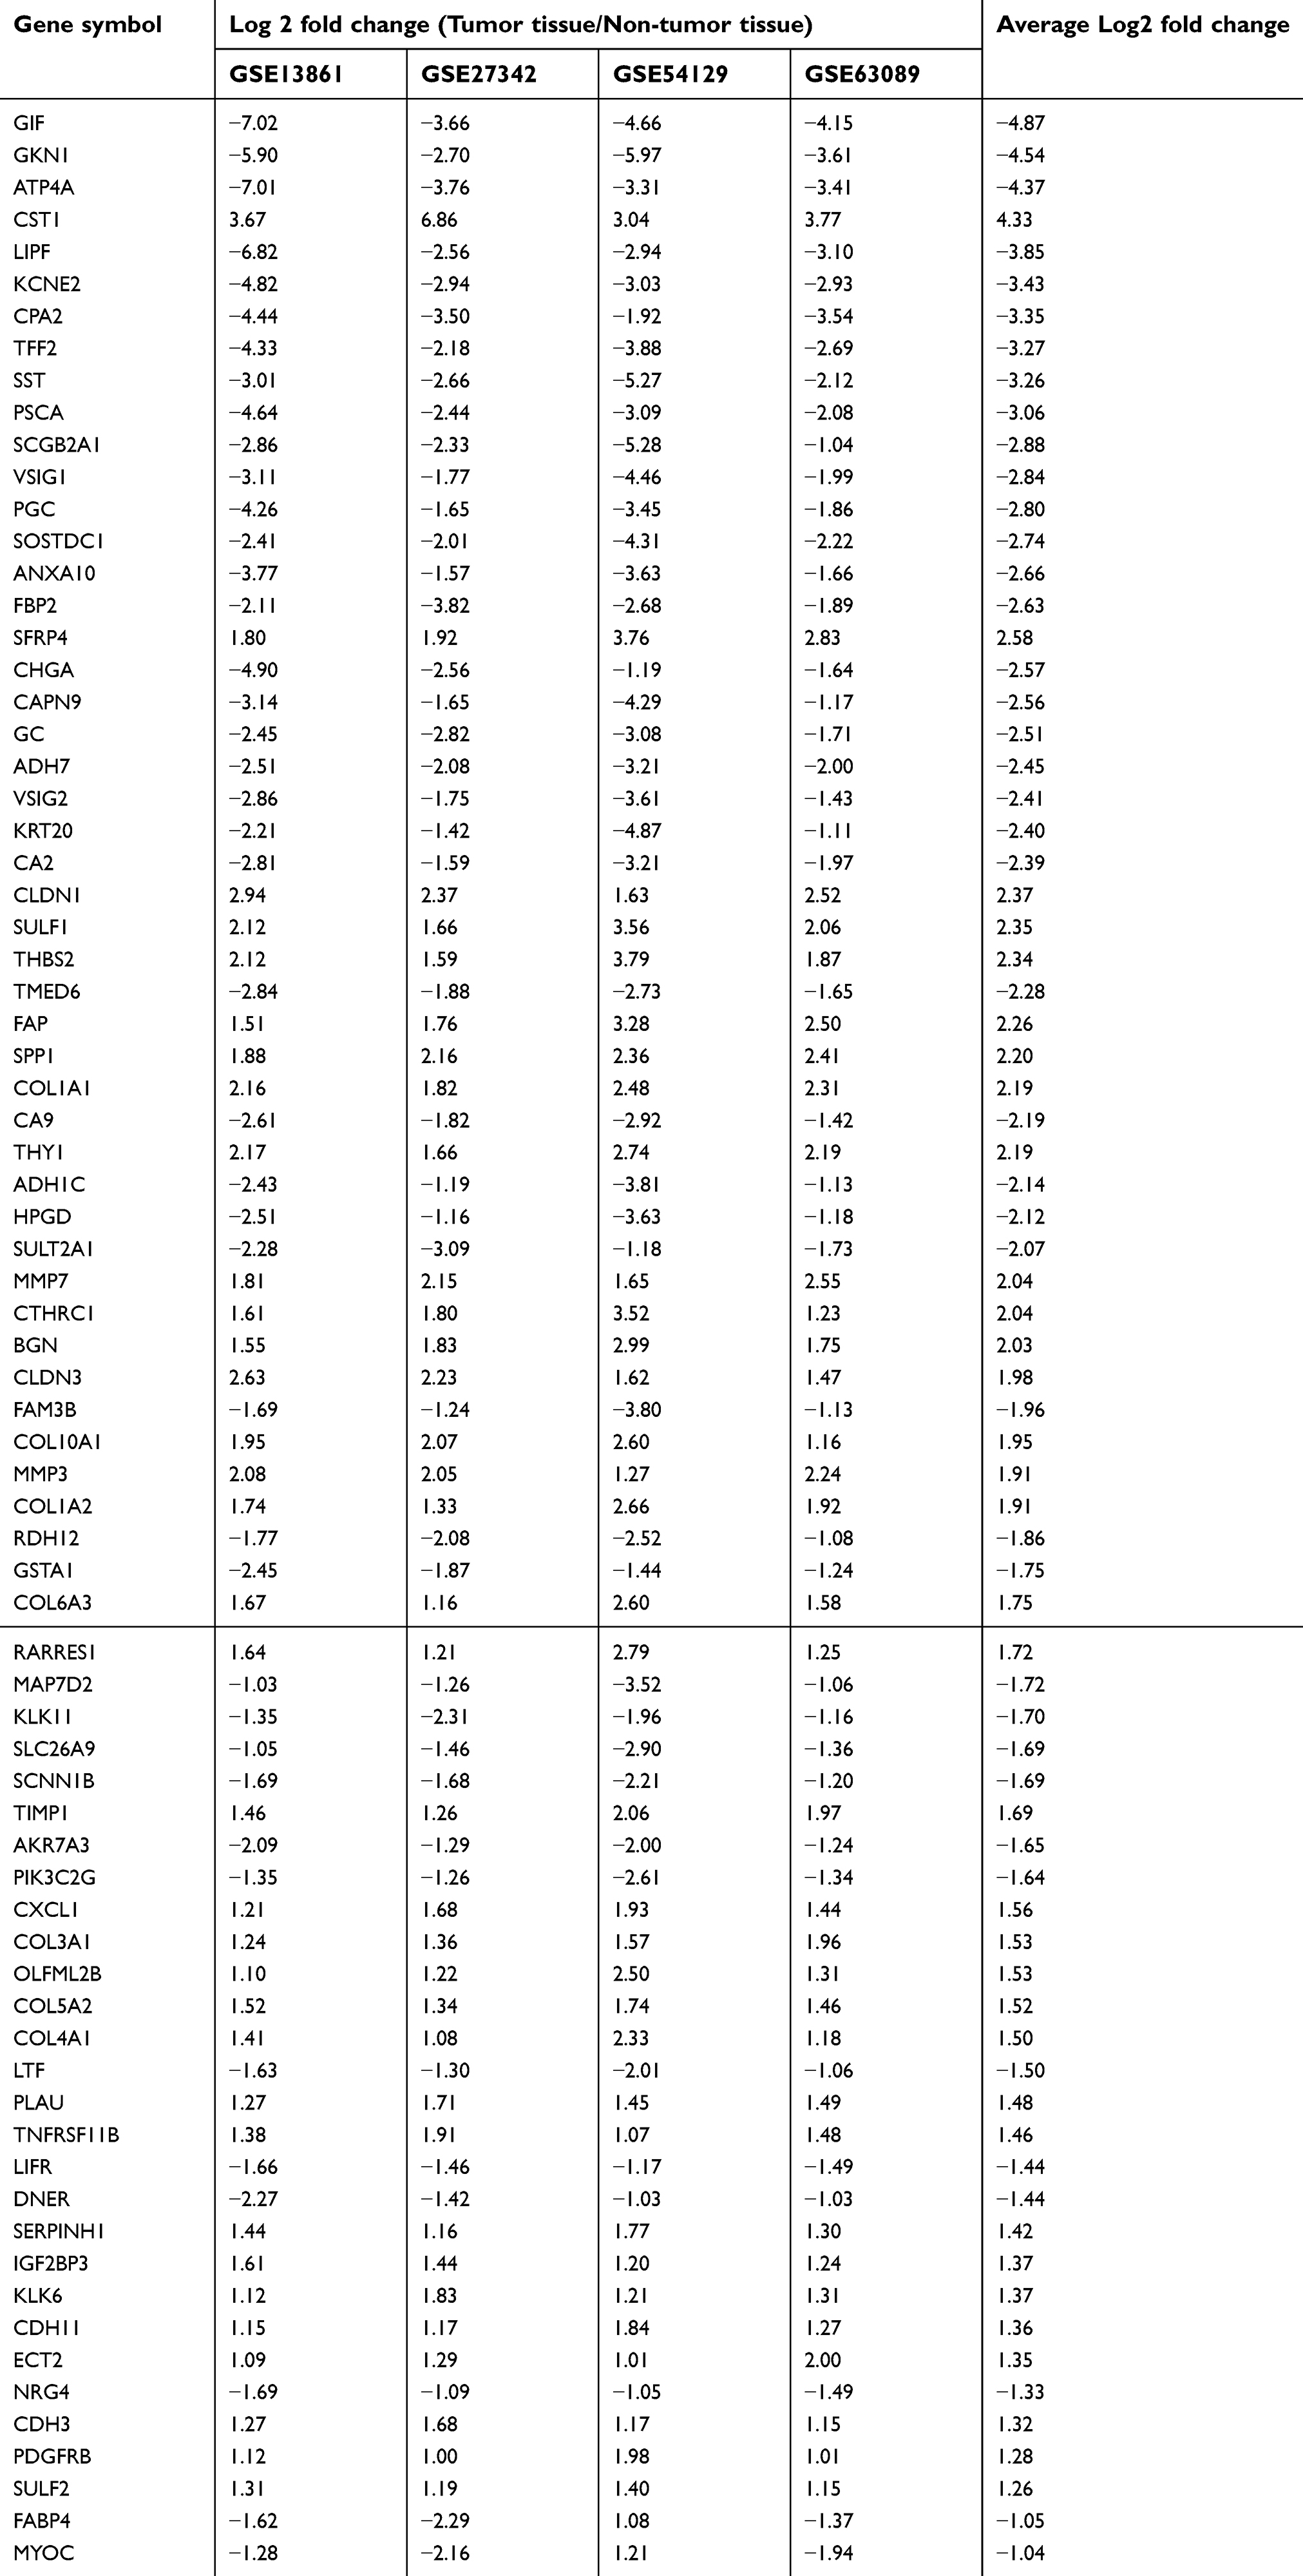 | Table S1 Overlapping different expressed genes between tumor and non-tumor tissues among four GEO gastric cancer-related dataset |
 © 2019 The Author(s). This work is published and licensed by Dove Medical Press Limited. The full terms of this license are available at https://www.dovepress.com/terms.php and incorporate the Creative Commons Attribution - Non Commercial (unported, v3.0) License.
By accessing the work you hereby accept the Terms. Non-commercial uses of the work are permitted without any further permission from Dove Medical Press Limited, provided the work is properly attributed. For permission for commercial use of this work, please see paragraphs 4.2 and 5 of our Terms.
© 2019 The Author(s). This work is published and licensed by Dove Medical Press Limited. The full terms of this license are available at https://www.dovepress.com/terms.php and incorporate the Creative Commons Attribution - Non Commercial (unported, v3.0) License.
By accessing the work you hereby accept the Terms. Non-commercial uses of the work are permitted without any further permission from Dove Medical Press Limited, provided the work is properly attributed. For permission for commercial use of this work, please see paragraphs 4.2 and 5 of our Terms.