")
Back to Journals » International Journal of General Medicine » Volume 14
A Pan-Cancer Analysis of the Oncogenic Role of Integrin Beta4 (ITGB4) in Human Tumors
Authors Huang W, Fan L, Tang Y, Chi Y, Li J
Received 18 October 2021
Accepted for publication 30 November 2021
Published 11 December 2021 Volume 2021:14 Pages 9629—9645
DOI https://doi.org/10.2147/IJGM.S341076
Checked for plagiarism Yes
Review by Single anonymous peer review
Peer reviewer comments 2
Editor who approved publication: Dr Scott Fraser
Wenjie Huang,1,* Li Fan,1,* Yongmei Tang,1 Yinxiu Chi,2 Jingjing Li1
1Department of Reproductive Medicine, Liuzhou Maternity and Child Healthcare Hospital, Affiliated Women and Children’s Hospital of Guangxi University of Science and Technology, Liuzhou, Guangxi, 545001, People’s Republic of China; 2School of Basic Medicine, Central South University, Changsha, Hunan, 410078, People’s Republic of China
*These authors contributed equally to this work
Correspondence: Jingjing Li; Wenjie Huang Email [email protected]; [email protected]
Background: Integrin beta4 (ITGB4) is a transmembrane receptor that plays a key role in tumorigenesis and tumor development. However, there are no pan-cancer analyses of ITGB4.
Methods: This study demonstrates the first potential oncogenic roles of ITGB4 across 33 tumors based on the dataset of the Cancer Genome Atlas (TCGA) and Gene Expression Omnibus (GEO).
Results: ITGB4 is highly expressed in many cancers, and distinct correlations exist between ITGB4 expression and the prognosis of tumor patients. We also found that the methylation and genetic alteration level of ITGB4 was associated with some cancer prognosis. Furthermore, we found a reduced phosphorylation of ITGB4 at S1457 in several tumors, such as breast and ovarian cancers. Finally, ITGB4 expression was correlated with cancer-associated fibroblasts in liver hepatocellular carcinoma and prostate adenocarcinoma, and the infiltration level of NK cells and neutrophils was observed in other cancers, such as breast invasive carcinoma and lung adenocarcinoma. Moreover, RNA metabolism and protein processing-associated functions are involved in the functional mechanism of ITGB4.
Conclusion: Our first pan-cancer study may offer a relatively comprehensive understanding of the oncogenic roles of ITGB4 across different tumors.
Keywords: ITGB4, cancer, prognosis, methylation, phosphorylation
Introduction
In recent years, the pan-cancer analysis has ushered cancer research to a novel level. From there, we may conduct research on any gene of interest and acquire its correlation with the clinical phenotype and potential molecular mechanisms.1 The Gene Expression Omnibus (GEO) database and the Cancer Genome Atlas (TCGA) project carry out data obtained from high-throughput transcriptomic analyses, which allow us to our conduct pan-cancer analysis.
Integrins are a large family of heterodimeric transmembrane glycoproteins comprising α and β subunits,2 and these play crucial roles in the signaling networks that influence tumor progression.3,4 Integrins can regulate multiple cell behaviors in response to cytokines and growth factors, including migration, adhesion, proliferation and survival, by forming the transmembrane link between the extracellular matrix (ECM) and the actin cytoskeleton.5,6 In addition, cancer cells can proliferate and survive, even if deprived of adhesion to the matrix,7 they might benefit from integrin signals at certain stages of tumor progression and could be more dependent on specific integrins than normal cells.3
Integrin beta4 (ITGB4), as a subunit of α6β4 (henceforth integrin β4), which is unique among the 24 known mammalian integrins in that it has a 1017 amino-acid-long domain.8 Previous evidence showed that ITGB4 is upregulated in various tumor types9,10 and is expressed in tumor-associated blood vessels, thereby promoting the invasive stage of tumor angiogenesis.11 Additionally, the overexpression of ITGB4 promote epithelial–mesenchymal transition (EMT) in pancreatic ductal adenocarcinoma.12 During EMT, epithelial carcinoma cells lose their polarity and acquire a mesenchymal-like phenotype, with enhanced capacity for invasion and metastasis.13 Although ITGB4 have been reported to be linked to poor prognosis or aggressive behavior in several cancers14–16 and associated with a worse 5-year probability of relapse-free survival among patients with triple-negative breast cancer (TNBC) who received chemotherapy,17 there is still no pan-cancer evidence on the relationship between ITGB4 and various tumor types based on a large quantity of clinical data. In this study, therefore, we sought to conduct a pan-analysis of ITGB4 based on the TCGA project and GEO databases, investigate whether ITGB4 is implicated in the pathogenesis or clinical prognosis of different cancers and identify the underlying mechanism.
Materials and Methods
Gene Expression Analysis of HPA
We obtained the expression data of the ITGB4 gene in different tissues and cells under physiological conditions from the Human Protein Atlas database (HPA, https://www.proteinatlas.org/humanproteome/pathology). Protein expression of ITGB4, as determined via mass spectrometry proteomics, was detected in HPA database. “Low specificity” was defined as “Normalized expression (NX) ≥ 1 in at least one cell/region/tissue/type but not elevated in any cell/region/tissue type”. Detailed information can be acquired at https://www.proteinatlas.org/ENSG00000132470-ITGB4.
Gene Expression Analysis
The Timer2 (Tumor immune estimation resource, version 2; web: http://timer.cistrome.org/) was used to observe the expression difference of ITGB4 expression between tumors and adjacent normal tissues for the different tumors or certain tumor subtypes. In addition, we acquired violin plots of the ITGB4 expression in different pathological stages (stages I, II, III and IV) of all TCGA tumors via the (pathological stage plot) module in HEPIA2. The box or violin plots were generated using the log2 (TPM [Transcripts per million] + 1) transformed expression data.
A protein expression analysis of the clinical proteomic tumor analysis consortium (CPTAC) dataset was obtained from the UALCAN portal (http://ualcan.path.uab.edu/analysis-prot.html), which is an interactive web resource for analyzing cancer omics data.18 In our study, we investigated the expression level of the total protein or phosphoprotein (with phosphorylation site at the S1069, S1180, S1209, S1455, S1454, S1457, T1471, S1547, T1530, T1532, T1583 and S1600 of NP_000204.3) of ITGB4 between primary tumor and normal tissues, respectively, by searching “ITGB4”. The available datasets for six cancers are breast cancer, clear cell renal cell carcinoma (CCRCC), colon cancer, lung adenocarcinoma (LUAD), ovarian cancer and uterine corpus endometrial carcinoma (UCEC).
Survival Prognosis Analysis
Disease-free survival (DFS) and overall survival (OS) significance map data of ITGB4 in all TCGA tumors were obtained from the GEPIA2. We defined cutoff-low and cutoff-high as 50% of the expression thresholds for splitting the low-expression and high-expression cohorts. Additionally, the survival plots were analyzed by the “Survival Analysis” module of GEPIA2, and the Log-Rank method was used for the hypothesis test.
A series of analyses of RFS (relapse-free survival), PPS (progress-free survival), DSS (disease-specific survival), DMFS (distant metastasis-free survival), OS (overall survival), FP (first progression) and PFS (progress-free survival) based on the different GEO datasets were conducted using the Kaplan–Meier plotter (http://kmplot.com/analysis/). We applied the “autoselect best cutoff” to split the cases of gastric, lung, ovarian, breast and liver cancers into two groups. Hazard ratio (HR), log-rank P-value and 95% confidence intervals were calculated, and Kaplan–Meier survival plots were generated. The above survival data of ITGB4 was used to perform a meta-analysis by using the STATA 12.0 software (Stata Corporation; Stata Statistic Software, Release 12.0; College Station, TX, USA). Furthermore, a series of subgroup analyses of clinical factors (gender, smoking history, histology, stage, grade, surgery, radiotherapy, and chemotherapy, etc.)
Genetic Alteration Analysis
We entered “ITGB4” in the “Quick select” of the TCGA PanCancer Atlas dataset within the cBioPortal database (https://www.cbioportal.org/)19 to acquire the genetic alteration characteristics of ITGB4. Then, all TCGA tumors of the selected mutation type, copy number alteration (CNA) and alteration frequency were acquired by the Cancer Type Summary module. The mutated site information of ITGB4 can be displayed in the three-dimensional (3D) or schematic diagram of the protein structure by the “Mutations” module. We also obtained the data of the overall, progression-free, disease-free and disease-free survival differences in the LUSC tumor cases with or without ITGB4 genetic alteration by the “Comparison”. Kaplan–Meier plots with log-rank P-values were acquired as well.
DNA Methylation Analysis
The DNA methylation level of ITGB4 of multiple probes (eg, cg12146151 and cg16047490, etc.) in different tumors of TCGA were obtained from the MEXPRESS web (https://mexpress.be/). The Benjamini-Hochberg-adjusted P-value, Pearson correlation coefficient (R) value and the beta value were obtained. The promoter region probes were highlighted. In addition, the mutation and methylation data of ITGB4 was also obtained from the cBioPortal (https://www.cbioportal.org/) web platform. We next analyzed the prognostic value of the selected methylation probes (eg, cg23913400 and cg0409472, etc.) level in PAAD using the MethSurv online tool (https://biit.cs.ut.ee/methsurv/),20 which was a web tool to provide survival analysis based on DNA methylation biomarkers using TCGA data.
Immune Infiltration Analysis
The TIMER2 web server was used to investigate the correlation between ITGB4 expression and immune infiltrates in all TCGA tumors. This web-based tool uses the immunedeconv R package,21 which regroups six immune estimation algorithms: TIMER, CIBERSORT-ABS, XCELL, CIBERSORT, QUANTISEQ and MCPCOUNTER. The immune cells of cancer-associated fibroblasts were selected. The partial correlation (cor) values and p-values were acquired using the purity-adjusted Spearman’s rank correlation test. The results were visualized in a heatmap and a scatter plot.
ITGB4-Related Gene Enrichment Analysis
We searched for the query of a single protein name (“ITGB4”) and organism (“Homo sapiens”) on the STRING website (https://string-db.org/). Subsequently, the following parameters were set: max number of interactors to show (“no more than 50 interactors”), minimum required interaction score [“low confidence (0.150)”], active interaction sources (“experiments”) and meaning of network edges (“evidence”). Finally, the available experimentally determined ITGB4-binding proteins were acquired.
We obtained the top 100 ITGB4-correlated targeting genes among the datasets of all TCGA tumors and normal tissues by using the “Similar Gene Detection” module of GEPIA2. We also used the “correlation analysis” module to conduct a pairwise gene Pearson correlation analysis of ITGB4 and selected genes. The correlation coefficient (R) and p-values were indicated. The log2 TPM was used for the dot plot. Furthermore, the “Gene_Corr” module of TIMER2 was applied to supply the heatmap data of the selected genes, which contains the p-value and partial correlation (cor) in the purity-adjusted Spearman’s rank correlation test.
An intersection analysis to compare the ITGB4-binding and interacted genes was conducted by Jvenn, an interactive Venn diagram viewer.22 Moreover, the two sets of data were combined to perform Kyoto encyclopedia of genes and genomes (KEGG) pathway analysis. The gene lists were uploaded to database for annotation, visualization, and integrated discovery (DAVID) with the settings for species (“Homo sapiens”), selected identifier (“OFFICIAL_GENE_SYMBOL”) and acquired the data of the functional annotation chart. We used the “tidyr” (https://cran.rproject.org/web/packages/tidyr/index.html) and “ggplot2” (https://cran.r-project.org/web/packages/ggplot2/index.html) R packages to visualize the enriched pathways. Additionally, the “clusterProfiler” (http://www.bioconductor.org/packages/release/bioc/html/clusterProfiler.html) R packages were applied to conduct the gene ontology (GO) enrichment analysis. The data for the cellular component (CC), biological process (BP) and molecular function (MF) were visualized as cnetplots by using the cnetplot function (circular = F, colorEdge = T, node_label = T). We used the R language software (https://www.r-project.org/) to analyze the data. P < 0.05 (two-tailed) was considered statistically significant.
Results
Gene Expression Analysis Data
To investigate the expression pattern of ITGB4 in different nontumor tissues and cells, we extracted ITGB4 gene expression data from the GTEx, function annotation of the mammalian genome 5 (FANTOM5) and human protein atlas (HPA) datasets, as depicted in Figure 1A, which shows that the expression level of ITGB4 in the small intestine was the highest, followed by the salivary gland and placenta. However, ITGB4 can be expressed in most of the detected tissues except for monocytes, total PBMC and NK-cells (all consensus normalized expression values >1), suggesting a low RNA tissue specificity. Interestingly, the ITGB4 exhibited enhanced expression in plasmacytoid dendritic cells, while it was low or unexpressed in other blood cells of the HPA/Monaco/Schmiedel datasets, indicating a high specificity (Figure 1B). The protein concentration of ITGB4 was approximately 79 ng/L (Figure 1C), which was detected in human plasma based on mass spectrometry-based proteomics.
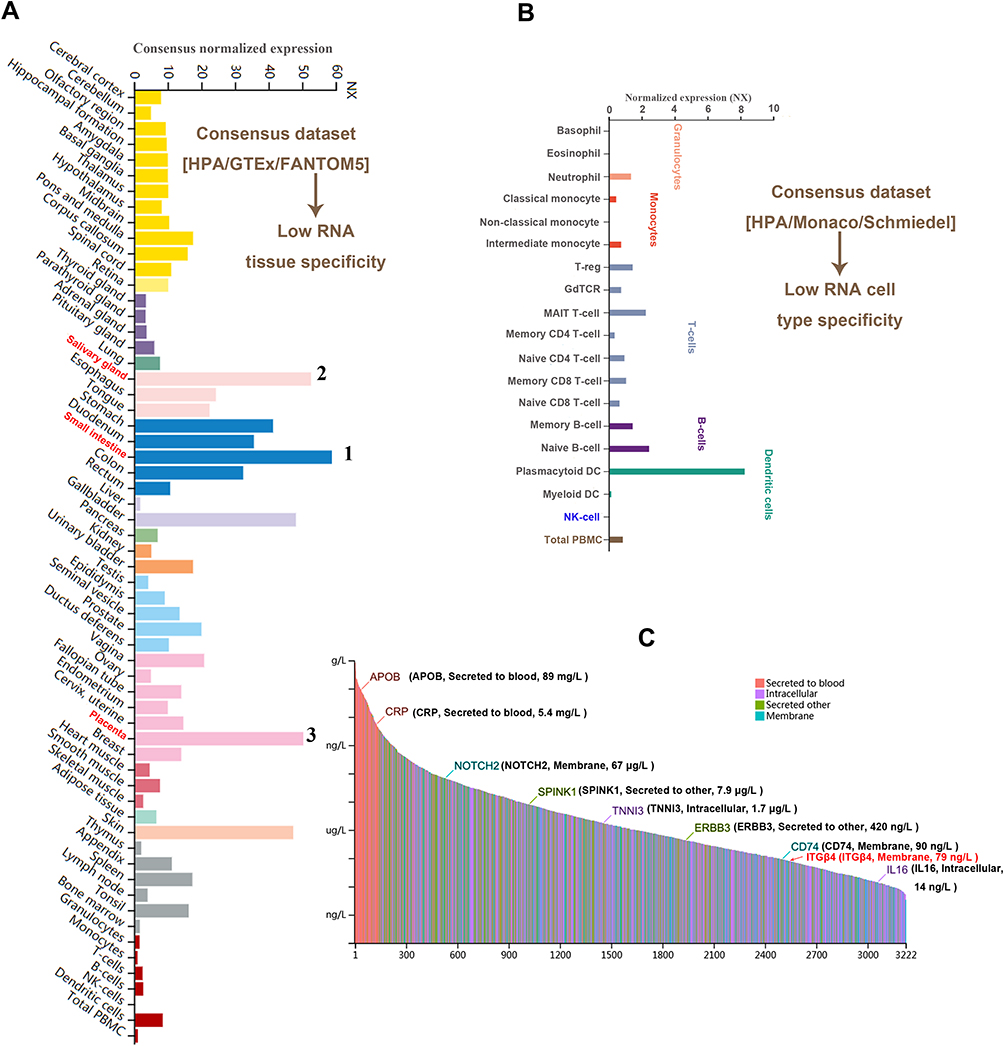 |
Figure 1 The expression of ITGB4 in different cells, tissues and plasma in the normal physiological state. We used the consensus datasets of HPA, GTEx and FANTOM5 or HPA, Monaco and Schmiedel to analyze the expression of ITGB4 in different tissues (A), or different blood cells (B). We also analyzed the ITGB4 expression in plasma based on the data of mass spectrometry (C). |
Next, we analyzed the protein level of ITGB4 across various cancer types of TCGA by using TIMMER2. As shown in Figure 2A, the ITGB4 expression levels in bladder urothelial carcinoma (BLAC), cervical squamous cell carcinoma and endocervical adenocarcinoma (CESC), cholangiocarcinoma (CHOL), colon adenocarcinoma (COAD), lymphoid neoplasm diffuse large B-cell lymphoma (DLBC), esophageal carcinoma (ESCA), glioblastoma multiforme (GBM), head and neck squamous cell carcinoma (HNSC), kidney chromophobe (KIRC), kidney renal papillary cell carcinoma (KIRP), brain lower grade glioma (LGG), liver hepatocellular carcinoma (LIHC), lung adenocarcinoma (LUAD), lung squamous cell carcinoma (LUSC), ovarian serous cystadenocarcinoma (OV), pancreatic adenocarcinoma (PAAD), rectum adenocarcinoma (READ), stomach adenocarcinoma (STAD), testicular germ cell tumors (TGCT), thyroid carcinoma (THCA), thymoma (THYM), uterine corpus endometrial carcinoma (UCEC) (p < 0.001) and pheochromocytoma and paraganglioma (PCPG) (p < 0.05) is higher than in matched controls. However, there were no significant differences in the acute myeloid leukemia (LAML) or even reductions in other tumors, including uterine carcinoma (UCS), breast invasive carcinoma (BRCA), kidney chromophobe (KICH), prostate adenocarcinoma (PRAD), skin cutaneous melanoma (SKCM) (p < 0.001) and adrenocortical carcinoma (ACC) (p < 0.05). We further confirmed that ITGB4 is highly expressed in renal cancer, pancreas cancer, lung cancer, esophagus cancer, brain cancer, head-neck cancer and colon cancer (P < 0.01) by the pooling analysis results of previous reports in the Oncomine database (Figure S1, see additional methods in Supplementary data). However, except for the UCEC and clear cell RCC (renal cell carcinoma) (P < 0.001), the observed changes in ITGB4 protein in ovarian cancer, breast cancer, colon cancer and lung adenocarcinoma were not due to parallel changes in ITGB4 RNA levels (Figure 2B).
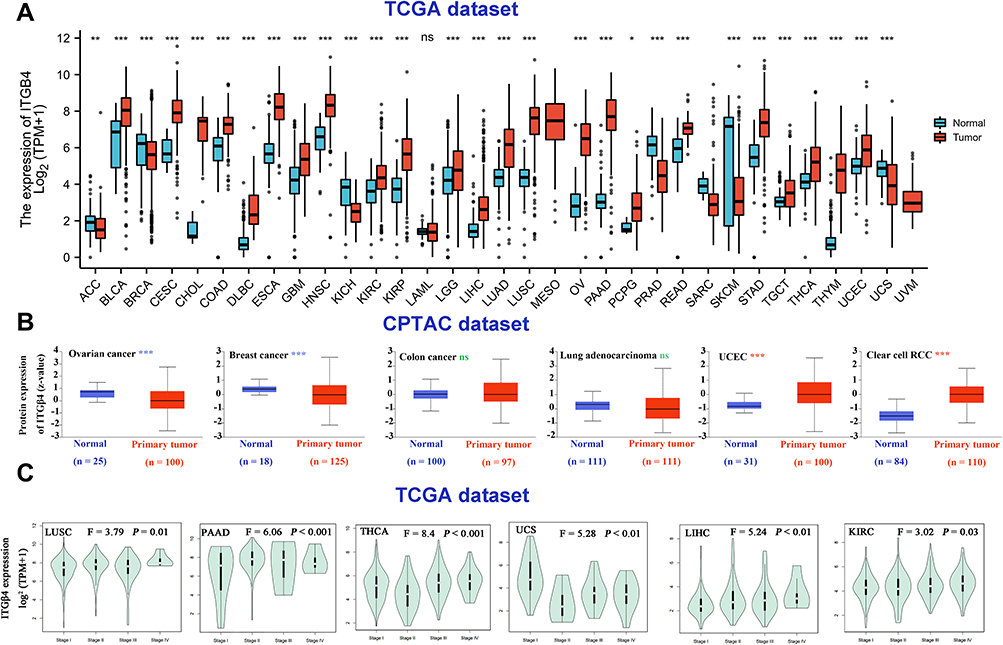 |
Figure 2 Expression level of ITGB4 in different tumors and pathological stages. (A) The expression status of the ITGB4 in different cancer. *P <0.05, **P <0.01, ***P <0.001, ns, not significant. (B) The expression level of ITGB4 total protein between normal tissue and primary tissue of ovarian cancer, breast cancer, colon cancer, lung cancer, UCEC and clear cell RCC. ***P <0.001, ns, not significant. (C) The expression levels of the ITGB4 gene in the main pathological stages (stage I, stage II, stage III and stage IV) of LUSC, PAAD, THCA, UCS, LIHC and KIRC. Log2 (TPM + 1) was applied for log-scale. |
Furthermore, we also observed the correlation between ITGB4 expression and the pathological stages of various cancers by using the “Pathological stage plot” module of HEPIA2 (P = 0.01), including LUSC (P < 0.001), PAAD (P < 0.001), THCA (P < 0.01), UCS (P < 0.01), LIHC (P < 0.01) and KIRC (P = 0.03) (Figure 2C), but not other tumors (Figure S2).
Survival Analysis Data
To clarify the association between ITGB4 and the prognosis of patients with different tumors, we divided the tumors into low-expression and high-expression groups according to the expression levels of ITGB4 in the datasets of TCGA and GEO, respectively. As displayed in Figure 3A, we observed that high ITGB4 expression levels were positively associated with a poor prognosis of overall OS for ACC (P = 0.0044), KIRC (P = 0.041), LGG (P < 0.001) and LUAD (P = 0.00073) within the TCGA project. ITGB4 expression was negatively correlated with the disease-free survival (DFS) prognosis (Figure 3B) for the TCGA tumors of KIRC (P = 0.039), LGG (P < 0.001) and LUAD (P = 0.0017). Nevertheless, the high expression levels of ITGB4 were negatively related to OS prognosis for UVM (P = 0.045) and DFS prognosis for UCEC (P = 0.041).
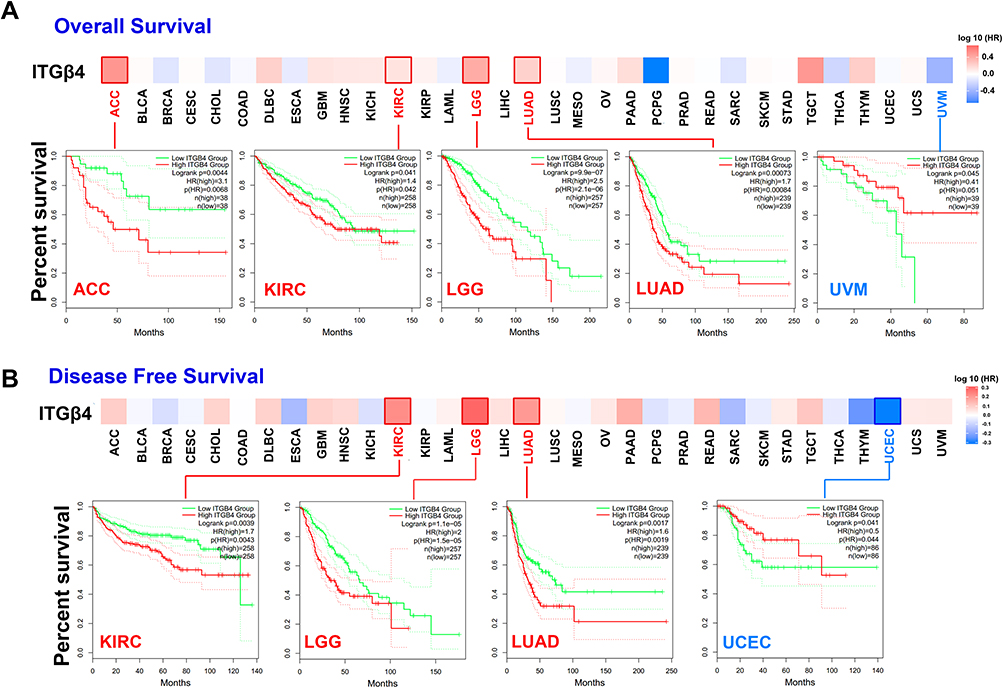 |
Figure 3 Association between ITGB4 gene and survival of cancer in TCGA. Based on the GEPIA2 tool, we conducted overall survival (A) and disease-free survival (B) analyses in different tumors in TCGA by ITGB4 gene expression. The survival map and Kaplan–Meier curves with positive results are provided. |
In addition, the survival analysis of ITGB4 using the Kaplan–Meier plotter online tool shown a correlation between high expression ITGB4 and poor OS (P < 0.001) and post-progression survival (PPS) (P < 0.001) and first progression (FS) (P < 0.001) prognosis in gastric cancer. A high expression level of ITGB4 was related to poor OS (P < 0.001) and FP (P < 0.001) prognosis in lung cancer, poor PPS (P = 0.012) prognosis for breast cancer and poor PFS (P = 0.013) prognosis in ovarian cancer. However, a low ITGB4 expression level was associated with poor OS (P = 0.0017) prognosis in ovarian cancer, poor RFS (P < 0.001) prognosis in breast cancer and poor OS (P = 0.0091) and DSS (P = 0.017) prognosis for liver cancer. We did not detect a correlation between ITGB4 expression and the PPS prognosis of lung and ovarian cancers or through the OS and DMFS prognosis of breast cancer and PFS prognosis of liver cancer (P > 0.05) (Figure S3). We further confirmed the relationship between ITGB4 expression and prognosis for lung cancer, breast cancer, gastric cancer, liver cancer (P < 0.001) and ovarian cancer (P = 0.011) by meta-analysis (Figure 4). Moreover, we conducted a subgroup analysis according to the selected clinical factors and obtained a distinct conclusion (Tables S1–S5). The data above suggests that ITGB4 expression is differentially associated with the prognosis of cases with different tumors.
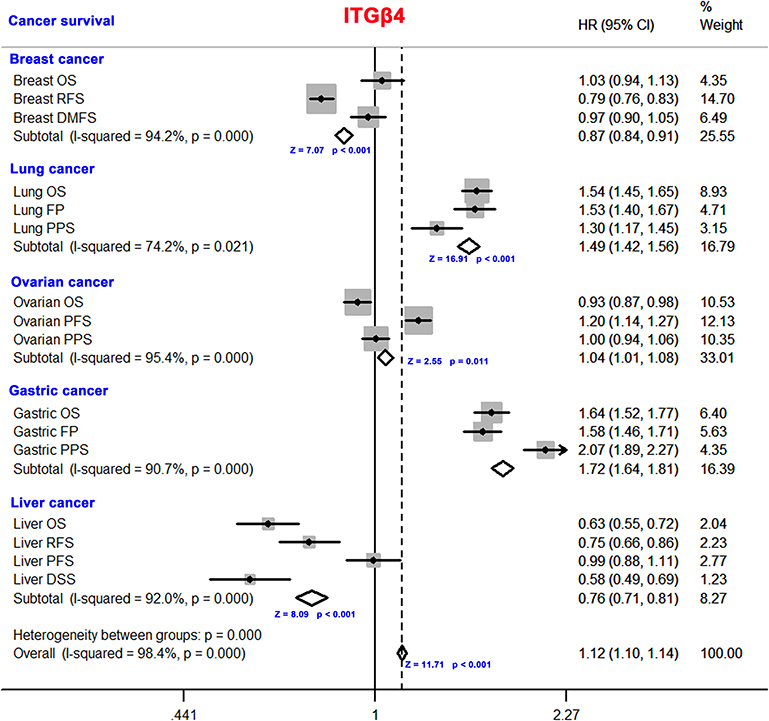 |
Figure 4 Meta-analysis on the correlation between ITGB4 expression and cancer prognosis. The meta-analysis was conducted on the expression level of the IRGB4 in breast cancer, lung cancer, ovarian cancer, gastric cancer and liver cancer. |
Genetic Alteration Analysis Data
We further observed the genetic alteration of ITGB4 in different tumor samples from the TCGA cohorts. Our results demonstrated the highest frequency of ITGB4 (>9%) alteration in patients with skin cutaneous melanoma with “mutation” as the primary type. The uveal melanoma cases with genetic alteration (~1.5% frequency) had a copy number deletion of ITGB4. Notably, the “amplification” type of ITGB4 was the primary type in all mesothelioma cancer cases, which showed an alteration frequency of ~4% (Figure 5A). Next, we observed that the missense mutation of ITGB4 was the major type of genetic alteration, which F201Lfs*15/F201Sfs*9/D198E alteration in the integrin_beta was detected in four cases of UCEC and one case of STAD, COAD, HNSC and mucoid carcinoma (MC) (Figure 5B and C). In addition, the LUSC cases with altered ITGB4 showed worse prognoses in disease-specific (P = 0.0174) and progression-free survival (P = 0.0155), but not in the overall (P = 0.396) and disease-free survival (P = 0.328) when compared with cases without ITGB4 alteration (Figure 5D). Moreover, we also observed a negative correlation between ITGB4 expression and tumor mutational burden (TMB) for COAD (P = 0.00022) and THCA (P = 0.038), but a positive correlation for ACC (P = 0.00067), LUAD (P = 0.0026) and LIHC (P = 0.0033) (Figure S4).
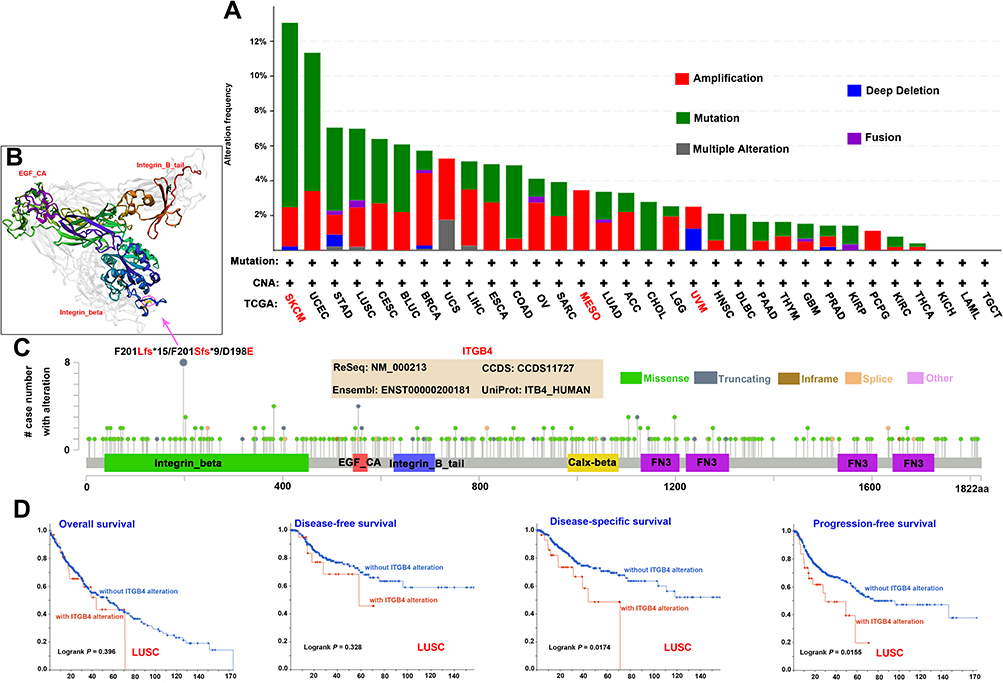 |
Figure 5 Mutation feature of ITGB4 in different tumors of TCGA. We used the cBioPortal tool to analyze the mutation features of ITGB4 for the TCGA tumors. The alteration frequency with mutation type (A) and mutation site (C) are shown. The mutation site with the highest alteration frequency (F201Lfs*15/F201Sfs*9/D198E) was displayed in the 3D structure of ITGB4 (B). Based on the cBioPortal tool, we analyzed the potential correlation between mutation status and overall survival, disease-free survival, disease-specific survival and progression-free survival of LUSC (D). |
DNA Methylation Analysis Data
The MEXPRESS was used to investigate the association between ITGB4 DNA methylation and the pathogenesis of different tumors in the TCGA project. For the PAAD case, we observed a significant positive correlation of ITGB4 DNA methylation and gene expression at multiple probes of the non-promoter region, such as cg15958938 (P < 0.001, R = 0.607), as depicted in Figure S5. Furthermore, although we failed to observe a relationship between the OS of PAAD and ITGB4 methylation (Figure 6A, P = 0.945), we discovered that patients with high ITGB4 methylation at most of CpG sites located on the CpG island indicated a poor prognosis, including cg04094723, cg16047490, cg13347255, cg11223622 and cg16916914 (Figure 6B–D). Finally, the methylation level of ITGB4 was high in PAAD by MethSurv (Figure 6E). As a consequence of the lack of ITGB4 expression data, we did not analyze the association between DNA methylation and ITGB4 expression.
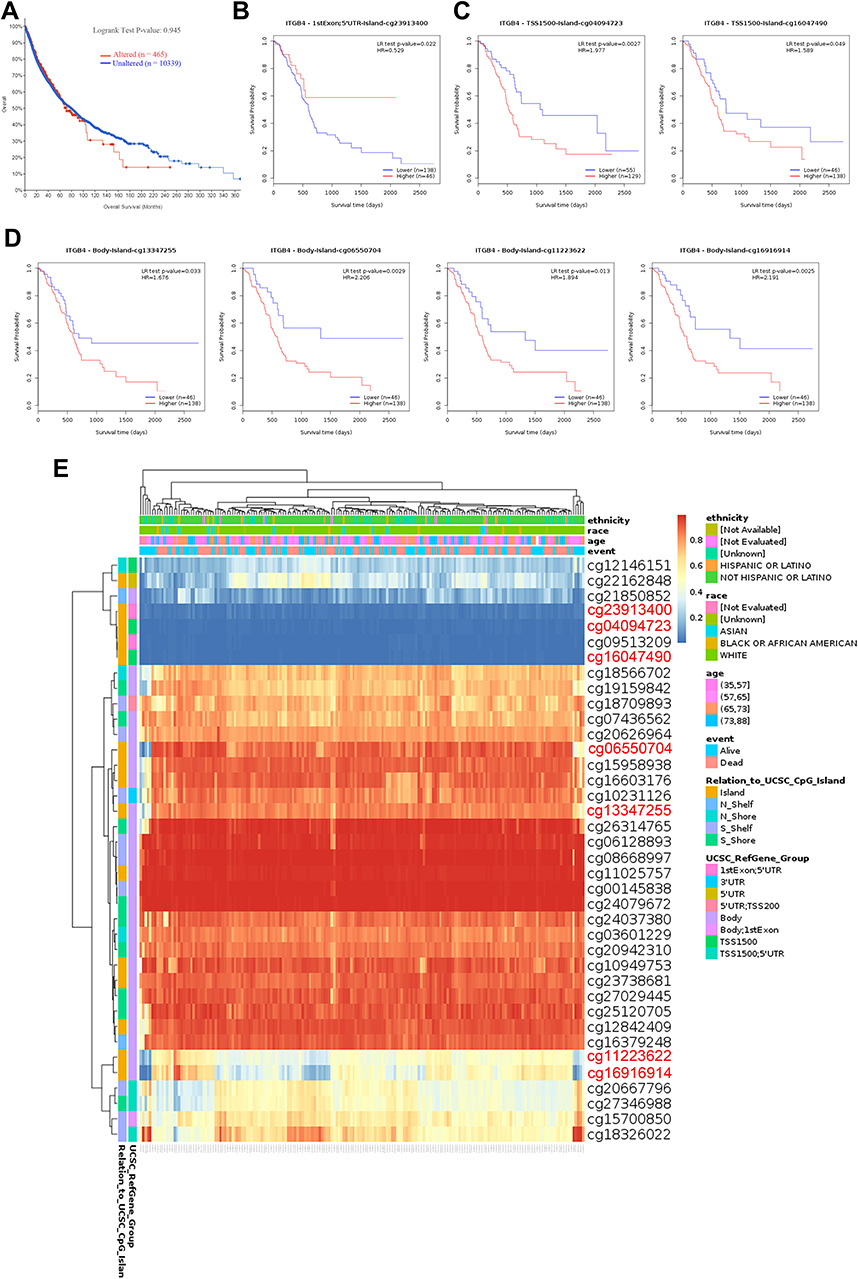 |
Figure 6 The MethSurv obtained the effect of methylation level and ITGB4 expression on prognosis in PAAD. (A) The association of the genetic alteration in ITGB4 with OS of PAAD patients. (B–D) the Kaplan-Meier survival of ITGB4 at the specific probes (cg23913400, cg04094723, cg16047490, cg13347255, cg11223622 and cg16916914). (E) The visualization between the methylation level and the ITGB4 expression. |
Protein Phosphorylation Analysis Data
Next, we analyzed the ITGB4 phosphorylation levels between primary tumor tissues and normal tissues in five types of tumors (LUAD, clear cell RCC, breast cancer, colon cancer, ovarian cancer and UCEC) by using the CPTAC dataset (Figure 7A-F). The detailed information on ITGB4 phosphorylation sites in different cancers is summarized in Figure 7A. The S1457 exhibits a lower phosphorylation level in most cancer types, including breast cancer, colon cancer and ovarian cancer (Figure 7D–F, P < 0.05), while the phosphorylation of ITGB4 at S1457 in UCEC was high (Figure 7G). In addition, phosphorylation of S1454 and T1471 were also found to be increased in clear cell RCC, while its phosphorylation in colon cancer or breast cancer was low (Figure 7C–E), which suggested that even the same site phosphorylation of ITGB4 may play different roles in different cancers. We also found that ITGB4 phosphorylation of T1530 was experimentally supported by one publication23 (Table S6). This observation merits further molecular assays for further exploration of the potential role of T1530 phosphorylation in tumorigenesis.
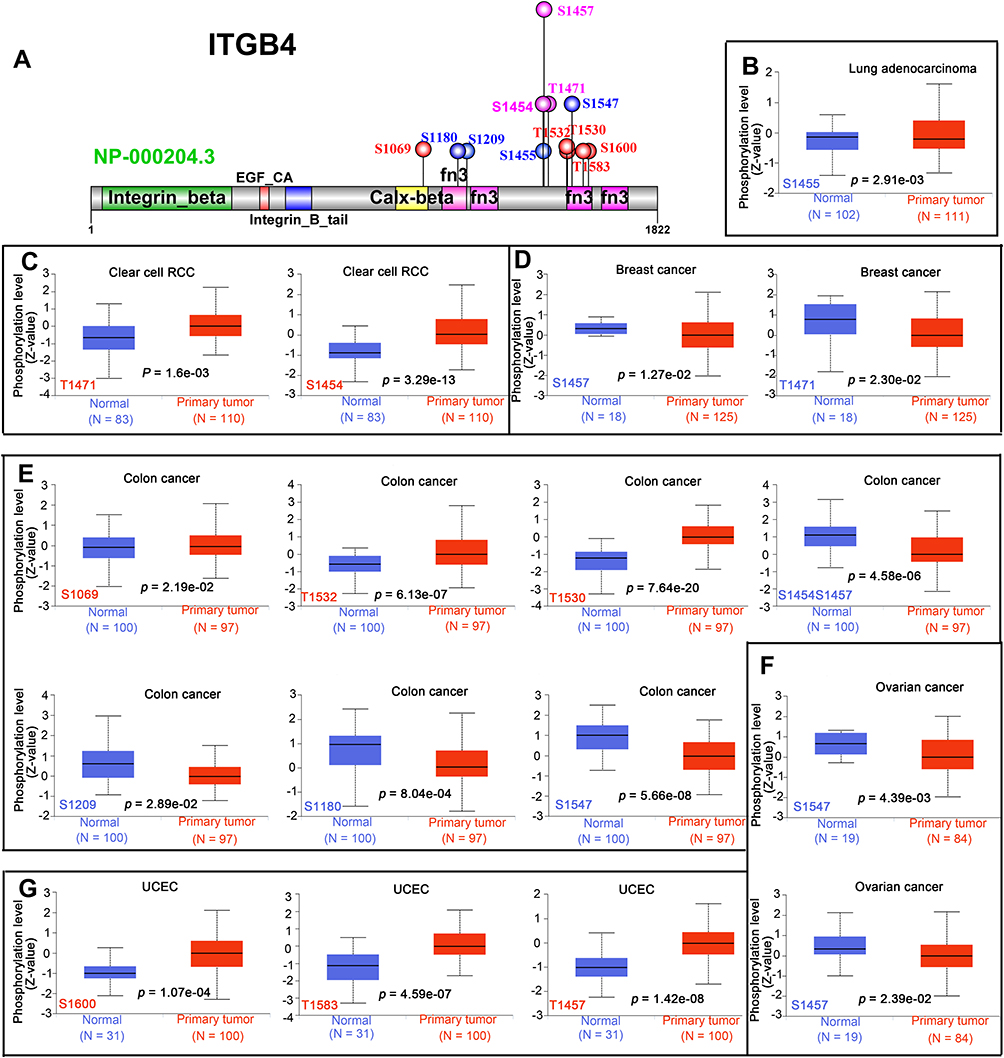 |
Figure 7 Phosphorylation analysis of ITGB4 protein in different tumors. The expression of the ITGB4 phosphorylation (NP_000204.3, S1455, T1471, S1454, S1457, S1069, T1532, T1530, S1209, S1180, S1547, S1600 and T1583) between primary tissue of selected tumors and normal tissue from the UALCAN. The phosphoprotein sites with positive or negative results are shown in the schematic diagram of ITGB4 protein (A). The box plots for different cancers are also supplied, including lung adenocarcinoma (B), clear cell RCC (C), breast cancer (D), colon cancer (E), ovarian cancer (F) and UCEC (G). |
Immune Infiltration Analysis Data
Tumor-infiltration immune cells can not only disrupt the cytokine signal in the tumor microenvironment but also serve as a significant part in the initiation, progression or metastasis of cancer.24,25 Cancer-associated fibroblasts control the functions of other immune cells and are the key regulators of immune response and homeostasis.26 Therefore, we investigated the potential association between the infiltration level of various immune cells and ITGB4 gene expression in diverse cancer types of TCGA by using the TIMER, CIBERSORT-ABS, CIBERSORT, QUANTISEQ, XCELL, MCPCOUNTER and EPIC algorithms. We observed a statistically positive correlation between immune cells including NK cells, neutrophils and ITGB4 expression in the tumors of SKCM, PRAD, BRCA, LUAD and UCEC (Figure S6). Furthermore, we found a statistical positive correlation between the estimated infiltration value of cancer-associated fibroblasts and ITGB4 expression for the TCGA tumors of LGG, LIHC, PRAD, SKCM-Matastasis, TGCT and THYM, while a negative correlation between MESO and ITGB4 (Figure 8A). As showcased in Figure 8B, the scatter plot data of the tumors listed above was produced using an algorithm.
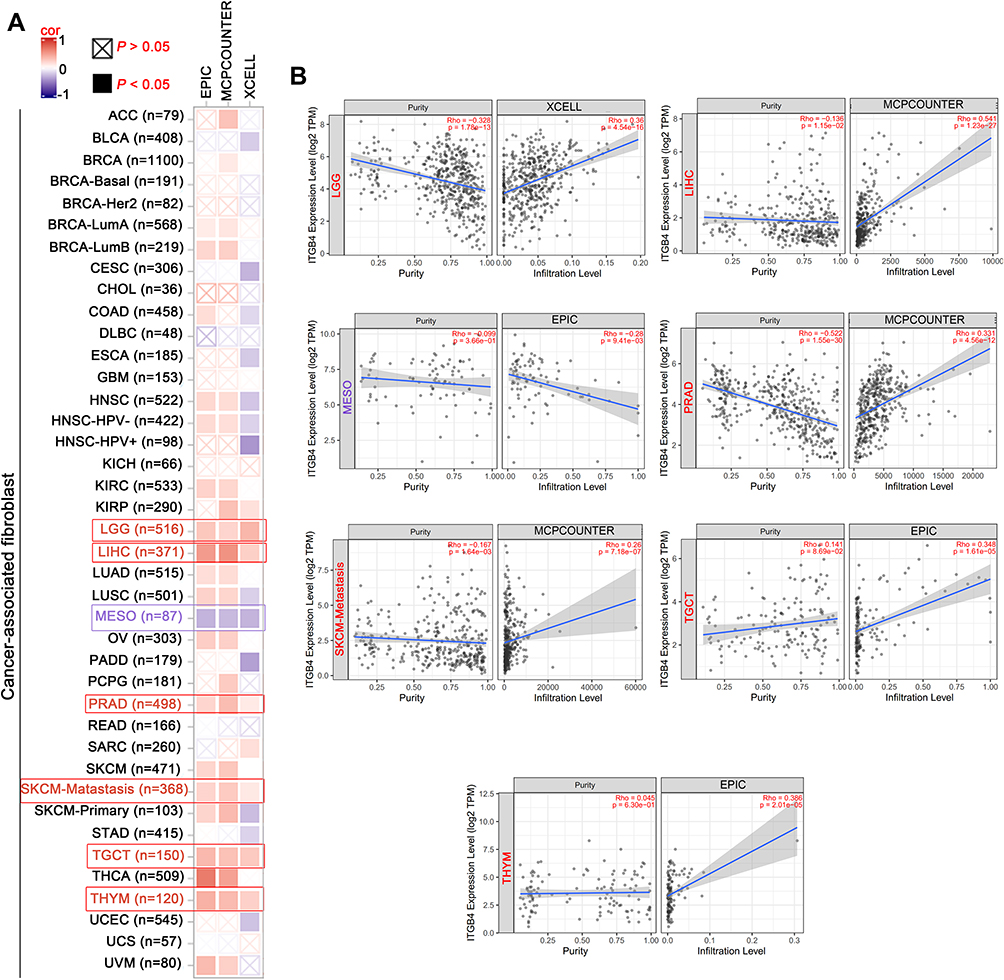 |
Figure 8 Correlation analysis between ITGB4 expression and immune infiltration of cancer-associated fibroblast. The different algorithms were used to explored the potential association between the ITGB4 expression (A) and the infiltration level of cancer-associated fibroblast across all types of cancer in TCGA (B). Red box represents positive correlation whereas purple represents negative correlation. |
Enrichment Analysis of ITGB4-Related Partners
We next attempted to screen out the ITGB4 expression-correlated genes and targeted ITGB4-binding proteins to investigate the molecular mechanism of ITGB4 in tumorigenesis. By using the STRING tool, we acquired 50 ITGB4-binding proteins, which were supported by experimental evidence. Figure 9A shows the protein–protein interaction network. Based on the GEPIA2 tool, we obtained the top 100 genes that correlated with ITGB4 expression and combined all tumor expression data of TCGA. As displayed in Figure 9B, the ITGB4 expression was positively correlated with Ladinin1 ([LAD1], R = 0.60), Laminin subunit beta3 ([LAMB3], R = 0.63), plakophilin3 ([PKP3], R = 0.61), gap junction protein beta3 ([GJB3], R = 0.68) and gap junction protein beta5 ([GJB5], R = 0.59) genes (all P < 0.001). The corresponding heatmap data also showed a positive association between the above five genes and ITGB4 in most of the detailed cancer types (Figure 9C). An intersection analysis of the 50 ITGB4-binding proteins and the top 100 genes showed four common members, namely, chloride channel accessory 2 (CLCA2), Plectin (PLEC), integrin subunit alpha6 (ITGA6) and collagen type XVII alpha 1 chain (COL17A1) (Figure 9D). KEGG (Kyoto Encyclopedia of Genes and Genomes) pathway analysis indicated that pathways involved in salmonella infection, amoebiasis, small cell lung cancer and ECM–receptor interaction were most significantly involved in the effect of ITGB4 on tumor pathogenesis (Figure 9E). Based on the GO analysis (Table S7), S100 protein binding, cell–cell adhesion mediator activity, cadherin binding involved in cell–cell adhesion, cell adhesion molecule binding and cadherin binding were among the most affected molecular functions. In addition, the GO analysis also indicated that the most significantly affected biological processes and cellular components (CCs) (Figure S7), which were consistent with the finding in MFs (Figure 9F).
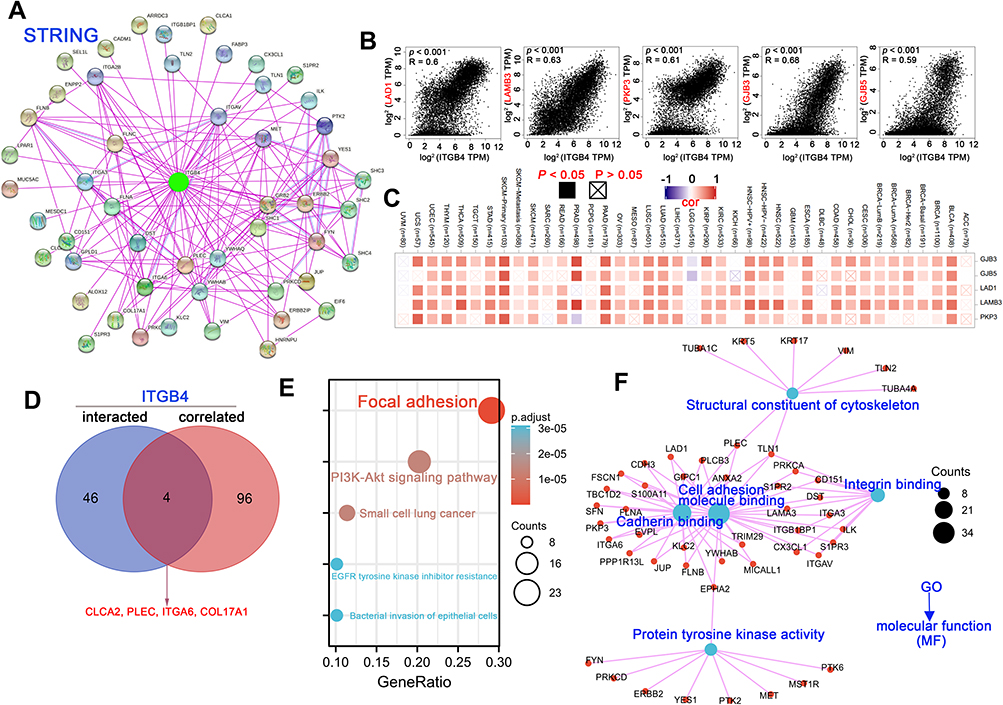 |
Figure 9 ITGB4-related gene enrichment analysis. (A) Based on the STRING tool, we obtained the available experimentally determined ITGB4-binding proteins. (B) The top 100 ITGB4-correlated genes in TCGA projects were obtained using the GEPIA2 approach, and we also analyzed the expression correlation between ITGB4 and selected targeting genes, including LAD1, LAMB3, PKP3, GJB3 and GJB5. (C) The corresponding heatmap data in the detailed cancer types are showed. (D) An intersection analysis between the ITGB4-binding and correlated genes was performed. (E) KEGG analysis was conducted base on the ITGB4-binding and interacted genes. (F) GO term enrichment analysis of ITGB4-binding and interacted genes in molecular function is also shown. |
Discussion
Integrins, are heterodimeric cell surface receptors that directly bind components of the ECM and provide the needed traction for cell migration and invasion. There are 24 integrins in humans, which are formed by the combination of 8 β-subunits and 18α-subunits. Integrin α6 is overexpressed on breast cancer cells,27 and the in vivo imaging of it could exert a significant role in the prognostic prediction and therapeutic guidance.28 ITGB4, a subunit of α6β4, is a member of the integrin superfamily of cell adhesion receptors that bind to cell-surface ligands, ECM ligands, and soluble ligands.29 It has also been reported that multifunctional ITGB4 is involved in a series of cellular biological processes, such as cell migration,30 perinatal death,31 cell adhesion32 and cell proliferation.33 Numerous studies have reported that the expression of ITGB4 increases significantly during tumor aggressiveness and metastasis in multiple prevalent tumor types, including colon cancer,34 cervical cancer,35 prostate cancer,36 head and neck squamous cell carcinoma (HNSCC),37 non-small cell lung cancer38 and hepatocellular carcinoma,39 suggesting an intimate link between abnormal expression of ITGB4 and tumor aggressiveness. Unfortunately, whether the aberrant expression of ITGB4 is a common phenomenon in different tumors, or whether ITGB4 mediates the pathogenesis of different tumors through certain similar molecular mechanisms or whether both occur simultaneously remains to be answered. In our study, ITGB4 was highly expressed in most tumors based on TCGA data, which is not in line with the altered protein levels in ovarian cancer, colon cancer, and lung adenocarcinoma in the CPTAC dataset. This prompted us to speculate that the elevated RNA levels of ITGB4 may be common, but it may not correlate with actual protein expression or responses to certain cancer types.
Furthermore, the survival prognosis analysis data for the ITGB4 gene suggested divergent reactions for different tumors. Previously, Tagliabue et al40 and Brendle et al41 demonstrated that high levels of ITGB4 were linked to poor OS prognosis in breast cancer based on the clinical outcome data. However, we failed to detect a correlation between ITGB4 expression and OS prognosis in breast cancer patients (P = 0.057) by using GEPIA2 tool. In view of the different volumes of data in between, we postulated that the different data processes or updated survival information might result in this discrepancy. Thus, we performed a Cox regression survival analysis using OncoLnc (http://www.oncolnc.org/) and failed to observe a statistical correlation (Cox coefficient = −0.082, P = 0.36). In addition, we conducted a survival analysis using the Kaplan–Meier plotter approach42 and found no significant correlation between ITGB4 expression and the clinical prognosis of OS and DMFS. However, it is noteworthy that a positive correlation between ITGB4 and RFS (P < 0.001) was observed, whereas a negative correlation was found between ITGB4 and PPS (P = 0.012). Due to this, larger sample sizes are needed to confirm the role of ITGB4 expression in the clinical prognosis of breast cancer.
Wu et al38 and Mohanty et al43 recently reported that the high expression of ITGB4 correlated with poorer prognoses in patients with LUAD. Consistent with these in vitro findings, our results showed a correlation between ITGB4 high expression and poor OS (P < 0.001) and disease-free survival prognosis (P = 0.0017) in LUAD, but not in LUSC unless ITGB4 alteration was present. Meanwhile, we also found that high ITGB4 expression was associated with poor OS, fast progression and post-progression survival prognosis in LUAD. In addition, a statistical correlation was observed between ITGB4 expression and LUAD (cox coefficient = 0.244, P = 0.0016). Similarly, we also observed a positive correlation of high ITGB4 and poor prognosis of OS, FP and PPS in patients with gastric cancer, which is in agreement with recent reports.44–46 Consequently, the currently clinical big data-based evidence can support the role of ITGB4 in the clinical prognosis of LUAD and gastric cancer.
Epithelial to mesenchymal transition (EMT) is an unintentional behavior of cells during cancer progression but is a key driving force for cells during tumor growth and recurrence. A recent study demonstrated that ITGB4 induced EMT and promoted the proliferation and invasion of liver cancer cell lines,39 supporting the adverse prognostic indicator of ITGB4 expression in liver cancer. In our study, however, we failed to observe a negative correlation between high ITGB4 expression and the survival prognosis of liver cancer patients (P = 0.97). Based on the dataset from the Kaplan–Meier plotter, we observed that high ITGB4 expression was associated with positive clinical outcomes of OS and disease-specific survival, particularly in subgroup analysis of “Gender/Male”, “Race/Asian” and “Hepatitis virus infection”. Likewise, although previous studies have demonstrated that ITGB4 act as an upstream and downstream signaling molecular-promoting OV development and metastasis,47–49 our results showed that high ITGB4 expression was statistically, significantly and positively associated with overall survival for OV, especially for patients with later-stage OV (stage 3). In addition, although ITGB4 was reported to promote the growth and metastasis of cervical cancer and lead to poor patient outcome,35,50 our TCGA-based survival analysis results suggested a positive correlation between high ITGB4 expression and clinical prognosis for uterine corpus endometrial carcinoma. High ITGB4 expressions have also been reported to be involved in the metastasis of acral melanoma,51 whereas we failed to analyze ITGB4 expression between UVM and normal tissues due to the fact that the TCGA-UVM cohorts only contain tumor data. Nevertheless, high ITGB4 expression seems to be linked to positive clinical prognoses of UVM cases. This finding that both high and low ITGB4 expressions is correlated with the poor prognosis of the above tumors seems contradictory. There are several possible explanations for these seemingly contradictory results. First, the number of analyzed samples was relatively low, and no more than 100 cases of ACC, UVM and UCEC were included in either the high or low ITGB4 expression groups. Perhaps, cohort studies with long-term follow-up and large sample sizes, or a systematic review and large-scale meta-analysis of the above controversial conclusion, are warranted to reach a more definitive conclusion. Additionally, we observed a negative correlation between high ITGB4 expression and the prognosis of OS and PFS at the end-stage of OV (stage 4). Thus, additional clinical features should also be carefully considered. It is also plausible, and indeed likely that the ITGB4-mediated assembly of hemidesmosomes, which mediate stable adhesion by connecting the intracellular keratin cytoskeleton to the basement membrane,52 contributes to both epithelial polarity and growth in normal cells, whereas cancer cell proliferation and invasion is fostered by ITGB4 signaling. Finally, more in-depth clinical studies and molecular experimental evidence are required to provide definitive answers to whether high ITGB4 expression is important at the early stages of the above tumor development, potential tumor initiation, or whether it is only caused by normal tissue suppression or restrictive rumors.
Scientific interest in exploring the mechanisms responsible for integrins in cancers has continued to grow in the recent decades.53,54 In the present study, for the first time, we demonstrated the potential association between TMB and ITGB4 expression. In addition, the information on ITGB4-binding components and ITGB4 expression-related genes across all tumors is integrated, and we identified the potential impact of “focal adhesion”, “PI3K-Akt signaling pathway” and RNA metabolism in the etiology or pathogenesis of cancers. This study demonstrates that ITGB4-overexpressing triple negative breast cancer cells provide a cancer-associated fibroblast with ITGB4 proteins via exosome.55 Our study demonstrated a novel statistically positive correlation between ITGB4 expression and the immune infiltration level of cancer-associated fibroblasts in LGG, LIHC, PRAD, SKCM-Matastasis, TGCT and THYM when applied to multiple immune deconvolution methods. Furthermore, our findings are the first to identify the association of ITGB4 expression and the level of immune cell infiltration level in certain tumors.
DNA methylation is a crucial part of epigenetic regulation and is present in all forms of cancer.56 A recent report demonstrated that hypermethylation was observed and associated with high gene expression of ITGB4 in the CpG island surrounding the ITGB4 transcription starting site for prostate cancer.36 In the current study, we were the first to observe that high ITGB4 expression might be linked to ITGB4 hypermethylation at the non-promoter region in PAAD, whereas five CpGs (cg27346988, cg18326022, cg20667796, cg18709893 and cg15700850) of ITGB4 were negatively associated with ITGB4 expression. Interestingly, ITGB4 hypermethylation found at different sites (cg06550704, cg11223622, cg13347255, cg16047490, cg16916914 and cg04094723) was associated with the poor prognosis of PAAD, which is consistent with a recent report in pancreatic cancer.57 Given that methylation of CpGs located in gene promoter robustly links to gene expression in an inverse manner,58–60 we postulate that high ITGB4 expression may correlate with poor prognosis of PAAD, although further investigations are needed.
ITGB4 and its phosphorylation at tyrosine Y1510 reportedly promoted cell migration and invasion in pancreatic cancer.61 Based on the CPTAC dataset, we found that a low ITGB4 expression level of total protein and phosphorylation level of ITGB4 at the S1457 in breast and ovarian cancers, whereas a high ITGB4 total protein level and phosphorylation level were observed in UCEC. These new findings suggest that the level of S1457 phosphorylation is positively correlated with the expression of ITGB4. However, the functional consequences of these phosphorylation events have not been determined, and further experiments are required to determine the role of ITGB4 phosphorylation at S1457 in tumorigenesis and tumor development.
In summary, we conducted the first pan-cancer analyses of ITGB4 and now present a statistical association between ITGB4 expression and protein phosphorylation, DNA methylation, tumor mutational burden, immune cell infiltration and clinical prognosis across multiple tumors, thereby offering critical and innovative insights into the role of ITGB4 in tumorigenesis from the perspective of clinical tumor samples.
Data Sharing Statement
All the datasets analyzed during the current article are available in the TCGA. All the data generated during this study are included in the published article. Further information is available from the corresponding author Dr Huang ([email protected]) upon reasonable request.
Ethics Statement
Ethics approval was obtained from Liuzhou maternity and Child Healthcare Hospital Human Research Ethics Committee (approval number 2021004).
Acknowledgments
The authors would like to sincerely thank the TCGA for data sharing, as well as cBioPortal, TIMER2, UALCAN portal, and GEPIA.
Funding
This work was financially supported by Self-raised Scientific Research Projects of the Guangxi Zhuang Autonomous Region Health Commission (grant number Z20210585) (to WJ Huang).
Disclosure
The authors report no conflicts of interest in this work and have declared that the research was conducted in the absence of any commercial or financial relationships that could be construed as a potential conflict of interest.
References
1. Second call for pan-cancer analysis. Nat Genet. 2014;46(12):1251. doi:10.1038/ng.3155
2. Sheppard D. Functions of pulmonary epithelial integrins: from development to disease. Physiol Rev. 2003;83(3):673–686. doi:10.1152/physrev.00033.2002
3. Guo W, Giancotti FG. Integrin signalling during tumour progression. Nat Rev Mol Cell Biol. 2004;5(10):816–826. doi:10.1038/nrm1490
4. Huang W, Yan Y, Liu Y, et al. Exosomes with low miR-34c-3p expression promote invasion and migration of non-small cell lung cancer by upregulating integrin α2β1. Signal Transd Targeted Ther. 2020;5(1):39. doi:10.1038/s41392-020-0133-y
5. Hynes RO. Integrins: bidirectional, allosteric signaling machines. Cell. 2002;110(6):673–687. doi:10.1016/s0092-8674(02)00971-6
6. Thuveson M, Gaengel K, Collu GM, Chin ML, Singh J, Mlodzik M. Integrins are required for synchronous ommatidial rotation in the Drosophila eye linking planar cell polarity signalling to the extracellular matrix. Open Biol. 2019;9(8):190148. doi:10.1098/rsob.190148
7. Giancotti FG. Targeting integrin beta4 for cancer and anti-angiogenic therapy. Trends Pharmacol Sci. 2007;28(10):506–511. doi:10.1016/j.tips.2007.08.004
8. Giancotti FG, Tarone G. Positional control of cell fate through joint integrin/receptor protein kinase signaling. Annu Rev Cell Dev Biol. 2003;19:173–206. doi:10.1146/annurev.cellbio.19.031103.133334
9. Mercurio AM, Bachelder RE, Rabinovitz I, O’Connor KL, Tani T, Shaw LM. The metastatic odyssey: the integrin connection. Surg Oncol Clin N Am. 2001;10(2):
10. Mercurio AM, Rabinovitz I. Towards a mechanistic understanding of tumor invasion–lessons from the alpha 6 beta 4 integrin. Semin Cancer Biol. 2001;11(2):129–141. doi:10.1006/scbi.2000.0364
11. Nikolopoulos SN, Blaikie P, Yoshioka T, Guo W, Giancotti FG. Integrin beta4 signaling promotes tumor angiogenesis. Cancer Cell. 2004;6(5):471–483. doi:10.1016/j.ccr.2004.09.029
12. Masugi Y, Yamazaki K, Emoto K, et al. Upregulation of integrin β4 promotes epithelial-mesenchymal transition and is a novel prognostic marker in pancreatic ductal adenocarcinoma. Lab Invest. 2015;95(3):308–319. doi:10.1038/labinvest.2014.166
13. Nieto MA, Huang RY, Jackson RA, Thiery JP. EMT: 2016. Cell. 2016;166(1):21–45. doi:10.1016/j.cell.2016.06.028
14. Diaz LK, Cristofanilli M, Zhou X, et al. Beta4 integrin subunit gene expression correlates with tumor size and nuclear grade in early breast cancer. Mod Pathol. 2005;18(9):1165–1175. doi:10.1038/modpathol.3800411
15. Kitajiri S, Hosaka N, Hiraumi H, Hirose T, Ikehara S. Increased expression of integrin beta-4 in papillary thyroid carcinoma with gross lymph node metastasis. Pathol Int. 2002;52(7):438–441. doi:10.1046/j.1440-1827.2002.01379.x
16. Kurokawa A, Nagata M, Kitamura N, et al. Diagnostic value of integrin alpha3, beta4, and beta5 gene expression levels for the clinical outcome of tongue squamous cell carcinoma. Cancer. 2008;112(6):1272–1281. doi:10.1002/cncr.23295
17. Bierie B, Pierce SE, Kroeger C, et al. Integrin-β4 identifies cancer stem cell-enriched populations of partially mesenchymal carcinoma cells. Proc Natl Acad Sci USA. 2017;114(12):E2337–E2346. doi:10.1073/pnas.1618298114
18. Chandrashekar DS, Bashel B, Balasubramanya SAH, et al. UALCAN: a portal for facilitating tumor subgroup gene expression and survival analyses. Neoplasia (New York, NY). 2017;19(8):649–658. doi:10.1016/j.neo.2017.05.002
19. Cerami E, Gao J, Dogrusoz U, et al. The cBio cancer genomics portal: an open platform for exploring multidimensional cancer genomics data. Cancer Discov. 2012;2(5):401–404. doi:10.1158/2159-8290.cd-12-0095
20. Bonneville R, Krook MA, Kautto EA, et al. Landscape of microsatellite instability across 39 cancer types. JCO Precision Oncol. 2017;2017. doi:10.1200/po.17.00073
21. Sturm G, Finotello F, Petitprez F, et al. Comprehensive evaluation of transcriptome-based cell-type quantification methods for immuno-oncology. Bioinformatics (Oxford, England). 2019;35(14):i436–i445. doi:10.1093/bioinformatics/btz363
22. Bardou P, Mariette J, Escudié F, Djemiel C, Klopp C. jvenn: an interactive Venn diagram viewer. BMC Bioinform. 2014;15(1):293. doi:10.1186/1471-2105-15-293
23. Beausoleil SA, Villén J, Gerber SA, Rush J, Gygi SP. A probability-based approach for high-throughput protein phosphorylation analysis and site localization. Nat Biotechnol. 2006;24(10):1285–1292. doi:10.1038/nbt1240
24. Fridman WH, Galon J, Dieu-Nosjean MC, et al. Immune infiltration in human cancer: prognostic significance and disease control. Curr Top Microbiol Immunol. 2011;344:1–24. doi:10.1007/82_2010_46
25. Wu T, Dai Y. Tumor microenvironment and therapeutic response. Cancer Lett. 2017;387:61–68. doi:10.1016/j.canlet.2016.01.043
26. Chen X, Song E. Turning foes to friends: targeting cancer-associated fibroblasts. Nat Rev Drug Discov. 2019;18(2):99–115. doi:10.1038/s41573-018-0004-1
27. Friedrichs K, Ruiz P, Franke F, Gille I, Terpe HJ, Imhof BA. High expression level of alpha 6 integrin in human breast carcinoma is correlated with reduced survival. Cancer Res. 1995;55(4):901–906.
28. Gao S, Jia B, Feng G, et al. First-in-human pilot study of an integrin α6-targeted radiotracer for SPECT imaging of breast cancer. Signal Transd Targeted Ther. 2020;5(1)):147. doi:10.1038/s41392-020-00266-9
29. Takada Y, Ye X, Simon S. The integrins. Genome Biol. 2007;8(5):215. doi:10.1186/gb-2007-8-5-215
30. Chen Y, Zhang H, Han F, et al. The depletion of MARVELD1 leads to murine placenta accreta via integrin β4-dependent trophoblast cell invasion. J Cell Physiol. 2018;233(3):2257–2269. doi:10.1002/jcp.26098
31. Fabre S, Chantepie L, Plisson-Petit F, et al. A novel homozygous nonsense mutation in ITGB4 gene causes epidermolysis bullosa in Mouton Vendéen sheep. Anim Genet. 2021;52(1):138–139. doi:10.1111/age.13026
32. Mueller CK, Thorwarth M, Chen J, Schultze-Mosgau S. A laboratory study comparing the effect of ridge exposure using tissue punch versus mucoperiosteal flap on the formation of the implant-epithelial junction. Oral Surg Oral Med Oral Pathol Oral Radiol. 2012;114(5 Suppl):S41–45. doi:10.1016/j.tripleo.2011.08.019
33. Van der Zee CE, Kreft M, Beckers G, Kuipers A, Sonnenberg A. Conditional deletion of the Itgb4 integrin gene in Schwann cells leads to delayed peripheral nerve regeneration. J Neurosci. 2008;28(44):11292–11303. doi:10.1523/jneurosci.3068-08.2008
34. Li M, Jiang X, Wang G, et al. ITGB4 is a novel prognostic factor in colon cancer. J Cancer. 2019;10(21):5223–5233. doi:10.7150/jca.29269
35. Wang S, Li J, Xie J, et al. Programmed death ligand 1 promotes lymph node metastasis and glucose metabolism in cervical cancer by activating integrin β4/SNAI1/SIRT3 signaling pathway. Oncogene. 2018;37(30):4164–4180. doi:10.1038/s41388-018-0252-x
36. Wilkinson EJ, Woodworth AM, Parker M, et al. Epigenetic regulation of the ITGB4 gene in prostate cancer. Exp Cell Res. 2020;392(2):112055. doi:10.1016/j.yexcr.2020.112055
37. Li GS, Hou W, Chen G, et al. Clinical significance of integrin subunit Beta 4 in head and neck squamous cell carcinoma. Cancer Biother Radiopharm. 2020. doi:10.1089/cbr.2020.3943
38. Wu P, Wang Y, Wu Y, Jia Z, Song Y, Liang N. Expression and prognostic analyses of ITGA11, ITGB4 and ITGB8 in human non-small cell lung cancer. PeerJ. 2019;7:e8299. doi:10.7717/peerj.8299
39. Li XL, Liu L, Li DD, et al. Integrin β4 promotes cell invasion and epithelial-mesenchymal transition through the modulation of Slug expression in hepatocellular carcinoma. Sci Rep. 2017;7:40464. doi:10.1038/srep40464
40. Tagliabue E, Ghirelli C, Squicciarini P, Aiello P, Colnaghi MI, Ménard S. Prognostic value of alpha 6 beta 4 integrin expression in breast carcinomas is affected by laminin production from tumor cells. Clin Cancer Res. 1998;4(2):407–410.
41. Brendle A, Lei H, Brandt A, et al. Polymorphisms in predicted microRNA-binding sites in integrin genes and breast cancer: ITGB4 as prognostic marker. Carcinogenesis. 2008;29(7):1394–1399. doi:10.1093/carcin/bgn126
42. Menyhárt O, Nagy Á, Győrffy B. Determining consistent prognostic biomarkers of overall survival and vascular invasion in hepatocellular carcinoma. R Soc Open Sci. 2018;5(12):181006. doi:10.1098/rsos.181006
43. Mohanty A, Nam A, Pozhitkov A, et al. A non-genetic mechanism involving the integrin β4/paxillin axis contributes to chemoresistance in lung cancer. iScience. 2020;23(9):101496. doi:10.1016/j.isci.2020.101496
44. Huafeng J, Deqing Z, Yong D, Yulian Z, Ailing H. A cross-talk between integrin β4 and epidermal growth factor receptor induces gefitinib chemoresistance to gastric cancer. Cancer Cell Int. 2018;18:50. doi:10.1186/s12935-018-0548-5
45. Gan L, Meng J, Xu M, et al. Extracellular matrix protein 1 promotes cell metastasis and glucose metabolism by inducing integrin β4/FAK/SOX2/HIF-1α signaling pathway in gastric cancer. Oncogene. 2018;37(6):744–755. doi:10.1038/onc.2017.363
46. Hong D, Zhang X, Li R, et al. Deletion of TMEM268 inhibits growth of gastric cancer cells by downregulating the ITGB4 signaling pathway. Cell Death Differ. 2019;26(8):1453–1466. doi:10.1038/s41418-018-0223-3
47. Chen Q, Xu R, Zeng C, et al. Down-regulation of Gli transcription factor leads to the inhibition of migration and invasion of ovarian cancer cells via integrin β4-mediated FAK signaling. PLoS One. 2014;9(2):e88386. doi:10.1371/journal.pone.0088386
48. Choi YP, Kim BG, Gao MQ, Kang S, Cho NH, Targeting ILK and β4 integrin abrogates the invasive potential of ovarian cancer. Biochem Biophys Res Commun. 2012;427(3):642–648. doi:10.1016/j.bbrc.2012.09.114
49. Lee JG, Ahn JH, Jin kim T, Ho lee J, Choi JH. Mutant p53 promotes ovarian cancer cell adhesion to mesothelial cells via integrin β4 and Akt signals. Sci Rep. 2015;5:12642. doi:10.1038/srep12642
50. Jeffers MD, Paxton J, Bolger B, Richmond JA, Kennedy JH, McNicol AM. E-cadherin and integrin cell adhesion molecule expression in invasive and in situ carcinoma of the cervix. Gynecol Oncol. 1997;64(3):481–486. doi:10.1006/gyno.1996.4578
51. Abramov IS, Emelyanova MA, Ryabaya OO, Krasnov GS, Zasedatelev AS, Nasedkina TV. Somatic mutations associated with metastasis in acral melanoma. Mol Biol (Mosk). 2019;53(4):648–653. doi:10.1134/s0026898419040025
52. Litjens SH, de Pereda JM, Sonnenberg A. Current insights into the formation and breakdown of hemidesmosomes. Trends Cell Biol. 2006;16(7):376–383. doi:10.1016/j.tcb.2006.05.004
53. Hamidi H, Ivaska J. Every step of the way: integrins in cancer progression and metastasis. Nat Rev Cancer. 2018;18(9):533–548. doi:10.1038/s41568-018-0038-z
54. Desgrosellier JS, Cheresh DA. Integrins in cancer: biological implications and therapeutic opportunities. Nat Rev Cancer. 2010;10(1):9–22. doi:10.1038/nrc2748
55. Sung JS, Kang CW, Kang S, et al. ITGB4-mediated metabolic reprogramming of cancer-associated fibroblasts. Oncogene. 2020;39(3):664–676. doi:10.1038/s41388-019-1014-0
56. Klutstein M, Nejman D, Greenfield R, Cedar H. DNA methylation in cancer and aging. Cancer Res. 2016;76(12):3446–3450. doi:10.1158/0008-5472.can-15-3278
57. Zhuang H, Zhou Z, Ma Z, et al. Characterization of the prognostic and oncologic values of ITGB superfamily members in pancreatic cancer. J Cell Mol Med. 2020;24(22):13481–13493. doi:10.1111/jcmm.15990
58. Li L, Gao Y, Wu Q, Cheng ASL, Yip KY. New guidelines for DNA methylome studies regarding 5-hydroxymethylcytosine for understanding transcriptional regulation. Genome Res. 2019;29(4):543–553. doi:10.1101/gr.240036.118
59. Anastasiadi D, Esteve-Codina A, Piferrer F. Consistent inverse correlation between DNA methylation of the first intron and gene expression across tissues and species. Epigenetics Chromatin. 2018;11(1):37. doi:10.1186/s13072-018-0205-1
60. Yamashita K, Hosoda K, Nishizawa N, Katoh H, Watanabe M. Epigenetic biomarkers of promoter DNA methylation in the new era of cancer treatment. Cancer Sci. 2018;109(12):3695–3706. doi:10.1111/cas.13812
61. Meng X, Liu P, Wu Y, et al. Integrin beta 4 (ITGB4) and its tyrosine-1510 phosphorylation promote pancreatic tumorigenesis and regulate the MEK1-ERK1/2 signaling pathway. Bosnian J Basic Med Sci. 2020;20(1):106–116. doi:10.17305/bjbms.2019.4255
 © 2021 The Author(s). This work is published and licensed by Dove Medical Press Limited. The full terms of this license are available at https://www.dovepress.com/terms.php and incorporate the Creative Commons Attribution - Non Commercial (unported, v3.0) License.
By accessing the work you hereby accept the Terms. Non-commercial uses of the work are permitted without any further permission from Dove Medical Press Limited, provided the work is properly attributed. For permission for commercial use of this work, please see paragraphs 4.2 and 5 of our Terms.
© 2021 The Author(s). This work is published and licensed by Dove Medical Press Limited. The full terms of this license are available at https://www.dovepress.com/terms.php and incorporate the Creative Commons Attribution - Non Commercial (unported, v3.0) License.
By accessing the work you hereby accept the Terms. Non-commercial uses of the work are permitted without any further permission from Dove Medical Press Limited, provided the work is properly attributed. For permission for commercial use of this work, please see paragraphs 4.2 and 5 of our Terms.