")
Back to Journals » Cancer Management and Research » Volume 9
A p53-regulated apoptotic gene signature predicts treatment response and outcome in pediatric acute lymphoblastic leukemia
Authors Bainer RO, Trendowski MR, Cheng C, Pei D, Yang W, Paugh SW, Goss KH, Skol AD, Pavlidis P, Pui CH, Gilliam TC, Evans WE, Onel K
Received 18 April 2017
Accepted for publication 14 July 2017
Published 13 September 2017 Volume 2017:9 Pages 397—410
DOI https://doi.org/10.2147/CMAR.S139864
Checked for plagiarism Yes
Review by Single anonymous peer review
Peer reviewer comments 4
Editor who approved publication: Dr Alexandra R. Fernandes
Russell O Bainer,1 Matthew R Trendowski,2 Cheng Cheng,3 Deqing Pei,3 Wenjian Yang,3 Steven W Paugh,4 Kathleen H Goss,5 Andrew D Skol,6 Paul Pavlidis,7 Ching-Hon Pui,4,8 T Conrad Gilliam,1 William E Evans,4,9,* Kenan Onel10–13,*
1Department of Human Genetics, 2Department of Medicine, Section of Hematology/Oncology, The University of Chicago, Chicago, IL, 3Department of Biostatistics, 4Hematological Malignancy Program, St Jude Children’s Research Hospital, Memphis, TN, 5University of Chicago Medicine Comprehensive Cancer Center, 6Department of Pediatrics, The University of Chicago, Chicago, IL, USA; 7Department of Psychiatry, University of British Columbia, Vancouver, BC, Canada; 8Department of Oncology, 9Department of Pharmaceutical Sciences, St Jude Children’s Research Hospital, Memphis, TN, 10Division of Human Genetics and Genomics, 11Division of Hematology/Oncology and Stem Cell Transplantation, Cohen Children’s Medical Center, New Hyde Park, 12The Feinstein Institute for Medical Research, Manhasset, NY, 13Hofstra Northwell School of Medicine, Hofstra University, Hempstead, NY, USA
*These authors contributed equally to this work
Abstract: Gene signatures have been associated with outcome in pediatric acute lymphoblastic leukemia (ALL) and other malignancies. However, determining the molecular drivers of these expression changes remains challenging. In ALL blasts, the p53 tumor suppressor is the primary regulator of the apoptotic response to genotoxic chemotherapy, which is predictive of outcome. Consequently, we hypothesized that the normal p53-regulated apoptotic response to DNA damage would be altered in ALL and that this alteration would influence drug response and treatment outcome. To test this, we first used global expression profiling in related human B-lineage lymphoblastoid cell lines with either wild type or mutant TP53 to characterize the normal p53-mediated transcriptional response to ionizing radiation (IR) and identified 747 p53-regulated apoptotic target genes. We then sorted these genes into six temporal expression clusters (TECs) based upon differences over time in their IR-induced p53-regulated gene expression patterns, and found that one cluster (TEC1) was associated with multidrug resistance in leukemic blasts in one cohort of children with ALL and was an independent predictor of survival in two others. Therefore, by investigating p53-mediated apoptosis in vitro, we identified a gene signature significantly associated with drug resistance and treatment outcome in ALL. These results suggest that intersecting pathway-derived and clinically derived expression data may be a powerful method to discover driver gene signatures with functional and clinical implications in pediatric ALL and perhaps other cancers as well.
Keywords: pediatric acute lymphoblastic leukemia, p53, gene expression signature, outcomes analysis
Introduction
With cure rates of over 90%, pediatric acute lymphoblastic leukemia (ALL) is an exemplar for success in the treatment of disseminated cancer. Improvements in outcome have resulted in part from the use of risk-directed therapy, in which treatment intensity is modulated based on clinical and biological features predictive of relapse.1–3 Nonetheless, many children with good-risk features relapse, while many others with poor-risk features are cured.
Unique gene expression signatures that are associated with drug resistance and response to specific therapies, such as prednisolone, vincristine, asparaginase, and daunorubicin, have been identified.4,5 However, the molecular drivers of these gene signatures are poorly understood, which has limited their translation into new therapeutic approaches to convert nonresponders into responders.
Most antineoplastic agents used in the treatment of pediatric ALL and other cancers rely upon DNA damaging effects to induce cell death, often via p53-dependent apoptotic mechanisms. Moreover, it has long been recognized that the in vitro apoptotic response of primary ALL cells to various antineoplastic agents is predictive of outcome in childhood ALL.4,6–8 In contrast to most human cancers, a distinguishing feature of ALL is that the TP53 tumor suppressor is almost always wild type at diagnosis,9,10 but is frequently mutated at relapse.11,12 This observation is likely integral to the pathogenesis of relapsed ALL, because it suggests that clones mediating relapse may have an impaired p53-mediated response to genotoxic agents, including chemotherapy.
Normally, the p53 protein is stabilized and activated following DNA damage. p53 then directs transcriptional response programs resulting in apoptosis and other end points.13 We hypothesized that by investigating the transcriptional regulation of p53-mediated apoptosis, we would gain insight into the p53 target genes critical for mediating the apoptotic response to chemotherapy. Therefore, our goal was to use p53 as a point of entry to identify differences in chemotherapy sensitivity and treatment outcome by: 1) characterizing in lymphoblastoid cell lines the p53-regulated transcriptional program mediating apoptosis in response to ionizing radiation (IR), a well-characterized form of DNA damage that induces p53-dependent apoptosis, and 2) associating the derangements of this response with drug sensitivity and treatment outcome in ALL. By intersecting the results of mechanistic studies of p53 function with patient-derived expression data, we succeeded in identifying a novel p53-regulated apoptotic gene expression signature that is significantly associated with multidrug resistance and predictive of overall survival (OS) in pediatric ALL.
Materials and methods
Analysis of p53-mediated apoptosis
Cell lines
TK6 is a human B-cell lymphoblastoid cell line with wild-type p53. WTK1 is a TK6 derivative carrying a dominant negative mutant TP53 allele, resulting in overexpressed transcriptionally inactive p53.14 NH32 is a TK6 derivative in which both TP53 alleles have been deleted by homologous recombination.15 Cell lines were purchased from American Type Tissue Culture (ATCC; Manassas, VA, USA).
Apoptosis assays
Upon achieving >95% viability, cells were adjusted to 1×10⁶ cells/mL, irradiated using a 137Cs source for various doses, then seeded in tissue culture medium at 0.2×10⁶ cells/mL. Percent apoptosis was quantified by terminal deoxynucleotidyl transferase dUTP nick end labeling (TUNEL) assay using the In situ Cell Death Detection Kit, Fluorescein (Hoffman-La Roche Ltd., Basel, Switzerland), per the manufacturer’s instructions. At least 10,000 cells were counted for each sample analyzed using a FACScan flow cytometer (Becton Dickenson, Franklin Lakes, NJ, USA).
Immunoblot analysis
Cell aliquots (5×10⁶) were removed at various time points, collected by centrifugation and washed once in PBS, then lysed in extraction buffer (20 mM Tris-HCl at pH 7.4, 150 mM NaCl, 1% Triton X-100, 5 mM EDTA, 1 mM Na3VO4, 10 mM NaF, 10 mM Na4P2O7, 1 mM PMSF, 1 µg/mL leupeptin, and 0.1 U/mL of aprotinin) and cleared by centrifugation for 10 minutes at 4°C to obtain whole-cell extracts. Each 50 µg sample of total protein was loaded onto 4%–15% gradient sodium dodecyl sulphate-polyacrylamide gel electrophoresis (SDS-PAGE) gels and blotted onto poly(vinylidene) difluoride Immobilon-P membranes (EMD Millipore, Billerica, MA, USA).
The following antibodies were used: anti-p53 monoclonal antibody (DO-1) (Santa Cruz Biotechnology Inc., Dallas, TX, USA), anti-Ran antibody (SCB), anti-p21waf1/cip1 antibody (Ab-1) (Oncogene Science, Cambridge, MA, USA), anti-phospho p53 (Ser15) mouse monoclonal antibody (Cell Signaling Technology, Danvers, MA, USA), and anti-phospho p53 (Ser20) rabbit polyclonal antibody (CST).
RNA methods
TK6 cells were exposed to IR (2Gy or 10Gy) or mock treated. Prior to treatment and at 2, 6, 12, and 24 hours after each treatment, 5×10⁶ cells were removed. WTK and NH32 lines were assayed in an identical manner at only 10Gy. RNA was extracted by RNEasy Columns (Qiagen NV, Venlo, the Netherlands) and quantified by spectrophotometry.
Expression microarray methods
RNA was labeled and hybridized to Affymetrix HG-U133A GeneChips (Affymetrix, Santa Clara, CA, USA) according to the manufacturer’s instructions. Time course experimental data were normalized using the invariant set method of Li and Wong.16 Probe sets were annotated to genes using the HG-U133A annotation files provided by Affymetrix and were summarized and background subtracted using Affymetrix Microarray Suite (MAS) 5.0 software. Normalized intensity values for induced genes were expressed as fold induction by dividing the value at each time point by the mean intensity value of the gene across all untreated microarrays within each cell line. Repressed genes were expressed as negative fold change by transforming the values into their negative inverse, rather than by simple conversion to the log scale. This representation, which preserves additive differences in the scale of transcriptional changes when a gene is strongly induced to different levels across multiple time courses, is important for the divergence score (DIV) method described in the “The DIV method to quantify differential gene expression over time” section.
The DIV method to quantify differential gene expression over time
To compare differences in gene expression over time in response to different treatments in the different cell lines, we developed the DIV method. The DIV is based on the Euclidean distance between high and low treatment time courses, adjusted for the portion of the variance attributable to fluctuations observed in the untreated case. For each comparison, a divergence score is computed based on the pointwise difference between the two conditions:
|
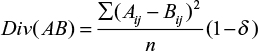
where Div(AB) is the divergence score between treatments A and B, Aij is the jth time point of gene i in treatment A, Bij is the jth time point of gene i in treatment B, n is the total number of time points in each time course, and δ is a ratio approximating the percentage of the response in the high radiation case that is reasonably attributable to the behavior of the gene in the untreated case:
|
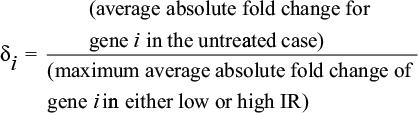
When the divergence between high and untreated time courses was quantified, δ was approximated as zero.
Cluster analysis
To generate the temporal expression clusters (TECs), transcriptional profiles of candidate genes were clustered using the Cluster Analysis of Gene Expression Dynamics software package. We concatenated the low and high treatment expression values for each of the 747 genes identified in our analysis, and the composite vectors were divided into clusters using the default settings.
Quantitative RT-PCR
Microarray data were validated by reverse transcription polymerase chain reaction (RT-PCR). Each RT reaction was carried out in triplicate using the Applied Biosystems High-Capacity cDNA Archive Kit (Thermo Fisher Scientific, Waltham, MA, USA) according to the manufacturer’s instructions. The primers used for each gene are listed in Table S1. Relative mRNA levels were quantified using Sequence Detection Software AB version 1.3.1.
Analysis of p53-dependent apoptotic gene expression and outcomes in pediatric ALL
We performed permutation-based tests to investigate both the ex vivo transcriptional response to IR and drug sensitivity in pediatric ALL blasts using publicly available data sets. For the IR studies, we analyzed gene expression data from 22 pediatric B-lineage ALL patients (GSE13280).14 For the drug sensitivity studies, we analyzed gene expression profiles for leukemic cells isolated from a separate cohort of 145 children with B-lineage ALL.4
For the outcome studies, an independent cohort of 465 children with ALL enrolled in three consecutive protocols at St Jude Children’s Research Hospital (Total XIIIA [42], Total XIIIB [56], and Total XV [367]) was analyzed.17,19 Three hundred and eighty nine patients (84%) had B-lineage ALL and 76 (16%) had T-lineage ALL. The clinical characteristics of these patients are described in Table 1. For expression analysis, total RNA was isolated from leukemic cells from each patient and hybridized to the U133A GeneChip. Gene expression signals were scaled to the target intensity of 2,500, using MAS 5.0. Probe sets expressed in less than 3% of the patients were excluded, leaving 14,550 probe sets for subsequent analyses.
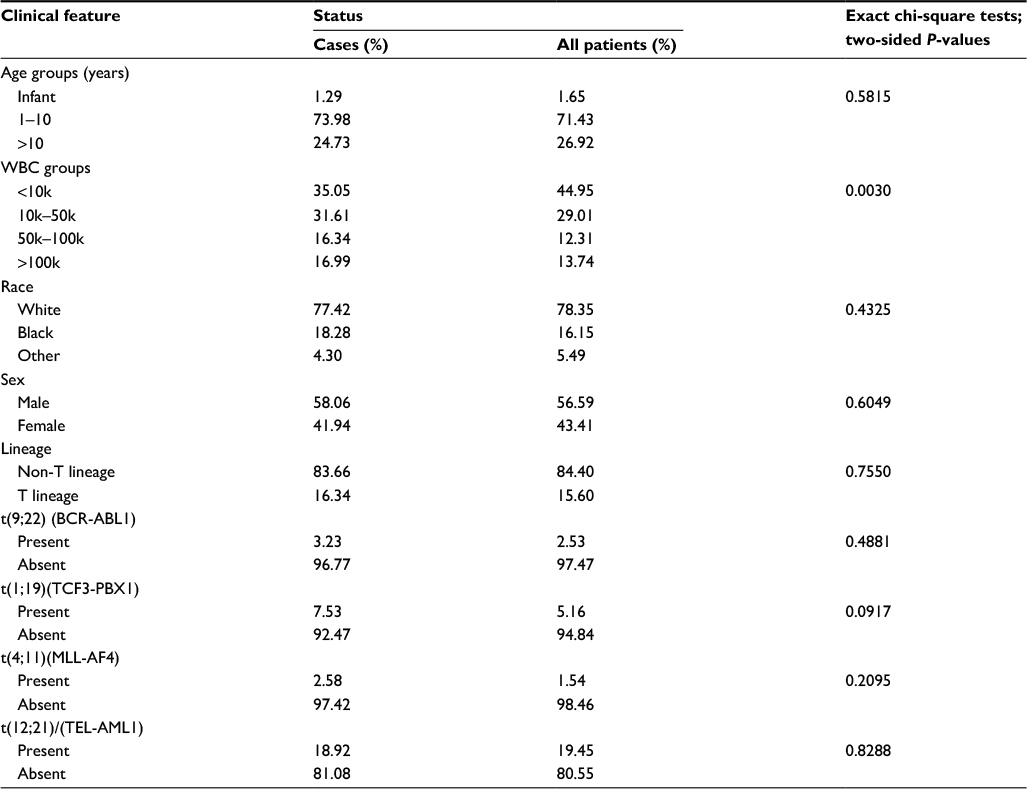 | Table 1 Clinical characteristics of the 465 cases analyzed, as compared to the entire patient cohort treated on Total XIIIA, Total XIIIB, and Total XV (n=910) Abbreviation: WBC, white blood cell. |
We also analyzed outcome and gene expression data from a cohort of 59 high-risk ALL patients treated on the Children’s Oncology Group (COG) 1961 study, as previously described by Bhojwani et al.20
Written informed consent was obtained from all patients, their parents or guardians, and local institutional review boards approved all protocols. The St Jude Children’s Research Hospital Institutional Review Board approved the outcome studies presented in this manuscript.
Statistical analysis
To assess the significance of the genewise transcriptional divergence between high-treatment and low-treatment conditions (DIV[HL]) for each putative p53-regulated target, empirical P-values were determined by permutation. Normalized and fold-converted expression values from the untreated time courses for each gene analyzed from all cell lines (TK6, NH32, and WTK1) were randomly assigned mock high, low, and untreated time courses. To simulate random effects that do not result in divergent gene expression between high- and low-IR treatments, a constant was added to both the low- and high-IR mock treated time courses at each time point which was randomly sampled from the distribution of fold induction values in the treated TK6 time courses. DIVs were calculated for each set of mock time courses, and a distribution was generated after 10,000 permutations. The empirical P-value for the significance of the observed divergence score, the DIV(HL)TK6, was defined as the fraction of mock data sets that yielded a DIV greater than or equal to that observed in the original experiment. This analysis was undertaken using custom software written in R. (R Foundation for Statistical Computing, Vienna, Austria)
We used a permutation-based approach to assess the enrichment of genes and TECs associated with IR in primary ALL samples. Similarly, to identify genes and TECs enriched among genes that discriminated between chemotherapy sensitivity and resistance in pediatric B-ALL, we also employed a permutation-based strategy to examine the association between gene expression profiles and response to asparagine, daunorubicin, prednisolone, and vincristine.23 First, for each drug, differential expression between sensitive and resistant ALL samples was assessed for all genes using a one-sided Wilcoxon signed-rank test (α=0.05). We used one-sided tests to ensure that the direction of each gene’s transcriptional response to p53 activation was similarly reflected in the patient dataset; permutation analysis was used to determine the significance of the association between each TEC and drug response. Keeping the size of each TEC fixed, we randomly reassigned gene and sensitive/resistant status for all samples and recalculated the Wilcoxon signed-rank test for each gene in the permuted dataset. This was repeated 10,000 times, and the total number of differentially expressed genes in each permuted cluster was compared to the number observed in the original dataset. The reported nominal enrichment P-values were defined as the fraction of randomly permuted clusters containing as many or more differentially expressed genes than were observed in the original dataset. To correct for multiple testing, we determined empirical P-values by comparing the maximum observed differential expression enrichment across N clusters, where N is the total number of enrichment tests (e.g., five clusters and both sets of sided tests), to that observed in the experiment and recalculated the P-value as mentioned earlier. When testing the enrichment of genes whose expression stratified response to multiple drugs within each cluster, we compared the enrichment of genes within each class to that generated by permuted sets to generate empirical P-values as described earlier. This analysis was performed using custom software written in R.
For the outcomes analysis, the duration of event-free survival (EFS) was defined as the time from diagnosis until the date of failure (induction failure, relapse, death, or the development of a second malignancy) or until the date of last contact for all event-free survivors. Patients who did not attain a complete remission were considered failures at time zero. EFS rates were estimated by the method of Kaplan and Meier and were compared with the Mantel-Haenszel test.21 The Cox proportional hazards model was used to identify independent prognostic factors with respect to EFS or OS. Cumulative risk of any relapse (CRR) functions were constructed by the method of Kalbfleisch and Prentice,22 and the functions were compared with Gray’s test.23
To assess the relationship between the gene expression levels of p53-dependent apoptotic target genes in TEC1 and clinical outcomes in children with ALL, two approaches were employed. First, to investigate the association between the overall gene expression profiles of genes in this cluster and outcomes, we stratified patients into groups by hierarchical clustering according to log2-transformed expression signal of all genes analyzed. We compared EFS rates by log-rank tests and CRR rates by Gray’s tests.22 The multiple Cox proportional hazards model or Fine and Gray’s model24 were applied to investigate whether the resulting patient groups were independently associated with clinical outcome after adjusting for risk classification, a well-characterized and clinically meaningful prognostic index that incorporates presenting features and minimal residual disease (MRD) as well as treatment intensity. Second, to assess the association between individual genes in TEC1 and outcomes, we treated the log2-transformed gene expression level as a continuous variable and applied the univariate Cox regression model. The Holm step-down procedure was applied for multiple comparison adjustment of P-values. This analysis was undertaken using SAS Release 9.1. Spotfire DecisionSite 9.1.1 was used for hierarchical cluster analysis.
Results
Identification of p53-regulated apoptotic targets
To characterize the response of TK6 cells to IR, cells were irradiated with two different doses of IR, and apoptosis was measured 24 hours later. After low-dose IR (2Gy), fewer than 10% of cells were apoptotic, whereas after high-dose IR (10Gy), over 50% of cells were apoptotic. Neither WTK1 nor NH32 cells, TK6 derivatives with inactive p53, underwent significant apoptosis following 10Gy IR (Figure 1), suggesting that apoptosis in TK6 cells is mediated by p53.
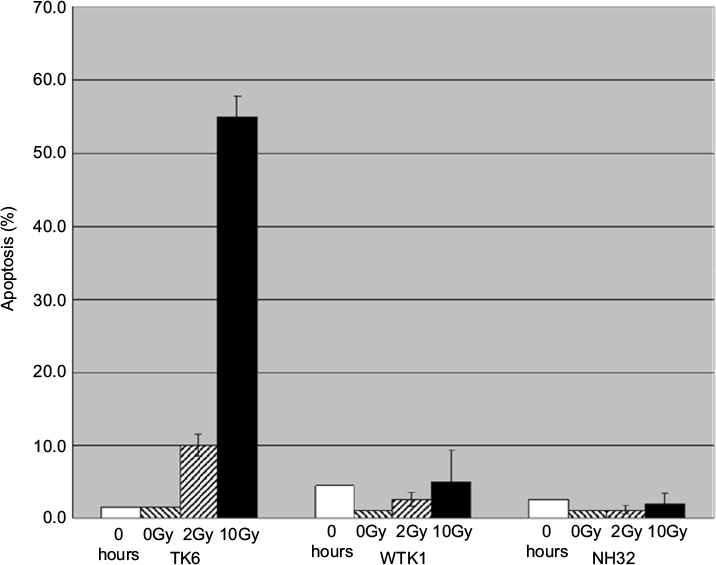 | Figure 1 IR-induced apoptosis in TK6, WTK1, and NH32 cell lines. Exponentially growing cells were either sham treated or exposed to 2Gy or 10Gy. Apoptosis levels were measured by TUNEL 24 hours after treatment. Each experiment was repeated three times. Error bars represent standard error. Abbreviations: IR, ionizing radiation; TUNEL, terminal deoxynucleotidyl transferase dUTP nick end labeling. |
Immunoblot analysis revealed that similar levels of both p53 and its target gene p21 were induced by 10Gy and 2Gy, with similar kinetics (Figure 2). Interestingly, phosphorylation of p53 at Ser15 mimicked the response of total p53 to IR, but phosphorylation at Ser20 occurred earlier and more robustly in response to 10Gy than to 2Gy. Phosphorylation at Ser20 represses MDM2-dependent degradation of p53, while simultaneously activating p53 as a transcription factor.25 These data suggest that IR-induced apoptosis in TK6 cells may be related to the kinetics of p53 phosphorylation at Ser20.
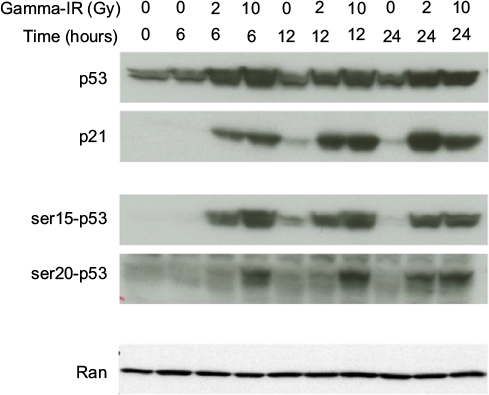 | Figure 2 Time course of p53 activation in TK6 cells by IR. TK6 cells were either sham treated or exposed to 2Gy or 10Gy, and then incubated for the indicated lengths of time. Lysates were immunoblotted with antibodies recognizing either total p53 or phospho-specific p53 isoforms, as well as p21. Ran was probed as a loading control. Abbreviation: IR, ionizing radiation. |
Because the kinetics of upstream signaling to stabilize and activate p53 correlated with the induction of apoptosis, we hypothesized that the kinetics of downstream signaling from p53 would also be associated with apoptosis. Consequently, gene expression patterns in TK6 and its p53-inactive derivatives following 0Gy, 2Gy, and 10Gy, at 0, 2, 6, 12, and 24 hours were assessed by expression microarray profiling.
To identify genes whose expression over time in apoptosis was most dependent on p53, we developed the DIV method. A DIV (see “Materials and methods” section for details) was calculated for each gene in TK6 cells comparing fold induction or repression in response to 10Gy (high IR) and 2Gy (low IR), referred to as the DIV(HL)TK6. A separate DIV, the DIV(HU), was calculated for each gene comparing its response to 10Gy and mock treatment (unirradiated) in all three cell lines. The DIV(HL)TK6 quantifies how significantly a gene was induced or repressed in TK6 cells in response to 10Gy as compared to 2Gy; significance was assessed using empiric P-values. The DIV(HU) quantifies how significantly a gene was induced or repressed by 10Gy as compared to unirradiated controls. Genes were ranked from highest to lowest DIV(HL)TK6 score, and the average DIV(HU) score was plotted for each cell line in 50-gene sliding windows (Figure S1). As expected, the average DIV(HU) scores in WTK1 and NH32 cells were uniformly low and uncorrelated with the DIV(HL)TK6 rankings, because they lack functional p53. The DIV(HU) scores in TK6 cells were initially very large, but then decremented to converge with the average DIV(HU) scores in the p53-mutant lines. The DIV at which the average DIV(HU)TK6 equaled the maximum DIV(HU) in the mutant cell lines was a natural cutoff below which the DIV could no longer be used to discern genes whose induction or repression over time correlated with the induction of apoptosis in TK6 cells. Approximately, 1,200 genes surpassed this threshold (5% of genes analyzed).
Of these genes, some are regulated by p53, while others are differentially expressed following IR independent of p53. To demonstrate p53-dependence, the DIV(HU)TK6 was compared to the DIV(HU)WTK1 and DIV(HU)NH32 for each gene. Genes with a DIV(HU)TK6 >2× the DIV(HU) for either p53-mutant line were characterized as p53-regulated apoptosis genes. Following this analysis, 747 genes remained as candidate p53-apoptotic targets, of which 391 were induced and 356 were repressed (Table S2). This set disproportionately contains genes previously annotated to the KEGG p53 signaling pathway (false discovery rate: 1.6×10⁻⁴) but also contains genes annotated to secondary pathways associated with p53 activation, such as cell cycle arrest and antiviral response, that likely represent indirect targets of p53 activation. We performed permutation testing to verify that the IR-mediated induction or repression of each of these genes was significantly greater in p53 wild-type cells than in p53-inactive cells.
To confirm the in vivo relevance of these genes, the transcriptional response to IR of leukemic blasts from 22 children newly diagnosed with ALL was investigated. Cells were treated with 5Gy and gene expression profiles were assessed at 0 and 8 hours following IR.26 Even after correcting for multiple testing, we found that the 747 p53-associated apoptosis gene set was significantly enriched for genes activated by IR in ALL blasts (Ppermutation=0.0006).
Temporal clustering of p53-regulated apoptotic targets
In TK6 cells undergoing p53-mediated apoptosis, the 747 genes were rapidly induced or repressed, many achieving their maximal difference from untreated cells between 2 and 6 hours following IR, and then returning to baseline levels by 24 hours. These same genes were also induced or repressed in response to low-dose IR, but with slower kinetics (Figure 3A).
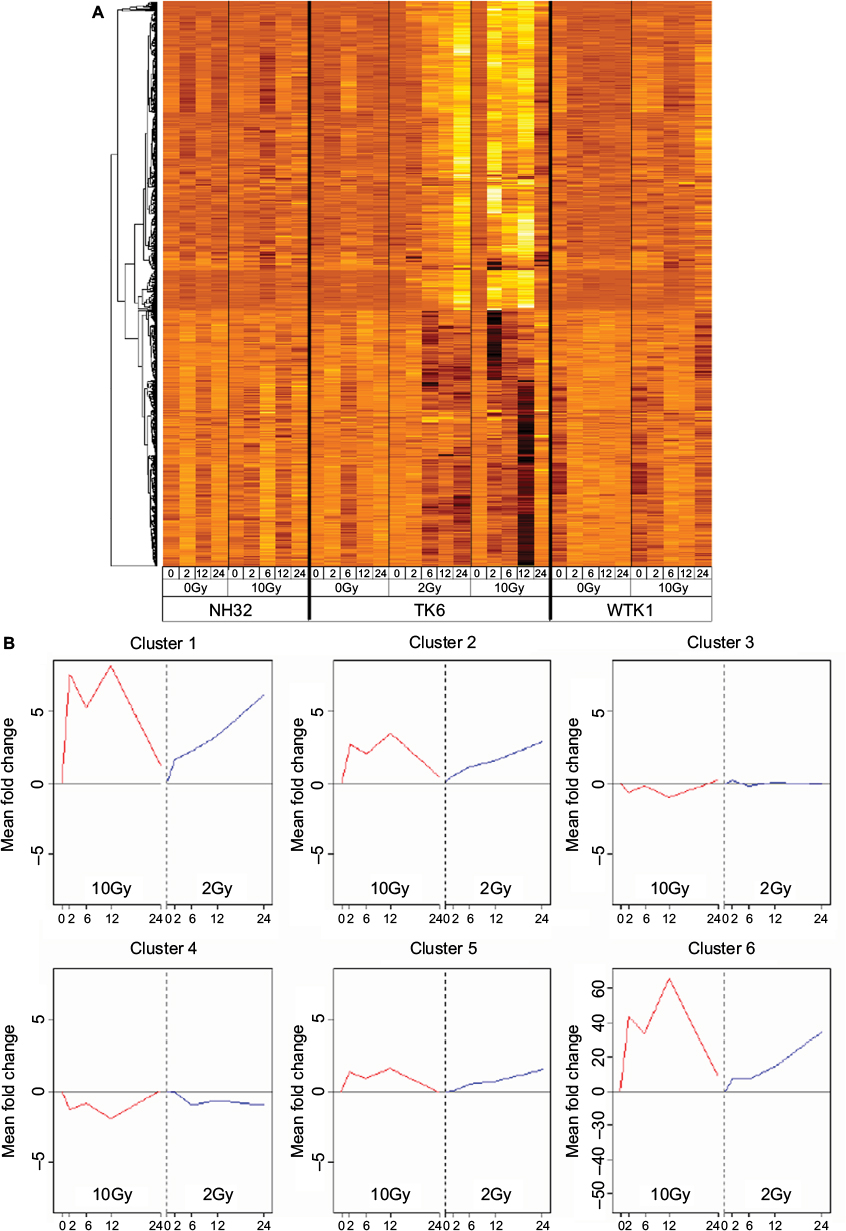 | Figure 3 Kinetic analysis of p53-dependent gene expression in response to apoptosis-inducing IR. (A) Hierarchical clustering of 747 genes differentially expressed in TK6 cells in response to 2Gy and 10Gy. Genes induced or repressed by 10Gy were also induced and repressed by 2Gy, but with slower kinetics. None of these genes were induced or repressed by 10Gy in the p53-mutant WTK1 and NH32 lines. The expression level of each gene is represented as fold change relative to the mean of the untreated cells for each cell line. High levels of expression are indicated by white and low levels of expression are indicated by black, both relative to the mean (orange). (B) Temporal expression clusters (TECs) identified by stratifying p53-dependent genes by their kinetic response to IR. Six TECs were identified with different expression kinetics in response to 10Gy and 2Gy, and consisting of 17 (TEC1), 100 (TEC2), 91 (TEC3), 265 (TEC4), 273 (TEC5), and 1 (TEC6) member. Average expression profiles over 24 hours are shown for each TEC, with the profile in response to 10Gy in red on the left, and in response to 2Gy in blue on the right. Abbreviation: IR, ionizing radiation. |
We reasoned that genes with similar activation/repression kinetics following IR might be coordinately regulated and function in similar pathways. Therefore, we performed hierarchical clustering to stratify the 747 genes by their responses over time to both 2Gy and 10Gy and identified six TECs. Four TECs (1, 2, 5, and 6) were comprised of induced genes, and two TECs (3 and 4) were comprised of repressed genes (Figure 3B). For validation, the expression profiles for eight genes in TEC1 were analyzed by RT-PCR (Figure S2). mRNA induction by 10Gy was more rapid and more transient than induction at 2Gy for all the genes, thereby supporting our microarray results.
In order to begin identifying the main p53-regulated effectors of the cellular response to IR, we investigated the association of each TEC with the transcriptional response to IR in the pediatric ALL blasts dataset, and found that TEC1 (P<0.0001), TEC2 (P=0.0005), and TEC5 (P=0.0002) were all significantly enriched for genes transcriptionally activated by IR. Strikingly, 59% (10/17) of the TEC1 genes were regulated by IR in ALL (Table 2), suggesting that this cluster of genes is likely to be associated with IR response in vivo.
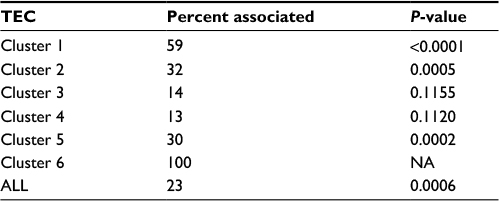 | Table 2 Enrichment analysis of p53-dependent TECs among IR-response genes in leukemic blasts from pediatric B-lineage ALL patients (n=22) Notes: A Student’s t-test was used to identify genes associated with IR response. Percent associated is the fraction of differentially expressed genes in each cluster. P-values were determined by permutation analysis and corrected for multiple testing. The set of 747 p53-regulated apoptosis genes identified in tissue culture were associated with IR response in primary ALL samples. TEC1, TEC2, and TEC5 were significantly enriched for genes associated with response to IR. Because TEC6 was comprised of only one gene, its association was not analyzed. Abbreviations: TEC, temporal expression cluster; IR, ionizing radiation, ALL, acute lymphoblastic leukemia; NA, not applicable. |
Association of TEC1 genes with chemotherapy response in B-lineage ALL
In ALL, the predominant form of cell death induced by chemotherapy is apoptosis. Because p53 is the central regulator of apoptosis and is only rarely mutated in ALL at diagnosis, we predicted that response to chemotherapy in ALL might be associated with differential expression of genes comprising one or more TEC. To test this, we examined the association between the TECs and drug sensitivity in primary ALL lymphoblasts from 145 children newly diagnosed with B-lineage ALL from whom we had previously performed global expression profiling and measured the in vitro sensitivity to four commonly used antileukemic agents, namely, asparaginase, daunorubicin, vincristine, and prednisolone, using defined criteria for sensitivity and resistance.4 We found that TEC1 was significantly enriched for genes whose differential expression was associated with response to asparaginase, daunorubicin, and vincristine, but not prednisolone (Table 3). In contrast, no other TEC was associated with response to even one drug. Of the 17 TEC1 genes, seven were associated with response to asparaginase (Penrichment=0.011), seven with daunorubicin (Penrichment=0.017), and seven with vincristine (Penrichment=0.026). Overall, the differential expression of 15 TEC1 genes was associated with response to at least one drug, which was significantly greater than expected by chance even after correction for multiple testing (P<0.0001). Furthermore, nine genes were associated with two or more drugs (enrichment P=0.0065) and three with three or more drugs (enrichment P<0.0001) (Table S3).
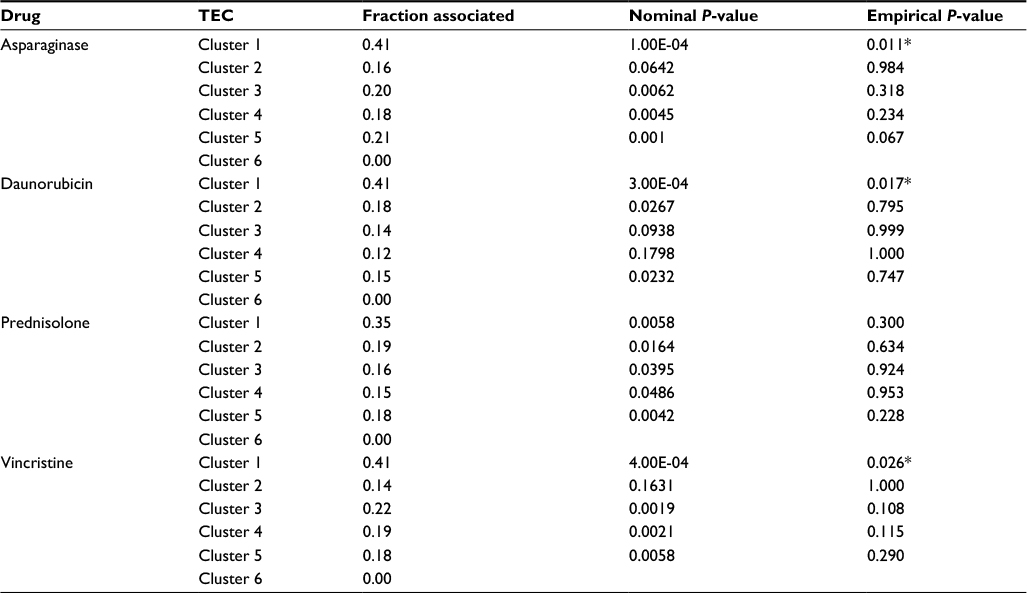 | Table 3 Enrichment analysis of p53-dependent TECs differentially expressed between drug-resistant and drug-sensitive B-lineage ALL samples (n=145 patients) Notes: The Wilcoxon signed-rank test was used to identify genes that discriminate between sensitivity and resistance to each drug. Fraction associated is the proportion of differentially expressed genes in each cluster. Nominal P-values were determined by permutation analysis to assess the association of each TEC with sensitivity or resistance to each drug. After correcting for multiple testing, TEC1 was significantly enriched for genes associated with response to asparaginase, daunorubicin, and vincristine (indicated by *). Because TEC6 was comprised of only one gene, its association was not analyzed; *denotes significance after correction for multiple testing. Abbreviations: TEC, temporal expression cluster; ALL, acute lymphoblastic leukemia. |
Association of TEC1 genes with outcome in ALL
Because in vitro drug response is a significant predictor of outcome, we hypothesized that TEC1 gene expression would be associated with outcome in ALL, either individually or in aggregate. We investigated this possibility in an independent cohort of 465 children with ALL. First, we tested the association of each TEC1 gene individually and identified only TP53I3 as significantly associated with both EFS and CRR (Table S4).
Next, we assessed the association between outcome and the set of 15 TEC1 genes associated with drug sensitivity. We stratified patients into four groups based upon the pattern of expression of these genes (Figure 4A and B) and found that both EFS (P=0.0001) and CRR (P=0.0025) differed significantly among the four patient groups (Table 4; Figure 4C and D). Patients in Group 3 had outcomes that were significantly better than those in the other three groups (EFS at 10 years: 89.4±2.6% vs 75.0±3.2%, P<0.001; CRR: 6.3±1.8% vs 17.2±2.3%, P=0.0005), with a hazard ratio (HR) as compared to all other patients for EFS of 0.38 (95% CI: 0.23–0.62) and for CRR of 0.33 (95% CI: 0.17–0.63). In contrast, patients in Group 1 had the worst outcomes (EFS at 10 years: 66.3±7.0% vs 82.5±2.3%, P=0.0011; CRR: 23.2±6.2% vs 11.6±1.6%, P=0.0177; Table 4).
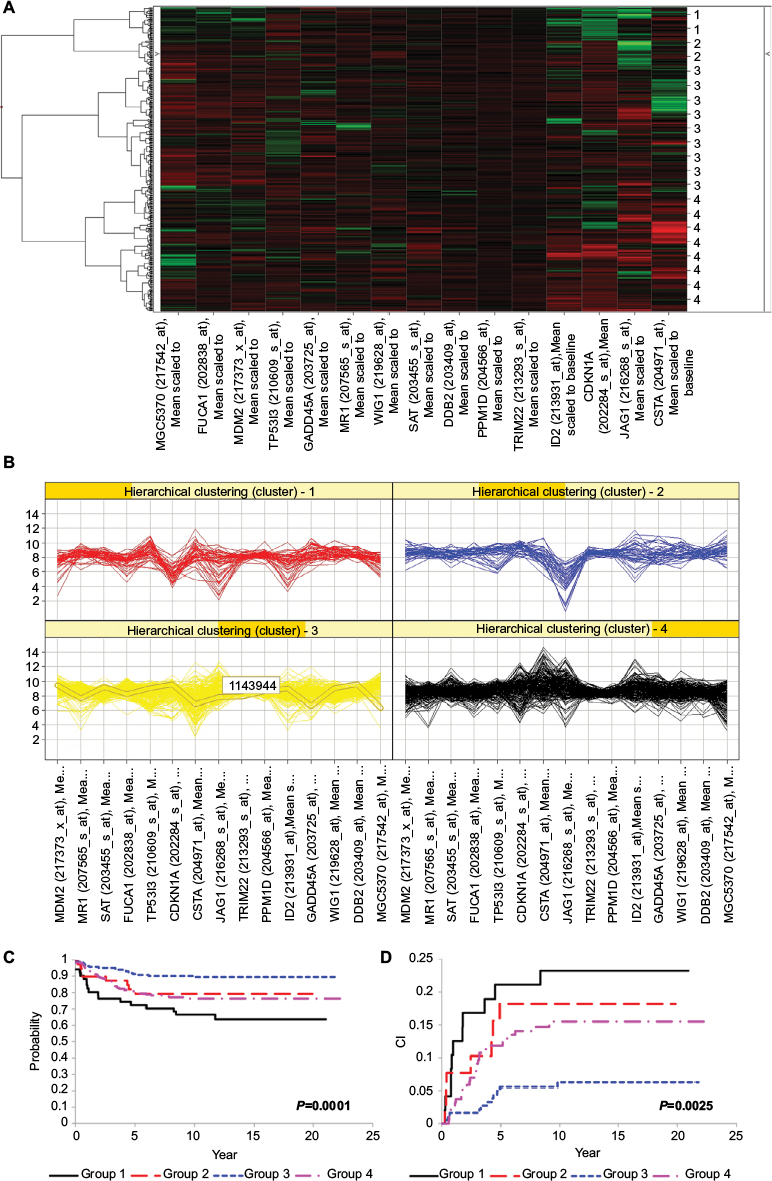 | Figure 4 Outcomes analysis for patients with pediatric ALL (n=465 patients) stratified by TEC1 gene expression signature. (A) Unsupervised hierarchical clustering was used to class pediatric ALL patients into four patient groups based upon the expression pattern of the 15 TEC1 genes associated with response to at least one chemotherapy. The groups are indicated on the left of the figure: black = Group 1 (n=51); red = Group 2 (n=39); blue = Group 3 (n=184); and green = Group 4 (n=191). Each row represents a patient and each column represents a gene. High levels of expression are indicated by red, and low levels of expression are indicated by green, both relative to the mean (black). (B) Gene expression signatures of the 15 TEC1 genes for each of the four patient groups. (C) EFS curves for children newly diagnosed with ALL stratified by group (P=0.0001). (D) CRR curves for children newly diagnosed with ALL stratified by group (P=0.0025). Abbreviations: ALL, acute lymphoblastic leukemia; TEC, temporal expression cluster; EFS, event-free survival; CRR, cumulative risk of any relapse; CI, confidence interval. |
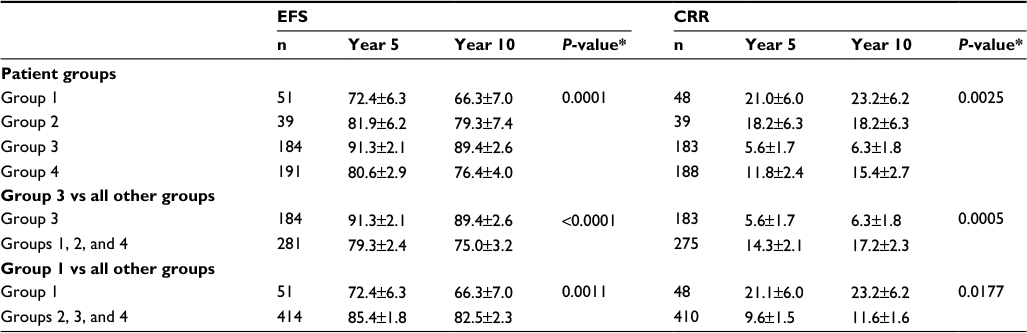 | Table 4 Comparative analysis of treatment outcomes for pediatric ALL patients (n=465) grouped by their TEC1 gene expression signature (n=465 patients) Notes: Comparisons of EFS and CRR among the four patient groups with different patterns of TEC1 gene expression in children newly diagnosed with ALL; *EFS=log rank test P-value; CRR=Gray’s test P-value. Abbreviations: TEC, temporal expression cluster; ALL, acute lymphoblastic leukemia; EFS, event-free survival; CRR, cumulative risk of any relapse. |
We examined the association between TEC1 gene expression and outcome in another independent cohort of ALL patients uniformly treated on the COG high-risk 1961 study.20 The pattern of expression of the 15 TEC1 genes was used to stratify the 59 patients for whom outcome data were available into three groups. We found that outcome was modestly associated with these groups (Cochran-Armitage P=0.10) (Table S5); this likely reflects both the small size of the cohort and the limited length of follow-up (4 years). Of the 15 TEC1 genes, six were associated with outcome at P<0.10 by univariate analysis (Table S6). This was significantly more than expected by chance (P=0.005), indicating that TEC1 genes were enriched for genes predictive of outcome in this cohort.
Association of TEC1 genes and ALL patient subsets
In ALL, presenting features such as patient age, leukocyte count at diagnosis, lineage, leukemia cell karyotype, and molecular subtype are well-established prognostic variables, as are MRD and treatment intensity.17–19 Risk group classification is a well-characterized and clinically meaningful prognostic index incorporating these features. After adjusting for these known risk criteria, patient risk groups defined by the 15 TEC1 genes remained significantly associated with both EFS and CRR (Table 5), indicating that the pattern of expression of these genes was an independent prognostic factor distinct from these clinical and laboratory variables.
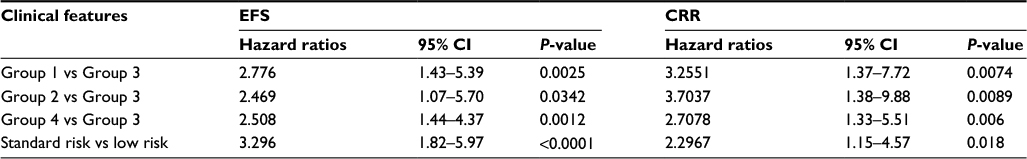 | Table 5 Comparative analysis of treatment outcomes for pediatric ALL patients grouped by their TEC1 gene expression signature after adjusting for risk group classification and treatment study protocol (n=465 patients) Notes: Comparisons of EFS and CRR among the patient groups using risk group as a covariant and demonstrating that the groups are independently associated with outcome. Risk group classification is a well-characterized and clinically meaningful prognostic index defined as incorporating presenting features (patient age, leukocyte count at diagnosis, lineage, leukemia cell karyotype, and molecular subtype), MRD, and treatment intensity. Abbreviations: TEC, temporal expression cluster; ALL, acute lymphoblastic leukemia; EFS, event-free survival; CRR, cumulative risk of any relapse; CI, confidence interval; MRD, minimal residual disease. |
We then analyzed the cohort of 465 pediatric ALL patients to assess the relation between expression patterns of the TEC1 genes and outcome within different ALL subtypes. Of the 389 patients with B-lineage ALL, 181 were in Group 3 with a CRR of 6.4±1.9% at 10 years, whereas eight patients were in Group 1 with a CRR of 25.0±16.5%. Of the 72 patients with T-lineage ALL, three were in Group 3, none of whom experienced a relapse by 5 years, whereas 40 patients were in Group 1 with a CRR of 20.2±6.5%. TEL-AML1 is a well-characterized driver mutation associated with good prognosis in B-lineage ALL. Of the 88 B-lineage ALL patients with TEL-AML1, 60 were in Group 3, with a CRR of 3.3±2.3% at 10 years, whereas one patient with TEL-AML1 in Group 1 died of disease. Thus, when patients were stratified by lineage or cytogenetics, correlation between outcome and TEC1 gene expression patterns remained apparent, although the number of patients in some bins was too small for significance to be assessed.
Discussion
In this study, we identified the molecular effectors of the normal IR-induced p53-regulated apoptotic program, which we then used to uncover important determinants of the therapeutic response in pediatric ALL. We performed a genome-wide expression analysis of IR-induced p53-mediated apoptosis in ALL cell lines, and discovered a set of p53-regulated genes that are also associated with the normal transcriptional response to IR in patient-derived ALL blasts. When these genes were clustered by the kinetics of their response to IR over time, we identified a single set of similarly expressed genes (TEC1) associated with chemotherapy response in three separate ALL patient cohorts using two different criteria (chemotherapy-induced cytotoxicity and clinical outcome). We found that these genes were associated with both high-risk ALL and low-risk ALL, as well as both B-lineage ALL and T-lineage ALL.
Importantly, this p53-driven gene signature is not just a recapitulation of known prognostic variables in ALL; even after adjusting for presenting features, MRD, and treatment intensity, it retained its significance. These findings support a model in which the normal p53-regulated apoptotic program induced by DNA damage is perturbed in patients with poor treatment response and outcome. Although the mechanism(s) by which this p53-mediated response is disrupted are unknown, it is likely that they are the consequence of acquired somatic mutations in the ALL blasts.
While many gene signatures have previously been described in cancer, most provide limited mechanistic insights. This is due in part to the method by which the genes comprising these signatures are typically identified; they are generally the ones most differentially expressed based upon specific phenotypes. Therefore, they are not necessarily the molecular drivers of the phenotype under investigation, but are often downstream effectors that can be altered by derangements in a variety of different upstream pathways.
Here, we discovered a gene signature associated with treatment outcome and the likelihood of disease relapse through the functional analysis of one pathway: DNA damage-induced p53-mediated apoptosis. Essential to this work was our prior knowledge that the p53 pathway is functionally intact at diagnosis in most cases of pediatric ALL. The rationale for identifying and studying p53-regulated apoptotic targets clustered by their temporal expression patterns was threefold: 1) the in vitro apoptotic response of leukemic blasts to chemotherapy is known to be highly prognostic in ALL;6,8,27 2) the p53 tumor suppressor is central to the regulation of apoptosis and defense against tumor initiation and progression;28–31 and 3) genes with similar p53-regulated expression kinetics are likely to be coordinately regulated and functionally related. Hence, our analysis of the p53-induced apoptosis program was intended to serve as a point of entry to identify modifiers of therapeutic response and outcome in pediatric ALL. To our surprise, we found that p53-mediated apoptosis was not associated with a unique set of targets, but with the overall rapidity of the p53-mediated transcriptional response to IR. The importance of kinetics in the cellular decision to die was also seen in the activation of p53 itself (Figure 3), whereas p53 was rapidly phosphorylated at Ser20 following apoptosis-inducing IR (10Gy); this modification was a late event following 2Gy IR.
Because it reflects the contribution of only a single pathway, it is not surprising that highly significant association between the TEC1 signature and survival is less pronounced than that of other gene signatures. Nonetheless, this signature provides both mechanistic insight into outcome and additional prognostic information independent of other known risk classifiers. Taken together, our strategy of intersecting the analysis of a disease-related pathway and patient-derived expression profiling data may be of general use.
In our analysis, we identified six TECs. Of these, only TEC1 was significantly associated with multidrug resistance in leukemic blasts and was an independent predictor of survival. Furthermore, of the 17 TEC1 genes, the differential expression of 15 genes was independently associated with response to at least one antileukemic agent. Among these, only TP53I3 encodes a known p53-induced apoptotic target, Pig3.32 Three TEC1 genes, MDM2, JAG1, and PPM1D, encode known regulators of p53, of which two, MDM2 and PPM1D, are direct transcriptional targets of p5333 and two, MDM2 and JAG1, are among the three genes independently associated with response to three antileukemic agents. Four TEC1 genes, CDKN1A, GADD45A, WIG1, and TRIM22, are known p53 targets associated with cell cycle arrest.34–38 Taken together, these observations suggest that the kinetics of TEC1 gene activation regulate p53 levels and activity, thereby acting as a molecular “switch” to direct a cell toward or against apoptosis.
Intriguingly, we also found that across all six TECs, genes associated with response to both asparaginase and daunorubicin were concurrently induced or repressed, as would be expected. In contrast, many genes associated with response to vincristine and either asparaginase or daunorubicin were discordantly induced or repressed. Consistent with findings from Lugthart et al,7 these observations suggest that unique sets of p53-regulated genes may predict response to specific drugs and provide molecular insights into mechanisms underlying treatment resistance in ALL.
Treatment in pediatric ALL is predicated upon the concept of risk-adapted therapy; that is, treatment intensity is based on criteria prognostic for risk of relapse. TEC1 gene expression profiling may be a useful component of a revised risk stratification schema to identify children requiring intensive therapy at diagnosis or who may benefit from stem cell transplant at relapse. These risk criteria are largely surrogates for as yet unidentified biological processes deranged in ALL; our findings shed light on one possible molecular determinant of treatment success. Intriguingly, given the central role of p53 in regulating apoptosis across tissue types, our results may have treatment implications for cancers other than ALL as well. Furthermore, these data may point toward novel treatment strategies whereby, for example, one could modulate TEC1 genes to convert a drug-resistant cancer cell into a chemotherapy-sensitive cell.
Acknowledgments
This work was supported by grants from the National Institutes of Health (CA21765 [Cancer Center Support Grant]; CA36401 to WEE; GM076990 to PP; and HD0433871 to KO); an American Cancer Society FM Kirby Clinical Research Professorship (to CHP); the American Lebanese Syrian Associated Charities; the Michael Smith Foundation for Health Research (PP); the Canadian Institutes for Health Research (PP); the American Cancer Society–IL Division (KO); and the Cancer Research Foundation (KO).
We thank JM Allan, NA Ellis, MM Le Beau, D Nicolae, and MV Relling for productive discussions and thoughtful feedback. We are especially grateful for the contributions of the many participating patients and their parents, without whom this work would not have been possible.
Author contributions
ROB, TCG, WEE, and KO designed the research; ROB, MRT, KHG, ADS, WEE, and KO wrote the manuscript with substantial input from CHP, and TCG; ROB, CC, DP, WY, and SWP performed the research and statistical analysis; CHP collected and analyzed the St Jude clinical data; WEE directed, analyzed, and interpreted the St Jude genomic and pharmacogenomic data; WEE and KO directed the project. All authors contributed toward data analysis, drafting and critically revising the paper, gave final approval of the version to be published, and agree to be accountable for all aspects of the work.
Disclosure
The authors report no conflicts of interest in this work.
References
Pui CH, Evans WE. Treatment of acute lymphoblastic leukemia. N Engl J Med. 2006;354:166–178. | ||
Pui CH, Relling MV, Downing JR. Acute lymphoblastic leukemia. N Engl J Med. 2004;350:1535–1548. | ||
Hunger SP, Lu X, Devidas M, et al. Improved survival for children and adolescents with acute lymphoblastic leukemia between 1990 and 2005: a report from the children’s oncology group. J Clin Oncol;30:1663–1669. | ||
Holleman A, Cheok MH, den Boer ML, et al. Gene-expression patterns in drug-resistant acute lymphoblastic leukemia cells and response to treatment. N Engl J Med. 2004;351:533–542. | ||
Beesley AH, Cummings AJ, Freitas JR, et al. The gene expression signature of relapse in paediatric acute lymphoblastic leukaemia: implications for mechanisms of therapy failure. Br J Haematol. 2005:131:447–456. | ||
Kaspers GJ, Veerman AJ, Pieters R, et al. In vitro cellular drug resistance and prognosis in newly diagnosed childhood acute lymphoblastic leukemia. Blood. 1997;90:2723–2729. | ||
Lugthart S, Cheok MH, den Boer ML, et al. Identification of genes associated with chemotherapy cross resistance and treatment response in childhood acute lymphoblastic leukemia. Cancer Cell. 2005;7:375–386. | ||
Pieters R, Huismans DR, Loonen AH, et al. Relation of cellular drug resistance to long-term clinical outcome in childhood acute lymphoblastic leukaemia. Lancet. 1991;338:399–403. | ||
Yang JJ, Bhojwani D, Yang W, et al. Genome-wide copy number profiling reveals molecular evolution from diagnosis to relapse in childhood acute lymphoblastic leukemia. Blood. 2008;112:4178–4183. | ||
Mullighan CG, Phillips LA, Su X, et al. Genomic analysis of the clonal origins of relapsed acute lymphoblastic leukemia. Science. 2008;322:1377–1380. | ||
Hof J, Krentz S, van Schewick C, et al. Mutations and deletions of the TP53 gene predict nonresponse to treatment and poor outcome in first relapse of childhood acute lymphoblastic leukemia. J Clin Oncol. 2011:29:3185–3193. | ||
Krentz S, Hof J, Mendioroz A, et al. Prognostic value of genetic alterations in children with first bone marrow relapse of childhood B-cell precursor acute lymphoblastic leukemia. Leukemia. 2013: 27:295–304. | ||
Vogelstein B, Lane D, Levine AJ. Surfing the p53 network. Nature. 2000;408:307–310. | ||
Schwartz JL, Jordan R, Evans HH. Characteristics of chromosome instability in the human lymphoblast cell line WTK1. Cancer Genet Cytogenet. 2001;129:124–130. | ||
Tsai MH, Chen X, Chandramouli GV, et al. Transcriptional responses to ionizing radiation reveal that p53R2 protects against radiation-induced mutagenesis in human lymphoblastoid cells. Oncogene. 2006;25:622–632. | ||
Li C, Wong WH. Model-based analysis of oligonucleotide arrays: expression index computation and outlier detection. Proc Natl Acad Sci USA. 2001;98:31–36. | ||
Pui CH, Sandlund JT, Pei D, et al. Improved outcome for children with acute lymphoblastic leukemia: results of Total Therapy Study XIIIB at St Jude Children’s Research Hospital. Blood. 2004;104:2690–2696. | ||
Pui CH, Mahmoud HH, Rivera GK, et al. Early intensification of intrathecal chemotherapy virtually eliminates central nervous system relapse in children with acute lymphoblastic leukemia. Blood. 1998;92:411–415. | ||
Pui CH, Campana D, Pei D, et al. Treating childhood acute lymphoblastic leukemia without cranial irradiation. N Engl J Med. 2009;360:2730–2741. | ||
Bhojwani D, Kang H, Menezes RX, et al. Gene expression signatures predictive of early response and outcome in high-risk childhood acute lymphoblastic leukemia: a Children’s Oncology Group Study [corrected]. J Clin Oncol. 2008;26:4376–4384. | ||
Mantel N, Haenszel W. Statistical aspects of the analysis of data from retrospective studies of disease. J Natl Cancer Inst. 1959;22:719–748. | ||
Kalbfleisch JD, Prentice RL. The Statistical Analysis of Failure Time Data. New York: John Wiley & Sons, Inc;1988. | ||
Gray RJ. A class of K-sample tests for comparing the cumulative incidence of a competing risk. Ann Stat. 1988;16:1141–1154. | ||
Fine JP, Gray RJ. A proportional hazards model for the subdistribution of a competing risk. JASA. 1999;94:496–509. | ||
Dumaz N, Milne DM, Jardine LJ, Meek DW. Critical roles for the serine 20, but not the serine 15, phosphorylation site and for the polyproline domain in regulating p53 turnover. Biochem J. 2001:359:459–464. | ||
Marston E, Weston V, Jesson J, et al. Stratification of pediatric ALL by in vitro cellular responses to DNA double-strand breaks provides insight into the molecular mechanisms underlying clinical response. Blood. 2009;113:117–126. | ||
Den Boer ML, Harms DO, Pieters R, et al. Patient stratification based on prednisolone-vincristine-asparaginase resistance profiles in children with acute lymphoblastic leukemia. J Clin Oncol. 2003;21:3262–3268. | ||
Toledo F, Krummel KA, Lee CJ, et al. A mouse p53 mutant lacking the proline-rich domain rescues Mdm4 deficiency and provides insight into the Mdm2-Mdm4-p53 regulatory network. Cancer Cell. 2006;9:273–285. | ||
Schmitt CA, Fridman JS, Yang M, Baranov E, Hoffman RM, Lowe SW. Dissecting p53 tumor suppressor functions in vivo. Cancer Cell. 2002;1:289–298. | ||
Eischen CM, Roussel MF, Korsmeyer SJ, Cleveland JL. Bax loss impairs Myc-induced apoptosis and circumvents the selection of p53 mutations during Myc-mediated lymphomagenesis. Mol Cell Biol. 2001;21:7653–7662. | ||
Vousden KH, Lane DP. p53 in health and disease. Nat Rev Mol Cell Biol. 2007;8:275–283. | ||
Polyak K, Xia Y, Zweier JL, Kinzler KW, Vogelstein B. A model for p53-induced apoptosis. Nature. 1997;389:300–305. | ||
Lu X, Ma O, Nguyen TA, Jones SN, Oren M, Donehower LA. The Wip1 phosphatase acts as a gatekeeper in the p53-Mdm2 autoregulatory loop. Cancer Cell. 2007;12:342–354. | ||
Tamura RE, de Vasconcellos JF, Sarkar D, et al. GADD45 proteins: central players in tumorigenesis. Curr Mol Med. 2012;12:634–651. | ||
Cazzalini O, Scovassi AI, Savio M, et al. Multiple roles of the cell cycle inhibitor p21(CDKN1A) in the DNA damage response. Mutat Res. 2010;704:12–20. | ||
Bersani C, Xu LD, Vilborg A, et al. Wig-1 regulates cell cycle arrest and cell death through the p53 targets FAS and 14-3-3σ. Oncogene. 2014;33:4407–4417. | ||
Hatakeyama S. TRIM proteins and cancer. Nat Rev Cancer. 2011;11:792–804. |
 © 2017 The Author(s). This work is published and licensed by Dove Medical Press Limited. The full terms of this license are available at https://www.dovepress.com/terms.php and incorporate the Creative Commons Attribution - Non Commercial (unported, v3.0) License.
By accessing the work you hereby accept the Terms. Non-commercial uses of the work are permitted without any further permission from Dove Medical Press Limited, provided the work is properly attributed. For permission for commercial use of this work, please see paragraphs 4.2 and 5 of our Terms.
© 2017 The Author(s). This work is published and licensed by Dove Medical Press Limited. The full terms of this license are available at https://www.dovepress.com/terms.php and incorporate the Creative Commons Attribution - Non Commercial (unported, v3.0) License.
By accessing the work you hereby accept the Terms. Non-commercial uses of the work are permitted without any further permission from Dove Medical Press Limited, provided the work is properly attributed. For permission for commercial use of this work, please see paragraphs 4.2 and 5 of our Terms.