")
Back to Journals » OncoTargets and Therapy » Volume 14
A Novel Transcription Factor-Based Prognostic Signature in Endometrial Cancer: Establishment and Validation
Authors Yang X, Cheng Y, Li X, Zhou J, Dong Y, Shen B, Zhao L, Wang J
Received 23 November 2020
Accepted for publication 18 February 2021
Published 13 April 2021 Volume 2021:14 Pages 2579—2598
DOI https://doi.org/10.2147/OTT.S293085
Checked for plagiarism Yes
Review by Single anonymous peer review
Peer reviewer comments 3
Editor who approved publication: Prof. Dr. Takuya Aoki
Xiao Yang,* Yuan Cheng,* Xingchen Li, Jingyi Zhou, Yangyang Dong, Boqiang Shen, Lijun Zhao, Jianliu Wang
Department of Obstetrics and Gynecology, Peking University People’s Hospital, Beijing, People’s Republic of China
*These authors contributed equally to this work
Correspondence: Jianliu Wang
Department of Obstetrics and Gynecology, Peking University People’s Hospital, No. 11 South Avenue, Xi Zhi Men Xicheng District, Beijing, 100044, People’s Republic of China
Tel +86 10 8832 4474
Fax +86 10-8832 4474
Email [email protected]
Background: Endometrial cancer (EC) is a common malignancy of the female reproductive system worldwide. Increasing evidence has suggested that many transcription factors are aberrantly expressed in various cancers. This study aimed to develop a transcription factor-based prognostic signature for EC.
Methods: Gene expression data and clinical data of EC patients were downloaded from The Cancer Genome Atlas (TCGA) database. Univariate Cox regression and Multivariate Cox regression analysis was used to construct a prognostic signature. Then, the efficacy of the prognostic signature was validated in a training cohort, testing cohort and then the entire cohort. Correlations between clinical features and the model were also analyzed, and a nomogram based on the multivariate Cox analysis was developed. Furthermore, we verified the effect of a key transcription factor, E2F1, on biological functions of EC in vitro.
Results: We developed a nine-transcription factor (MSX1, HOXB9, E2F1, DLX4, BNC2, DLX2, PDX1, POU3F2, and FOXP3) prognostic signature. Compared with those in the low-risk group, patients in the high-risk group had worse clinical outcomes. The area under the curve (AUC) of this prognostic signature for 5-year survival was 0.806 in the training cohort, 0.710 in the testing cohort and 0.761 in the entire cohort. Gene set enrichment analysis (GSEA) revealed a correlation between the prognostic signature and various cancer signaling pathways, and a hub transcription factor regulatory network was constructed. The prognostic signature was confirmed to have independent predictive value. Finally, a nomogram based on the prognostic signature and clinical independent prognostic factors was also established and performed well according to the calibration curves. Further, knockdown of E2F1 inhibited invasion and metastasis of EC cells.
Conclusion: Our study developed and validated a transcription factor-based prognostic signature that accurately predicts prognosis of EC patients. Moreover, E2F1 may represent a potential target for the treatment of EC.
Keywords: endometrial cancer, transcription factor, prognostic signature, risk score, nomogram
Introduction
Endometrial cancer (EC) is a common tumor of the female reproductive system. Global statistics show that there were 382,069 new cases of EC and 89,929 EC-related deaths worldwide in 2018.1 The most recent American Cancer Society estimates indicate that 65,620 new cases and 12,590 deaths due to EC will occur in 2020.2 During the past 20 years, with diet and lifestyle changes, the incidence of EC has been rising each year and has continued to increase in younger adults. Typically, endometrial carcinoma is classified into two types based on the clinical and pathological characteristics. Type I EC is often considered estrogen-dependent and accounts for approximately 80–90% of all ECs. Type II EC is estrogen-independent and accounts for approximately 10–20%. Approximately 70–80% of EC patients are diagnosed at an early stage. Surgery, chemoradiotherapy and adjuvant progesterone therapy can substantially improve the quality of life of EC patients, and these therapies can also significantly prolong their survival time. However, effective remedies for patients with advanced disease, recurrence and metastasis are limited, and effective prognostic evaluation methods are lacking, which leads to death from tumor recurrence and metastasis.3 Research findings indicate that the 5-year overall survival ranges from 75% to 86%, that the tumor relapse rate of EC patients is 14.5%, and that the cancer-related mortality rate of EC patients is 15.9%.4,5 In contrast, the 5-year overall survival rate is only 40% to 50% for stage IIIC patients, while for stage IV patients, the overall survival rate is below 20%.6 Hence, mining and identifying new prognostic indicators and potential therapeutic targets are warranted to improve the survival of EC patients.
Transcription factors are proteins that can bind to RNA polymerase II and form a transcription initiation complex, which participates in transcription initiation. Currently, more than 1600 transcription factors have been confirmed in the human genome.7 Studies have shown that many transcription factors are also closely related to tumor proliferation, invasion and metastasis as well as patient prognosis.8 Many transcription factors have been found to be overactivated in EC, where they contribute to EC growth through multiple signal transduction pathways.9–12 Previous studies have reported that the number of oncogenic signaling proteins that are altered in cancer outnumber oncogenic transcription factors, which indicates that transcription factors are promising therapeutic targets in tumors.13 Although it is known that transcription factors participate in tumor occurrence and progression, the potential mechanism of transcription factors in endometrial carcinoma has not been fully explored.
Recently, a series of diagnostic and prognostic biomarkers for tumors were identified based on gene chip and sequencing technology and public tumor databases, such as The Cancer Genome Atlas (TCGA) (including 7 different levels of gene data of 33 tumors from 11,000 patients) and the Gene Expression Omnibus (GEO). According to these databases, several prognostic signatures were identified in various cancer types. Studies have established an immune-related prognostic signature and a glycolysis-related gene signature in EC, which have provided the basis for predicting prognostic risk in EC patients.14,15 Another study identified several transcription factors related to the prognosis of EC patients.16 Nevertheless, a prognostic signature based on transcription factors to systematically and accurately evaluate EC prognosis is lacking. A comprehensive analysis was performed to investigate transcription factor-related prognostic makers of EC to expand current knowledge of the role of transcription factors as important gene expression regulatory proteins in tumorigenesis and development.
Compared with the GEO database, the TCGA database contains more complete clinical information on EC patients, which is conducive to a comprehensive analysis of potential prognostic factors. Therefore, we downloaded RNA-sequencing data and clinicopathological features data of EC patients in the TCGA database. Based on integrated bioinformatics methods, we screened nine transcription factors that were significantly associated with EC prognosis and analyzed their potential functions and mechanisms. Eventually, we established a prognostic nomogram that integrates a transcription factor-related signature and several clinical features to predict overall survival in individual EC patients; this nomogram also provides some potential therapeutic targets for EC treatment.
Materials and Methods
Data Download and Preparation
The mRNA expression profiles and clinical information of 552 ECs were extracted from the TCGA (https://portal.gdc.cancer.gov/; https://gdc.xenahubs.net). The profiles of 35 normal samples were also downloaded. Patients with available mRNA expression profiles, clinical data and survival information were included in subsequent analyses. The clinical information included age, histological type, tumor stage, grade, lymph node metastases (LNM), peritoneal cytology, survival time and survival status. In all, 1639 transcription factors7 were included in this study.
Screening of Differentially Expressed Transcription Factors
We extracted transcription factor expression data from the mRNA expression profiles. Then, the transcription factors that were differentially expressed between EC and normal samples were screened out using the limma R package and Wilcox test, with a false discovery rate (FDR) < 0.05 and a log2-fold change (logFC)>2 as the cut-off values. Gene Ontology (GO) and Kyoto Encyclopedia of Genes and Genomes (KEGG) pathway enrichment analyses were performed to analyze the enriched signaling pathways of differentially expressed transcription factors using cluster Profiler R package,17 and adjusted P values<0.05 were considered to indicate significant statistical significance. R ×64 3.6.3 software was used for data analysis.
Construction of the Transcription Factor-Related Prognostic Signature
The “survival” R package was used to preliminarily screen transcription factors closely related to the prognosis of EC using univariate Cox regression analysis. Only transcription factors with P<0.01 were selected for subsequent analysis.
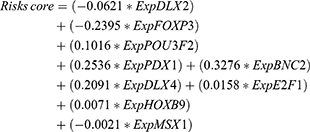
To further screen independent prognostic genes, the entire cohort, which included 542 EC patients with complete survival time and status data, was randomly divided into a training cohort (n = 272) and a testing cohort (n = 270). Next, a multivariate Cox regression analysis was performed to build a prognostic signature and a prognostic index formula based on the training cohort. The formula was applied to calculate each patient’s risk score, as follows:18

In the formula, Coefi represents the coefficient of each transcription factor in the prognostic signature, and  represents the expression level of each gene in the prognostic model.
Validation of the Efficacy of the Prognostic Signature
Patients in the training cohort, testing cohort and entire cohort were further subdivided into high-risk and low-risk groups based on the median risk score of the prognostic signature. Then, Kaplan-Meier survival analysis and time-dependent receiver operating characteristic (ROC) curves were used to verify the efficacy of the prognostic signature for predicting the prognosis of patients in the training cohort, testing cohort and entire cohort using the “survival”, “survminer” and “survival ROC” R packages. An area under the curve (AUC) > 0.60 was considered acceptable.
We explored the correlation between this prognostic signature and clinicopathological features including tumor grade, stage, and peritoneal cytology of EC patients using the “beeswarm” R package. Patients with different ages, grades, stages and peritoneal cytology were subdivided into high-risk and low-risk groups, after which we compared the survival differences between the two groups to determine whether the prognostic model had an independent predictive effect.
Construction and Assessment of a Nomogram Based on the Prognostic Signature
To further explore whether this prognostic signature has independent prognostic value, we performed univariate and multivariate Cox analyses. Multiple clinicopathological indicators closely related to EC were included in the analysis, including age, histological type, tumor stage, grade, LNM, peritoneal cytology and the transcription factor-related prognostic signature risk score. Then, a nomogram19 was constructed by integrating the prognostic signature and clinicopathological features to quantify risk evaluation and predict clinical outcomes of EC patients. The nomogram was constructed by applying the “regplot” R package, and the calibration curve was used to assess the accuracy of the prognostic signature for predicting the 1-, 3-, and 5-year overall survival of EC patients.
Gene Set Enrichment Analysis (GSEA)
To further analyze the molecular signaling pathways regulated by genes in the prognostic signature, we used GSEA enrichment analysis20 to explore significantly enriched signaling pathways in the high-risk and low-risk groups. The normalized enrichment score (NES) and FDR q value were used to evaluate the enrichment effect of the gene set, and an FDR q< 0.05 was considered statistically significant.
Construction of a Transcription Factor Regulatory Network
The regulation of transcription levels is important in gene regulation. To further study potential regulatory genes and mechanisms of the nine transcription factors in the prognostic model, we constructed a transcription factor regulatory network. First, a series of target genes of these transcription factors was predicted using Harmonizome (http://amp.pharm.mssm.edu/Harmonizome/). Then, target genes of the nine transcription factors and the differentially expressed genes (DEGs) between EC and normal tissues were intersected to obtain the intersecting genes. The regulatory network of these transcription factors and related target genes was constructed and visualized using Cytoscape 3.6.0 software.21
Comparison of Variables in the Prognostic Signature with Clinicopathological Features
We also explored the relationships among variables in the prognostic signature with clinical characteristics (histological type, tumor stage, grade, LNM, peritoneal cytology, survival status) of EC patients using the Wilcoxon test in the entire cohort. P<0.05 was considered statistically significant.
In vitro Validation
The protein expression data of E2F1 was validated from the Human Protein Atlas (HPA) database (http://www.proteinatlas.org/).EC cell lines, including Ishikawa, HEC-1A, HEC-1B and AN3CA, were obtained from the Department of Gynecology Laboratory of People’s Hospital of Peking University. All the cell lines used in this study had been approval by the ethics committee of Peking University People’s Hospital. Cell lines were cultured in 90% DMEM-F-12 or McCoy’s 5A medium and 10% FBS at 37°C in a 5% CO2 incubator.
E2F1 siRNAs were designed and synthesized by HanBio (Shanghai, China). E2F1 siRNAs were transfected into cells according to the manufacturer’s instructions. Total protein and RNA were harvested 48 hours after transfection for further analysis. RT-PCR and Western blot were conducted according to a previously described method.22,23 The cell proliferation activity was tested by a Cell Counting Kit CCK-8 (Dojindo, Japan) assay at 450 nm in a microplate reader.
To further examine the effect of E2F1 on invasion and migration in endometrial carcinoma, we performed wound healing, cell invasion and migration assays. The wound healing experiment was performed using the scratch plug-in method. The scratch wound closure experiment was performed using 2-hole plug-ins (IBIDI, 80209) with a fixed scratch 500 μm wide. Suspensions were prepared with cells at a density of 3*105/mL, and a 70 µL cell suspension was seeded into each plug-in. When the degree of fusion of the cells reached 85%, the plug-ins were removed. Cells were washed with PBS and cultured in 98% DMEM-F-12 medium+2% FBS. The width of the scratch was observed and imaged under a microscope (0–36 hours). Transwell membranes were coated with 50 mg/l Matrigel (1:8 dilution) (BD) for 5 hours for invasion assays and without Matrigel for migration assays. The 200 μL serum-free medium containing 20,000 cells was added to the upper chambers, while 500 μL medium containing 10% FBS was added to the lower chambers. A cotton swab was then used to gently wipe cells off the upper layer after 48 hours. Finally, the cells were stained with 1% crystal violet, and images were statistically analyzed using ImageJ software.
Results
Screening of Differentially Expressed Transcription Factors in EC Patients
The work diagram of the analysis design is illustrated in Figure 1. We downloaded mRNA expression profiling data and clinical features including those from 552 cases of endometrial carcinoma and 35 normal tissue samples from the TCGA database. We extracted 1639 transcription factor expression profiles from the TCGA and screened differentially expressed transcription factors using the limma R package (FDR < 0.05, logFC > 2). The results revealed 119 upregulated and 78 downregulated transcription factors in EC tissues, as shown in Figure 2.
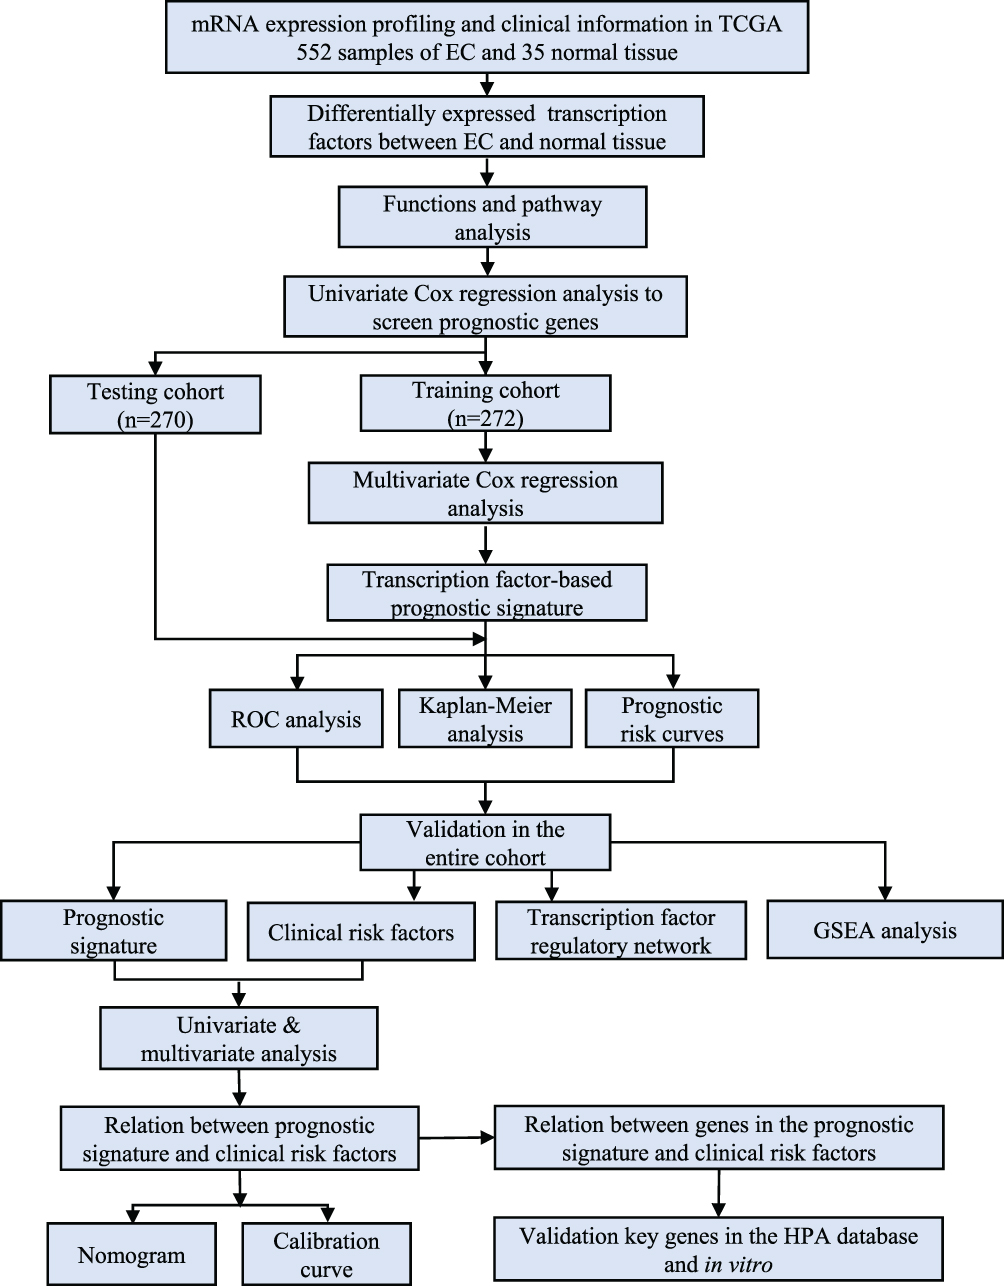 |
Figure 1 The flow chart for analyzing transcription factors in endometrial cancer. |
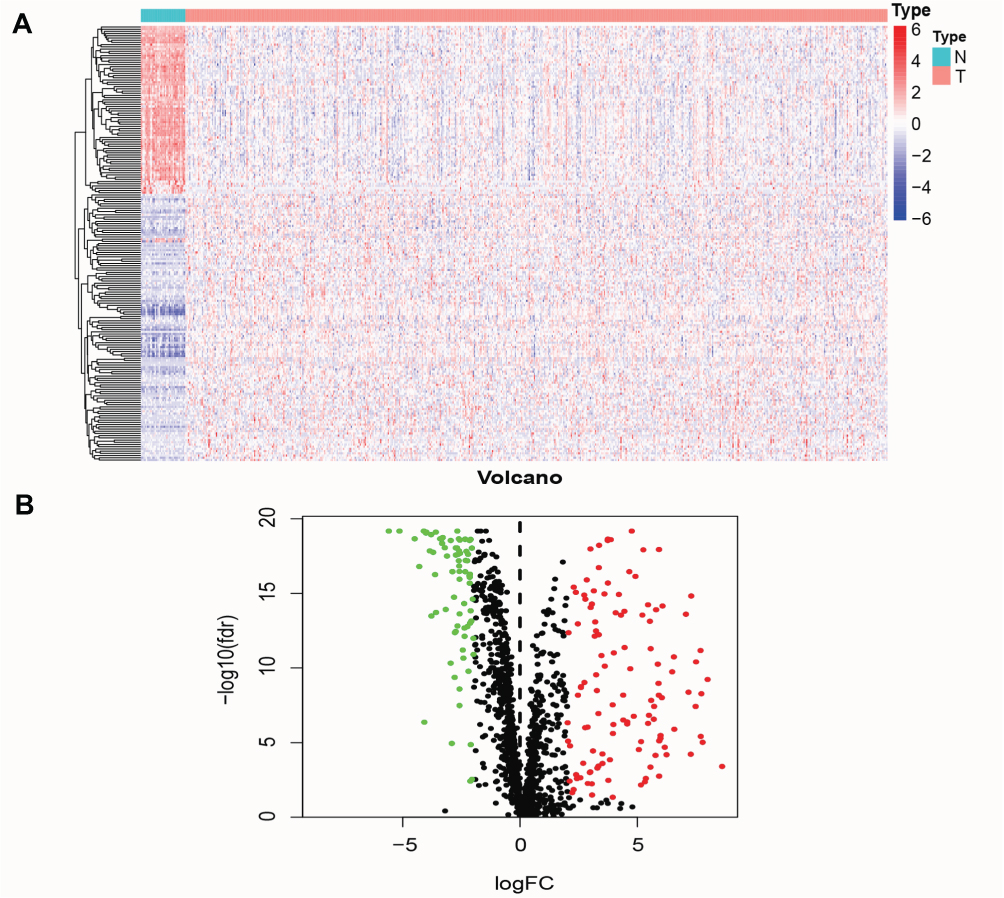 |
Figure 2 Identification of differently expressed transcription factor in endometrial cancer patients. (A) Differentially expressed transcription factors was showed in the heatmap. (B) Volcano plot of up-regulated and down-regulated differentially expressed transcription factors. Red dots represent highly expressed transcription factors, green dots represent low expressed transcription factors, and black dots represent no significant difference. |
To further investigate the biological function and mechanism of these differentially expressed transcription factors, GO and KEGG enrichment analyses were conducted. GO enrichment analysis includes three parts: cellular component (CC), molecular function (MF) and biological process (BP). The results indicated that differentially expressed transcription factors were enriched in pattern specification and regionalization (BP), transcription factor complex and nuclear transcription factor complex (CC), and DNA-binding transcription activator activity, DNA-binding transcription repressor activity and enhancer binding (MF) (Figure 3A). KEGG enrichment analysis demonstrated that differentially expressed transcription factors primarily participated in transcription dysregulation in cancer, signaling pathways regulating pluripotency of stem cells, pathways in cancer and microRNAs in cancer (Figure 3B).
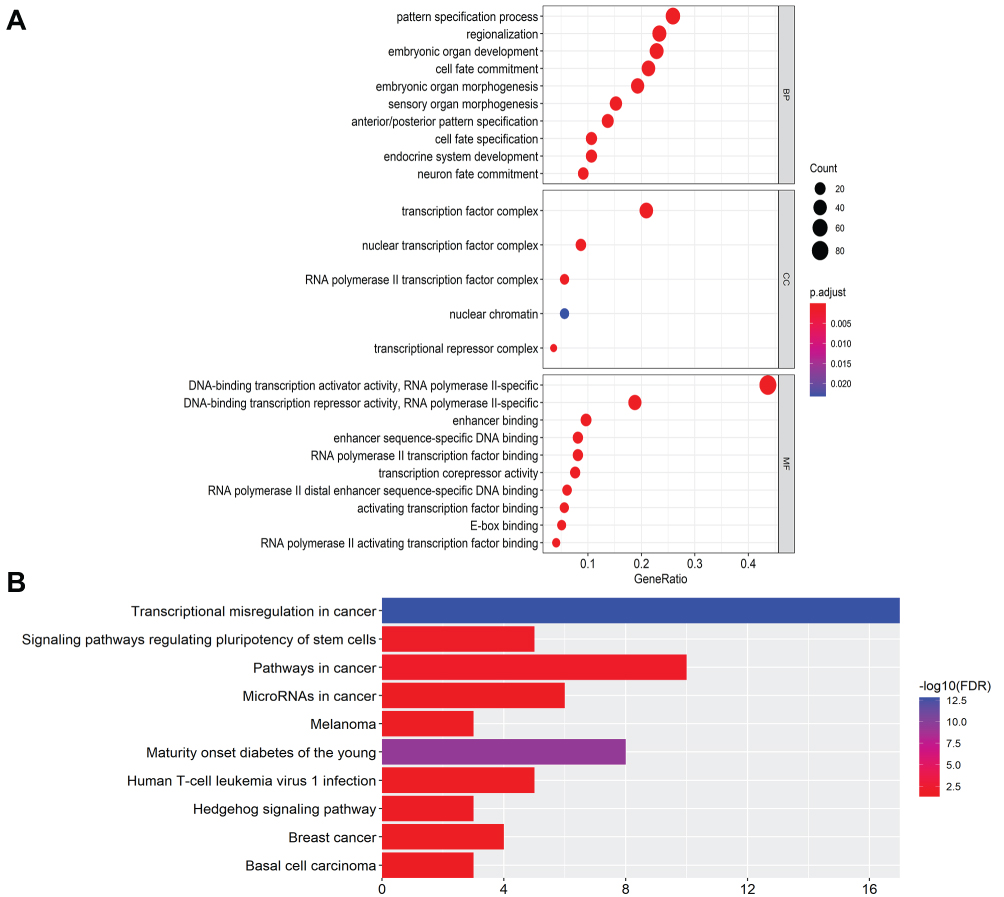 |
Figure 3 GO and KEGG pathway functional enrichment analysis of differently expressed transcription factors. (A) The GO terms enriched in BP, CC and MF. X-axis represents gene ratio. Different color represents p. adjust. (B) KEGG enrichment analysis. X-axis represents fold enrichment, and different color represents -log10 (FDR). |
Constructing a Transcription Factor-Related Prognostic Signature
To investigate the effect of these differentially expressed transcription factors on prognosis, a univariate Cox regression analysis was first performed to screen for transcription factors that are closely associated with the overall survival of EC patients. Finally, 29 transcription factors were obtained for further study (P<0.01) (Table 1). A hazard ratio (HR) >1 indicates that exposure is a risk factor, and HR<1 indicates that exposure is a protective factor.
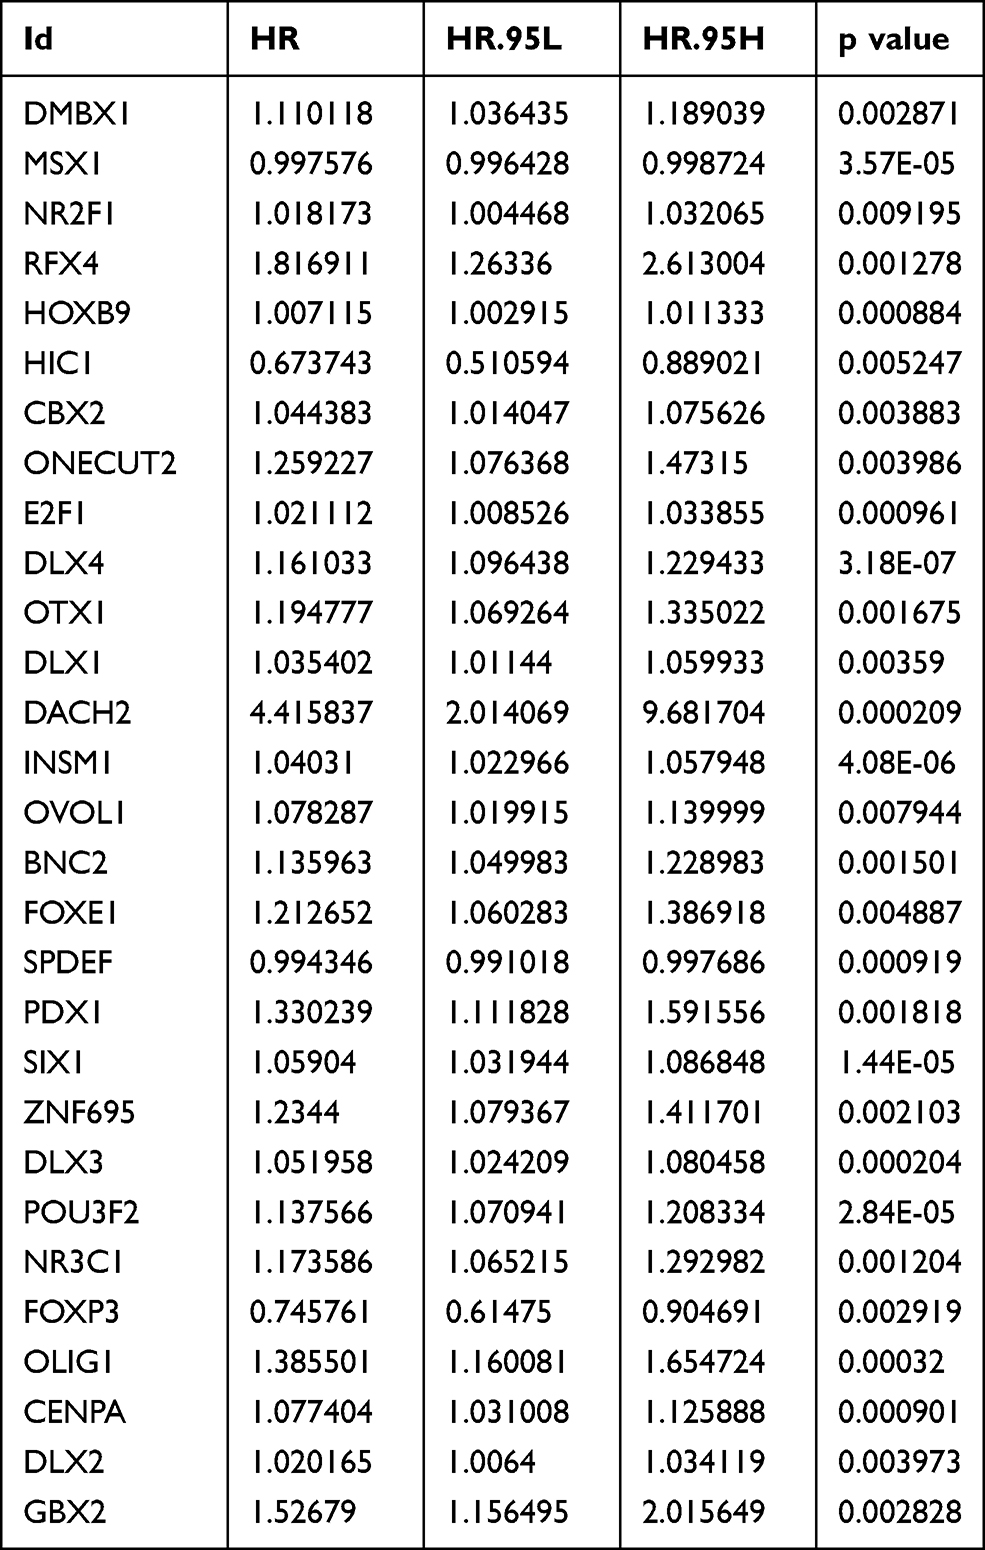 |
Table 1 Univariate Cox Regression Analysis Identifying Prognostic Differentially Expressed Transcription Factors |
Subsequently, the 29 transcription factors were analyzed by multivariate Cox regression to screen for independent prognostic factors of EC in the training cohort. Nine transcription factors were ultimately identified to establish the prognostic signature (Figure 4A). The multivariate regression coefficients of each gene in the signature are shown in Figure 4B. The risk score formula for each patient was calculated as follows:
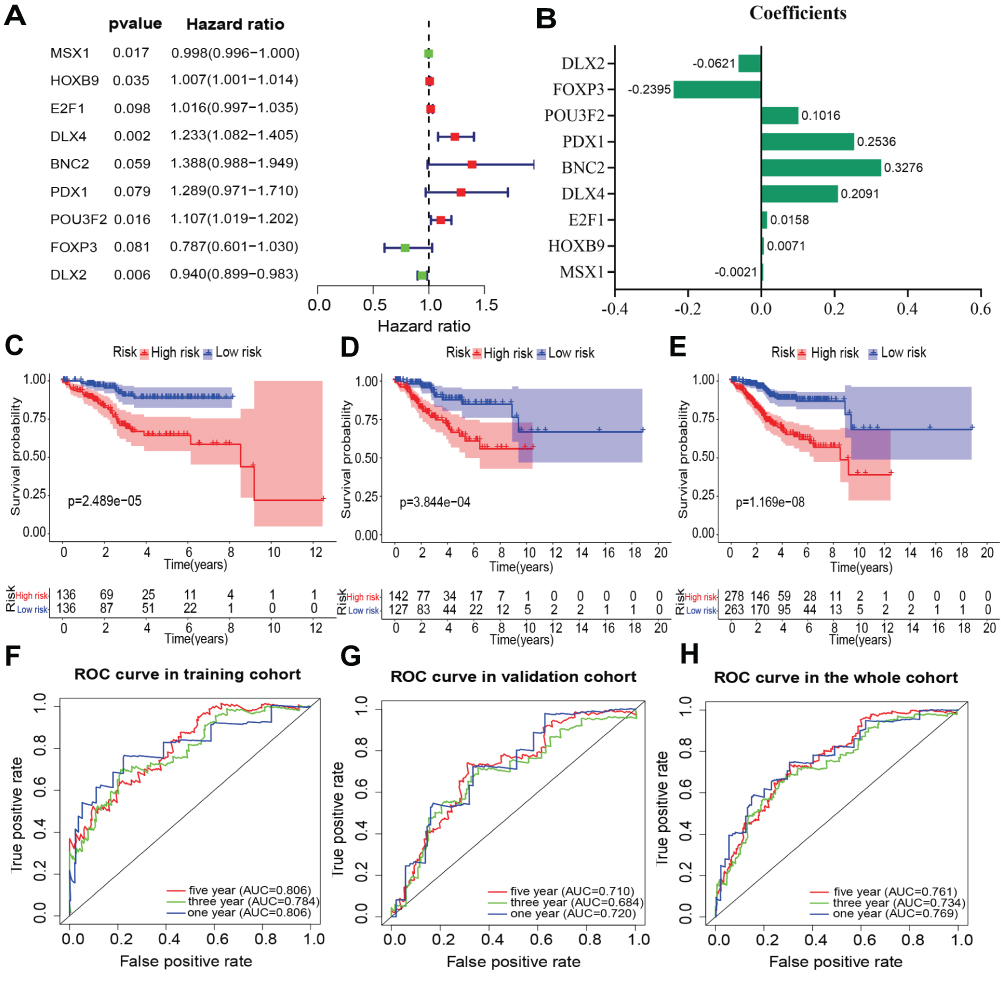 |
Figure 4 Multivariate Cox regression to identify independent prognostic transcription factors of EC in the training cohort, and Kaplan-Meier survival and ROC curve were performed to validate the efficacy of the prognostic signature for predicting the survival of patients. (A) Multivariate Cox analysis. (B) The multivariate regression coefficients of each gene. (C–E) Kaplan-Meier survival for EC patients of high-risk and low-risk group in the training cohort, testing cohort and the entire cohort respectively. (F–H) ROC curves based on the prognostic signature in the training cohort, testing cohort and the entire cohort respectively. |
Validation of the Effectiveness of the Transcription Factor-Related Prognostic Signature
Patients were divided into high-risk and low-risk groups according to the median risk score in the training cohort. Kaplan-Meier survival and ROC curve analyses were performed to estimate the efficacy of the risk model for predicting the survival of EC patients. The results showed that the transcription factor-related prognostic signature was significantly associated with patient prognosis and that the prognosis of patients in the high-risk group was worse than that of patients in the low-risk group (Figure 4C). To verify the prediction accuracy of the prognostic model, the risk scores for each patient were also calculated in the testing cohort and the entire cohort. Then, patients in both the testing cohort and the entire cohort were divided into high-risk and low-risk groups according to the median risk score of the training cohort. The prognosis of patients in the high-risk group was consistently worse than that of patients in the low-risk group for both the testing cohort and the entire cohort (Figure 4D and E).
The ROC analysis showed that the AUC values of the prognostic signature were 0.806, 0.784, and 0.806 for the 1-, 3- and 5-year overall survival, respectively, in the training cohort (Figure 4F). In the testing cohort, the AUC values were 0.710, 0.684, and 0.720 at the 1-, 3- and 5-year time points, respectively (Figure 4G). In the testing cohort, the AUC values were 0.761, 0.734, and 0.769 at the 1-, 3- and 5-year time points, respectively (Figure 4H). The risk curve, survival status and expression of genes in the prognostic model were also displayed according to the high- and low-risk groups in the training and testing cohorts (Figure 5A–F). The expression of risk genes in the prognostic model was shown according to different risk levels, survival status and clinicopathological characteristics in the entire cohort (Figure 5G). In addition, higher stage, higher grade, LNM positivity, peritoneal cytology positivity, and tumor and mortality status were all significantly related to a higher risk score (P<0.001) (Figure 6). Our results demonstrated that the transcription factor-related prognostic signature had good clinical ability to predict the survival of EC patients.
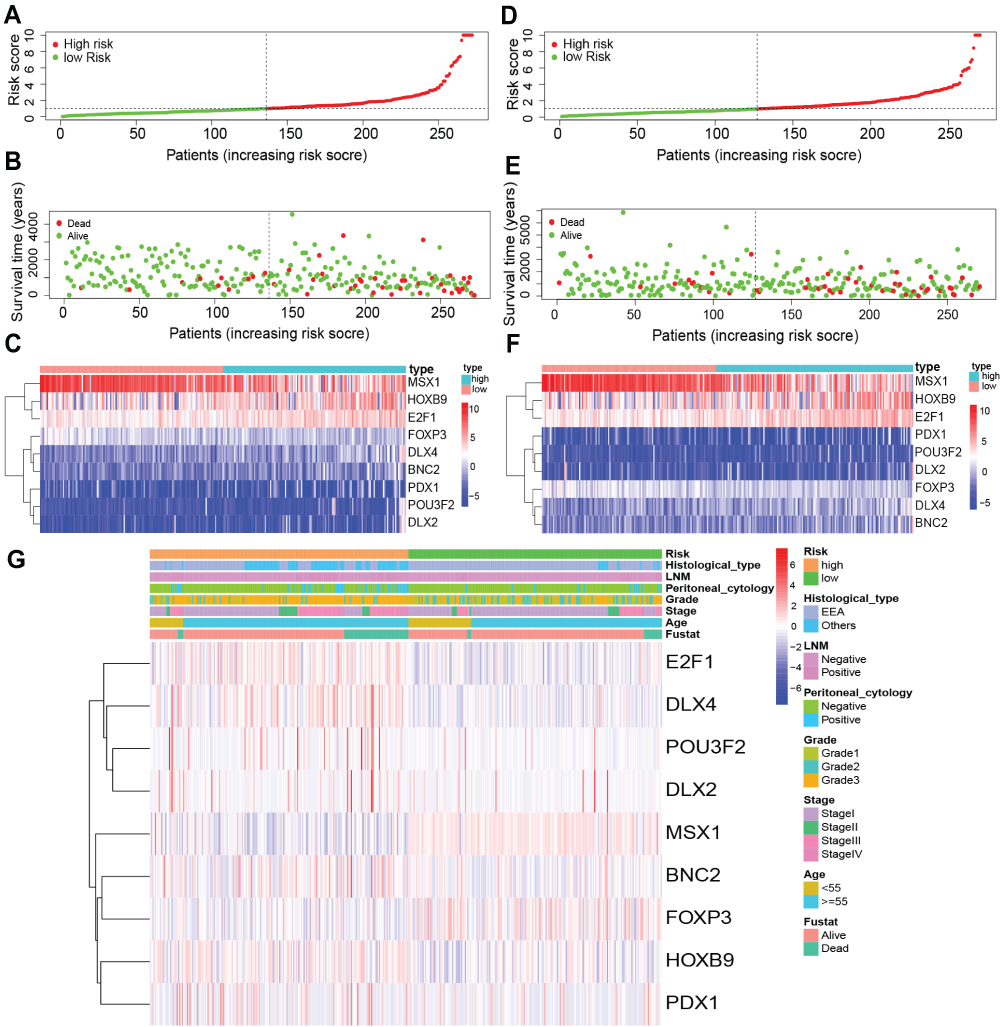 |
Figure 5 Risk score analysis of nine- transcription factors prognostic signature. (A–C) Risk curve, survival status and prognosis model gene expression were displayed according to high and low risk groups in the training cohort. (D–F) Risk curve, survival status and prognosis model gene expression were displayed according to high and low risk groups in the testing cohorts. (G) The heatmap displayed risk gene expression in the prognostic model according to different risk, survival status and clinicopathological characteristics in the entire cohort. |
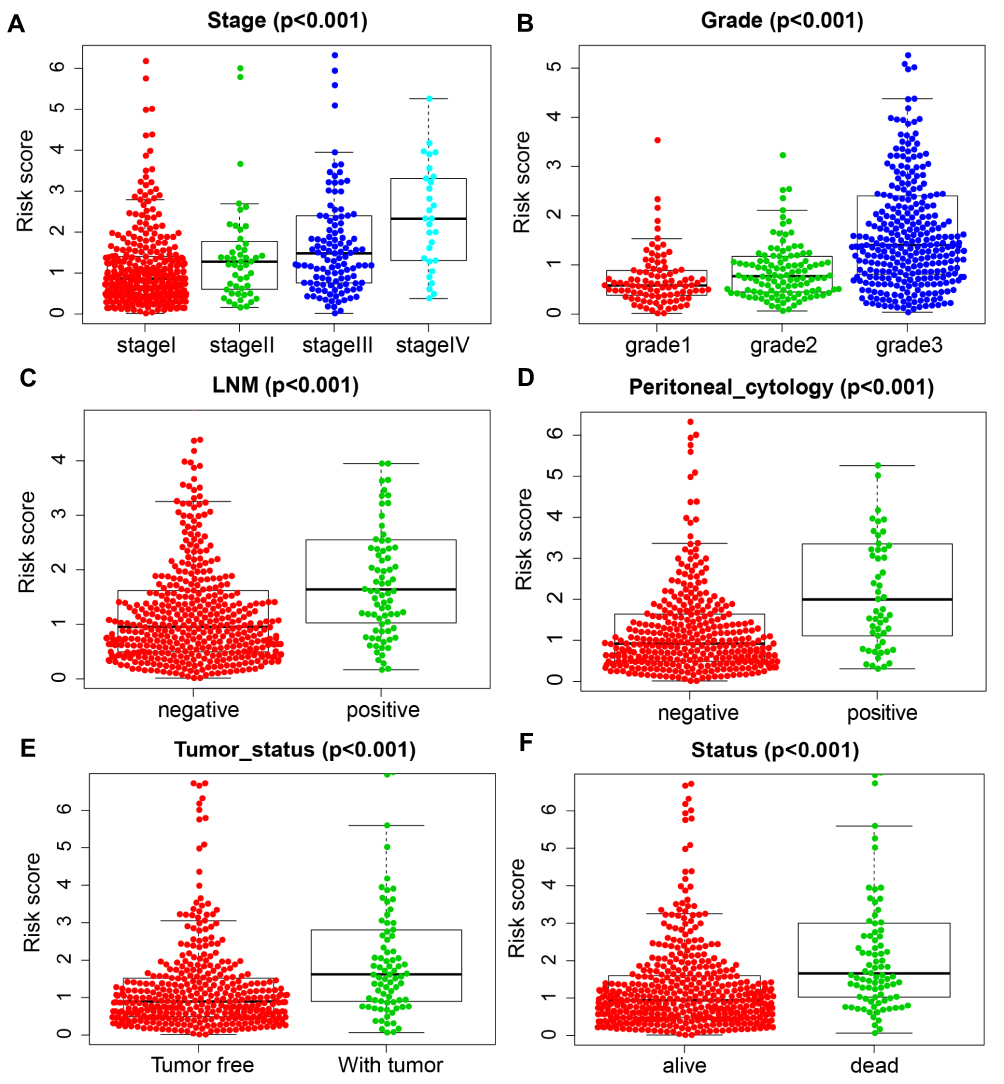 |
Figure 6 Association between the prognostic signature and clinicopathological features. (A) Stage. (B) grade. (C) LNM. (D) Peritoneal cytology. (E) Tumor status. (F) Status of dead. |
Constructing a Regulatory Network of Transcription Factors
To further examine tumor-related signaling pathways regulated by genes in the prognostic signature, GSEA analysis was applied to analyze the enriched signaling pathways of DEGs in the high-risk group. Compared with the low-risk groups, many tumor-related signaling pathways were enriched in the high-risk groups (eg, basal transcription factors, cell cycle, DNA replication, EC, GAP function, tight junction and ERBB signaling pathway) (Figure 7A).
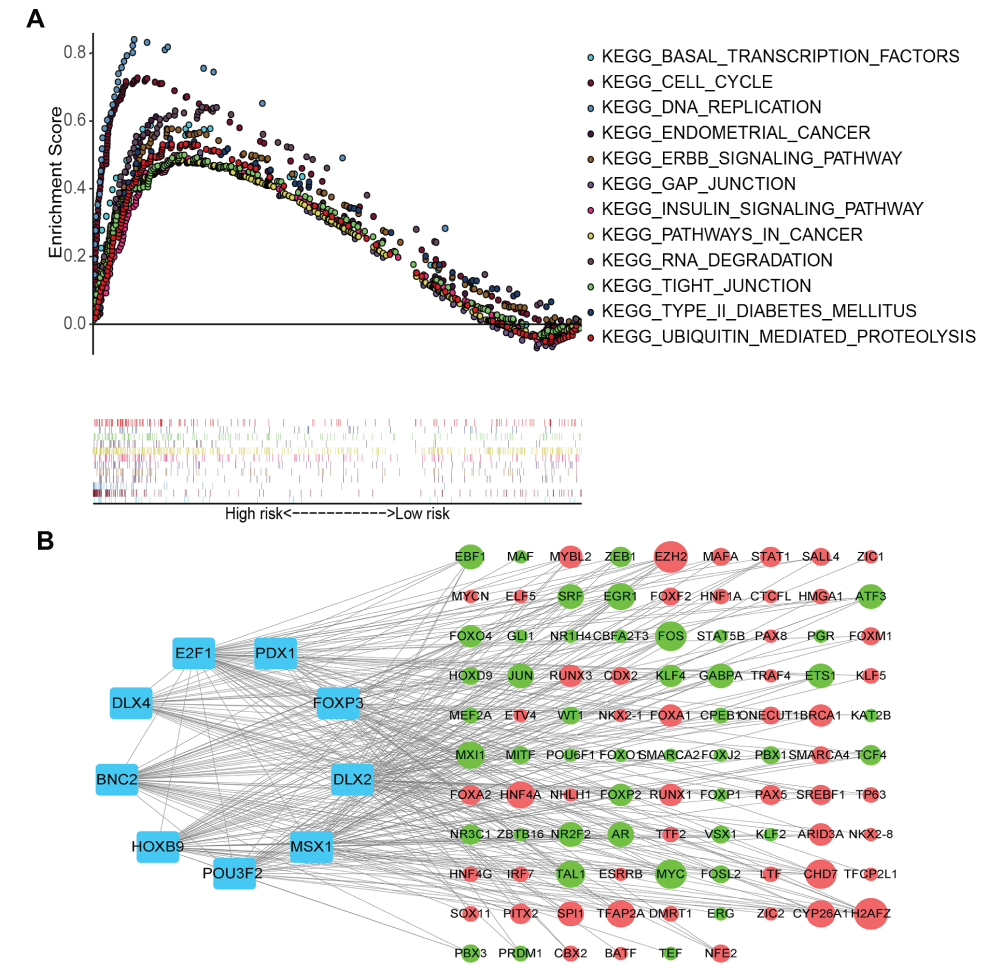 |
Figure 7 GSEA analysis and constructing a transcription factor regulatory network. (A) GSEA analyze the enrichment pathways in high-risk. (B) Constructed a nine-transcription factor regulatory network. Blue nodes represent transcription factors, up-regulated genes were represented with red nodes, and down regulated genes were represent with green nodes. The size of a gene node represents the number of transcription factors associated with it. The larger the circle, the more transcription factors are connected to the gene. |
We next constructed a nine-transcription factor regulatory network to study the potential molecular regulatory mechanisms of these transcription factors in EC. First, target genes of the nine transcription factors were predicted using the Harmonizome database. Subsequently, we screened DEGs between tumor and normal tissues (|log FC|>1 and FDR<0.05). Predicted target genes were intersected with DEGs, and 96 intersecting genes were obtained, 45 of which were downregulated and 51 of which were upregulated. The nine-transcription factor regulatory network was constructed as shown in Figure 7B and included nine transcription factors and 96 targeted genes.
Independent Prognostic Analysis and Construction of a Nomogram
To investigate whether the transcription factor-related prognostic signature is an independent prognostic factor, we performed univariate and multivariate Cox regression analyses in the entire cohort. The univariate analysis revealed that age, grade, stage, peritoneal cytology, LNM, histological type and risk score were important prognostic factors in EC patients in the whole cohort (P<0.01) (Figure 8A). Moreover, a multivariate Cox analysis demonstrated that the risk score was an independent factor for the prognosis of EC patients (P<0.001). In addition, age, stage, grade and peritoneal cytology were demonstrated to be independent prognostic factors in EC patients (Figure 8B). The ROC curve analyses showed that the AUC values of the risk score were better than those for age, stage, grade and peritoneal cytology for the 1-, 3- and 5-year survival (Figure 8C–E).
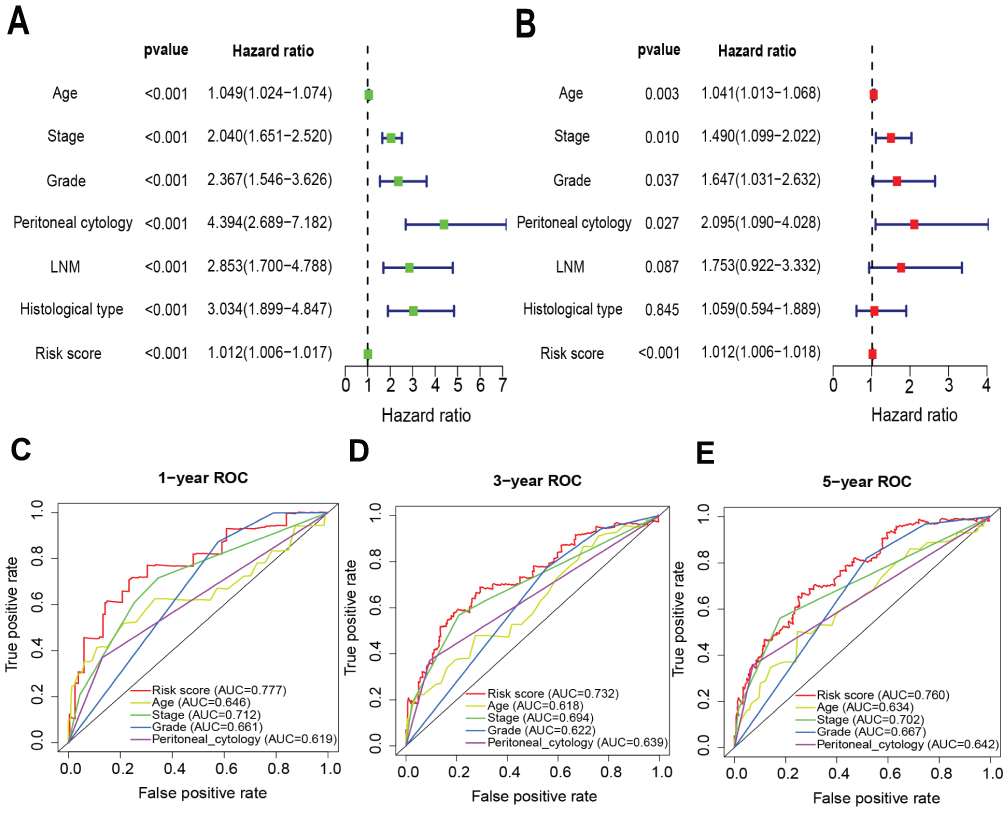 |
Figure 8 Univariate and multivariate Cox regression analyses of overall survival in EC patients. (A) Univariate analysis. (B) Multivariate analysis. (C–E) The ROC curve analyses of the prognostic variables in the entire cohort at at 1-, 3- and 5-year time points, respectively. |
To verify whether this prognostic signature has prognostic value independent of age, stage, grade and peritoneal cytology, we further grouped the age, stage, grade and peritoneal cytology of the patients. According to age, patients were divided into groups of patients ≤ 55 years of age and > 55 years of age. Patients in each group were further classified into high-risk and low-risk groups based on the prognostic signature. The results indicated that the survival time of low-risk patients was significantly longer than that of high-risk patients both in the ≤ 55 years of age and the > 55 years of age groups (P<0.01) (Figure 9A and B). EC patients were also divided into two groups, the early-stage (stage I) and advanced-stage (stage II~IV) groups, based on pathologic stage. The Patients were then divided into low-grade (grade 1 or 2) and high-grade (grade 3) groups according to histologic grade. Similarly, patients in the different groups were subdivided into high-risk and low-risk groups based on the median risk score of the prognostic model. The results demonstrated that patients in the low-risk group had a longer survival than those in the high-risk group in the early-stage, late-stage, low-grade and high-grade groups (P<0.01) (Figure 9C–F). Furthermore, the overall survival time of patients in the high-risk group was significantly shorter than that of patients in the low-risk group in both the peritoneal cytology-negative group and the peritoneal cytology-positive group (Figure 9G and H). These results suggested that the transcription factor-related prognostic signature has independent predictive ability.
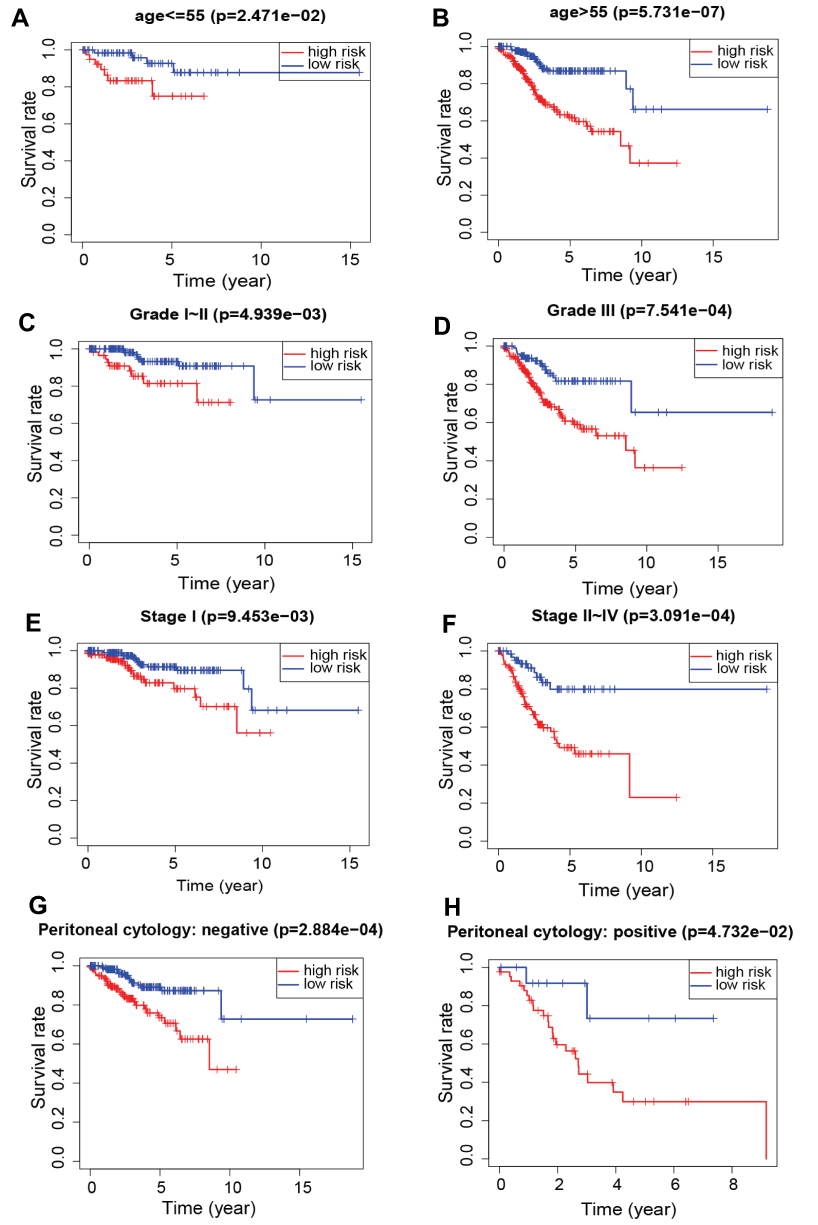 |
Figure 9 Kaplan-Meier survival by risk groups for patients in the entire cohort and subgroups according to patients’ age, stage, grade and peritoneal cytology. (A) Age≤55. (B) Age>55. (C) Grade I–II. (D) Grade III. (E) Stage I. (F) Stage II~IV. (G) Peritoneal cytology: negative. (H) Peritoneal cytology: positive. |
Nomograms have great value in clinical practice because they can be used to calculate the survival rate of patients with specific tumors. Thus, we established a nomogram to evaluate the 3-year and 5-year survival of EC patients by integrating clinical independent prognostic factors (age, stage, grade and peritoneal cytology) and the prognostic signature screened by the multivariate Cox analysis. Total points were calculated based on the points of all variables in the nomogram. The 3- and 5-year survival rates of each EC patient can be predicted by drawing a vertical line from the total points to the survival prediction axis (Figure 10A). This is convenient for clinicians to evaluate patient survival. In addition, the results of the calibration curve analysis demonstrated that the predicted overall survival risk of patients was close to the actual survival (45 degree line) in the training, testing and entire cohorts at 1, 3 and 5 years, which indicates that the nomogram demonstrated good prediction ability (Figure 10B–D).
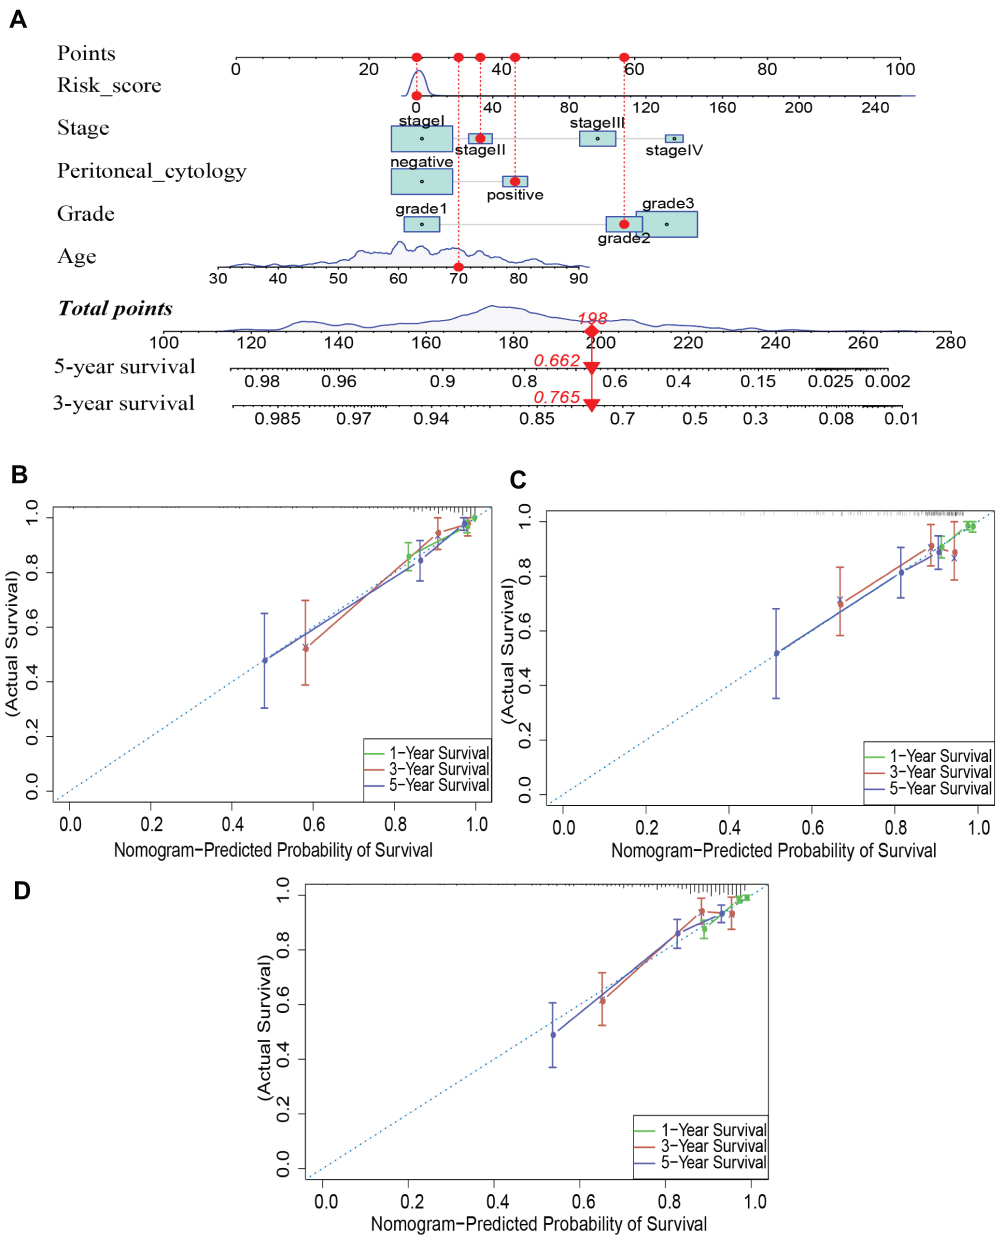 |
Figure 10 A nomogram was built to prognosis 3-, 5-year overall survival of EC patients by integrating clinical independent prognostic factors. (A) Nomogram for prognosing the 3-year and 5-year overall survival in EC patients. (B–D) Calibration curve for the prediction of 1-year, 3-year and 5-year survival in EC patients. |
Comparison of Variables in the Prognostic Signature with Clinicopathological Features
To further explore the relationship between the nine risk transcription factors and EC, we analyzed the relevance between the nine transcription factors and six clinicopathological factors (stage, grade, LNM, peritoneal cytology, tumor state and survival status). The results showed that high DLX2 expression was apparently correlated with higher grade (P<0.05) (Supplementary Figure S1A). Compared with patients who were alive, HOXB9 was markedly increased in patients who had died (P<0.05) (Supplementary Figure S1B). Compared with patients who were tumor-free or alive, FOXP3 expression was downregulated in patients with tumors or in those who had died (P<0.05) (Supplementary Figure S1C, D). BNC2 expression showed a significant correlation with four clinical factors (stage, grade, LNM, peritoneal cytology) (P<0.05) (Supplementary Figure S1E–H). Notably, E2F1, MSX1 and DLX4 expression was associated with all six clinicopathological factors (P<0.05) (Supplementary Figure S1I–N and Supplementary Figure S2A–L), which indicates that DLX4, MSX1 and E2F1 promote the occurrence and development of EC. One study reported that DLX4 overexpression promotes the proliferation and migration of EC cells.24 MSX1 inhibits the cell cycle of EC cells, while expression of MSX1 improves patient survival.25 E2F1 has been reported to be a potential target in many cancers including ovarian cancer,26 lung cancer,27 and breast cancer.28 However, the function of E2F1 in EC is still unknown. Therefore, we examined the influence of E2F1 on the biological behavior of EC cell lines.
Knockdown of E2F1 Inhibits the Invasiveness and Metastasis of EC Cells
We first verified E2F1 expression in normal and EC tissues using immunohistochemistry data downloaded from the HPA database. We found that compared with normal tissues, E2F1 was significantly increased in EC (Figure 11A). Next, we compared E2F1 expression in four endometrial carcinoma cell lines and found that protein expression of E2F1 was highest in the Ishikawa cell line (Figure 11B). To study the direct effect of E2F1 on EC cells, we used siRNA-E2F1 to knock down E2F1 in Ishikawa cells. RT-PCR was performed to confirm E2F1 silencing by comparison with the corresponding negative control (NC) (Figure 11C). Since si-3 E2F1 exhibited the highest knockdown efficiency at the mRNA level, we selected si-3 E2F1 for subsequent experiments. CCK-8 revealed no obvious effect on EC cell proliferation in response to E2F1 knockdown (Figure 11D). Wound healing and Transwell assays were also performed to investigate the effect of E2F1 on the invasiveness and migration of EC cells. The results revealed that E2F1 knockdown significantly inhibited the invasiveness and migration of EC cells in vitro (Figure 11E–H). These results demonstrated that E2F1 participates in the regulation of EC progression.
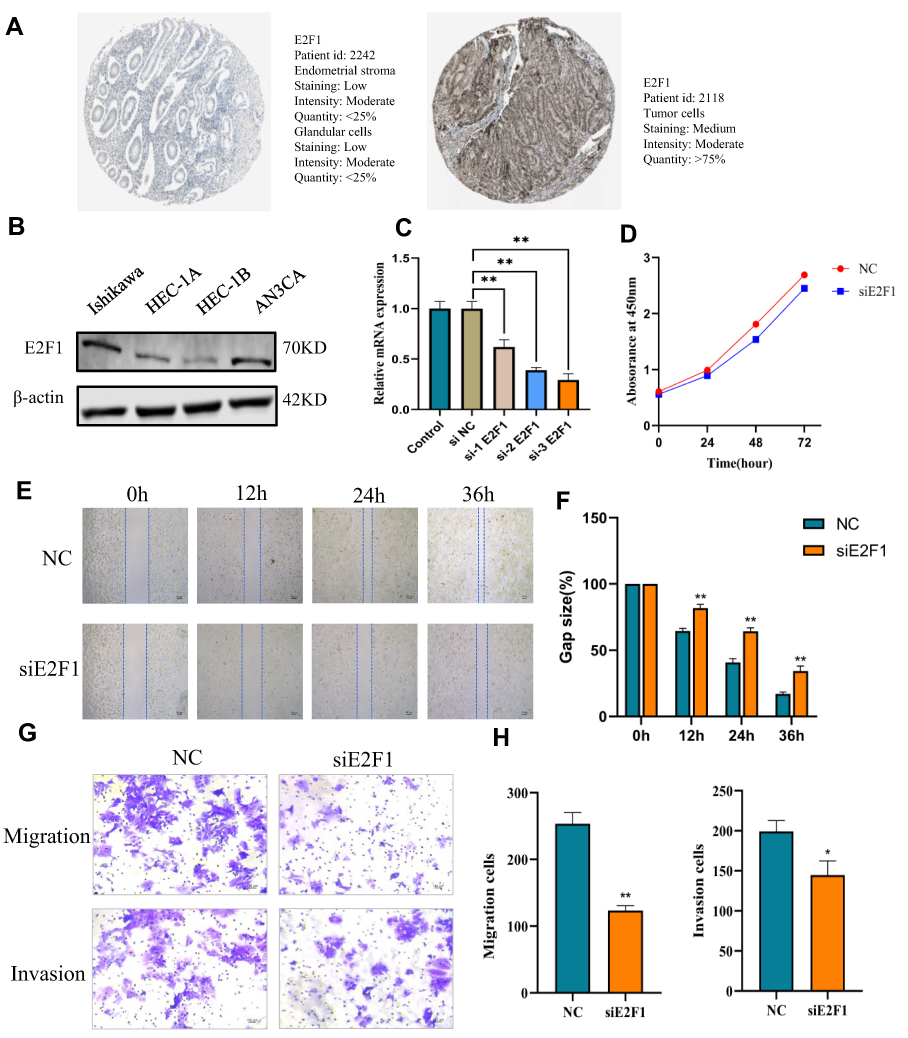 |
Figure 11 Knockdown of E2F1 inhibits invasion and metastasis of EC cells. (A) The expression of E2F1 in normal tissues and endometrial cancer tissues from HPA database. (B) The expression of E2F1 in four endometrial carcinoma cell lines. (C) RT-PCR was conducted to confirm E2F1 silencing by comparison to the corresponding negative control (NC). (D) CCK-8 showed that there was no obvious effect on EC cell proliferation in response to knockdown of E2F1. (E and F) Wound healing was conducted. (G and H) Transwell assays were also performed to detect the invasion and migration of EC.*P < 0.05, **P < 0.01. |
Discussion
Patients with early-stage EC have a good prognosis because of surgery and other comprehensive treatments. However, when endometrial carcinoma progresses to an advanced stage or metastasizes, its prognosis becomes very poor. Many previous studies have shown that the poor prognosis of EC patients is related to high-grade histologic subtypes and late-stage pathology.29 In recent years, studies have found that survival prognosis is different in patients at the same stage, which is closely associated with the heterogeneity of malignant tumors. Extensive research on specific molecular markers has filled a deficiency in that the biological behavior and prognosis of tumors are not entirely explained by pathological characteristics alone. However, due to individual differences among patients, no accurate method has been established for judging the prognosis of patients in clinical practice. Therefore, it is urgent to find more valuable prognostic makers to provide a precise measurement of the prognosis of EC patients. Limited numbers of transcription factors have been revealed to be hyperactivated in a variety of tumors, and they have been considered appropriate therapeutic targets in tumors.8 Recently, many transcription factors were reported to have important relationships with the prognosis of colon carcinoma and breast cancer.30–32 However, research on the prognosis and mechanisms of transcription factors in endometrial carcinoma is still limited. Although several prognostic signatures have been reported to predict the clinical outcome of EC patients, few studies have focused on transcription factor-related prognostic signatures that predict survival outcome in EC. In this study, we first identified nine transcription factors as independent prognostic factors in endometrial carcinoma using public databases, and on the basis of these transcription factors, we constructed a reliable prognostic model to predict the prognosis of EC to aid in accurate clinical decision-making. In addition, we verified the effect of key prognostic transcription factors on the biological functions of EC in vitro, which has provided a basis for the exploration of novel potential therapeutic targets in EC.
In this study, we identified 197 differentially expressed transcription factors between EC and normal tissues based on the TCGA database. Functional pathway analysis revealed that differentially expressed transcription factors were primarily enriched in pattern specification and regionalization, transcription factor complex, nuclear transcription factor complex, DNA-binding transcription activator activity, DNA-binding transcription repressor activity, enhancer binding, transcriptional dysregulation in cancer and signaling pathways regulating pluripotency of stem cells. Previous studies have reported that transcription factors acting as tumor suppressor or tumor promoting factors regulate gene expression by binding DNA, through which they play an essential role in tumorigenesis and the development of various tumors.33,34
Subsequently, using a univariate Cox regression analysis, 29 transcription factors were found to be associated with the overall survival of EC patients. Since other public databases, such as the GEO database, lack information about the prognosis of EC patients, we randomly divided the entire cohort of TCGA patients into training and testing cohorts. Then, using a multivariate Cox regression analysis, we constructed a transcription factor-related prognostic signature based on the training cohort and validated the predictive effect in the testing cohort and the entire cohort. Overall, nine transcription factors (MSX1, HOXB9, E2F1, DLX4, BNC2, DLX2, PDX1, POU3F2, and FOXP3) were included in the prognostic signature.
The important roles of these transcription factors in various cancers have been previously reported. MSX1 belongs to the homeobox family, has been reported to regulate the proliferation and migration of cancer cells and has been proposed to be a biomarker of the early diagnosis of breast cancer.35,36 HOXB9, an HOX family transcription factor, has been reported to be an unfavorable factor for endometrial carcinoma,11 which is consistent with the results of our study. Elevated HOXB9 expression promotes tumor growth and migration through multiple signaling pathways.37 Some studies have indicated that E2F1 may represent a novel prognostic marker and therapeutic target in cancer.27,38 A previous study reported that increased DLX4 expression is relevant to poor prognosis of hepatocellular carcinoma.39 BNC2 was also shown to be associated with the survival of glioblastoma patients.40 DLX2 plays an indispensable role in tumor progression by regulating epithelial to mesenchymal transition (EMT). Yu et al41 confirmed that targeted inhibition of PDX1 expression significantly inhibits the growth of pancreatic ductal adenocarcinoma (PDAC) and prolongs survival time in PDAC mice. High POU3F2 expression may contribute to the enhanced invasiveness and metastasis of cancer cells.42 FOXP3 deletion promotes the occurrence of prostate cancer by promoting c-MYC expression.43 Thus, the transcription factors identified in our study may represent effective approaches for targeted therapy in endometrial carcinoma.
Furthermore, we conducted Kaplan-Meier survival and ROC curve analyses to confirm the validity of the prognostic signature in the training cohort, testing cohort and the entire cohort. Compared with the low-risk group, patients in the high-risk group exhibited significantly worse outcomes. ROC curve results also suggested that the signature displayed good predictability for the 1-, 3- and 5-year survival in all three cohorts. Moreover, we found that the prognostic model was closely associated with clinicopathological features (tumor stage, grade, LNM, peritoneal cytology, tumor status and survival status). Together, these results suggest that our prognostic signature has good prognostic value in EC, and thus, this prognostic signature should be verified in additional independent cohorts.
With further mining and exploration of the function and mechanism of this prognostic signature in EC, we analyzed the GSEA pathway enrichment analysis and constructed a transcription factor-related regulatory network. Interestingly, patients with high-risk scores were primarily correlated with basal transcription factors, cell cycle, DNA replication, EC, insulin signaling pathway, and type II diabetes mellitus, among others. All these pathways have been previously shown to be connected to the occurrence and progression of tumors. Among them, type II diabetes mellitus has been reported to increase the risk of EC.44 Some studies have reported that insulin directly promotes proliferation and migration of EC cells,45 which is consistent with our study. Then, we constructed a transcription factor-related regulatory network that includes nine transcription factors and 96 target genes and that provides the basis for further studies of the regulatory mechanism of hub transcription factors in EC.
Most importantly, univariate and multivariate Cox regression analyses clarified that the prognostic signature was an independent prognostic factor for patient outcomes. In addition, another four clinical features (age, grade stage, and peritoneal cytology) were also independent prognostic determinants. The area under the curve for the ROC curve of the prognostic signature was greater than for other clinical features in terms of the 1-, 3- and 5-year outcomes, which suggests excellent performance of this model. To investigate whether this prognostic signature was independent of these four independent clinical factors, we further classified patients into groups of patients ≤ 55 years of age and > 55 years of age as well as early-stage (stage I), advanced-stage (stage II~IV), low-grade (grade 1~2), high-grade (grade 3), peritoneal cytology-negative and peritoneal cytology-positive groups. Our data suggest that the prognostic value of this model was independent of the other four independent clinical factors. Nomograms can be used to diagnose or predict the occurrence or progression of diseases. Since nomograms visually display the prognostic results, they have been widely used to predict the survival and prognosis of patients with tumors.46,47 Subsequently, a nomogram was constructed based on the transcription factor-related prognostic signature and the other four independent clinical features to help clinicians predict 3- and 5-year overall survival rates of individual EC patients. The calibration curve showed that the predicted risk was consistent with the actual risk. These results suggest that the predicted survival was in good agreement with the actual survival. Therefore, all the above results indicate that the prognostic signature has good predictive ability and that the nomogram provides clinicians with a more accurate and practical prediction tool, which is conducive for the personalized and accurate assessment of survival and prognosis in EC patients.
One transcription factor mediates multiple signal transduction pathways, which provides a good basis for the research of targeted gene therapy for tumor metastasis.48 Individual transcription factors also interact with each other. One study reported that the E2F1-HOXB9 axis is representative of the importance of regulating tumor progression.49 E2F1 and HOXB9 were found to be important prognostic factors in our study. To further explore the relationship between the transcription factors in the prognostic signature and endometrial carcinoma, we compared variables in the prognostic signature with clinicopathological features. The expression levels of E2F1, MXS1 and DLX4 were significantly correlated with all six clinicopathological features (stage, grade, LNM, peritoneal cytology, tumor state and survival status). Therefore, these three transcription factors may be involved in the progression of EC. The roles of MSX1 and DLX4 in EC have been reported in other studies, the results of which are consistent with our findings.24,25 E2F1 has been reported to be an oncogene involved in the progression of various cancers, and thus, it is associated with a poor prognosis.50 However, the influence of E2F1 on the progression of endometrial carcinoma remains unclear. Therefore, we further explored the molecular function of E2F1 in EC Ishikawa cells. Our results indicated that the expression of E2F1 was dramatically increased in EC tissues and that silencing the expression of E2F1 inhibited migration and invasiveness in EC. Therefore, E2F1 might represent a novel therapeutic target for the treatment of EC patients, and further investigation is needed.
As far as we know, the nine transcription factor-related prognostic model in EC has not been previously published, and it can guide clinicians in determining the prognosis of EC patients. Some limitations of this study should also be addressed in the future. First, although the effect of the prognostic signature was verified in internal data in the TCGA, it also needs to be tested in additional independent large-scale clinical cohorts. Second, to better understand and evaluate the biological effects of this prognostic signature in EC, further in vitro and in vivo functional experimental verification is needed. Finally, more efforts are required to explore the actual mechanism of E2F1 in EC and to determine whether E2F1 is an effective target in EC.
Conclusions
In conclusion, this study identified and validated a novel nine-transcription factor-related prognostic signature in EC patients, which accurately predicts prognosis in these EC patients. In addition, we constructed a nomogram with high predictive accuracy by integrating the prognostic signature and clinical independent prognostic factors to predict the 3-year and 5-year survival of EC patients. Further, we verified the biological function of E2F1 on the invasiveness and metastasis of endometrial carcinoma cells in vitro. Briefly, our study provides potential prognostic biomarkers and therapeutic targets for EC.
Acknowledgments
Our study was supported by Natural Science Foundation of Beijing (No. 7202213), The National Natural Science Foundation of China (No. 82072861, 81874108 and 81672571) and National Key Technology R&D Program of China (No. 2019YFC1005200 and 2019YFC1005201).
Disclosure
The authors declare no conflicts of interest.
References
1. Bray F, Ferlay J, Soerjomataram I, et al. Global cancer statistics 2018: GLOBOCAN estimates of incidence and mortality worldwide for 36 cancers in 185 countries. CA Cancer J Clin. 2018;68(6):394–424. doi:10.3322/caac.21492
2. Siegel RL, Miller KD, Jemal A. Cancer statistics, 2020. CA Cancer J Clin. 2020;70(1):7–30. doi:10.3322/caac.21590
3. Siegel RL, Miller KD, Jemal A. Cancer statistics, 2017. CA Cancer J Clin. 2017;67(1):7–30. doi:10.3322/caac.21387
4. Gottwald L, Pluta P, Piekarski J, et al. Long-term survival of endometrioid endometrial cancer patients. Arch Med Sci. 2010;6(6):937–944. doi:10.5114/aoms.2010.19305
5. Tejerizo-Garcia A, Jimenez-Lopez JS, Munoz-Gonzalez JL, et al. Overall survival and disease-free survival in endometrial cancer: prognostic factors in 276 patients. Onco Targets Ther. 2013;9:1305–1313. doi:10.2147/OTT.S51532
6. Thornton JG, Ali S, O’Donovan P, et al. Flow cytometric studies of ploidy and proliferative indices in the Yorkshire trial of adjuvant progestogen treatment of endometrial cancer. Br J Obstet Gynaecol. 1993;100(3):253–261. doi:10.1111/j.1471-0528.1993.tb15239.x
7. Lambert SA, Jolma A, Campitelli LF, et al. The human transcription factors. Cell. 2018;172(4):650–665. doi:10.1016/j.cell.2018.01.029
8. Bushweller JH. Targeting transcription factors in cancer - from undruggable to reality. Nat Rev Cancer. 2019;19(11):611–624. doi:10.1038/s41568-019-0196-7
9. Ding L, Ding Y, Kong X, et al. Dysregulation of Kruppel-like factor 12 in the development of endometrial cancer. Gynecol Oncol. 2019;152(1):177–184.
10. Pedrola N, Devis L, Llaurado M, et al. Nidogen 1 and nuclear protein 1: novel targets of ETV5 transcription factor involved in endometrial cancer invasion. Clin Exp Metastasis. 2015;32(5):467–478. doi:10.1007/s10585-015-9720-7
11. Wan J, Liu H, Feng Q, et al. HOXB9 promotes endometrial cancer progression by targeting E2F3. Cell Death Dis. 2018;9(5):509. doi:10.1038/s41419-018-0556-3
12. Xiao YY, Lin L, Li YH, et al. ZEB1 promotes invasion and metastasis of endometrial cancer by interacting with HDGF and inducing its transcription. Am J Cancer Res. 2019;9(11):2314–2330.
13. Darnell JE
14. Ding H, Fan GL, Yi YX, et al. Prognostic implications of Immune-Related Genes’ (IRGs) signature models in cervical cancer and endometrial cancer. Front Genet. 2020;11:725. doi:10.3389/fgene.2020.00725
15. Wang ZH, Zhang YZ, Wang YS, et al. Identification of novel cell glycolysis related gene signature predicting survival in patients with endometrial cancer. Cancer Cell Int. 2019;19(1):296. doi:10.1186/s12935-019-1001-0
16. Song Y, Chen QT, He -Q-Q. Identification of key transcription factors in endometrial cancer by systems bioinformatics analysis. J Cell Biochem. 2019;120(9):15443–15454. doi:10.1002/jcb.28811
17. Yu G, Wang LG, Han Y, et al. ClusterProfiler: an R package for comparing biological themes among gene clusters. OMICS. 2012;16(5):284–287. doi:10.1089/omi.2011.0118
18. Chai RC, Wu F, Wang QX, et al. m(6)A RNA methylation regulators contribute to malignant progression and have clinical prognostic impact in gliomas. Aging (Albany NY). 2019;11(4):1204–1225. doi:10.18632/aging.101829
19. Tang LQ, Li CF, Li J, et al. Establishment and validation of prognostic nomograms for endemic nasopharyngeal carcinoma. J Natl Cancer Inst. 2016;108(1):djv291. doi:10.1093/jnci/djv291
20. Subramanian A, Tamayo P, Mootha VK, et al. Gene set enrichment analysis: a knowledge-based approach for interpreting genome-wide expression profiles. Proc Natl Acad Sci U S A. 2005;102(43):15545–15550. doi:10.1073/pnas.0506580102
21. Shannon P, Markiel A, Ozier O, et al. Cytoscape: a software environment for integrated models of biomolecular interaction networks. Genome Res. 2003;13(11):2498–2504. doi:10.1101/gr.1239303
22. Hao J, Bao X, Jin B, et al. Ca2+ channel subunit alpha 1D promotes proliferation and migration of endometrial cancer cells mediated by 17beta-estradiol via the G protein-coupled estrogen receptor. FASEB J. 2015;29(7):2883–2893. doi:10.1096/fj.14-265603
23. Hong F, Zhang Y, Cheng W, et al. Beta-arrestin-2 up-regulates toll-like receptor 2 signaling and inhibits apoptosis in human endometrial cancer heterotransplants in nude mice. BMC Cancer. 2019;19(1):1035. doi:10.1186/s12885-019-6254-4
24. Zhang L, Wan Y, Jiang Y, et al. Overexpression of BP1, an isoform of Homeobox Gene DLX4, promotes cell proliferation, migration and predicts poor prognosis in endometrial cancer. Gene. 2019;707:216–223. doi:10.1016/j.gene.2019.05.028
25. Eppich S, Kuhn C, Schmoeckel E, et al. MSX1-A potential marker for uterus-preserving therapy of endometrial carcinomas. Int J Mol Sci. 2020;21(12):12. doi:10.3390/ijms21124529
26. Farra R, Dapas B, Grassi M, et al. E2F1 as a molecular drug target in ovarian cancer. Expert Opin Ther Targets. 2019;23(3):161–164. doi:10.1080/14728222.2019.1579797
27. Wang T, Chen X, Qiao W, et al. Transcription factor E2F1 promotes EMT by regulating ZEB2 in small cell lung cancer. BMC Cancer. 2017;17(1):719. doi:10.1186/s12885-017-3701-y
28. Xiong Z, Ye L, Zhenyu H, et al. ANP32E induces tumorigenesis of triple-negative breast cancer cells by upregulating E2F1. Mol Oncol. 2018;12(6):896–912. doi:10.1002/1878-0261.12202
29. Amant F, Moerman P, Neven P, et al. Endometrial cancer. Lancet. 2005;366(9484):491–505. doi:10.1016/S0140-6736(05)67063-8
30. Liu Q, Wu J, Lu T, et al. Positive expression of basic transcription factor 3 predicts poor survival of colorectal cancer patients: possible mechanisms involved. Cell Death Dis. 2019;10(7):509. doi:10.1038/s41419-019-1747-2
31. Liu J, Dong C, Jiang G, et al. Transcription factor expression as a predictor of colon cancer prognosis: a machine learning practice. BMC Med Genomics. 2020;13(Suppl 9):135. doi:10.1186/s12920-020-00775-0
32. Chen H, Ma X, Yang M, et al. Transcription factor profiling to predict recurrence-free survival in breast cancer: development and validation of a nomogram to optimize clinical management. Front Genet. 2020;11:333. doi:10.3389/fgene.2020.00333
33. Lee TI, Young RA. Transcriptional regulation and its misregulation in disease. Cell. 2013;152(6):1237–1251. doi:10.1016/j.cell.2013.02.014
34. Bhagwat AS, Vakoc CR. Targeting transcription factors in cancer. Trends Cancer. 2015;1(1):53–65. doi:10.1016/j.trecan.2015.07.001
35. Yue Y, Zhou K, Li J, et al. MSX1 induces G0/G1 arrest and apoptosis by suppressing notch signaling and is frequently methylated in cervical cancer. Onco Targets Ther. 2018;11:4769–4780. doi:10.2147/OTT.S165144
36. Yue Y, Yuan Y, Li L, et al. Homeobox protein MSX1 inhibits the growth and metastasis of breast cancer cells and is frequently silenced by promoter methylation. Int J Mol Med. 2018;41(5):2986–2996. doi:10.3892/ijmm.2018.3468
37. Zhang L, Wu Q, He C, et al. HOXB9 inhibits proliferation in gastric carcinoma cells via suppression of phosphorylated-Akt and NF-kappaB-dependent Snail expression. Dig Liver Dis. 2019;51(1):157–165. doi:10.1016/j.dld.2018.08.018
38. Xu TP, Wang YF, Xiong WL, et al. E2F1 induces TINCR transcriptional activity and accelerates gastric cancer progression via activation of TINCR/STAU1/CDKN2B signaling axis. Cell Death Dis. 2017;8(6):e2837. doi:10.1038/cddis.2017.205
39. Gao Y, Li Z, Guo X, et al. DLX4 as a prognostic marker for hepatocellular carcinoma. Neoplasma. 2014;61(3):318–323. doi:10.4149/neo_2014_041
40. Wang Z, Tang W, Yuan J, et al. Integrated analysis of RNA-binding proteins in glioma. Cancers (Basel). 2020;12(4).
41. Yu J, Liu SH, Sanchez R, et al. PDX1 associated therapy in translational medicine. Ann Transl Med. 2016;4(11):214. doi:10.21037/atm.2016.03.51
42. Kobi D, Steunou AL, Dembele D, et al. Genome-wide analysis of POU3F2/BRN2 promoter occupancy in human melanoma cells reveals Kitl as a novel regulated target gene. Pigment Cell Melanoma Res. 2010;23(3):404–418. doi:10.1111/j.1755-148X.2010.00697.x
43. Wu L, Yi B, Wei S, et al. Loss of FOXP3 and TSC1 accelerates prostate cancer progression through synergistic transcriptional and posttranslational regulation of c-MYC. Cancer Res. 2019;79(7):1413–1425. doi:10.1158/0008-5472.CAN-18-2049
44. Kim S, Park J, Chen Y, et al. Long-term diabetes risk among endometrial cancer survivors in a population-based cohort study. Gynecol Oncol. 2020;156(1):185–193. doi:10.1016/j.ygyno.2019.10.015
45. Mu N, Zhu Y, Wang Y, et al. Insulin resistance: a significant risk factor of endometrial cancer. Gynecol Oncol. 2012;125(3):751–757. doi:10.1016/j.ygyno.2012.03.032
46. Yang Y, Qu A, Wu Q, et al. Prognostic value of a hypoxia-related microRNA signature in patients with colorectal cancer. Aging (Albany NY). 2020;12(1):35–52. doi:10.18632/aging.102228
47. Lai J, Chen B, Mok H, et al. Comprehensive analysis of autophagy-related prognostic genes in breast cancer. J Cell Mol Med. 2020.
48. Lambert M, Jambon S, Depauw S, et al. Targeting transcription factors for cancer treatment. Molecules. 2018;23(6):1479. doi:10.3390/molecules23061479
49. Zhussupova A, Hayashida T, Takahashi M, et al. An E2F1-HOXB9 transcriptional circuit is associated with breast cancer progression. PLoS One. 2014;9(8):e105285. doi:10.1371/journal.pone.0105285
50. Lee SR, Roh YG, Kim SK, et al. Activation of EZH2 and SUZ12 regulated by E2F1 predicts the disease progression and aggressive characteristics of bladder cancer. Clin Cancer Res. 2015;21(23):5391–5403. doi:10.1158/1078-0432.CCR-14-2680
 © 2021 The Author(s). This work is published and licensed by Dove Medical Press Limited. The full terms of this license are available at https://www.dovepress.com/terms.php and incorporate the Creative Commons Attribution - Non Commercial (unported, v3.0) License.
By accessing the work you hereby accept the Terms. Non-commercial uses of the work are permitted without any further permission from Dove Medical Press Limited, provided the work is properly attributed. For permission for commercial use of this work, please see paragraphs 4.2 and 5 of our Terms.
© 2021 The Author(s). This work is published and licensed by Dove Medical Press Limited. The full terms of this license are available at https://www.dovepress.com/terms.php and incorporate the Creative Commons Attribution - Non Commercial (unported, v3.0) License.
By accessing the work you hereby accept the Terms. Non-commercial uses of the work are permitted without any further permission from Dove Medical Press Limited, provided the work is properly attributed. For permission for commercial use of this work, please see paragraphs 4.2 and 5 of our Terms.