")
Back to Journals » International Journal of General Medicine » Volume 14
A Novel Prognostic and Predictive Signature for Lung Adenocarcinoma Derived from Combined Hypoxia and Infiltrating Immune Cell-Related Genes in TCGA Patients
Authors Wu X, Zhu J, Liu W, Jin M, Xiong M, Hu K
Received 21 October 2021
Accepted for publication 20 December 2021
Published 30 December 2021 Volume 2021:14 Pages 10467—10481
DOI https://doi.org/10.2147/IJGM.S342107
Checked for plagiarism Yes
Review by Single anonymous peer review
Peer reviewer comments 2
Editor who approved publication: Dr Scott Fraser
Xiaofeng Wu,1,* Jing Zhu,2,* Wei Liu,1 Meng Jin,1 Mengqing Xiong,1 Ke Hu1
1Department of Respiratory and Critical Care Medicine, Renmin Hospital of Wuhan University, Wuhan, Hubei Province, People’s Republic of China; 2Department of Respiratory and Critical Care Medicine, The Central Hospital of Wuhan, Tongji Medical College, Huazhong University of Science and Technology, Wuhan, Hubei Province, People’s Republic of China
*These authors contributed equally to this work
Correspondence: Ke Hu Tel +86 18971035988
Email [email protected]
Background: The hypoxia and immune status of the lung adenocarcinoma (LUAD) microenvironment appear to have combined impacts on prognosis. Therefore, deriving a prognostic signature by integrating hypoxia- and immune infiltrating cell-related genes (H&IICRGs) may add value over prognostic indices derived from genes driving either process alone.
Methods: Differentially expressed H&IICRGs (DE-H&IICRGs) were identified in The Cancer Genome Atlas transcriptomic data using limma, CIBERSORT, weighted gene co-expression network analysis, and intersection analysis. A stepwise Cox regression model was constructed to identify prognostic genes and to produce a gene signature based on DE-H&IICRGs. The potential biological functions associated with the gene signature were explored using functional enrichment analysis. The prognostic signature was externally validated in a separate cohort from the Gene Expression Omnibus database.
Results: Five prognostic genes associated with overall survival in LUAD were used in the DE-H&IICRG-based prognostic signature. Patients in the high-risk group had an inferior prognosis, which was validated in an independent external cohort, and had lower expression of most immune checkpoint genes. In multivariate analysis, only risk score and T stage were independent prognostic factors. Differentially expressed genes (DEGs) associated with the risk score were enriched for pathways related to cell cycle, hypoxia regulation, and immune response. TIDE analyses showed that low-risk LUAD patients might also respond better to immunotherapy.
Conclusion: This study establishes and validates a prognostic profile for LUAD patients that combines hypoxia and immune infiltrating cell-related genes. This signature may have clinical application both for prognostication and guiding individualized immunotherapy.
Keywords: lung adenocarcinoma, LUAD, hypoxia, immune status, prognosis, immunotherapy
Introduction
Lung cancer remains a leading cause of death and is divided into two main histological subtypes: small-cell lung carcinoma (SCLC; ~15% of all cases) and non-small-cell lung carcinoma (NSCLC; ~85% of all cases).1,2 Two-thirds of NSCLC patients are diagnosed with lung adenocarcinoma (LUAD), which is usually peripheral, arises from the bronchial mucosa epithelium, and is frequently aggressive and metastatic.3,4 The five-year overall survival rate for LUAD is 19%5 and only 5% in the 57% of patients presenting with metastatic disease at diagnosis.6 Accurate prognostication and effective treatment for LUAD patients are prerequisites for improving outcomes and reducing mortality, which remain a huge clinical challenge.7,8
Hypoxia is characteristic of the tumor microenvironment (TME) in most solid tumors, including LUAD, and it is an established negative prognostic factor in cancer patients.9 Hypoxia contributes to decreased penetration of chemotherapeutics and intrinsic radiation resistance, drastically limiting treatment efficacy.10 Hypoxia rapidly triggers hypoxia-responsive gene expression programs in tumor cells, which in turn facilitate tumor survival and progression through their effects on cellular proliferation, apoptosis, angiogenesis, cell adhesion molecule expression, and the secretion of matrix metalloproteinases.11 Hypoxia-related genes (XPNPEP1, ANGPTL4, SLC2A1, and PFKP) have been shown to be associated with prognosis in LUAD patients, as has the infiltration of CD4+ memory T cells and M0 macrophages into the TME of LUADs.12 Indeed, there is significant crossover between these processes: hypoxia and hypoxia-responsive genes play important roles in several immune cell types (lymphocytes, myeloid cells, neutrophils, and dendritic cells) and their corresponding immune functions.13 This is important, since the tumor immune microenvironment is another critical determinant of tumor progression and clinical outcomes.14 Cancer is therefore a highly complex disease involving multiple hypoxia-immune system interactions within the tumor and systemically,15 so targeting hypoxia in combination with immunotherapy could significantly improve outcomes for LUAD patients.
Although the prognostic value of immune- genes and hypoxia-associated genes has been widely studied in LUAD, their combined prognostic value has yet to be evaluated.16–18 Therefore, based on differential gene expression analysis, weighted gene co-expression network analysis (WGCNA), and Cox regression analyses, we constructed an integrated hypoxia- and immune-related prognostic signature for LUAD, validated its effectiveness and generalizability, and analyzed the expression of immune checkpoint molecules and predictive value for immunotherapy. In doing so, we provide new insights into LUAD pathobiology, prognostic biomarkers, and stratification strategies for immunotherapy.
Materials and Methods
Data Sources
LUAD-related data were obtained from The Cancer Genome Atlas (TCGA) and Gene Expression Omnibus (GEO) databases. TCGA LUAD transcriptomic data contained 59 normal samples and 513 tumor samples, while the GSE68465 dataset consisted of 19 normal samples and 443 tumor samples. 200 hypoxia-related genes were obtained using the HALLMARK HYPOXIA standard from the MSigDB database (Supplementary Table 1).
Identification of DEGs
The limma package in R software was used for differential gene analysis. The screening criteria for identifying differentially-expressed genes (DEGs) between normal and tumor samples (normal vs tumor) in the TCGA database were |log2-fold change (FD)| > 1 and modified P (adj. P) < 0.05. When identifying DEGs between low- and high-risk groups (low-risk vs high-risk), genes with |log2-FD| > 1.2 and P < 0.05 were considered risk-associated DEGs. Using Venn diagram (intersection) analysis, genes that were both LUAD-associated DEGs and hypoxia-related genes (HRGs) were regarded as DE-HRGs in subsequent analyses.
Estimating the Fraction of Immune Cell Types
The CIBERSORT algorithm was applied to quantify the proportions of 22 immune cell types in each sample. CIBERSORT uses Monte Carlo sampling to derive a P-value for the inverse convolution of every sample, and only samples with a P-value < 0.05 were deemed to be accurate immune cell fractions inferred by CIBERSORT, ie, only patients with CIBERSORT P-values < 0.05 were deemed suitable for further analysis.19 Accordingly, 498 cases (normal:tumor = 56:442) satisfied the above criteria and were included in follow-up analyses. The sum of the 22 immune cell scores in each sample was 1.20 Of note, as gamma/delta T cells were not detected in any sample, they were excluded, leaving 21 immune cell types in further analyses.
Co-Expression Network Construction
The gene expression profiles of 498 samples from the TCGA database were extracted using the R package WGCNA to establish a co-expression network in different immune cells. Based on sample cluster analysis, two outlier samples were identified (Supplementary Figure 1A), so follow-up analyses were performed on the remaining 496 cases. A heatmap of the sample trait distribution is shown in Supplementary Figure 1B. The optimal soft threshold was determined to be infinitely close to the scale-free network. We also segmented the module using the dynamic cut-tree algorithm with the minModuleSize parameter set to 100. Correlations between modules and traits were calculated, and modules significantly correlated with each trait were selected as hub modules, with the genes in this module regarded as hub genes (IICRGs) in further analyses.
Construction, Evaluation, and Validation of the Prognostic Gene Signature
Genes identified as both DE-HRGs and IICRGs were first obtained by intersection analysis, and their expression changes in normal and tumor samples were verified in the GSE68465 dataset. Genes that satisfied the condition of |log2 FD| > 1 and adj. P < 0.05 were regarded as DE-H&IICRGs in prognostic gene screening.
The TCGA-LUAD and GSE68465 datasets served as the training and validation sets, respectively. Initially, the DE-H&IICRGs associated with overall survival (OS) were identified in the training set using univariate Cox regression analysis (P < 0.05). Subsequently, optimal prognostic genes were identified using a multivariate Cox regression model incorporating the step function. Risk scores for each sample in each dataset were calculated based on regression coefficients for prognostic genes and their expression using the following formula:

where h0 (t) represents the baseline risk function; X represents the gene; and β refers to the regression parameters. Cases were classified into high- and low-risk groups based on the median risk scores in each dataset. Risk scores and grouping information for patients in the training and validation sets are presented in Supplementary Tables 2 and 3, respectively. Kaplan-Meier (K-M) curves were used to compare differences in OS between the two groups. The prognostic capability of the gene signature was assessed using receiver operating characteristic (ROC) curves, with a similar exploration performed in the validation set.
Construction of a Nomogram Based on Independent Prognostic Factors
Univariate and multivariate Cox explorations were performed using seven clinicopathological parameters (age, gender, T phase, N phase, M phase, phase, and smoking history) and risk score. Variables with a P < 0.05 were regarded as independent prognostic factors in multivariate Cox analysis. A nomogram was then developed in the rms R package based on the identified independent prognostic factors predicting survival outcomes of LUAD patients at 1, 3, and 5 years. Evaluation of the predictive precision of the nomogram was performed by calibration curve analysis.
Functional Enrichment Exploration
Gene ontology (GO) and Kyoto Encyclopedia of Genes and Genomes (KEGG) enrichment analyses were performed on risk score-associated DEGs using the ClusterProfiler package. GO analyses included three categories: biological process (BP), cellular composition (CC), and molecular function (MF), and KEGG was used to reveal the pathways involved by these genes. A P < 0.05 was considered a significant term or pathway.
Estimation of Responses to Immune Checkpoint Inhibitors (ICIs)
The Tumor Immune Dysfunction and Exclusion (TIDE) algorithm, designed by Liu et al, was used to predict responses to ICI therapy (anti-PD-1 and CTLA-4 therapies).21 ICI responses were assessed using the TIDE algorithm in the high and low risk groups, and outcomes were measured using the TIDE score. According to the default settings, patients with a TIDE score < 0 were defined as responders (positive sensitivity to immunotherapy), while patients with a TIDE score > 0 were defined as non-responders (negative sensitivity to immunotherapy). Moreover, Pearson correlation analysis was performed to explore correlations between the constructed prognostic signature (risk scores) and TIDE scores.
Statistical Analysis
Heatmaps, box plots, and ROC curves were plotted with the pheatmap, ggplot2, and survivalROC packages in R, respectively. K-M survival differences between groups were assessed by the Log rank test. Distributions of risk scores across different clinicopathological features were compared using the Wilcoxon or Kruskal–Wallis approaches. All statistical analyses were performed in R. Unless otherwise stated, a P-value < 0.05 was deemed statistically significant.
Results
Identification of DE-HRGs in LUAD
We evaluated 1729 DEGs in 59 normal and 513 LUAD samples extracted from the TCGA database, and 999 were upregulated and 730 downregulated in LUAD tissues (Figure 1A; Supplementary Table 4). The expression patterns of the top 100 (top 50 upregulated and top 50 downregulated) DEGs between the two groups are shown in the heatmap in Figure 1B. To obtain DE-HRGs associated with LUAD, we intersected the DEGs and 200 HRGs obtained from the MSigDB database, yielding 44 differentially expressed HRGs (Figures 1C; 24 upregulated in LUAD and 20 downregulated; Supplementary Table 5).
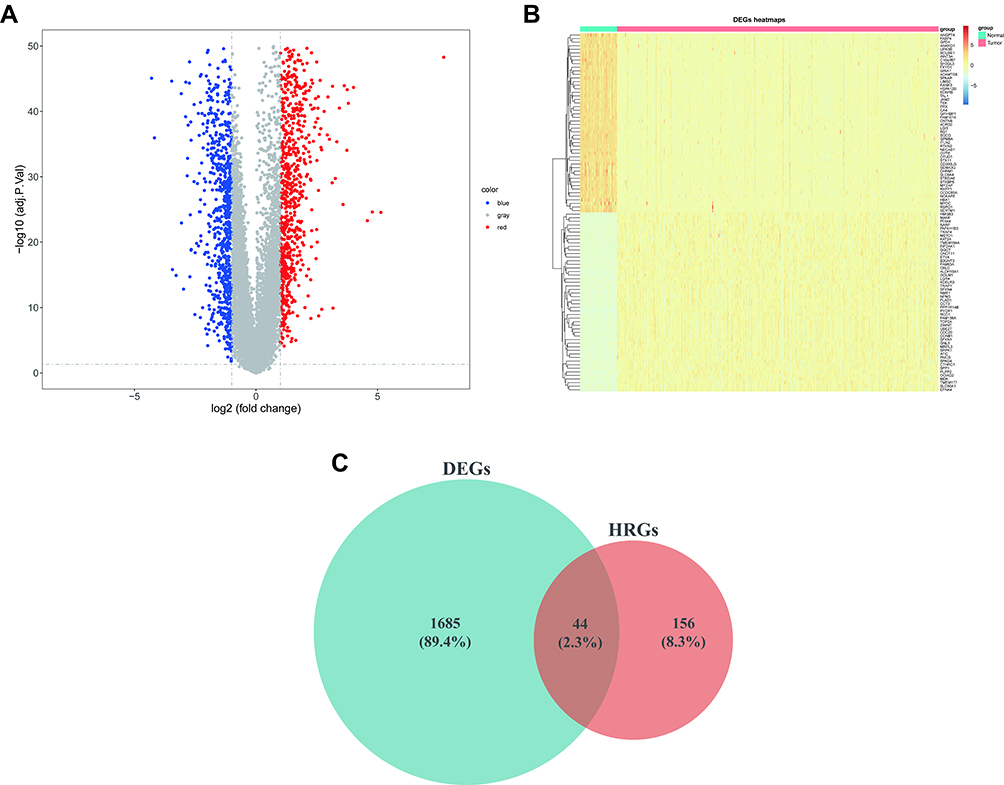 |
Figure 1 44 DE-HRGs (including 24 upregulated and 20 downregulated genes) from TCGA-LUAD. (A) Volcano plot of 1729 DEGs in TCGA. Red, upregulated; blue, downregulated; gray, unaltered expression. (B) Clustered heatmap of the expression patterns for 1729 DEGs in the TCGA database. Red: upregulated; blue: downregulated. (C) Venn plot to identify the overlapping DEGs and HRGs. Abbreviations: DE-HRGs, differentially-expressed hypoxia-related genes; TCGA, The Cancer Genome Atlas; LUAD, lung adenocarcinoma; DEGs, differentially-expressed genes. |
Identification of Immune Infiltrating Cell-Related Genes by WGCNA
The estimated proportions of the 21 identified immune cell types in the TCGA LUAD cohort are shown in Figure 2A. Comparing 56 normal samples and 442 LUAD samples, 18 immune cell types (naive B cells, memory B cells, plasma cells, activated CD4 memory T cells, resting CD4 memory T cells, follicular helper T cells, gamma-delta T cells, regulatory T cells (Tregs), resting NK cells, monocytes, M1 macrophages, M0 macrophages, M2 macrophages, activated dendritic cells, resting mast cells, resting dendritic cells, eosinophils, and neutrophils) showed significant distribution differences. The fractions of these 18 immune cell types were then selected as trait data for WGCNA. Intending to develop a scale-free network, we elected β = 9 (scale-free R2 = 0.98) as the soft threshold power (Figure 2B and C). Nine modules were derived through the construction of hierarchical clustering trees with the dynamic cut-tree algorithm (Figure 2D). Within these nine modules, the MEblue module showed a robust and statistically significant correlation with the majority of differentially distributed immune cell types (Figure 2E), for instance positive correlations with monocytes (Cor = 0.41, P = 7e-22), eosinophils (Cor = 0.41, P = 5e-21), and resting NK cells (Cor = 0.4, P = 3e-20) and negative correlations with follicular helper T cells (Cor = −0.37, P = 1e-17), Tregs (Cor = −0.37, P = 2e-17), and plasma cells (Cor = −0.33, P = 3e-14). Thus, the MEblue module was deemed to be the hub module and, logically, the 2808 genes in this module were assumed to be hub genes (Supplementary Table 6), which we define here as IICRGs and include in subsequent analyses.
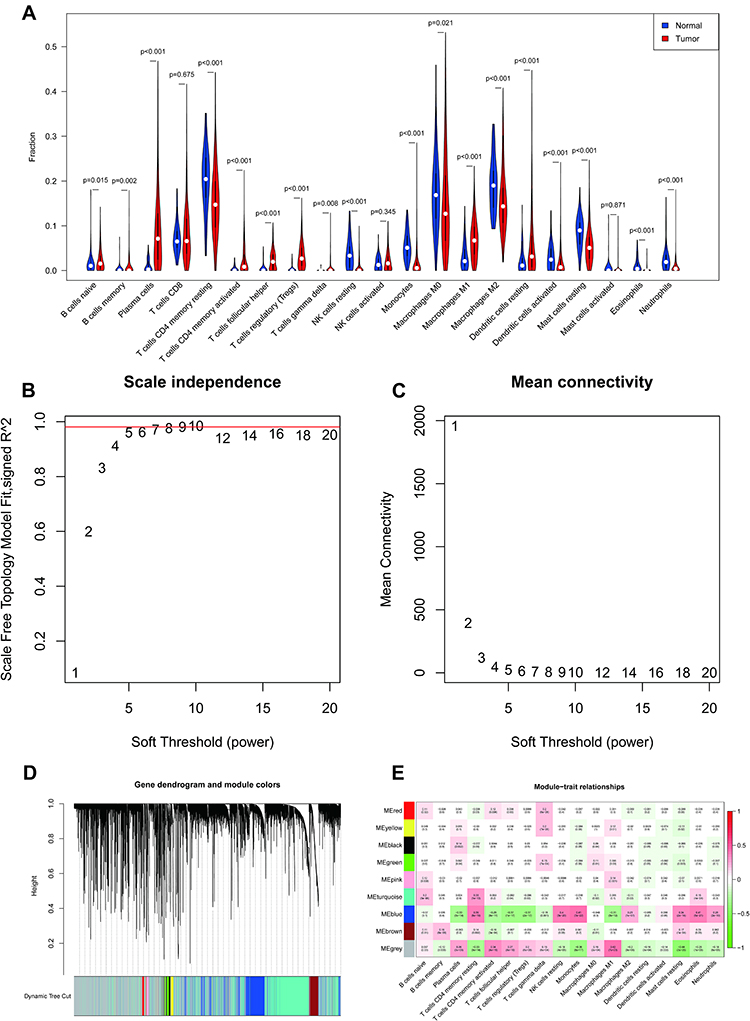 |
Figure 2 Identification of IRGs by CIBERSORT and WGCNA. (A) Violin plot of 21 immune cells present in normal and LUAD samples from TCGA. (B) Scale-free fit index analysis of the 1–20 soft threshold power (β). (C) Average connectivity of the 1–20 soft threshold power. (D) Genes are grouped into modules by hierarchical clustering, with different colors representing different modules. (E). Heatmap showing correlations of eigengene modules with 18 immune cells. Abbreviations: IRGs, immune-related genes; WGCNA, weighted gene co-expression network analysis; LUAD, lung adenocarcinoma; TCGA, The Cancer Genome Atlas. |
Derivation of a Prognostic Signature Based on H&IICRGs
Due to the prominent roles of both hypoxia and immunity in LUAD, 30 genes were identified in a Venn diagram as both DE-HRGs and IICRGs, which we call H&IICRGs (Figure 3A; Supplementary Table 7). A network graph of the interactions between these 30 H&IICRGs is shown in Supplementary Figure 2. Twenty-five of the 30 H&IICRGs were abnormally expressed between normal and LUAD samples in the GSE68465 dataset (Figure 3B), consistent with their expression in TCGA database samples and so denoted DE-H&IIRGs for deriving a prognostic gene signature. Based on the 30 H&IIRGs, univariate Cox regression analysis identified 13 genes significantly associated with OS in TCGA-LUAD patients (P < 0.05; Supplemental Table 8). These genes were then incorporated into a stepwise multivariate Cox regression analysis and the regression coefficients calculated (see Table 1). Ultimately, FBP1, LDHA, MAFF, PDGFB, and GPC3 were characterized as the optimal variables for constructing a prognostic gene signature (Figure 3C).
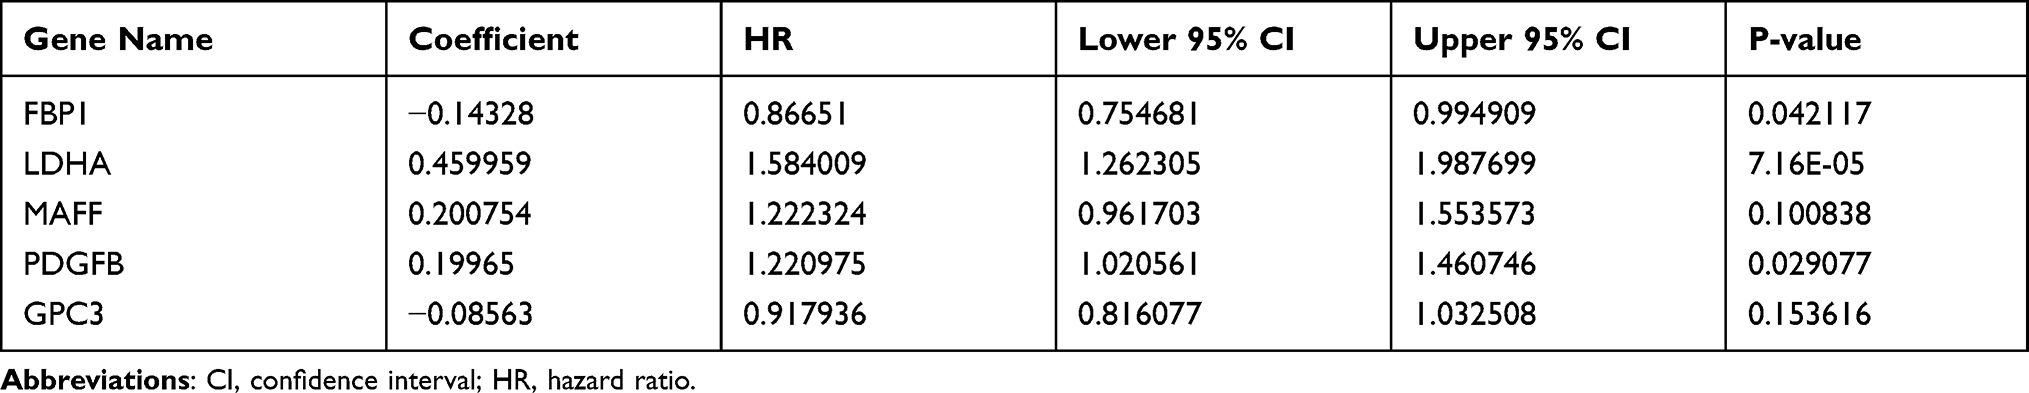 |
Table 1 Multivariate Cox Regression Analysis in LUAD |
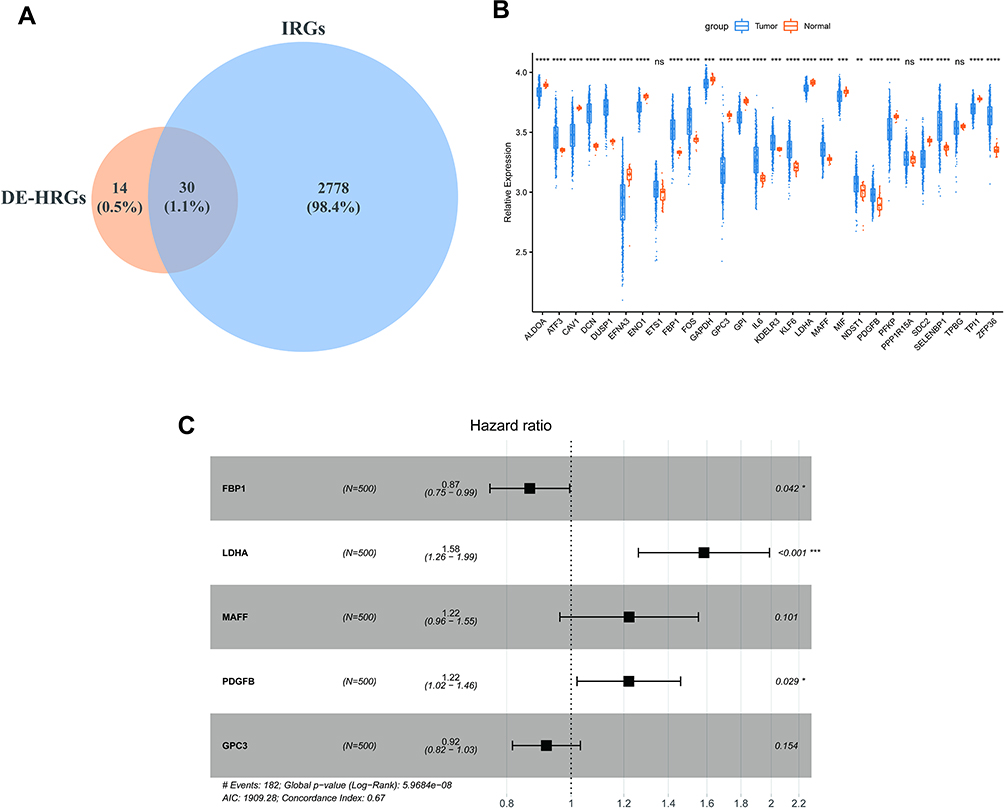 |
Figure 3 Identification of prognostic genes. (A) Venn diagram of DE-HRGs and IRGs. (B) Box line plot of expression differences in the 30 H&IRGs in the GSE68465dataset. (*P < 0.05; **P < 0.01; ***P < 0.001; ****P < 0.0001) (C) Forest plots of multivariate Cox regression analyses in LUAD. Abbreviations: DE-HRGs, differentially-expressed hypoxia-related genes; IRGs, immune-related genes; H&IRGs, hypoxia- and immune-related genes; LUAD, lung adenocarcinoma. |
The DE-H&IICRG Prognostic Signature Exhibited Satisfactory Prognostic Validity
The risk scores for each LUAD sample were calculated in the training and validation sets and samples split into high and low risk according to the median score in each dataset. K-M survival curves demonstrated that, in both the training and validation sets, the low-risk patients had a better OS (Figure 4A and E). The risk score distribution and the survival status of LUAD patients in the training set are shown in Figure 4B and suggest that the higher the risk score, the higher the mortality rate. The validation set produced similar results (Figure 4F). The maximum area under the curve (AUC) values of the prognostic signature in the training and validation sets were 0.712 and 0.711, respectively (Figure 4C and G).
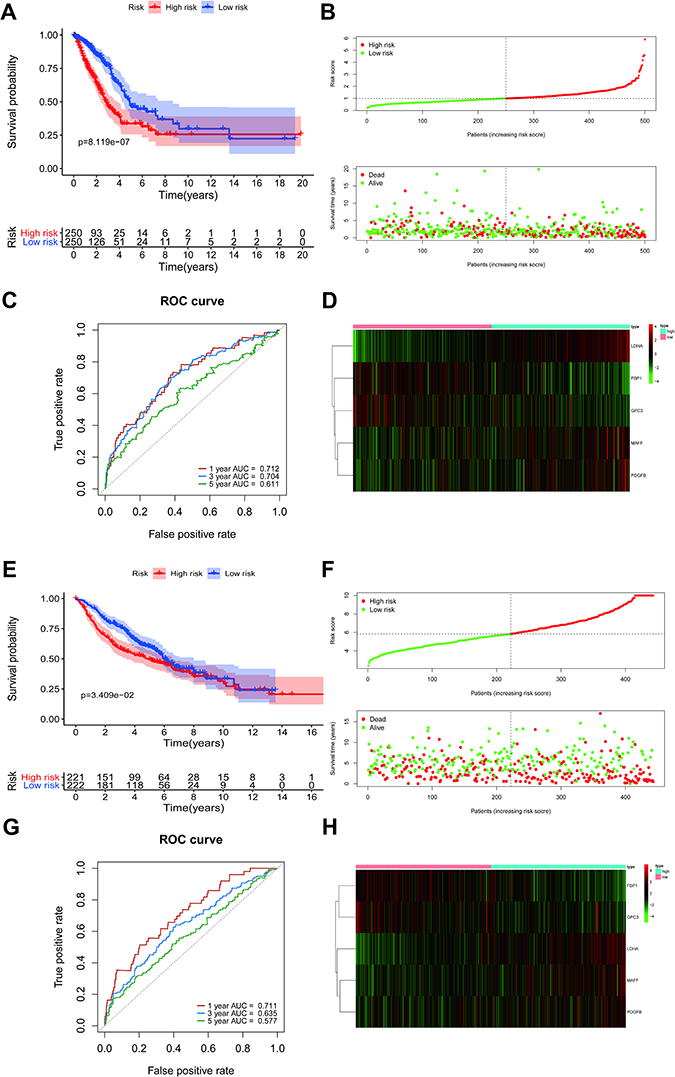 |
Figure 4 The prognostic value of the risk score signature in the TCGA and GSE68465 datasets. (A) Kaplan-Meier overall survival curves for clinical data in TCGA. (B) LUAD patients with high-risk scores were correlated with a higher death rate and shorter survival time. (C) The area under the (ROC) curves (AUCs) were 0.712, 0.704, and 0.611 for predicting 1-, 3-, and 5-year OS events in TCGA data, respectively. (D) A heatmap of expression patterns for prognostic genes in high- and low-risk groups in TCGA. (E–H) Validation of the risk score signature in GSE68465 using the same analysis. Abbreviations: TCGA, The Cancer Genome Atlas; LUAD, lung adenocarcinoma; ROC, receiver operating characteristic. |
The expression levels of the five DE-H&IICRGs were next evaluated in the training and validation sets, which showed that FBP1 and GPC3 were underexpressed in the high-risk group while LDHA, MAFF, and PDGFB were overexpressed in the high-risk group (Figure 4D and H). The five-gene signature consistently predicted OS in patients with LUAD. Moreover, risk scores were generally higher in LUAD patients with T4, N3, stage III disease and patients with a smoking history but showed no significant association with age, gender, or M stage (Supplementary Figure 3).
A Five Gene-Based Risk Score Was an Independent Prognostic Factor for LUAD Patients
The 500 LUAD patients with associated information on age, gender, TNM stage, phase, and smoking history in the training set were further analyzed. Cox regression analyses (univariate and multivariate) suggested that the T stage and our five-gene risk score were independent prognostic factors for OS (Figure 5A and B). We therefore established a nomogram that included the T stage and risk score to predict the survival of LUAD patients at 1, 3, and 5 years (Figure 5C). Higher scores denoted poorer clinical outcomes, and the calibration curves indicated an excellent match between the actual and predicted survival from LUAD (Figure 5D), particularly for five-year survival.
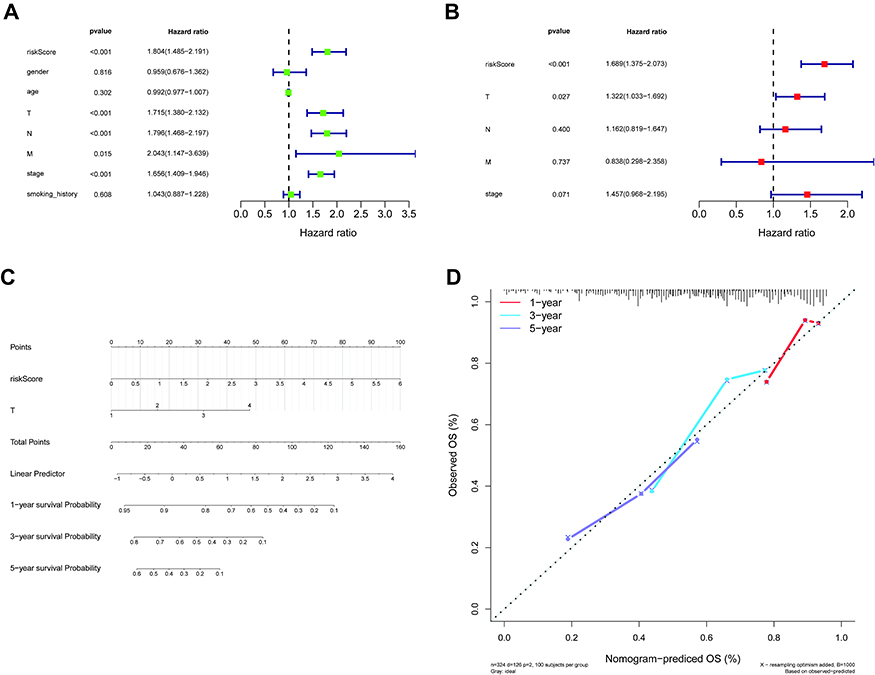 |
Figure 5 Independent prognostic analysis of the five-gene signature. (A and B) Forest plot of the association between risk factors and survival from LUAD in univariate (A) and multivariate (B) Cox regression analyses. (C) A nomogram for the quantitative prediction of 1-, 3-, and 5-year survival for LUAD patients based on the risk score and T stage. (D) Calibration plots for predicting 1-, 3-, and 5-year survival. Abbreviation: LUAD, lung adenocarcinoma. |
Risk Score-Related DEGs Were Mainly Enriched in Cell Cycle and Immune-Related Terms and Pathways
We identified 487 DEGs (230 upregulated and 257 downregulated; Supplemental Table 9) between the high- and low-risk groups, and their distribution is shown in Figure 6A. We next applied GO and KEGG enrichment explorations to reveal the functions of these genes. In the BP category, extracellular structure organization, extracellular matrix organization, and mitotic nuclear division were significantly enriched terms and included genes predominantly associated with the cell cycle (nuclear division, organelle fission, cellular modified amino acid metabolic process) and immune responses (antimicrobial humoral response, antigen processing and description of exogenous peptide antigen via MHC class II, humoral immune response, chemokine production). As expected, response to reduced oxygen levels, response to oxygen levels, and response to hypoxia were also significantly enriched. In the CC analysis, the top four significantly enriched terms were collagen-containing extracellular matrix, lamellar body, collagen trimer, and condensed chromosome, centromeric region. Extracellular matrix structural, extracellular matrix structural constituent, constituent conferring tensile strength, and extracellular matrix binding were the top four enriched terms in the MF category (Figure 6B; Supplementary Table 10). Furthermore, these 487 DEGs were notably enriched for the top four pathways of digesting and absorbing protein, ECM-receptor interactions, asthma, and type I diabetes mellitus (Figure 6C; Supplementary Table 9).
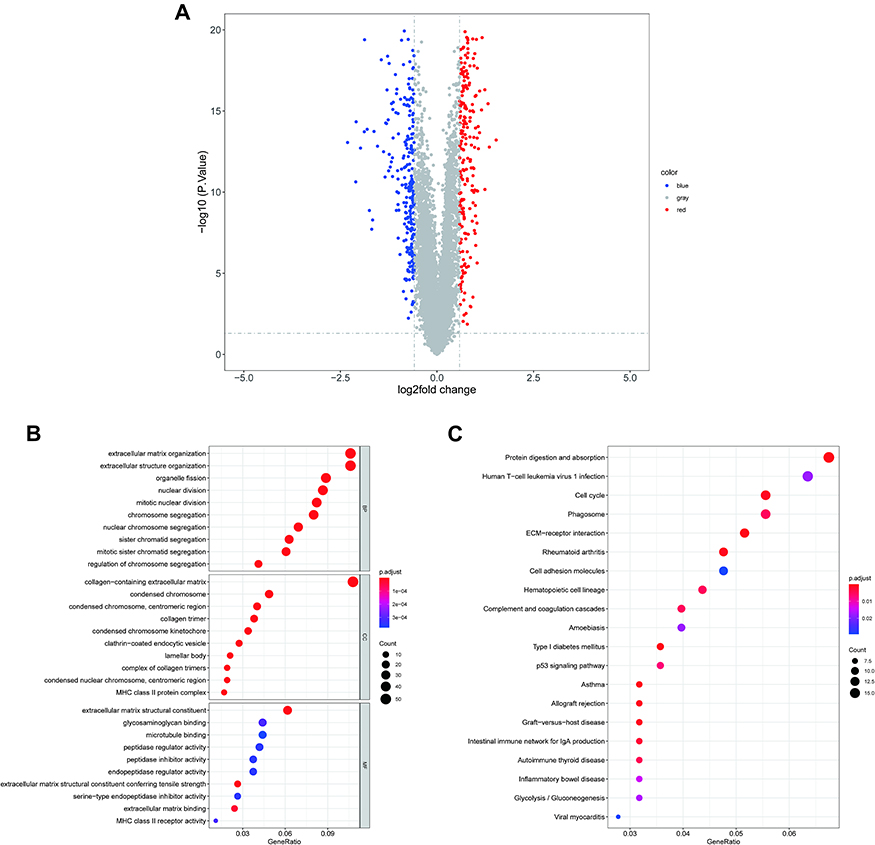 |
Figure 6 GO annotation and KEGG pathway enrichment analysis of risk score-related DEGs. (A) Volcano plot of DEGs between high- and low-risk groups. Blue: downregulated; red: upregulated; gray: unchanged. The top 10 enriched (B) GO BP (upper B), CC (middle B), and MF (bottom B) terms as well (C) top 20 enriched KEGG pathways. Abbreviations: GO, Gene Ontology; KEGG, Kyoto Encyclopedia of Genes and Genomes; DEGs, differentially-expressed genes; BP, biological process; CC, cellular composition; MF, molecular function. |
Patients in the Low-Risk Group Were More Likely to Benefit from ICIs
The immune checkpoints are instrumental to immune regulation, and their inhibitors have revolutionized cancer management over the last ten years.22,23 Given our finding that the DEGs associated with risk scores were involved in regulating immune responses, we proceeded to explore the expression of 27 immune checkpoint genes in the high- and low-risk groups. Of the 27 immune checkpoints available in the current study, 13 (BTLA, CD160, CD244, CD274, CD276, CD47, CD48, CEACAM1, LAG3, LGALS9, PVR, TNFRSF14, and TNFSF4) were significantly differentially expressed between the two groups. BTLA, CD160, CD244, CD47, CD48, CEACAM1, LGALS9, and TNFRSF14 were overexpressed in the low-risk group, while CD274, CD276, LAG3, PVR, and TNFSF4 were overexpressed in the high-risk group (Figure 7A). Even though 14 immune checkpoints were not significantly differentially expressed between the two groups, they tended to show higher expression in the low-risk group of patients.
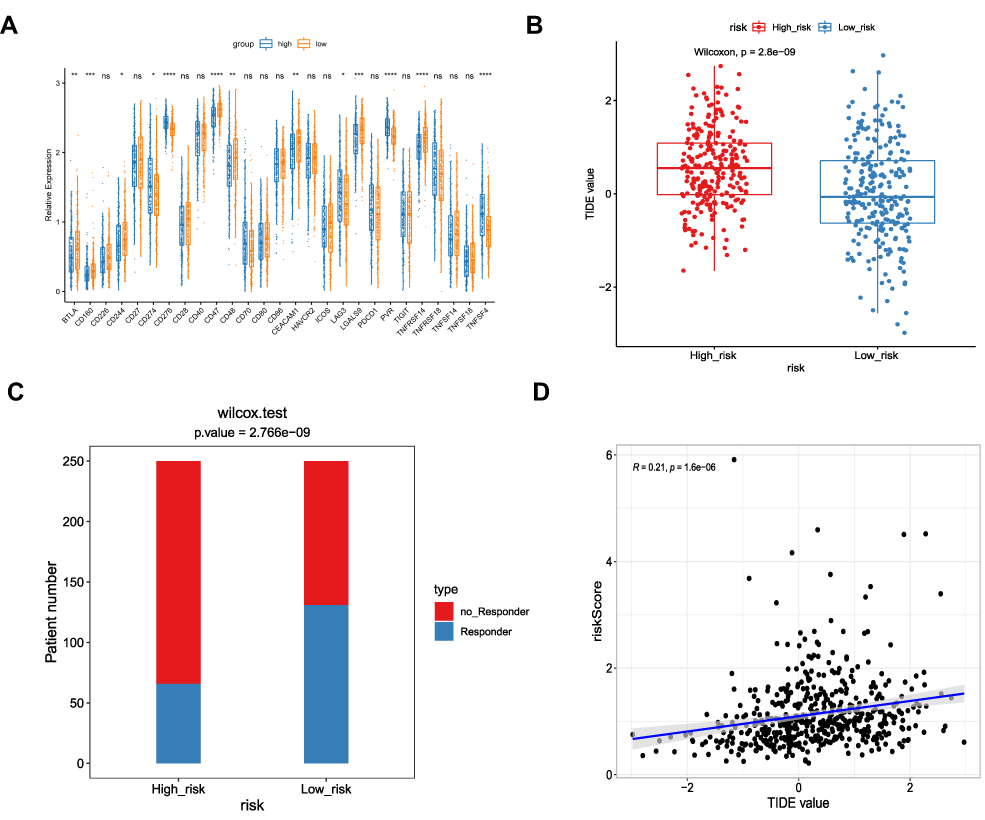 |
Figure 7 Predicting the response of two risk subtypes to immunotherapy. (A) The expression of different immune checkpoints between the low- and high-risk patients is shown in the violin plot. *P < 0.05; **P < 0.01; ***P < 0.001; ****P < 0.0001. (B) The TIDE scores in low- and high-risk patients. (C) The distribution of immunotherapeutic responses in low- and high-risk groups based on the TIDE algorithm. (D) Positive correlation between risk score and TIDE values in the TCGA cohort. |
Finally, we assessed responses to anti-PD-1 and anti-CTLA4 treatments in the high- and low-risk groups using the TIDE algorithm.21 The TIDE score was higher in the high-risk group compared with the low-risk group (P = 2.8e-09; Figure 7B), suggesting that patients in the low-risk group may be more sensitive to anti-PD-1 and anti-CTLA4 treatments. Indeed, more patients in the low-risk group responded to ICI therapy (Figure 7C) and, furthermore, correlation analysis revealed a positive correlation between risk score and TIDE score (Figure 7D). Therefore, we hypothesized that patients in the low-risk group would be more likely to benefit from an ICI.
Discussion
Lung adenocarcinoma (LUAD), which originates from mucus-secreting type II alveolar cells in small airway epithelia, is the most common subtype of NSCLC, with an extremely high incidence and mortality across the world. As sequencing technologies and precision medicine have rapidly progressed, so too have the need and capability to develop novel prognostic signatures based on various tumor hallmarks including aerobic glycolysis, hypoxia, angiogenesis, and immune invasion. However, robust prognostic models suitable for predicting long-term survival, accurately stratifying at-risk groups, and facilitating personalized treatment planning remain an essential unmet clinical need.
Hypoxia is one of the most notable hallmarks of the TME, and it contributes to aggressive tumor phenotypes by enhancing motility, invasion, drug resistance, and immune escape.24,25 Recently, Jing et al identified hypoxia as a basic risk element through ssGSEA and Cox-PH regression models and developed a hypoxia-associated gene signature for early-stage LUAD.16 Run et al also identified hypoxia as a dominant risk factor and constructed a hypoxia-related prognostic signature for stage I LUAD patients which outperformed conventional clinical characteristics both in terms of predicting survival and response to ICI therapy.17 The TME is another vital factor affecting the phenotype and prognosis of cancer patients. Several studies have established immune-related signatures that divide LUAD patients into low- and high-risk subgroups through various bioinformatics methods. Of these, Sijin et al identified immune-related genes using the ESTIMATE algorithm and WGCNA and constructed an effective immune-related gene signature for LUAD patients using univariate Cox analysis, stability selection, and lasso Cox regression analysis.18 While it is known that there is a close association between hypoxia and immunosuppression, and indeed targeting hypoxia may enhance immunotherapy responses,13,26 existing hypoxia- or immune-related prognostic signatures were all established individually without considering the significance of crosstalk between hypoxia and immune responses in the TME of LUAD. Therefore, we developed a combined hypoxia- and immune-related five-gene (FBP1, LDHA, MAFF, PDGFB, and GPC3) prognostic signature for LUAD, which may also represent a predictive biomarker of ICI response in LUAD patients.
As a rate-limiting enzyme in gluconeogenesis, expression of fructose-1,6-bisphosphatase 1 (FBP1) is often lost in NSCLC through abnormal methylation of its promoter. Restored FBP1 expression dramatically inhibited lung cancer cell proliferation and migration under hypoxic conditions and stopped lung cancer development,27 suggesting that FBP1 is a tumor suppressor in NSCLC. Similarly, in another study, restoring expression of FBP1 in NSCLC inhibited the proliferation and invasion of lung cancer cells under hypoxic conditions, thereby preventing the development of NSCLC.28 We found that FBP1 expression was higher in low-risk LUAD patients and that these patients had a worse prognosis, suggesting that, clinically, FBP1 may also be a protective factor in LUAD. In another study in the H460 large cell lung cancer cell line, silencing FBP1 significantly increased cellular proliferation and migration.29 Therefore, FBP1 seems to consistently act as a tumor suppressor in different types of lung cancer.
LDHA is a subunit of the lactate dehydrogenase (LDH) enzyme. Mechanistically, LDH catalyzes the interconversion of pyruvate and L-lactate, with concomitant interconversion of NADH and NAD+ in the final step of aerobic glycolysis. LDHA is highly expressed in various tumors, and similarly we found that LDHA was significantly upregulated in LUAD tissues compared with normal. Downregulating LDHA expression and suppressing LDHA activity both significantly reduce tumor cell proliferation and promote apoptosis.30,31 Moreover, LDHA expression might only act as an independent predictor of poor overall and recurrence-free survival in LUAD.32 These findings are consistent with our results showing that low-risk LUAD patients have lower LDHA expression. It is worth mentioning that LDHA has been included in several metabolism-related prognostic signatures for LUAD, further demonstrating the clinical significance of LDHA and the crosstalk between hypoxia and metabolism in LUAD.33–35
MAFF is a member of the basic leucine zipper (BZIP) transcription element MAF (musculoaponeurotic fibrosarcoma oncogene) family. MAFF is an important regulator of gene expression that participates in different pathophysiological processes including cancer development.36,37 Indeed, we found that MAFF was downregulated in LUAD, similar to observations in other cancers including hepatocellular (HCC) and breast cancer.37 As reported by Minhua et al, MAFF participates in HCC progression through the circ-ITCH/miR-224-5p/MAFF pathway. We speculate MAFF may play a similar role in LUAD, but this requires further study.
PDGFB is a platelet-derived development element that exerts a crucial effect on the recruitment of platelet-derived growth factor receptor beta (PDGFR-β)-positive pericytes to blood vessels. It has recently been shown that PDGFB expression is correlated with the growth, metastasis, and invasion of tumor cells.38 Hypoxia-induced PDGF-BB is significantly associated with increased cellular proliferation and migration through the activation of the AKT, ERK1/2, and STAT3 signaling pathways.39 A study in U2020 cells revealed that ectopic re-expression of GLCE inhibited cell proliferation and tumor formation through various angiogenic growth factors (including PDGFB) and their receptors. It has also been shown that PDGFB is a PPARβ/δ-dependent molecule that participates in tumor vascularization.40 Similarly, we found that PDGFB was dramatically overexpressed in high-risk patients, and, interestingly, the risk scores were higher in LUAD patients with more involved lymph nodes and nodal regions. Therefore, we speculate that upregulated PDGFB might be responsible for lymph nodes metastasis in LUAD, which of course requires confirmation. More importantly, a recent study established an immune-related prognostic signature that included PDGFB, further supporting the reliability of our prognostic signature and approach.41
GPC3, a 65 kDa protein containing 580 amino acids, acts as a heparan sulfate chain proteoglycan bound to the cell membrane by a glycosylphosphatidylinositol (GPI) anchor.42 A recent study revealed complicated roles for GPC3 through inhibition of Hedgehog signaling or activation of canonical and non-canonical Wnt signaling. For example, GPC3 inhibited proliferation when the proliferation rate was mainly controlled by Hedgehog signaling but a pro-proliferative effect when canonical Wnt signaling was dominant in cell proliferation, like in most hepatocellular carcinomas.43 In the present study, GPC3 was downregulated in LUAD and was considered a protective factor for LUAD patients. Therefore, GPC3 might play a tumor suppressor role in LUAD through the Hedgehog signaling pathway. The molecular mechanisms of GPC3 in LUAD are likely to be very complicated and require further experimental validation.
To understand how our prognostic signature stratifies risk, GO enrichment analysis and KEGG pathway enrichment were performed on the genes differentially expressed between low- and high-risk subgroups. KEGG analysis showed that these genes were significantly enriched in cell cycle, phagosome, ECM-receptor interaction, p53 signaling, and glycolysis/gluconeogenesis pathways. Indeed, dysregulated cell cycle, autophagy, and ECM-receptor interactions are important hallmarks of cancer,44–46 while p53 pathway dysregulation occurs in most human cancers.47 Therefore, we hypothesize that these tumor hallmarks and p53 signaling may be responsible for variable risk in LUAD patients. We propose that the association between our prognostic model and prognosis is closely related to the biological functions and molecular mechanisms of these five genes in LUAD carcinogenesis.
We also detected significant differences in 13 immune checkpoint molecules between the high- and low-risk groups. Of these, CD276 was particularly interesting. Costimulatory molecule CD276 is a member of the B7 immunoregulation transmembrane glycoprotein family expressed by T cells,48 and it has dual functions as a co-stimulator and co-inhibitor in T cell immune responses.49 CD276 is found on chromosome 15q24.1 and, according to sequence analysis, CD276 is 951 base pairs in length and encodes 316 amino acids.50 The protein has a immunoglobulin-like variable signaling peptide at the amino terminus. The extracellular segment of the constant area, the transmembrane area, and the 45 amino acid cytoplasmic area are immunoglobulin superfamily type I transmembrane proteins. CD276 is expressed in many tumor cells,51 and abnormal expression of CD276 may be oncogenic through various mechanisms; indeed, it is an indicator of poor clinical prognosis.52 CD276 blockade decreases epithelial-mesenchymal transition in squamous cell carcinoma, cancer stem cells (CSCs) use CD276 for immune escape, and targeting CD276 may decrease CSCs in head and neck squamous cell carcinoma.53
This study also has several limitations. We derived and validated prognostic genes for LUAD in public databases due to difficulties in sample collection. Furthermore, the potential biological functions of these prognostic genes and their roles in the development of LUAD have not been investigated in depth or functionally validated. This study is essentially retrospective in nature, and large-scale prospective studies are still needed to further evaluate and validate the results.
Conclusions
Here we established a reliable prognostic risk model combining immune- and hypoxia-related genes based on LUAD transcriptomic data from the TCGA database and explored the implications of this risk scoring system ICI therapy. In doing so, we provide insights into prognosis-related molecular mechanisms underpinning LUAD and offer a new reference for the clinical management of LUAD. Our findings and conclusions now need further mechanistic exploration and molecular validation.
Data Sharing Statement
The LUAD-related data employed in this research were provided by the TCGA and GEO databases (TCGA, https://portal.gdc.cancer.gov/; GEO, https://www.ncbi.nlm.nih.gov/gds/). Hypoxia-related genes were obtained through HALLMARK HYPOXIA from the MSigDB database (https://www.gsea-msigdb.org/gsea/msigdb/index.jsp).
Ethics Approval and Consent to Participate
TCGA and GEO are public databases. Users can download relevant data for free for research and publish relevant articles. Our study is based on open source data, after discussion with relevant departments in Renmin Hospital of Wuhan University, so there are no ethical issues and other conflicts of interest.
Acknowledgments
This work was supported by a grant from the National Natural Science Foundation of China (No. 81970082).
Funding
This work was supported by grant from the National Natural Science Foundation of China (No. 81970082).
Disclosure
The authors report no conflicts of interest in this work.
References
1. Rami-Porta R, Asamura H, Travis WD, Rusch VW. Lung cancer - major changes in the American Joint Committee on Cancer eighth edition cancer staging manual. CA Cancer J Clin. 2017;67(2):138–155. doi:10.3322/caac.21390
2. McGranahan N, Rosenthal R, Hiley CT, et al. Allele-specific HLA loss and immune escape in lung cancer evolution. Cell. 2017;171(6):1259–1271. doi:10.1016/j.cell.2017.10.001
3. Zhou B, Flodby P, Luo J, et al. Claudin-18-mediated YAP activity regulates lung stem and progenitor cell homeostasis and tumorigenesis. J Clin Invest. 2018;128(3):970–984. doi:10.1172/JCI90429
4. Zhang Z, Tang H, Chen P, Xie H, Tao Y. Demystifying the manipulation of host immunity, metabolism, and extraintestinal tumors by the gut microbiome. Signal Transduct Target Ther. 2019;4:41. doi:10.1038/s41392-019-0074-5
5. Siegel RL, Miller KD, Goding SA, et al. Colorectal cancer statistics, 2020. CA Cancer J Clin. 2020;70(3):145–164. doi:10.3322/caac.21601
6. Doll KM, Rademaker A, Sosa JA. Practical guide to surgical data sets: surveillance, epidemiology, and end results (SEER) database. JAMA Surg. 2018;153(6):588–589. doi:10.1001/jamasurg.2018.0501
7. Chen J, Liao Y, Fan X. Prognostic and clinicopathological value of BUB1B expression in patients with lung adenocarcinoma: a meta-analysis. Expert Rev Anticancer Ther. 2021;21(7):795–803. doi:10.1080/14737140.2021.1908132
8. Liao Y, He D, Wen F. Analyzing the characteristics of immune cell infiltration in lung adenocarcinoma via bioinformatics to predict the effect of immunotherapy. Immunogenetics. 2021;73(5):369–380. doi:10.1007/s00251-021-01223-8
9. Rey S, Schito L, Wouters BG, Eliasof S, Kerbel RS. Targeting hypoxia-inducible factors for antiangiogenic cancer therapy. Trends Cancer. 2017;3(7):529–541. doi:10.1016/j.trecan.2017.05.002
10. Horsman MR, Mortensen LS, Petersen JB, Busk M, Overgaard J. Imaging hypoxia to improve radiotherapy outcome. Nat Rev Clin Oncol. 2012;9(12):674–687. doi:10.1038/nrclinonc.2012.171
11. Macklin PS, McAuliffe J, Pugh CW, Yamamoto A. Hypoxia and HIF pathway in cancer and the placenta. Placenta. 2017;56:8–13. doi:10.1016/j.placenta.2017.03.010
12. Mo Z, Yu L, Cao Z, Hu H, Luo S, Zhang S. Identification of a hypoxia-associated signature for lung adenocarcinoma. Front Genet. 2020;11:647. doi:10.3389/fgene.2020.00647
13. Damgaci S, Ibrahim-Hashim A, Enriquez-Navas PM, Pilon-Thomas S, Guvenis A, Gillies RJ. Hypoxia and acidosis: immune suppressors and therapeutic targets. Immunology. 2018;154(3):354–362. doi:10.1111/imm.12917
14. Chen W, Dai X, Chen Y, et al. Significance of STAT3 in immune infiltration and drug response in cancer. Biomolecules. 2020;10(6):834. doi:10.3390/biom10060834
15. Caputo S, Grioni M, Brambillasca CS, et al. Galectin-3 in prostate cancer stem-like cells is immunosuppressive and drives early metastasis. Front Immunol. 2020;11:1820. doi:10.3389/fimmu.2020.01820
16. Sun J, Zhao T, Zhao D, et al. Development and validation of a hypoxia-related gene signature to predict overall survival in early-stage lung adenocarcinoma patients. Ther Adv Med Oncol. 2020;12:431414352. doi:10.1177/1758835920937904
17. Shi R, Bao X, Unger K, et al. Identification and validation of hypoxia-derived gene signatures to predict clinical outcomes and therapeutic responses in stage I lung adenocarcinoma patients. Theranostics. 2021;11(10):5061–5076. doi:10.7150/thno.56202
18. Sun S, Guo W, Wang Z, et al. Development and validation of an immune-related prognostic signature in lung adenocarcinoma. Cancer Med. 2020;9(16):5960–5975. doi:10.1002/cam4.3240
19. Yang S, Liu T, Cheng Y, Bai Y, Liang G. Immune cell infiltration as a biomarker for the diagnosis and prognosis of digestive system cancer. Cancer Sci. 2019;110(12):3639–3649. doi:10.1111/cas.14216
20. Newman AM, Liu CL, Green MR, et al. Robust enumeration of cell subsets from tissue expression profiles. Nat Methods. 2015;12(5):453–457. doi:10.1038/nmeth.3337
21. Jiang P, Gu S, Pan D, et al. Signatures of T cell dysfunction and exclusion predict cancer immunotherapy response. Nat Med. 2018;24(10):1550–1558. doi:10.1038/s41591-018-0136-1
22. Topalian SL, Taube JM, Anders RA, Pardoll DM. Mechanism-driven biomarkers to guide immune checkpoint blockade in cancer therapy. Nat Rev Cancer. 2016;16(5):275–287. doi:10.1038/nrc.2016.36
23. Darvin P, Toor SM, Sasidharan NV, Elkord E. Immune checkpoint inhibitors: recent progress and potential biomarkers. Exp Mol Med. 2018;50(12):1–11. doi:10.1038/s12276-018-0191-1
24. Luo W, Wang Y. Hypoxia mediates tumor malignancy and therapy resistance. Adv Exp Med Biol. 2019;1136:1–18.
25. Vito A, El-Sayes N, Mossman K. Hypoxia-driven immune escape in the tumor microenvironment. Cells-Basel. 2020;9(4):992.
26. Graham K, Unger E. Overcoming tumor hypoxia as a barrier to radiotherapy, chemotherapy and immunotherapy in cancer treatment. Int J Nanomedicine. 2018;13:6049–6058. doi:10.2147/IJN.S140462
27. Zhang J, Wang J, Xing H, Li Q, Zhao Q, Li J. Down-regulation of FBP1 by ZEB1-mediated repression confers to growth and invasion in lung cancer cells. Mol Cell Biochem. 2016;411(1–2):331–340. doi:10.1007/s11010-015-2595-8
28. Cong J, Wang X, Zheng X, et al. Dysfunction of natural killer cells by FBP1-induced inhibition of glycolysis during lung cancer progression. Cell Metab. 2018;28(2):243–255. doi:10.1016/j.cmet.2018.06.021
29. Dong Y, Huaying S, Danying W, et al. Significance of methylation of FBP1 gene in non-small cell lung cancer. Biomed Res Int. 2018;2018:3726091. doi:10.1155/2018/3726091
30. Huang X, Li X, Xie X, et al. High expressions of LDHA and AMPK as prognostic biomarkers for breast cancer. Breast. 2016;30:39–46. doi:10.1016/j.breast.2016.08.014
31. Gao S, Tu DN, Li H, et al. Pharmacological or genetic inhibition of LDHA reverses tumor progression of pediatric osteosarcoma. Biomed Pharmacother. 2016;81:388–393. doi:10.1016/j.biopha.2016.04.029
32. Yu C, Hou L, Cui H, et al. LDHA upregulation independently predicts poor survival in lung adenocarcinoma, but not in lung squamous cell carcinoma. Future Oncol. 2018;14(24):2483–2492. doi:10.2217/fon-2018-0177
33. Zhang J, Zhang J, Yuan C, et al. Establishment of the Prognostic index reflecting tumor immune microenvironment of lung adenocarcinoma based on metabolism-related genes. J Cancer. 2020;11(24):7101–7115. doi:10.7150/jca.49266
34. Yu X, Zhang X, Zhang Y. Identification of a 5-gene metabolic signature for predicting prognosis based on an integrated analysis of tumor microenvironment in lung adenocarcinoma. J Oncol. 2020;2020:5310793. doi:10.1155/2020/5310793
35. Wang Z, Embaye KS, Yang Q, et al. Establishment and validation of a prognostic signature for lung adenocarcinoma based on metabolism-related genes. Cancer Cell Int. 2021;21(1):219. doi:10.1186/s12935-021-01915-x
36. Guo Z, Zhu H, Xu W, et al. Alternative splicing related genetic variants contribute to bladder cancer risk. Mol Carcinog. 2020;59(8):923–929. doi:10.1002/mc.23207
37. Wang J, Wang Y, Xing P, et al. Development and validation of a hypoxia-related prognostic signature for breast cancer. Oncol Lett. 2020;20(2):1906–1914. doi:10.3892/ol.2020.11733
38. Zhang Y, Cedervall J, Hamidi A, et al. Platelet-specific PDGFB ablation impairs tumor vessel integrity and promotes metastasis. Cancer Res. 2020;80(16):3345–3358. doi:10.1158/0008-5472.CAN-19-3533
39. Zhang D, Cui G, Sun C, et al. Hypoxia promotes osteosarcoma cell proliferation and migration through enhancing platelet-derived growth factor-BB/platelet-derived growth factor receptor-beta axis. Biochem Biophys Res Commun. 2019;512(2):360–366. doi:10.1016/j.bbrc.2019.03.040
40. Li S, Yao H, Xu J, Jiang S. Synthetic routes and biological evaluation of largazole and its analogues as potent histone deacetylase inhibitors. Molecules. 2011;16(6):4681–4694. doi:10.3390/molecules16064681
41. Li R, Liu X, Zhou XJ, et al. Identification and validation of the prognostic value of immune-related genes in non-small cell lung cancer. Am J Transl Res. 2020;12(9):5844–5865.
42. Filmus J, Selleck SB. Glypicans: proteoglycans with a surprise. J Clin Invest. 2001;108(4):497–501. doi:10.1172/JCI200113712
43. Filmus J, Capurro M. The role of glypican-3 in the regulation of body size and cancer. Cell Cycle. 2008;7(18):2787–2790. doi:10.4161/cc.7.18.6672
44. Thu KL, Soria-Bretones I, Mak TW, Cescon DW. Targeting the cell cycle in breast cancer: towards the next phase. Cell Cycle. 2018;17(15):1871–1885. doi:10.1080/15384101.2018.1502567
45. Maheswari U, Sadras SR. Mechanism and regulation of autophagy in cancer. Crit Rev Oncog. 2018;23(5–6):269–280. doi:10.1615/CritRevOncog.2018028394
46. Chen J, Wu F, Shi Y, et al. Identification of key candidate genes involved in melanoma metastasis. Mol Med Rep. 2019;20(2):903–914. doi:10.3892/mmr.2019.10314
47. Muller PA, Vousden KH. Mutant p53 in cancer: new functions and therapeutic opportunities. Cancer Cell. 2014;25(3):304–317. doi:10.1016/j.ccr.2014.01.021
48. Lim S, Liu H, Madeira DSL, et al. Immunoregulatory protein B7-H3 reprograms glucose metabolism in cancer cells by ROS-mediated stabilization of HIF1alpha. Cancer Res. 2016;76(8):2231–2242. doi:10.1158/0008-5472.CAN-15-1538
49. Huang L. The expression and clinical significance of B7-H3 and miR-145 in lung cancer patients with malignant pleural effusion. Eur Rev Med Pharmacol Sci. 2020;24(12):6759–6766. doi:10.26355/eurrev_202006_21664
50. Li Y, Yang X, Wu Y, et al. B7-H3 promotes gastric cancer cell migration and invasion. Oncotarget. 2017;8(42):71725–71735. doi:10.18632/oncotarget.17847
51. Flem-Karlsen K, Fodstad O, Tan M, Nunes-Xavier CE. B7-H3 in cancer - beyond immune regulation. Trends Cancer. 2018;4(6):401–404. doi:10.1016/j.trecan.2018.03.010
52. Zhang C, Hao X. Prognostic significance of CD276 in non-small cell lung cancer. Open Med (Wars). 2019;14:805–812. doi:10.1515/med-2019-0076
53. Wang C, Li Y, Jia L, et al. CD276 expression enables squamous cell carcinoma stem cells to evade immune surveillance. Cell Stem Cell. 2021;28:1597–1613.e7. doi:10.1016/j.stem.2021.04.011
 © 2021 The Author(s). This work is published and licensed by Dove Medical Press Limited. The full terms of this license are available at https://www.dovepress.com/terms.php and incorporate the Creative Commons Attribution - Non Commercial (unported, v3.0) License.
By accessing the work you hereby accept the Terms. Non-commercial uses of the work are permitted without any further permission from Dove Medical Press Limited, provided the work is properly attributed. For permission for commercial use of this work, please see paragraphs 4.2 and 5 of our Terms.
© 2021 The Author(s). This work is published and licensed by Dove Medical Press Limited. The full terms of this license are available at https://www.dovepress.com/terms.php and incorporate the Creative Commons Attribution - Non Commercial (unported, v3.0) License.
By accessing the work you hereby accept the Terms. Non-commercial uses of the work are permitted without any further permission from Dove Medical Press Limited, provided the work is properly attributed. For permission for commercial use of this work, please see paragraphs 4.2 and 5 of our Terms.