")
Back to Journals » Drug Design, Development and Therapy » Volume 13
A novel non-invasive monitoring assay of 5-azacitidine efficacy using global DNA methylation of peripheral blood in myelodysplastic syndrome
Authors Asano M, Ohyashiki JH , Kobayashi-Kawana C, Umezu T , Imanishi S, Azuma K, Akahane D, Fujimoto H, Ito Y, Ohyashiki K
Received 18 November 2018
Accepted for publication 4 April 2019
Published 30 May 2019 Volume 2019:13 Pages 1821—1833
DOI https://doi.org/10.2147/DDDT.S195071
Checked for plagiarism Yes
Review by Single anonymous peer review
Peer reviewer comments 2
Editor who approved publication: Dr Tuo Deng
Michiyo Asano,1 Junko H Ohyashiki,2 Chiaki Kobayashi-Kawana,1 Tomohiro Umezu,1,3 Satoshi Imanishi,3 Kenko Azuma,3 Daigo Akahane,1 Hiroaki Fujimoto,1 Yoshikazu Ito,1 Kazuma Ohyashiki1
1Department of Hematology, Tokyo Medical University, Tokyo, Japan; 2Department of Advanced Cellular Therapy, Tokyo Medical University, Tokyo, Japan; 3Department of Molecular Oncology, Institute of Medical Science, Tokyo Medical University, Tokyo, Japan
Purpose: Monitoring response and resistance to 5-azacitidine (AZA) is essential when treating patients with myelodysplastic syndrome (MDS). To quantify methylated DNA not only in the promoter region but also in the gene body, we established a single-molecule methylation assay (SMMA).
Patients and methods: We first investigated the methylation extent (expressed as methylation index [MI]) by SMMA among 28 MDS and 6 post-MDS acute myeloid leukemia patients. We then analyzed the MI in 13 AZA-treated patients.
Results: Whole-blood DNA from all 34 patients had low MI values compared with healthy volunteers (P<0.0001). DNA hypomethylation in MDS patients was more evident in neutrophils (P=0.0008) than in peripheral mononuclear cells (P=0.0713). No consistent pattern of genome-wide DNA hypomethylation was found among MDS subtypes or revised International Prognostic Scoring System (IPSS-R) categories; however, we found that the MI was significantly increased for patients at very high risk who were separated by the new cytogenetic scoring system for IPSS-R (P=0.0398). There was no significant difference in MI before AZA, regardless of the response to AZA (P=0.8689); however, sequential measurement of MI in peripheral blood demonstrated that AZA non-responders did not have normalized MI at the time of next course of AZA (P=0.0352).
Conclusion: Our results suggest that sequential SMMA of peripheral blood after AZA may represent a non-invasive monitoring marker for AZA efficacy in MDS patients.
Keywords: myelodysplastic syndrome, azacytidine, peripheral blood, methylation index
Introduction
Myelodysplastic syndrome (MDS) is a clonal hematopoietic disorder characterized by peripheral blood cytopenia and dysplastic features of hematopoietic cells. The prognosis of MDS patients has been defined by cytopenia, percentage of bone marrow (BM) blasts, and cytogenetic risk factors, which comprise the so-called International Prognostic Scoring System (IPSS) established in 1997.1 Low and intermediate-1 scores have been defined as low-risk MDS according to the IPSS, while intermediate-2 and high scores have been defined as high-risk MDS. The goal of therapy for low-risk MDS patients is to deviate from transfusion dependency; for high-risk MDS patients, the goal is to prevent leukemic transformation.2 The European LeukemiaNet has provided clinical recommendations for diagnosis and appropriate therapeutic interventions based on evidence- and consensus-based guidelines for adult patients with primary MDS in 2013.3 In addition, the US National Comprehensive Cancer Network (NCCN) guidelines for the management of MDS have been updated. Both of these guidelines commonly recommend hypomethylating agents (HMA) as a key medication for high-risk MDS patients.3 Moreover, NCCN guidelines have proposed HMA for low-risk MDS patients who do not respond to or are intolerant to other therapeutic options (
5-azacytidine (azacytidine; AZA) is the most widely used HMA, and approximately 50% of AZA-treated MDS patients experience hematological improvement.4,5 Because AZA incorporates both RNA and DNA, it exerts bipolar effects on hematological improvement. AZA induces apoptosis via RNA incorporation and demethylation via DNA integration; therefore, this double effect reflects the reduction in blast numbers and recovery from cytopenia. The remaining 50% of AZA-treated MDS patients do not show any response, even after treatment with at least six courses of 75 mg/m2 AZA.6 For this primary AZA treatment failure, it remains unclear which MDS patients respond to AZA treatment, although several genes are considered linked to AZA sensitivity.7–9 Moreover, some AZA responders do not maintain consistent hematologic improvement and subsequently develop acute leukemia, termed secondary AZA failure. Evidence suggests that hypomethylation of the promoter region in tumor suppressor genes is not always related to a clinical response attributable to AZA.9–11 Recent reports have also demonstrated that somatic mutations, such as TP53 and TET2 mutation,7,8,12–15 has been identified as a poor prognostic factor for MDS patients, and AZA response among TP53 mutated patients is better compared with non-mutated patients.12 However, this response is temporary, and overall survival is not improved. TET2 is one of the most frequently identified mutation,13 although its effect on HMA response is controversial. Some studies have shown that TET2 mutation is a favorable indicator of AZA efficacy,7,8 while others do not support such a relationship.14,15 To date, no predictive biomarker for secondary AZA failure has been described. BM specimens are typically used in the initial diagnosis or relapsed phase, but are less appropriate during the follow-up period. We therefore applied a single-molecule methylation assay (SMMA), whereby methylated DNA in samples could be quantified using the methylation index (MI), to establish a non-invasive monitoring method for AZA efficacy using peripheral blood cells.16 We first analyzed MI in 34 untreated patients with MDS, including 6 post-MDS acute myeloid leukemia (AML) patients, and then measured the MI sequentially in 13 AZA-treated patients.
Our study indicates that whole-blood DNA from all 34 patients had low MI values compared with healthy volunteers, regardless of the percentage of blasts, indicating that the sequential analysis of MI in each patient may be more reliable for determining AZA efficacy. Indeed, appropriate MI recovery of peripheral blood after AZA treatment was found in AZA responders. The sequential analysis of MI using peripheral blood may therefore represent a non-invasive monitoring marker for use in the treatment of patients with MDS.
Materials and methods
Patients
Thirty-four patients with MDS and post-MDS AML (aged 23−83 years; mean, 66.2 years) were enrolled in this study. For the methylation assay, we subdivided patients according to percentage of BM blasts. Fifteen patients had <5% BM blasts (Table 1): four patients witefractory anemia (RA), one with RA with ringed sideroblasts, eight with refractory cytopenia with multilineage dysplasia, and two with unclassifiable MDS (MDS-U). Twenty-eight patients had ≥5% BM blasts but <20% BM blasts (Table 1): two patients with RA with excess blasts-1 and 11 with RA with excess blasts-2. Six patients with post-MDS AML were also enrolled in this study. Samples from all MDS or post-MDS AML patients were obtained before treatment. Among these, 13 MDS patient samples were analyzed sequentially before and after AZA treatment. Blood samples were collected weekly, and the response to AZA was evaluated using the International Working Group (IWG) response criteria for myelodysplasia.17 For NGS analysis, BM mononuclear cells were also used. Thirteen healthy volunteers (aged 35−58 years; mean, 48.9 years) served as the control group. This study was approved by the institutional review board of Tokyo Medical University (no. 1979). Written informed consent was obtained from all patients and volunteers prior to participation in accordance with the Declaration of Helsinki.
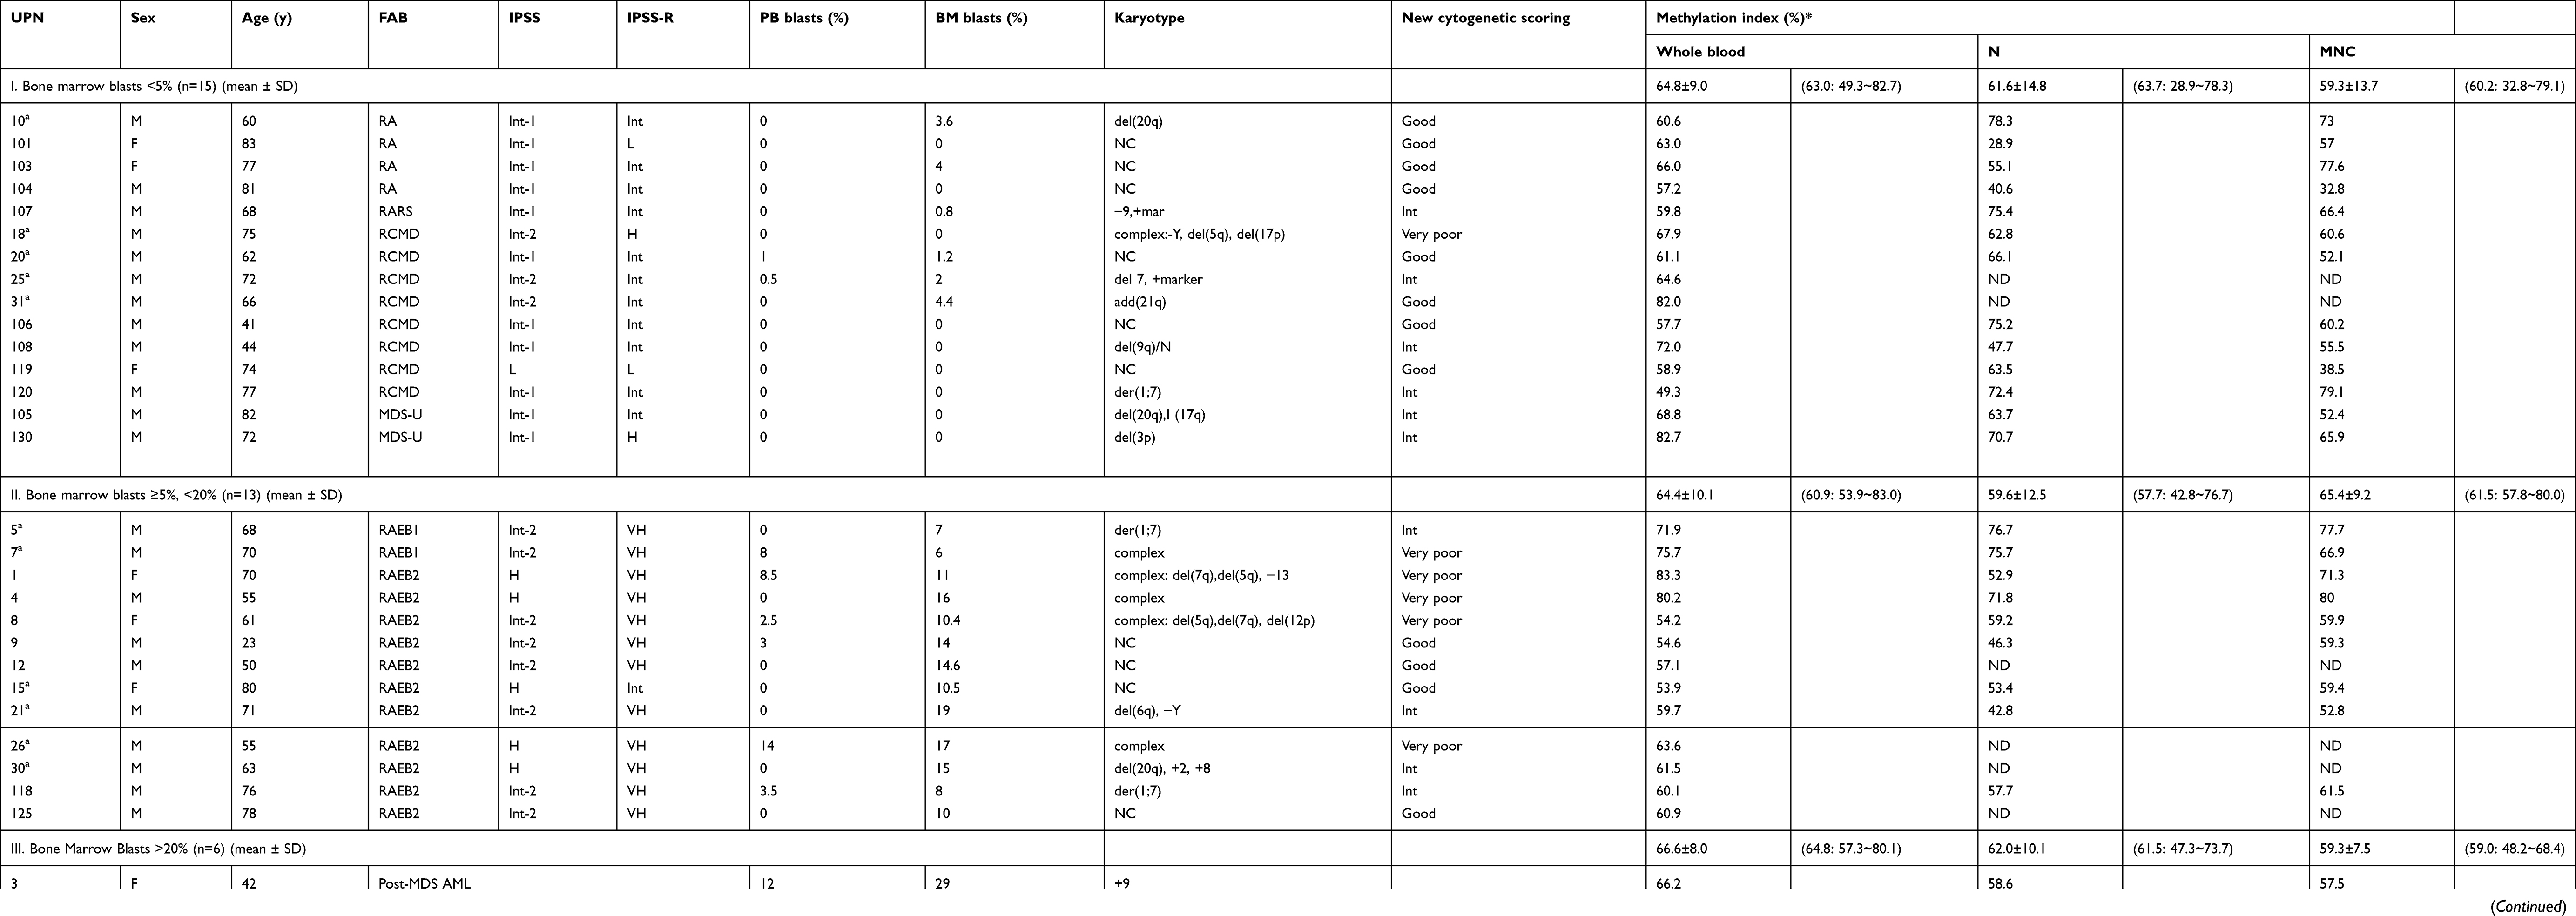 | Table 1 Methylation index of patients with myelodysplastic syndrome and post-MDS AML |
Isolation of DNA from whole blood, neutrophils, and mononuclear cells
For the methylation assay, DNA from either whole blood or the separated fraction was extracted using a robotic workstation (Magtration System 6GC; Precision System Science, Chiba, Japan) and an EZ1 DNA Blood 350 µl Kit (Qiagen, Valencia, CA, USA) according to the manufacturers’ instructions. To obtain a mononuclear lymphocyte-enriched fraction, heparinized peripheral blood cells were separated on a Ficoll-Hypaque density gradient. BM mononuclear cells containing blast fractions were also collected as described above. To collect a neutrophil-rich fraction, buffy coat was mixed with 0.2% methylcellulose to sediment the red blood cells. The leukocyte-enriched part was collected, washed with phosphate-buffered saline (PBS; pH 7.4), and resuspended in PBS and Hank’s balanced salt solution containing divalent cations (HBSS; Gibco, Grans Island, NY, USA).18
Methylation index measured by single-molecule methylation analysis
To determine global DNA methylation levels, we performed SMMA as previously described.16 The principle of this assay is based on two methodologies. One is the use of high-affinity methyl-CpG–binding domain protein 2 (MBD2) to bind methylated DNA, and the other is the use of fluorescence correlation spectroscopy, which determines the interaction of MBD2 with methylated DNA in the sample. We used 500 ng genomic DNA digested with Mse I (New England Biolabs, Beverly, MA, USA). The digested DNA was quantified by NanoDrop ND-1000 (Thermo Fisher Scientific, Waltham, MA, USA).16 To calculate the methylated DNA in the sample, we generated a standard curve using TAMRA-labeled MBD2, unlabeled MBD2, 0% methylated DNA (negative control), and 100% methylated DNA (positive control).16 Using this standard curve, we were able to assess the genome-wide DNA methylation status of whole blood, neutrophil-enriched fractions, and mononuclear fractions; the methylation level was expressed as the MI, which indicates the percentage of methylated DNA in the sample.
Next-generation sequencing analysis
Next-generation sequencing (NGS) analysis was performed as reported previously.19 Briefly, genomic DNA was extracted using a Gentra PureGene Cell Kit (Qiagen, Hilden, Germany). Whole exonic regions of 50 genes were amplified from 40 ng genome DNA from each patient sample using the GeneRead DNAseq Targeted Panel V2 (Human Myeloid Neoplasms Panel; Qiagen). We constructed a barcoded Illumina DNA library using the GeneRead DNA Library I Core Kit (Qiagen) and GeneRead Adapter I Set 12-Plex Kit (Qiagen); sequencing was performed on a MiSeq system (Illumina, San Diego, CA, USA) according to the manufacturer’s instructions. High-probability oncogenic mutations were extracted from annotated data in the available databases (ClinVar:
Statistical analysis
Data were expressed as mean ± standard deviation (SD). Mann–Whitney U and chi-square tests were used to determine statistical significance for comparisons between the control and test groups. Multiple groups were compared using one-way analysis of variance (ANOVA). GraphPad Prism software (version 5c for Macintosh; GraphPad Software Inc., La Jolla, CA, USA) was used for statistical analysis.
Results
Genome-wide DNA methylation status for untreated MDS
We first measured the genome-wide DNA methylation status of healthy volunteers. In healthy subjects, there was no significant difference in the MI between whole blood and neutrophils (82.8±5.9 vs 79.7±9.3; P=0.315); however, the MI of mononuclear cells was significantly lower than that of whole blood (P=0.0001) or neutrophils (P=0.0087). We therefore measured the methylation status of whole blood in 34 patients and of neutrophils and mononuclear cells in 28 patients when separated samples were available. The MI values of each fraction for all patients analyzed are shown in Table 1. To estimate the influence of blasts in the sample, MDS patients were subdivided into MDS-I (BM blasts <5%) and MDS-II (BM blasts >5%) groups (Table 1 and Figure 1A, B, C). A significant reduction in MI for the whole blood DNA sample was evident for patients with MDS-I (P=0.0001), MDS-II (P<0.0001), and post-MDS AML (P=0.0001) (one-way ANOVA; P<0.0001) compared with normal controls (Figure 1A). There was no significant difference in MI among the three groups, indicating that it did not reflect the percentage of blasts in the samples. This was also evident in DNA from neutrophil fractions (one-way ANOVA; P=0.0008) (Figure 1B), but not from mononuclear cell fractions (one-way ANOVA; P=0.0713) (Figure 1C). For instance, the MI of neutrophils was significantly lower in patients with MDS-I (P=0.001), MDS-II (P<0.0003), and post-MDS AML (P=0.0027) (Figure 1B), whereas that of mononuclear cells was not significantly decreased in patients with MDS-II (P=0.2622) (Figure 1C). There was no consistent pattern for MI levels found among MDS subtypes (P=0.3064), IPSS categories (P=0.2827), or IPSS-R categories (P=0.1940); however, we found that the MI was significantly higher for MDS patients in the very poor cytogenetic category according to the IPSS-R compared with patients in the good cytogenetics category (Figure 1D). We did not identify any correlation between the MI and hematologic features. No correlation was evident between the MI and neutrophils (P=0.6775) or mononuclear cells (P=0.9965) (data not shown).
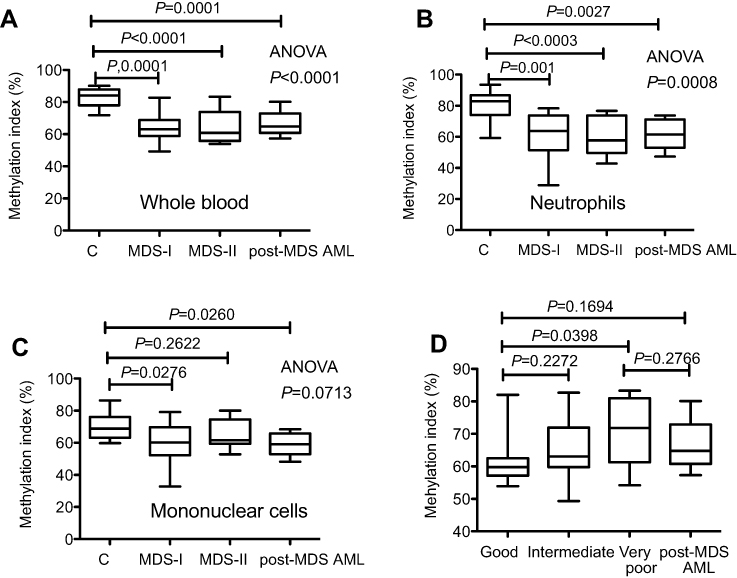 | Figure 1 Methylation index (MI) measured using a single-molecule methylation assay (SMMA). The percent of methylation DNA in the sample is shown. (A). MI of whole blood. (B). MI of the neutrophil fraction. (C). MI of mononuclear cells. (D). MI is significantly increased in MDS patients with a very poor cytogenetic score according to the Revised International Prognostic Scoring System.Abbreviations: MDS, myelodysplastic syndrome; post MDS-AML, post myelodysplastic acute myeloid leukemia. |
Sequential analysis of methylation index for AZA-treated patients
Based on the results obtained from various sample fractions in the current study, we concluded that MI measurements in whole blood were the most robust and reliable for estimating genome-wide DNA methylation. Since MI was highly variable among the patients, regardless of the proportion of blasts, we analyzed the MI sequentially for 13 patients treated with at least four courses of AZA (Table 1). The clinical response to AZA and a summary of the mutation analysis related to myeloid neoplasia are shown in Table 2. Detailed information from the NGS analysis is shown in Table S1. Although the number of patients in the current study is small, six patients showed hematological improvement (unique patient number [UPN] 5, 7, 13, 15, 18, and 30). Among these six, five patients (all except for UPN 30) developed resistant to AZA and exhibited secondary failure after several courses of treatment. The remaining seven patients did not respond to AZA. TET2 mutation was detected in four patients, including two AZA responders, whereas TP53 mutation was detected in another four patients including one AZA responder.
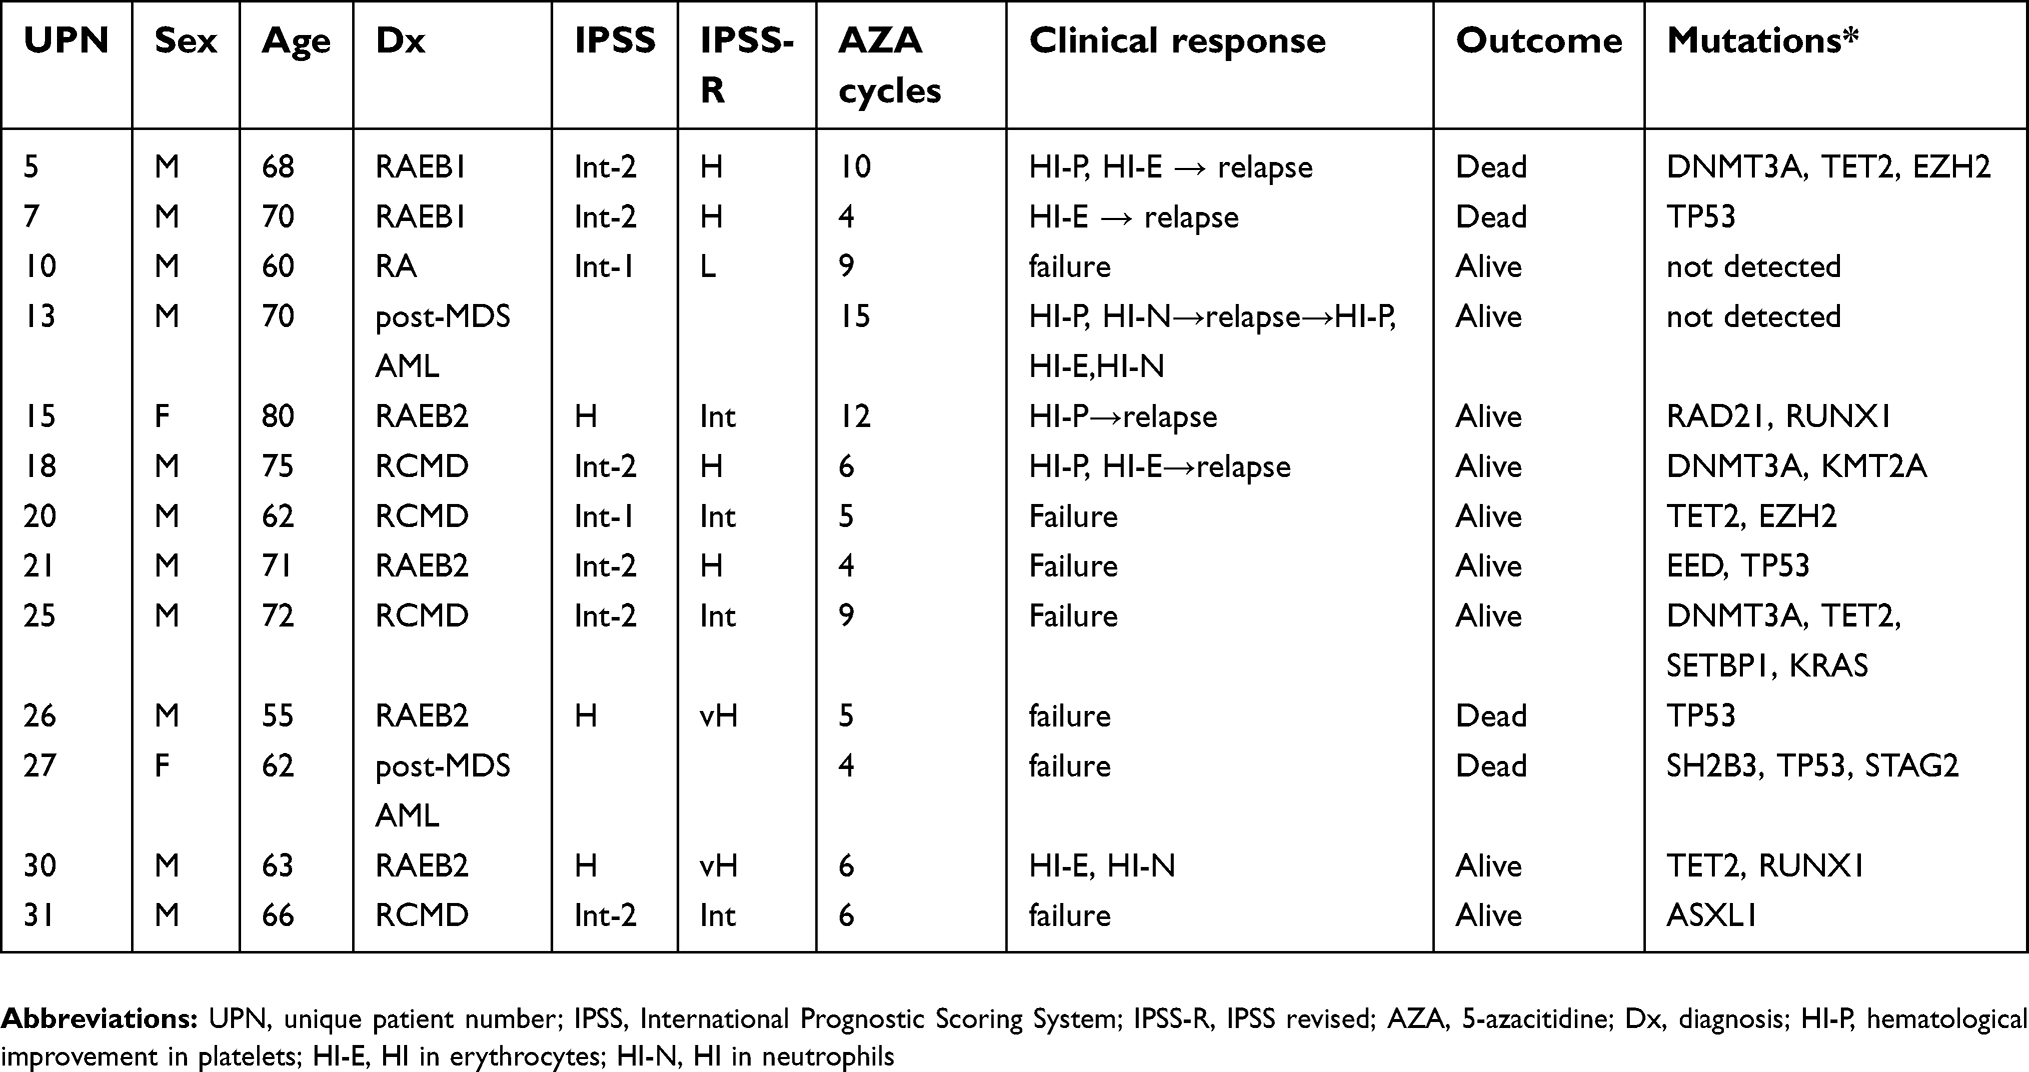 | Table 2 Clinical response to AZA in 13 patients whose methylation index was subsequently measured |
To address the question of whether the MI before AZA administration could be a predictive marker for AZA response, we first compared the MI between responders and non-responders; however, there was no significant difference in the MI (66.6±6.3 vs 67.4±9.5; P=0.8689). A transient reduction in the MI at day 7 after AZA administration was noted in the majority of patients, but there was no significant difference in the MI between responders and non-responders (55.0±14.1 vs 52.0±16.2; P=0.7289).
We then focused on the sequential change in the MI for each case. Because the MI for each patient was highly variable, we attempted to calculate the normalized rate rather than the MI at a single point. The restoration rate of MI at day 28 (the day of next AZA treatment) is expressed as follows: ∆MIday28 (MIday28 − MIday0). The ∆MIday28 for AZA responders was significantly higher than that of non-responders (P=0.0352) (Figure 2A). In addition, ∆MIday120 was significantly higher than that of non-responders (P=0.0251) (Figure 2B). It is notable that ∆MIday120 was significantly higher than ∆MIday28 for AZA responders, although there was no significant difference in ∆MI at day 28 and day 120 for non-responders (Figure 2C and D). This indicates that, in responders, the genome-wide DNA methylation level is gradually normalized after four courses of AZA. In contrast, there were no significant differences in ∆MIday7 (MIday7 − MIday0) (P=0.6915), ∆MIday14 (MIday14 − MIday0) (P=0.937), or ∆MIday21 (MIday21 − MIday0) (P=0.6623) between AZA responders and non-responders. This indicates that the genome-wide DNA methylation level for responders tended to normalize before the next AZA administration (on day 28), whereas that for non-responders did not.
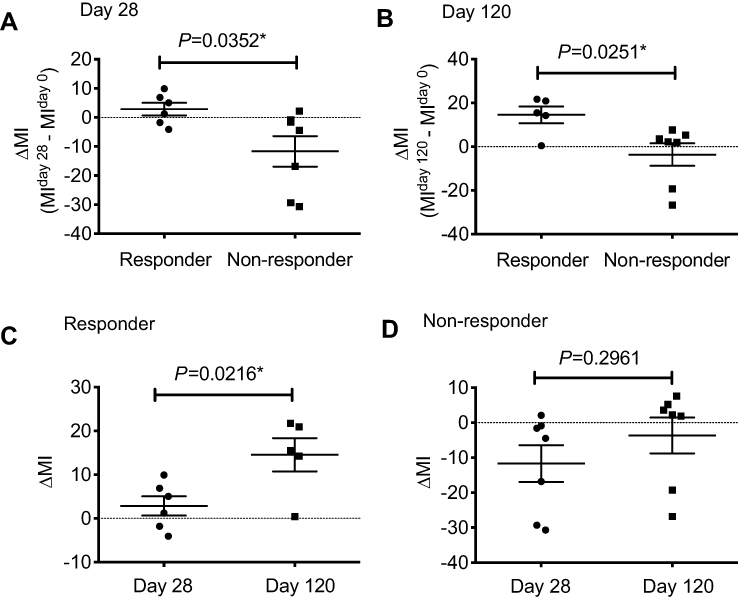 | Figure 2 The restoration rate of methylation for AZA-treated patients. (A). ∆MI at day 28 (MIday28 – MIday0) for AZA responders was significantly higher than that of non-responders (P=0.0352). (B). ∆MI at day 120 was significantly higher than that of non-responders (P=0.0251). (C). For AZA responders, ∆MI at day 120 was significantly higher than at day 28 (P=0.0216). (D). For AZA non-responders, there was no significant difference between ∆MI at day 28 and at day 120 (P=0.2961).Note: *Represents a significant difference.Abbreviation: MI, methylation index. |
Discussion
Genome-wide DNA hypomethylation and hypermethylation in the promoter region of tumor suppressor genes are hallmarks of cancer.20,21 Several attempts have been made to determine the association between clinical response and the effect of HMA. Although many gene-specific methylations have been found to be associated with leukemia progression22 or effectiveness of HMA treatment, including AZA, it is likely that the effect of AZA is not restricted to aberrantly hypermethylated regions of single genes.9,10 Shen et al proposed a methylation prognostic model for predicting response to therapy by analyzing the promoter region in 10 selected genes rather than in single genes.23 In contrast, Grövdal et al recently demonstrated that AZA induced genome-wide DNA hypomethylation in progenitor cells obtained from MDS patients. A clear decease in active chromatin was observed, suggesting that molecular mechanisms underlying AZA resistance are more complex than reactivation of the silenced genes.11 We previously showed marked genome-wide DNA demethylation together with constitutive activation of the ATM/BRCA1 pathway in AZA-resistant human leukemia cell lines.24 We also found aberrant histone modification in two AZA-resistant human leukemia cell lines.25 Therefore, we considered that the architecture of genomes, such as in genome-wide DNA demethylation, may play some role in the clinical efficacy of AZA in MDS patients.
To date, the analysis of DNA methylation has focused on the promoter region of genes, even when a comprehensive analysis was performed using the methylation array. Genome-wide DNA methylation can be measured by several methods, such as methylation-sensitive restriction enzymes, methyl-binding proteins, and anti-methylcytosine antibodies/26,27 However, these techniques are complex and, in some cases, have been modified using bisulfate conversion. In the current study, we used an SMMA with 500 ng genomic DNA, which is less time-consuming than the methods described above: the fluorescence correlation spectroscopy measurement can be performed in 1–2 mins per assay, without bisulfate modification.16 Our previous studies demonstrated that the MI (originally designated the SMMA index) measured by SMMA correlates with the global methylation status investigated by the DNA methylation array.16
The binding of MBD2 to methylated DNA occurs not only in the CpG islands and its “island shores” in the promoter area, but also in the gene body; therefore, it is likely that the MI mainly reflects genome-wide DNA methylation in the gene body. Theoretically, it would be logical to perform assays using isolated CD34-positive MDS cells. In practical terms, however, this is time-consuming and methodologically complex because the percentage of blasts varies widely among patients. We found that the MI for MDS patients was significantly lower than that of normal individuals, regardless of the percentage of blasts, but significantly higher for MDS patients with very poor cytogenetics according to IPSS-R. These results suggest that the MI involving peripheral blood may reflect epigenetic changes in MDS cells in some cases, because it depends on the cells from which the DNA originated.
Regarding promoter-associated CpG site analysis, it has been reported that the methylation dynamics of tumor suppressor genes do not predict clinical response in MDS patients treated with AZA and entinostat.28 Similar to previous reports,23,28 neither MI at diagnosis nor MI after AZA therapy could predict clinical efficacy in the present study. A reduction in MI was observed in the majority of patients at day 7 after AZA administration; therefore, we could not distinguish responders from non-responders at day 7. We next focused on the difference between the initial MI and that after cycle 1 of therapy (ie, ∆MIday28: MIday28 − MIday0). Eventually, we found that ∆MIday28 could represent a marker for normalization of genome-wide DNA methylation. It is notable that the normalization of MI was more evident after cycle 4 of therapy (∆MIday120).
Histone modification in accordance with genome-wide DNA methylation may have a key role in sustaining genome architecture, which regulates transcription.10,11,29 Therefore, a genome-wide DNA methylation assay could function as a robust technique for managing MDS patients receiving AZA treatment. In clinical practice, it would be more reliable to use the MI value in combination with the methylation prognostic model based on the promoter analysis of 10 selected genes and mutation analysis of methylation-associated genes,23 such as TET2.7 Because the number of MDS patients studied was too small to draw final conclusions for both primary and secondary AZA resistance, further studies using larger numbers of patients should be performed to clarify the efficacy of MI.
In conclusion, we established a genome-wide DNA methylation assay using whole blood to monitor the efficacy of AZA in MDS patients. Compared with healthy individuals, MDS patients had hypomethylated DNA, and AZA responders showed recovery of hypomethylated DNA during the next AZA administration. Therefore, it was possible to discriminate responders and primary AZA non-responders after the first cycle of therapy. Patients with secondary AZA failure showed a progressive decrease in MI, indicating that the MI recovery of peripheral blood after AZA could represent a non-invasive monitoring marker for AZA efficacy in MDS patients.
Acknowledgments
This research is supported by the Platform Project for Practical Research for Innovative Cancer Control from the Japan Agency for Medical Research and Development (AMED) (#15Ack0106073h0002) (K.O.), the Private University Strategic Research-Based Support Project (S1311016) (J.H.O., K.O.), and JSPS KAKENHI (grant no. 24501344 (J.H.O.) and 16K19186 (S.I.)). We thank Clare Cox, PhD, from Edanz Group (
Disclosure
Prof. Dr. Kazuma Ohyashiki reports personal fees from Celegene KK personal fees from Nippon Shinyaku Co., Ltd, during the conduct of the study; and personal fees from Novartis Pharma KK, personal fees from Janssen Pharmaceutical K.K, personal fees from Kirin Brewery KK, personal fees from Chugai KK, personal fees from Bristrol Myere Squib KK, and personal fees from Dainipon Sumitomo, outside the submitted work. The authors report no other conflicts of interest in this work.
References
1. Greenberg P, Cox C, LeBeau MM, et al. International scoring system for evaluating prognosis in myelodysplastic syndromes. Blood. 1997;89(6):2079–2088.
2. Stauder R. The challenge of individualised risk assessment and therapy planning in elderly high-risk myelodysplastic syndromes (MDS) patients. Ann Hematol. 2012;91(9):1333–1343. doi:10.1007/s00277-012-1472-8
3. Malcovati L, Hellstrom-Lindberg E, Bowen D, et al. Diagnosis and treatment of primary myelodysplastic syndromes in adults: recommendations from the European LeukemiaNet. Blood. 2013;122(17):2943–2964. doi:10.1182/blood-2013-03-492884
4. Silverman LR, Demakos EP, Peterson BL, et al. Randomized controlled trial of azacitidine in patients with the myelodysplastic syndrome: a study of the cancer and leukemia group B. J Clin Oncol. 2002;20(10):2429–2440. doi:10.1200/JCO.2002.04.117
5. Fenaux P, Mufti GJ, Hellstrom-Lindberg E, et al. Efficacy of azacitidine compared with that of conventional care regimens in the treatment of higher-risk myelodysplastic syndromes: a randomised, open-label, phase III study. Lancet Oncol. 2009;10(3):223–232. doi:10.1016/S1470-2045(09)70003-8
6. Silverman LR, Fenaux P, Mufti GJ, et al. Continued azacitidine therapy beyond time of first response improves quality of response in patients with higher-risk myelodysplastic syndromes. Cancer. 2011;117(12):2697–2702. doi:10.1002/cncr.25774
7. Itzykson R, Kosmider O, Cluzeau T, et al. Impact of TET2 mutations on response rate to azacitidine in myelodysplastic syndromes and low blast count acute myeloid leukemias. Leukemia. 2011;25(7):1147–1152. doi:10.1038/leu.2011.71
8. Bejar R, Lord A, Stevenson K, et al. TET2 mutations predict response to hypomethylating agents in myelodysplastic syndrome patients. Blood. 2014;124(17):2705–2712. doi:10.1182/blood-2014-06-582809
9. Follo MY, Finelli C, Mongiorgi S, et al. Reduction of phosphoinositide-phospholipase C beta1 methylation predicts the responsiveness to azacitidine in high-risk MDS. Proc Natl Acad Sci U S A. 2009;106(39):16811–16816. doi:10.1073/pnas.0907109106
10. Fandy TE, Herman JG, Kerns P, et al. Early epigenetic changes and DNA damage do not predict clinical response in an overlapping schedule of 5-azacytidine and entinostat in patients with myeloid malignancies. Blood. 2009;114(13):2764–2773. doi:10.1182/blood-2009-02-203547
11. Grovdal M, Karimi M, Tobiasson M, et al. Azacitidine induces profound genome-wide hypomethylation in primary myelodysplastic bone marrow cultures but may also reduce histone acetylation. Leukemia. 2014;28(2):411–413. doi:10.1038/leu.2013.265
12. Nannya Y, Takeda J, Sato S, et al. Molecular signatures that predict response to azacitidine treatment for myelodysplastic syndromes. Blood. 2017;130:4182.
13. Papaemmanuil E, Gerstung M, Malcovati L, et al. Clinical and biological implications of driver mutations in myelodysplastic syndromes. Blood. 2013;122(22):3616–3627, quiz 3699. doi:10.1182/blood-2013-08-518886
14. Traina F, Visconte V, Elson P, et al. Impact of molecular mutations on treatment response to DNMT inhibitors in myelodysplasia and related neoplasms. Leukemia. 2014;28(1):78–87. doi:10.1038/leu.2013.269
15. Cedena MT, Rapado I, Santos-Lozano A, et al. Mutations in the DNA methylation pathway and number of driver mutations predict response to azacitidine in myelodysplastic syndromes. Oncotarget. 2017;8(63):106948–106961. doi:10.18632/oncotarget.22157
16. Umezu T, Ohyashiki K, Ohyashiki JH. Detection method for quantifying global DNA methylation by fluorescence correlation spectroscopy. Anal Biochem. 2011;415(2):145–150. doi:10.1016/j.ab.2011.04.035
17. Cheson BD, Greenberg PL, Bennett JM, et al. Clinical application and proposal for modification of the International Working Group (IWG) response criteria in myelodysplasia. Blood. 2006;108(2):419–425. doi:10.1182/blood-2005-10-4149
18. Itoh Y, Kuratsuji T, Aizawa S, Sai M, Ohyashiki K, Toyama K. Superoxide anion production and expression of cytochrome b 558 by neutrophils are impaired in some patients with myelodysplastic syndrome. Ann Hematol. 1991;63(5):270–275.
19. Azuma K, Umezu T, Imanishi S, et al. Genetic variations of bone marrow mesenchymal stromal cells derived from acute leukemia and myelodysplastic syndrome by targeted deep sequencing. Leuk Res. 2017;62:23–28. doi:10.1016/j.leukres.2017.09.008
20. Feinberg AP, Vogelstein B. Hypomethylation distinguishes genes of some human cancers from their normal counterparts. Nature. 1983;301(5895):89–92.
21. Esteller M. CpG island hypermethylation and tumor suppressor genes: a booming present, a brighter future. Oncogene. 2002;21(35):5427–5440. doi:10.1038/sj.onc.1205600
22. Jiang Y, Dunbar A, Gondek LP, et al. Aberrant DNA methylation is a dominant mechanism in MDS progression to AML. Blood. 2009;113(6):1315–1325. doi:10.1182/blood-2008-06-163246
23. Shen L, Kantarjian H, Guo Y, et al. DNA methylation predicts survival and response to therapy in patients with myelodysplastic syndromes. J Clin Oncol. 2010;28(4):605–613. doi:10.1200/JCO.2009.23.4781
24. Imanishi S, Umezu T, Ohtsuki K, Kobayashi C, Ohyashiki K, Ohyashiki JH. Constitutive activation of the ATM/BRCA1 pathway prevents DNA damage-induced apoptosis in 5-azacytidine-resistant cell lines. Biochem Pharmacol. 2014;89(3):361–369. doi:10.1016/j.bcp.2014.03.008
25. Imanishi S, Umezu T, Kobayashi C, Ohta T, Ohyashiki K, Ohyashiki JH. Chromatin regulation by HP1γ contributes to survival of 5-azacytidine-resistant cells. Front Pharmacol. 2018;9. doi:10.3389/fphar.2018.01166
26. Karimi M, Johansson S, Ekstrom TJ. Using LUMA: a Luminometric-based assay for global DNA-methylation. Epigenetics. 2006;1(1):45–48.
27. Rauch TA, Pfeifer GP. The MIRA method for DNA methylation analysis. Methods Mol Biol. 2009;507:65–75. doi:10.1007/978-1-59745-522-0_6
28. Prebet T, Sun Z, Figueroa ME, et al. Prolonged administration of azacitidine with or without entinostat for myelodysplastic syndrome and acute myeloid leukemia with myelodysplasia-related changes: results of the US Leukemia Intergroup trial E1905. J Clin Oncol. 2014;32(12):1242–1248. doi:10.1200/JCO.2013.50.3102
29. Komashko VM, Farnham PJ. 5-azacytidine treatment reorganizes genomic histone modification patterns. Epigenetics. 2010;5(3):229–240.
Supplementary material
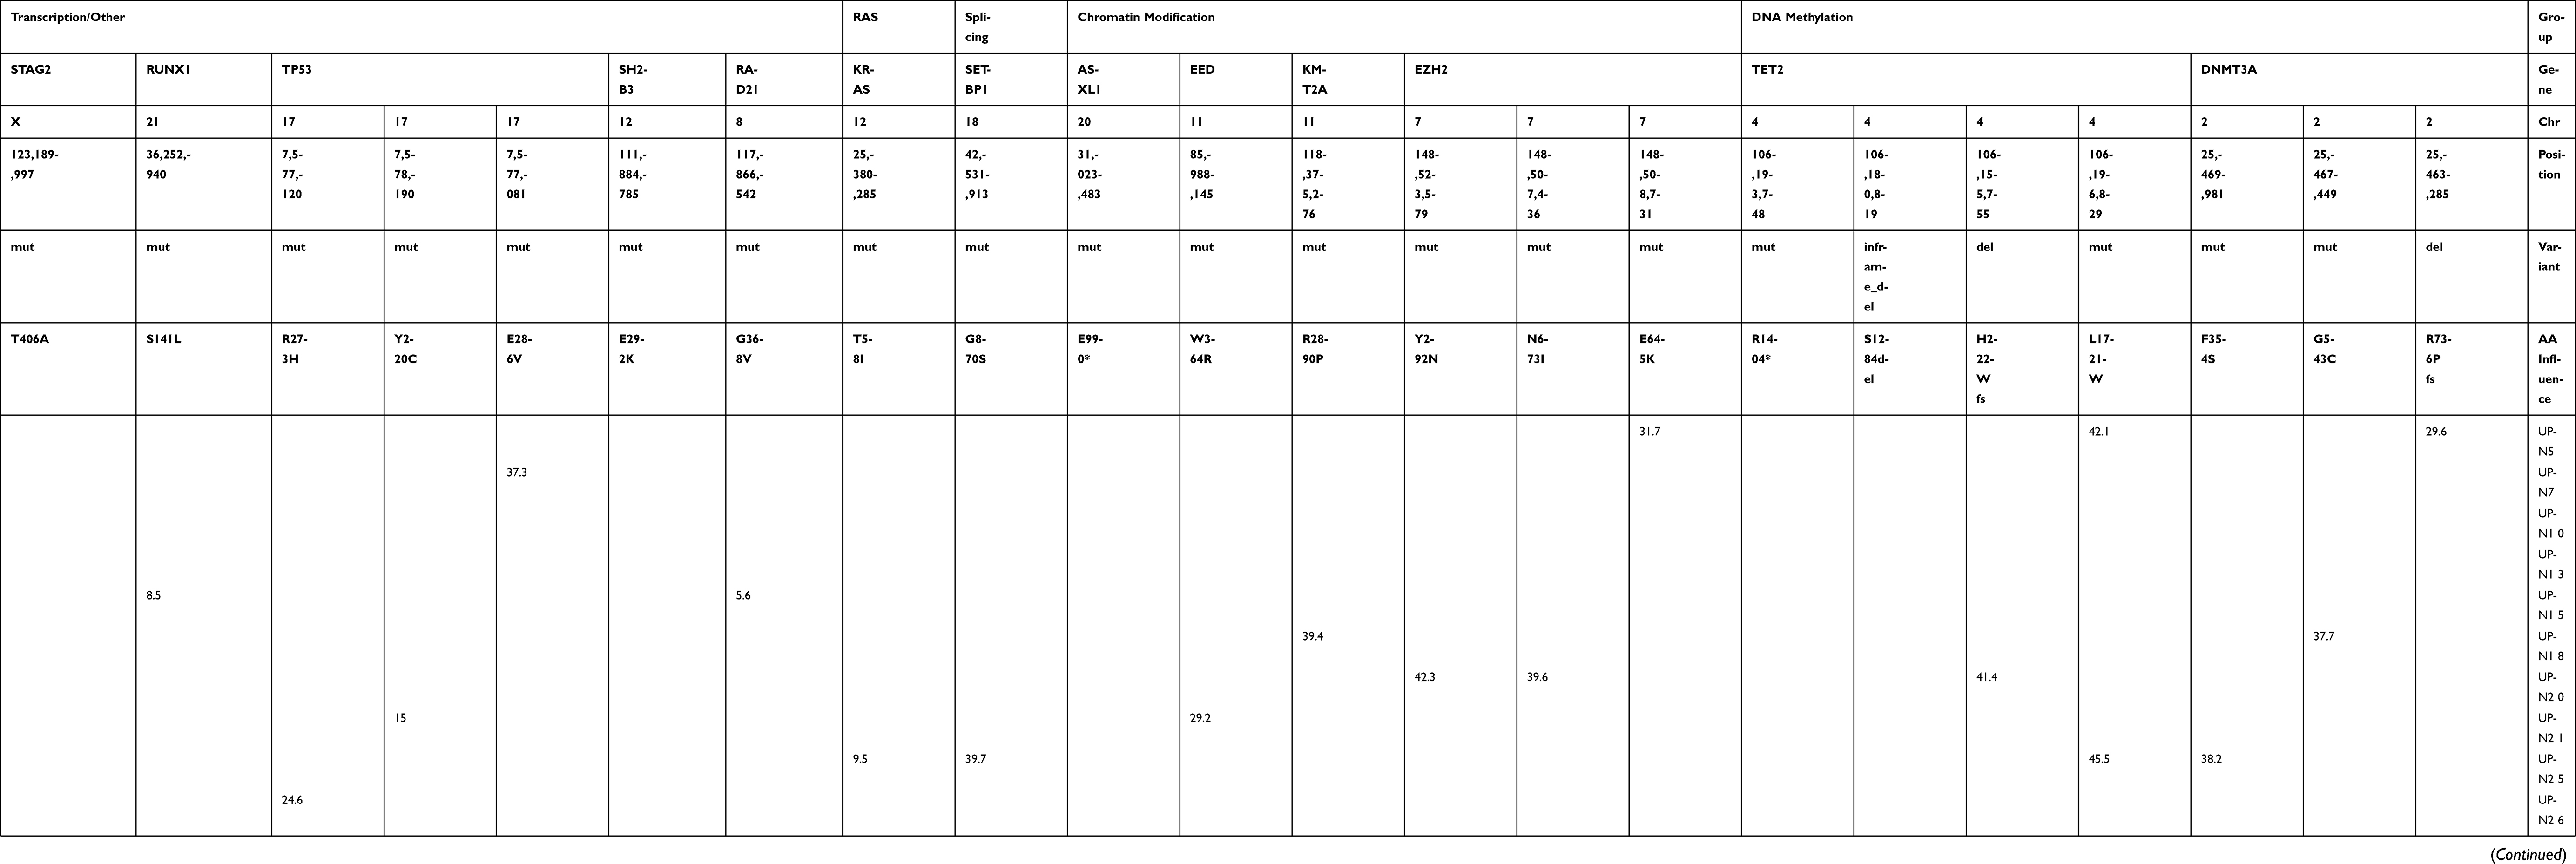 | Table S1 Mutation analysis using the GeneRead DNAseq Targeted Panel V2 (Human Myeloid Neoplasms Panel; Qiagen) |
 © 2019 The Author(s). This work is published and licensed by Dove Medical Press Limited. The full terms of this license are available at https://www.dovepress.com/terms.php and incorporate the Creative Commons Attribution - Non Commercial (unported, v3.0) License.
By accessing the work you hereby accept the Terms. Non-commercial uses of the work are permitted without any further permission from Dove Medical Press Limited, provided the work is properly attributed. For permission for commercial use of this work, please see paragraphs 4.2 and 5 of our Terms.
© 2019 The Author(s). This work is published and licensed by Dove Medical Press Limited. The full terms of this license are available at https://www.dovepress.com/terms.php and incorporate the Creative Commons Attribution - Non Commercial (unported, v3.0) License.
By accessing the work you hereby accept the Terms. Non-commercial uses of the work are permitted without any further permission from Dove Medical Press Limited, provided the work is properly attributed. For permission for commercial use of this work, please see paragraphs 4.2 and 5 of our Terms.